BERTHA: Video Captioning Evaluation Via Transfer-Learned Human Assessment
Abstract
Evaluating video captioning systems is a challenging task with multiple challenges to consider. Firstly, the fluency of the caption, multiple actions taking place within a single scene, and estimation of what a human user might consider important in a video. Most metrics aim to measure how similar the system generated captions are to a single or a set of human-generated captions. This paper presents a new method based on a deep learning model to evaluate systems. The model is based on BERT language model, shown to work well across a range of NLP tasks. The aim is for the model to learn to perform an evaluation similar to that of a human. To do so, we use a dataset that contains human evaluation of system-generated captions. The dataset consists of human judgments of the quality of captions produced by the system participating in past TRECVid video to text tasks [Smeaton et al., 2006]. These annotations will be made publicly available.11footnotemark: 1The new video captioning evaluation metric, BERTHA, obtains favourable results, outperforming commonly applied metrics in some setups.
Keywords: Video captioning, NLP, deep learning, learned metric
languageresourceLanguage Resources
BERTHA: Video Captioning Evaluation Via Transfer-Learned Human Assessment
| Luis Lebron1, Yvette Graham2, Kevin McGuinness1, Konstantinos Kouramas3, |
| Noel E. O’Connor1 |
| 1Insight SFI Research Centre for Data Analytics, Dublin City University (DCU) |
| 2School of Computer Science and Statistics, Trinity College Dublin |
| 3Collins Aerospace |
| luis.lebroncasas@insight-centre.org |
Abstract content
1. Introduction
Automatic video captioning is a challenging multimodal task requiring the successful combination of computer vision and natural language generation. Systems aim to generate fluent natural language for videos of various duration, ranging from generation of individual sentences that describe short videos [Awad et al., 2020a] to several sentences for longer videos [Tang et al., 2019, Caba Heilbron et al., 2015].
This task has many challenges, with evaluation of the task itself being one of the most problematic. Video captioning differs from other tasks by looking for accurate descriptions of specific objects and also requires accurate description of the context. A significant challenge in evaluating video captioning systems lies in the fact that there legitimately exists multiple and often very many distinct ways to describe what took place in a single video.
The usual automatic metrics used for video captioning are borrowed from other tasks like machine translation or image captioning. Metrics like BLEU [Papineni et al., 2002], METEOR [Banerjee and Lavie, 2005], or CIDEr [Vedantam et al., 2015] are normally based on computing the overlap between the caption and the reference sentence. However, they fail to include the context of the scene. New metrics like SPICE [Anderson et al., 2016] try to address this problem using a graph to represent the semantic content.
Evaluating the accuracy of a given metric is ordinarily carried out by computing the correlation of its scores for systems with human assessment of the quality of system-generated captions. In this paper, we present a new automatic metric that directly learns from human evaluation to maximize the correlation with human judgement. Our new method of evaluating video captioning systems makes use of pre-trained language models, BERT [Devlin et al., 2018], to learn this correlation.
By fine-tuning a pre-trained language model, it is possible to obtain excellent results in a huge variety of tasks [Devlin et al., 2018], which overall is less computationally demanding than training a model from scratch. BERT has been shown to work well for tasks similar to video captioning such as MT evaluation [Sellam et al., 2020], and thus we adopt this model in our work.
We test the performance of our metric on data from past TRECVid [Smeaton et al., 2006] video to text challenge tasks. TRECVid is a well-known challenge where one of the tasks, the video to text task (VTT), is to produce sentences for short clips. The data used contains human judgments for the captions created by the participants’ systems. As human judgment is sometimes unreliable, we collect additional multiple human assessments per caption to reduce the uncertainty contained within the training and test data.
The contributions presented in this paper are as follows:
-
•
A new video captioning metric trained in human judgments that employs a pre-trained language model to aide the training phase.
-
•
An evaluation of the performance of the metric and how it compares with other commonly used metrics in a challenging dataset. The new metric is consistently in the top-performing metrics.
-
•
A study of the behavior of the metric under different scenarios and a test of the limits of the metric to further understand its performance.
The remainder of the paper is structured as follows: we begin with a brief description of related work in Section 2. Next in Section 3, the model is described. Section 4 contains the evaluation of the proposed metric in TRECvid VTT is analysed. The results show good performance compared with commonly used metrics. The paper finishes in Section 6 with some conclusions.
2. Related Work
2.1. Video Captioning Metrics
Different automatic evaluation techniques use various aspects to measure the generated captions, and usually people employ multiple metrics as they can complement each other. In most evaluations, the main points to consider are fluency of the generated caption, accuracy in describing the content of the video, and similarity to the human references, with the latter being the basis of most common metrics.
One of the first metrics to be employed for video captioning was subject verb object (SVO) accuracy. However, this metric is no longer typical in evaluation of video captioning systems as it is limited to measuring accuracy based on small set of words. BLEU [Papineni et al., 2002], which was initially developed for machine translation, is a metric based on computing the geometric mean of -gram match counts.ROUGE [Lin, 2004] is similar to BLEU, which also uses -grams. The difference is that ROUGE considers the -gram occurrences in the total sum of the number of reference sentences while BLEU considers the matches in the sum of candidates.
In some cases, we not only have a single reference per video but a set of them. A metric like METEOR [Banerjee and Lavie, 2005] performs better in these situations. It compares exact token matches, stemmed tokens, paraphrase matches, and semantically similar matches using WordNet synonyms.
Another aspect to consider is differences across references. Metrics like CIDEr [Vedantam et al., 2015] try to take this into account by measuring the consensus between the set of reference sentences. Another approach is SPICE [Anderson et al., 2016], which is a metric that uses a scene graph to describe the semantics allowing it to identify similar sentences in a more generic way.
2.2. Human Judgment
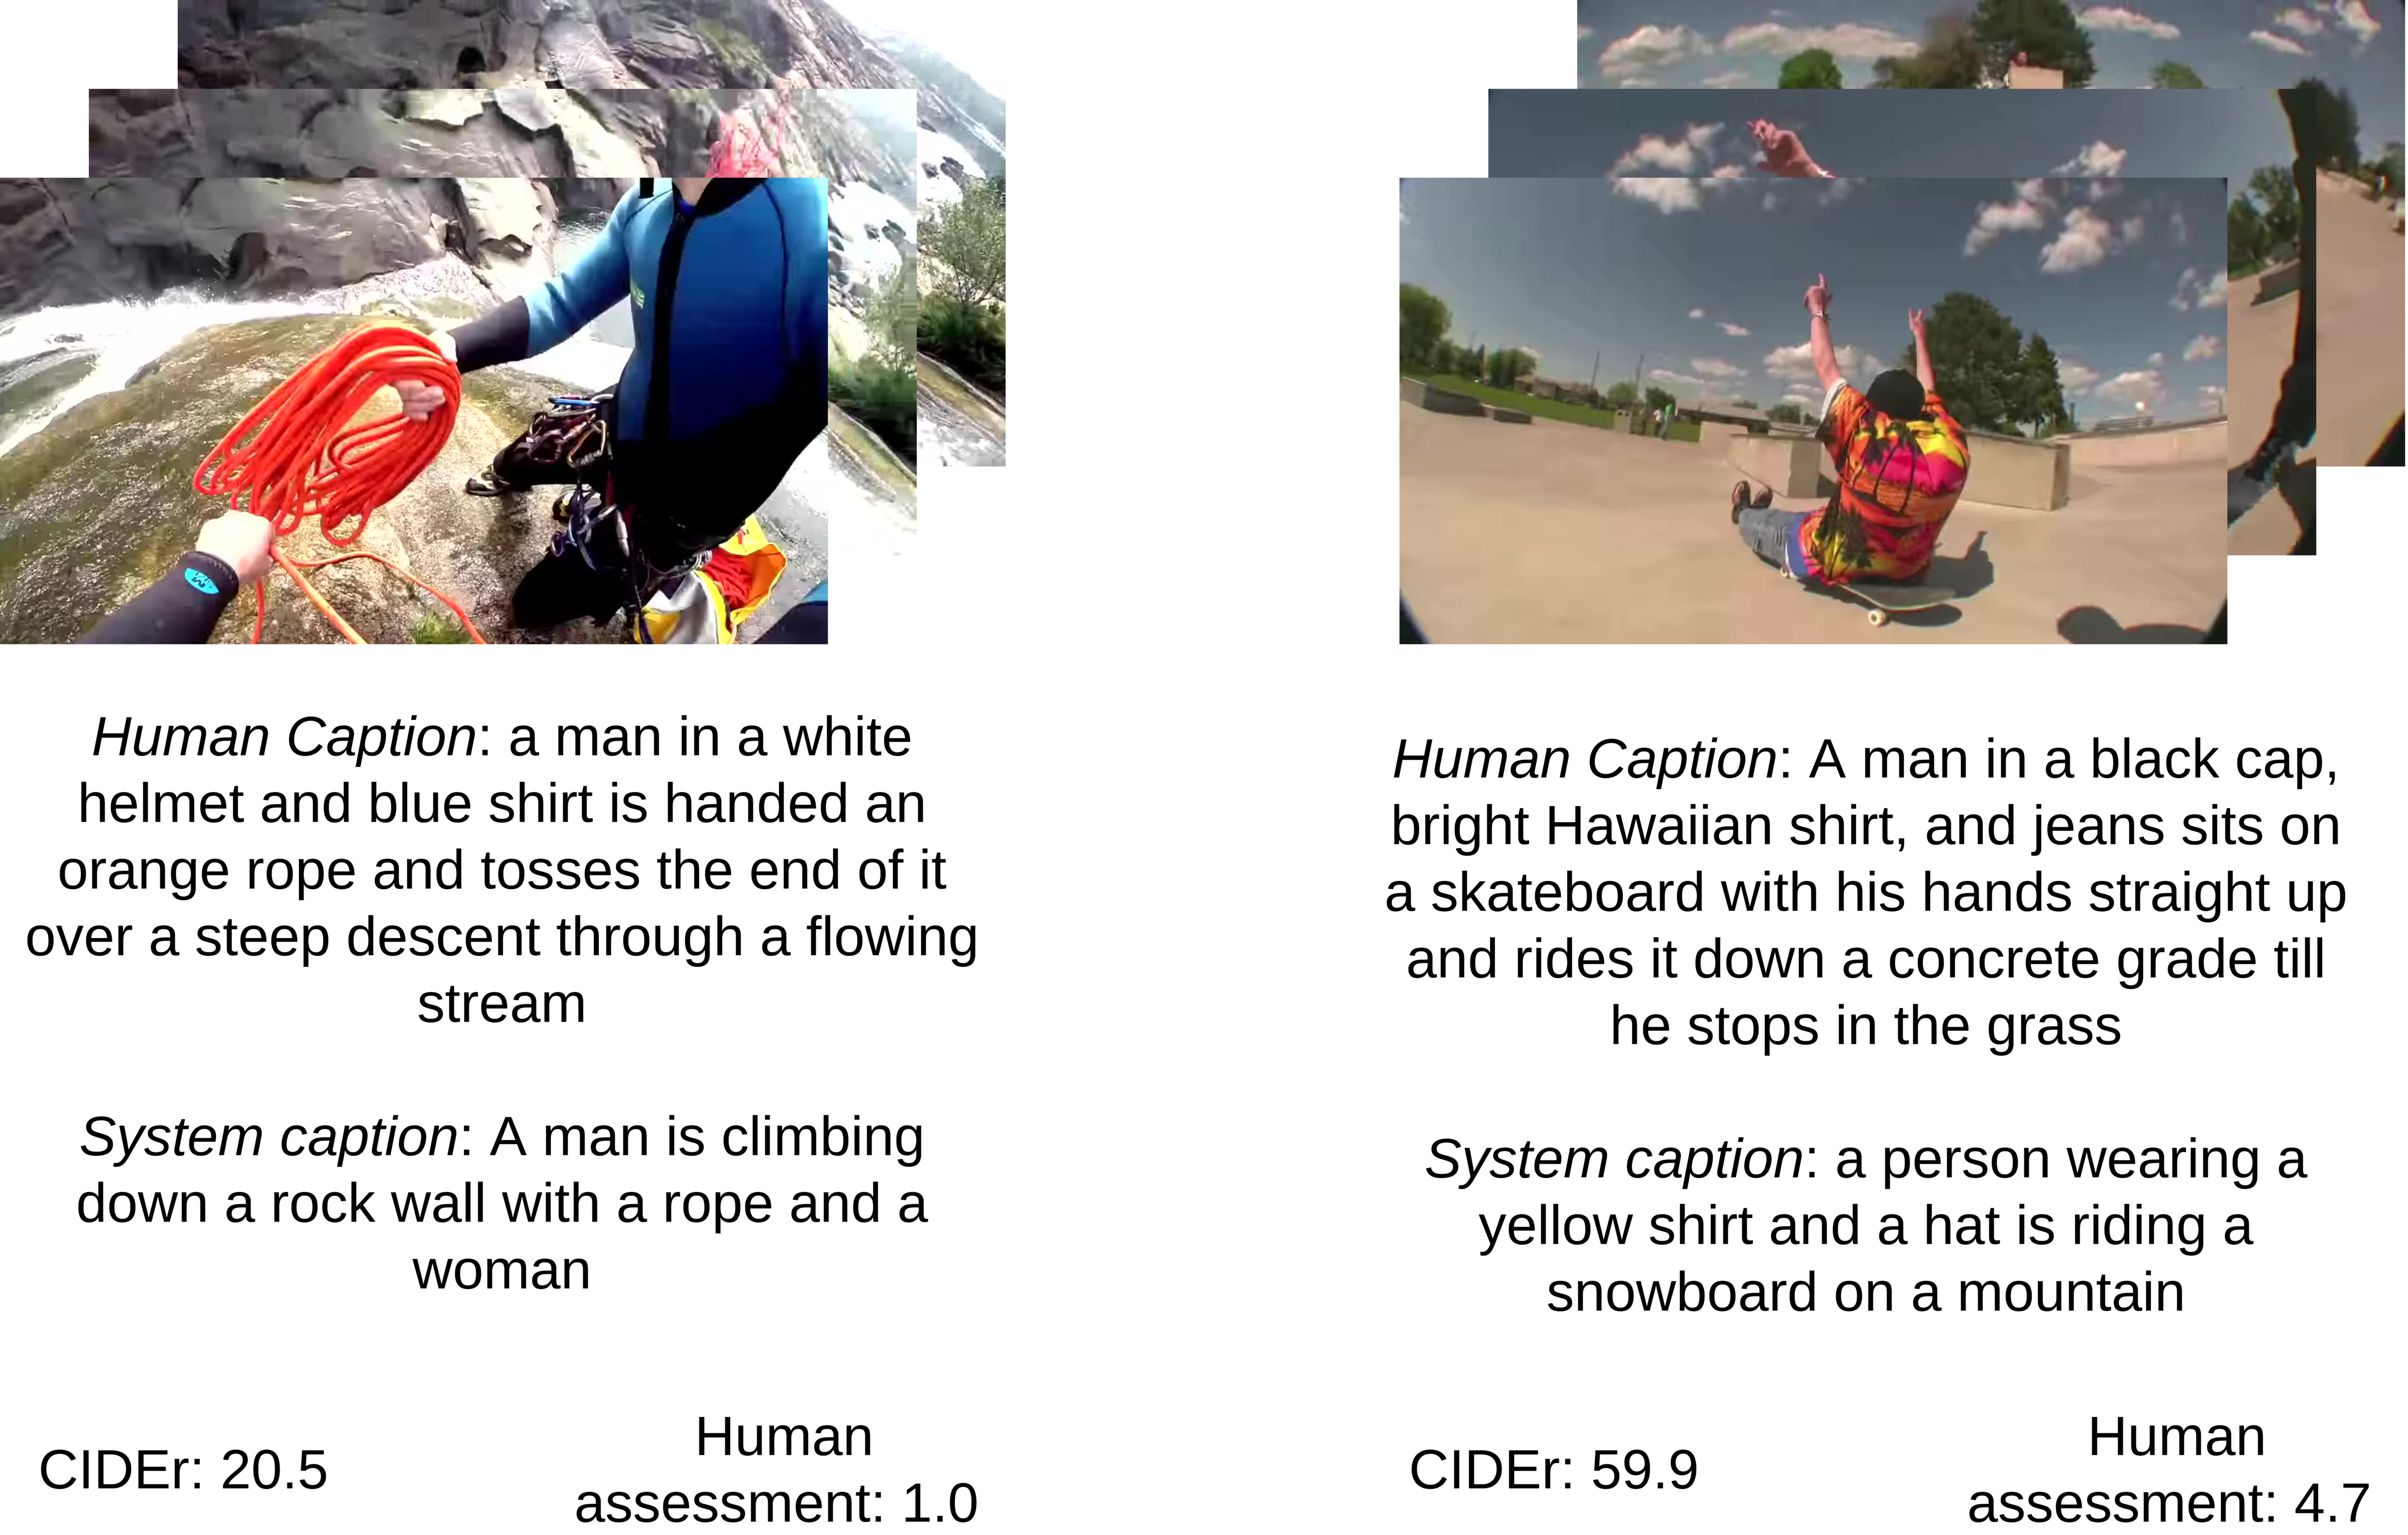
Scores produced by such metrics aim to evaluate the similarity between a system-generated caption and a human reference caption. However, they cannot detect if they are describing the same scene. For instance, in a clip, there can be multiple details that are not important for the human annotator, like the colour of an animal, but the model can decide to include it in the final caption. An example of this problems can be seen in Figure 1. Most metrics additionally have problems in terms of robustness, systems being penalized for legitimate differences in word order, using word replacement or change in the given score when using a shorter version of the original sentence. As this becomes difficult to compare automatically, a human judgment is normally involved to compare the metrics. This requires direct human evaluation of the caption quality or human-generated captions to use as a reference. Then metrics can be compared based on how well they correlate to this human judgment.
There have been some studies on training models in the machine translation domain to imitate human evaluations of the sentences with actual human scores annotators. In this use case, most methods aim to solve this problem with handcrafted features and classical machine learning methods. However, more recently, participants of the WMT Metrics Shared task [Mathur et al., 2020] have begun to include deep learning, specifically BERT as a base architecture [Sellam et al., 2020, Shimanaka et al., 2019] and have obtained good results.
Similar to the machine translation domain, some studies are looking for a way to learn a metric from human judgments. Datasets like Microsoft COCO [Chen et al., 2015], or PASCAL [Vedantam et al., 2015], have some captions annotated and judged by humans. In the case of COCO, the captions are evaluated with these criteria: percentage of captions that are better or equal to humans; percentage of captions that pass the Turing Test; average correctness of the captions; the average amount of details; and percentage of captions that are similar to human references. Most of the other datasets only use a scoring from 1 to 5,or similar, to evaluate how similar a caption is to a human reference or how well it describes the clip. Even the more complex evaluation done in COCO falls short of establishing a satisfactory ranking between all the captions as the number of evaluation and systems are very limited. The study of trained metrics [Yi et al., 2020, Cui et al., 2018] in these datasets has demonstrated that they correlate better with human judgment than the typical image captioning metrics.
2.3. Language Models and Transfer Learning
Language models are commonly employed in a wide range of NLP tasks and hugely influence text fluency produced by automated systems. They are models which predict the probability that a sequence of words can occur in a sentence. Most architectures involve training on huge unlabelled corpora such as Wikipedia and news articles, literary text, and language-based web data [Brown et al., 2020]. This type of large architecture aims to decouple the model from the task so that the same model can be applied to distinct tasks.
One example of this model is BERT [Devlin et al., 2018], which is a bidirectional language model based on Transformers [Vaswani et al., 2017]. BERT has become very popular thanks to performing well in a diverse set of tasks like semantic textual similarity or sentiment analysis. This is achieved using a technique call transfer learning. These techniques consist of using an already trained model to solve another task by reusing the knowledge already learned in the new task. In BERT, the base model is trained on unlabeled textual data using two techniques: masked language modelling and next sentence prediction. Then this pre-trained model can be fine-tuned on multiple tasks. This approach has been demonstrated to work well in multiple similar tasks like machine translation evaluation [Sellam et al., 2020, Shimanaka et al., 2019] or image captioning evaluation [Cui et al., 2018]. We follow the same paradigm and use BERT as the base model for our experiments.
3. Evaluation of Video Captioning via Transfer Learning
When automating the evaluation of tasks aimed at human users, such as video captioning, a common approach is to compare system outputs with one or more human-generated reference(s). In the proposed model, we only use a single pair of caption and human references each time. This simple scenario is helpful as it can work with multiple human-generated references or with a limited number of them.
Given a system output caption and a human-generated reference, our proposed evaluation model aims to learn the distance in meaning between the two strings of text. To train the model, we use captions output by systems participating in past benchmark shared tasks and carry out the human evaluation of the quality of the captions using Direct Assessment [Graham et al., 2015, Graham et al., 2020]. The details of the data collection process are explained in the next section.
We define as the set of videos. Notice that we can have different reference captions for a single video. We employ captioning systems to produce captions for videos and carry out human evaluation of video captioning systems where and . Note that not all the videos in the source dataset are annotated. The goal of training the model is to maximize the correlation, , between predicted scores () and the given human qualitative scores :
| (1) |
where is the Pearson product-moment correlation coefficient. Even if we used all the data available for the task, it is a relatively small dataset. We therefore use a pre-trained language model and fine-tune it for the task. The core functionality of BERT is a set of transform blocks [Vaswani et al., 2017], which can have two sentences as input, and output two sets of symbols corresponding to these input sentences.
BERTHA use the BERT-base as it is the smaller model of the two presented in the original paper. It consists of 12 layers, 768 hidden states, and 12 heads. The BERT-base is trained with the configuration described in [Devlin et al., 2018]. The base model is pre-trained using two unsupervised tasks: masked language modelling, and subsequent sequence prediction. The dataset used is BooksCorpus [Zhu et al., 2015] and English Wikipedia. Using this model as a baseline, we fine-tune it to our task using a regression loss (mean-squared error). BERTHA is then fine-tuned end-to-end following the same principals as in the BERT paper.
The two input sentences (system and human-generated captions) and are tokenized using WordPieces [Wu et al., 2016]. From the model’s output, only the first symbol is used and the rest are discarded. A multilayer preceptor with a single output is attached to the symbol, the first output of BERT, to obtain the final score. is defined as where is the hidden side of the transformer blocks [Vaswani et al., 2017]. We add a layer on top, with and as weights and bias, to compute the final score :
| (2) |
which relates to the caption-reference pair for a single video , a specific reference and a system .
4. Evaluation Methodology
4.1. Dataset
We use datasets from the past TRECVid [Awad et al., 2020a] benchmark video to text task (VTT) from 2016 [Smeaton et al., 2006], 2017 [Awad et al., 2017], 2018 [Awad et al., 2018], 2019 [Awad et al., 2020b] and 2020 [Awad et al., 2021]. Approximately 2,000 videos are available each year from Vine and later also from Flickr and V3C2. The video covers multiple topics and multiple camera angles. The videos are short clips about 6 seconds long; some videos can be up to 10 seconds long in the last year. Each of these videos has been annotated with a caption by between two and five human captioners. The original tasks was divided in two subtasks. The first one, to generate a caption for each video and the second one to find and match human-generated captions with the correct video. We use the data to train and evaluate the model taken from captions produced by systems that submitted results for the first task.
| VTT-16 | VTT-17 | VTT-18 | VTT-19 | VTT-20 | Mean | |
|---|---|---|---|---|---|---|
| BERTHA-SA | 0.274 | 0.801 | 0.948 | 0.929 | 0.963 | 0.910 |
| BERTHA-MA | 0.720 | 0.706 | 0.878 | 0.837 | 0.863 | 0.821 |
| BLEU-4 | 0.771 | 0.782 | 0.874 | 0.581 | 0.944 | 0.795 |
| Cider | 0.811 | 0.818 | 0.961 | 0.810 | 0.977 | 0.891 |
| METEOR | 0.628 | 0.907 | 0.989 | 0.887 | 0.958 | 0.935 |
| Rouge | 0.295 | 0.555 | 0.926 | 0.588 | 0.919 | 0.749 |
| SPICE | -0.278 | 0.103 | -0.447 | 0.498 | -0.110 | -0.033 |
4.2. Human Assessment
The annotations from the human assessment were collected using Amazon Mechanical Turk111http://www.mturk.com. The general idea of this process is that a set of humans will look at a system-generated caption and give a score between 0 to 100 on how similar is it to the original video. They also need to evaluate how fluent the caption is in English. Combining these two measures is the reference score that we use to train and test our system. To detect consistency in the same annotators, degraded and repeated sentences are used. This paper divides the annotations into two sets: single annotator (SA) and multiple annotators (MA).
The SA set is collected as in [Graham et al., 2018] where only a single human annotates each pair of captions. The worker would see the video and then compare the sentence with what was seen. To validate that the annotators are reliable, a process was used where captions coming from both automatic systems and human annotators were used together. Some of the human captions are also degraded with random parts of other human captions. Thus, an inaccurate worker could be identified as they will overlook the captions produced by humans and not give them a high score. Equally, they will also skip the degraded captions and assign a poor score. The final score consists of a -score computed as the standard deviation from the mean data point regarding its standard deviation and mean score. The filtering of the annotators is done before computing the -score.
We detect some inconsistencies with the SA so we produce a new set, MA, which is similarly collected. However, instead of using a single annotator per system-references, a minimum of 15 annotations were used. The 15 annotations proved to be sufficient to obtain stability in the scoring at the segment-level as in [Graham et al., 2015]. The final score is the standardisation of these annotations.
In terms of size, the SA dataset has 56,088 human annotations that are not equal distributed across years, and MA dataset has 7,705 annotations equally distributed across each year, and MA data is more costly than collecting SA data. SA has a mean of 15 tokens per human reference caption, and nine tokens of the system generate captions in terms of length. MA has a mean of 14 tokens per human reference and eight tokens per system-generated captions.
| VTT-16 | VTT-17 | VTT-18 | VTT-19 | VTT-20 | Mean | |
|---|---|---|---|---|---|---|
| BERTHA-SA | 0.857 | 0.744 | 0.936 | 0.859 | 0.888 | 0.856 |
| BERTHA-MA | 0.743 | 0.715 | 0.884 | 0.882 | 0.863 | 0.836 |
| BLEU-4 | 0.119 | 0.607 | 0.221 | 0.753 | 0.967 | 0.637 |
| CIDEr | -0.001 | 0.848 | 0.934 | 0.892 | 0.967 | 0.910 |
| METEOR | -0.449 | 0.792 | 0.942 | 0.880 | 0.988 | 0.900 |
| Rouge | -0.650 | 0.656 | 0.949 | 0.811 | 0.914 | 0.642 |
| SPICE | -0.356 | -0.135 | 0.079 | -0.240 | 0.146 | -0.037 |
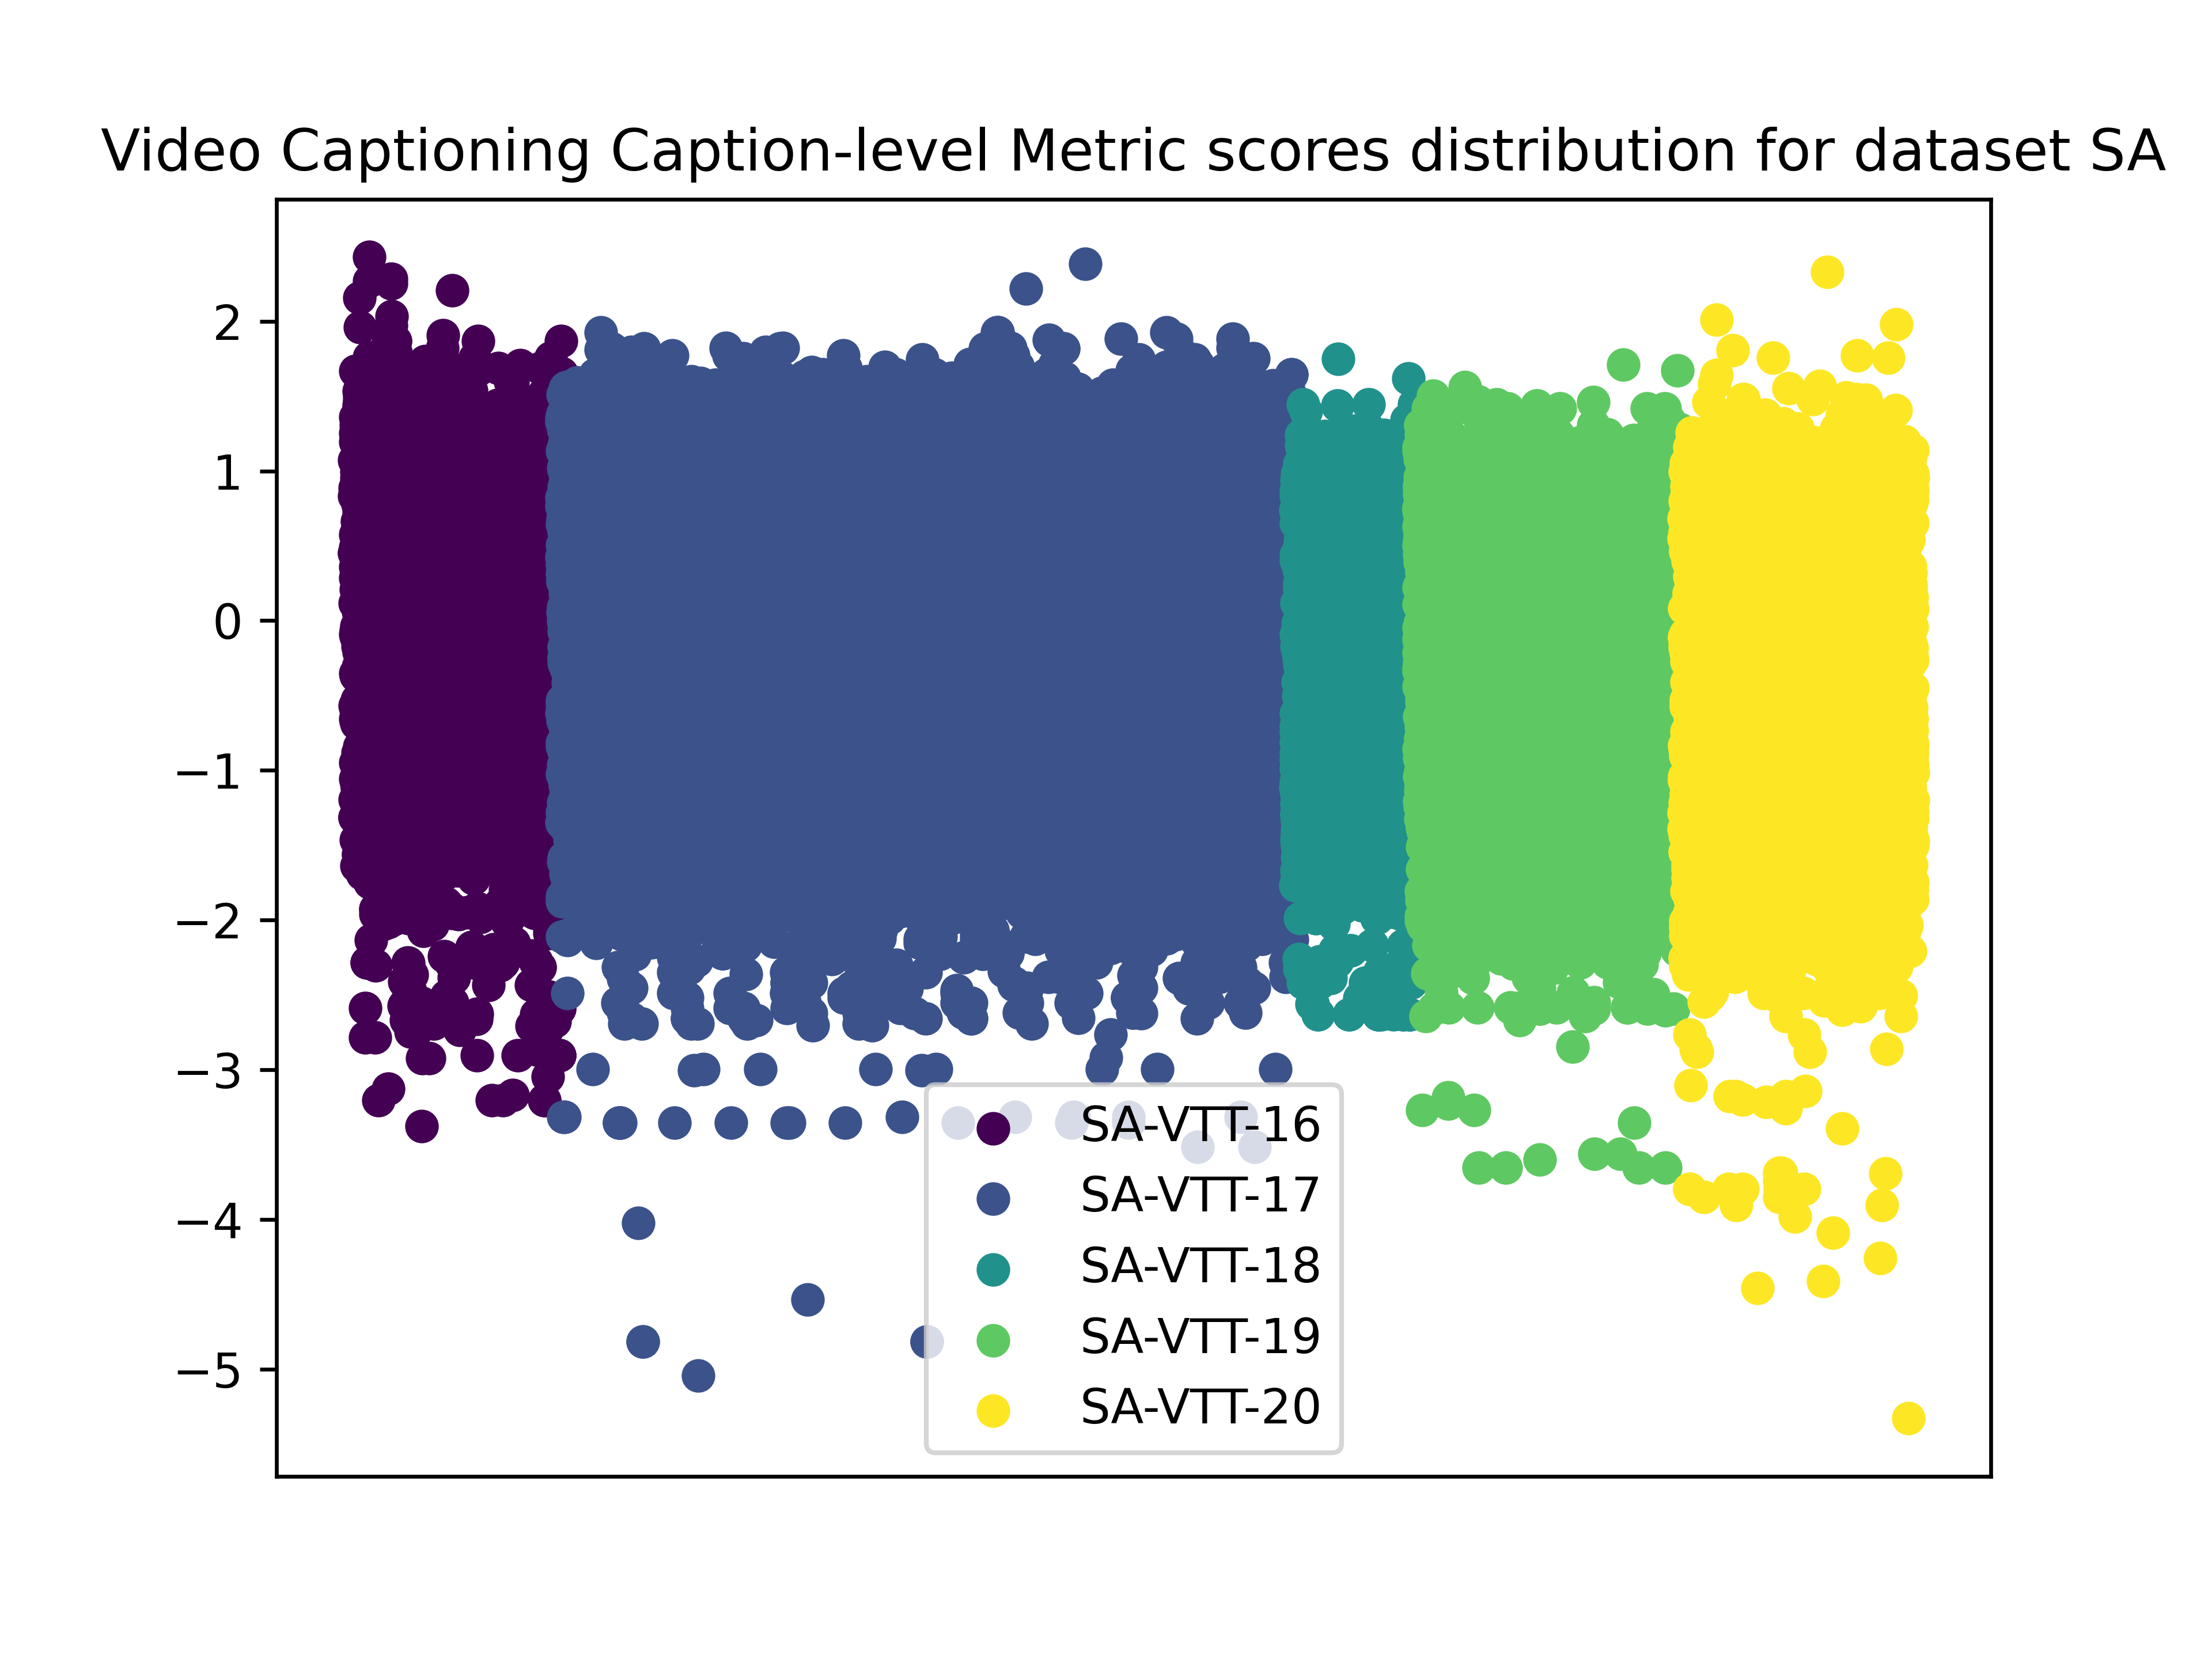
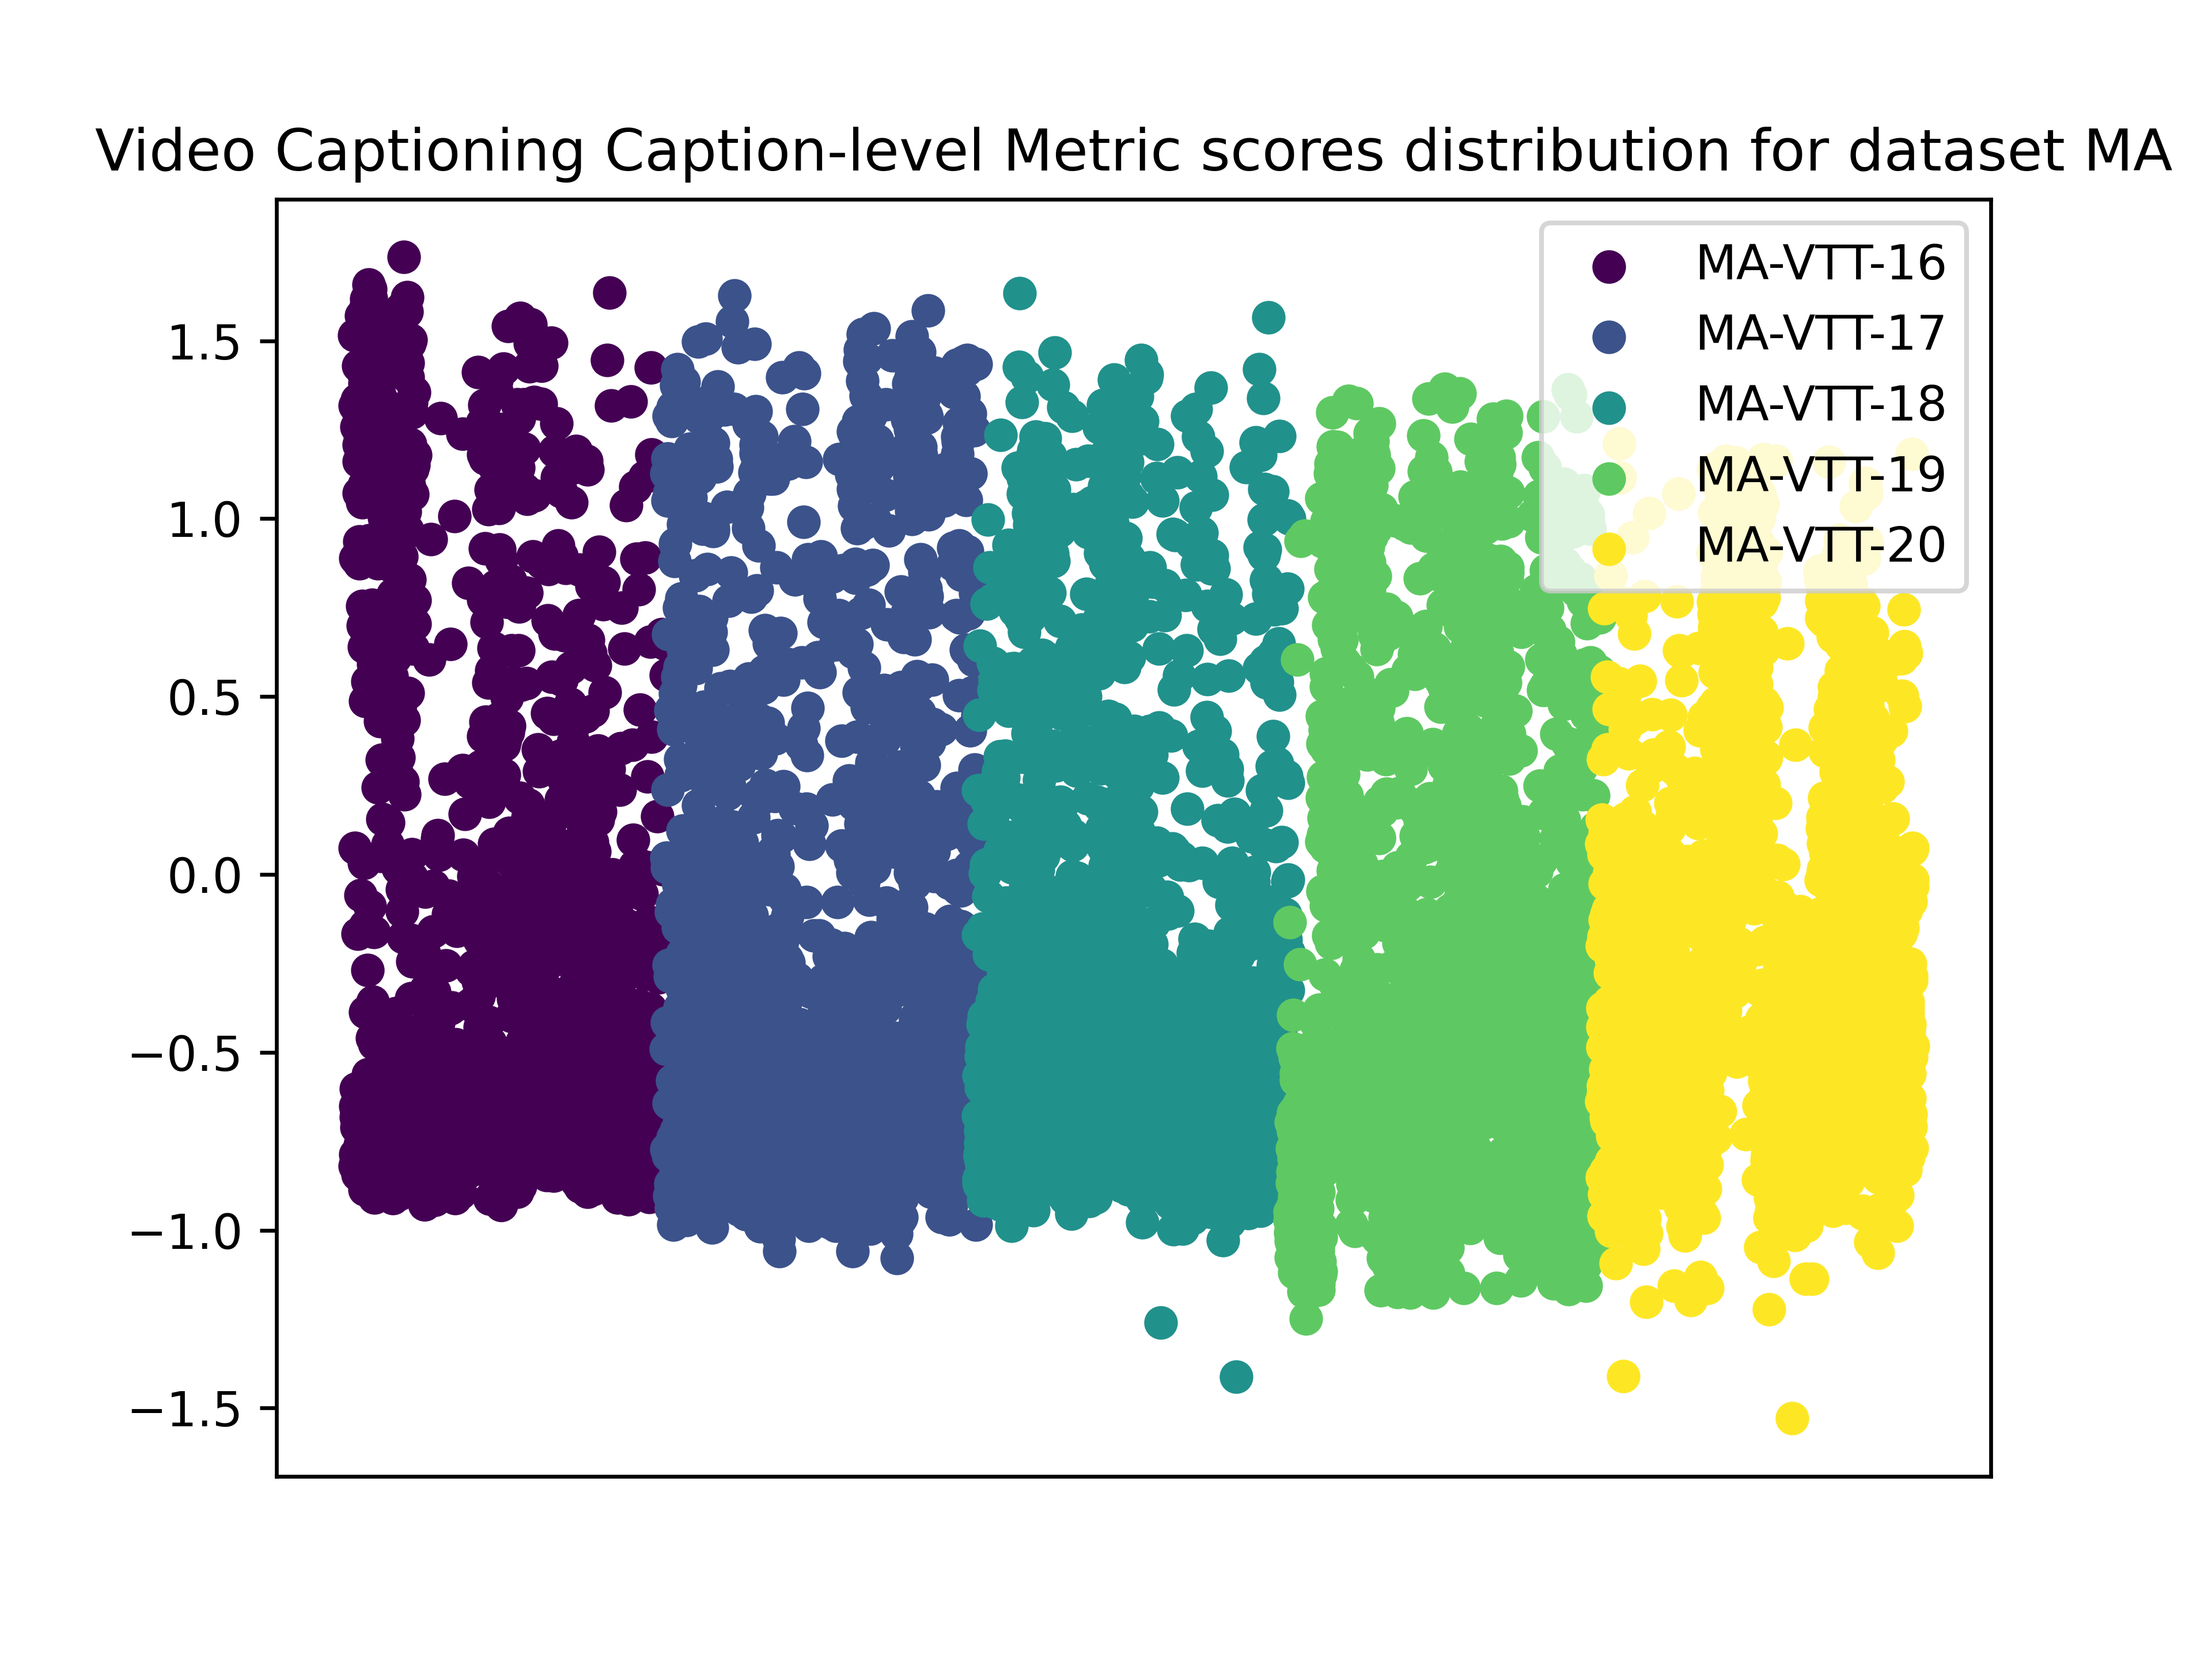
One relevant statistic is how the scores from the human assessment are distributed in each dataset. Figure 2 shows the different distribution per year and dataset. SA has a mean score of -0.28, and MA has a mean score of -0.25; however, in the plot we can see that the deviations are very different. As both datasets include similar sentences we can deduce that same quality system generated sentences has a noticeable difference in the human score in each dataset. Evaluation is performed at the system level and the caption level. However, the method is trained only at the caption level.
5. Evaluating BERTHA in TRECVid
In this section, the comparison of how BERTHA works in the two datasets is presented. We focus on two primary configurations: BERTHA-SA and BERTHA-MA. Each model is trained in all the years of one of the datasets, e.g. BERTHA-SA is trained in the single annotator dataset. Each dataset is divided by each year to represent better the typical set-up of the TRECVid challenge, so we train in a set of years and keep one for testing. In each table, the column represents the year used as a test. In both models, the same year used for testing is discarded from training as some system-generated sentences are shared between the two datasets.
Even if there are multiple references, they are not standard in number. In the early years of the challenge, only two human sentences per video were used. Also, all the videos and systems do not have the same number of human references. Because of this, the base experiment will consider each sentence independently, even if they come from the same video and the same system. In further experiments, we will discuss the use of multiple references.
| VTT-16 | VTT-17 | VTT-18 | VTT-19 | VTT-20 | Mean | |
|---|---|---|---|---|---|---|
| BERTHA-SA | 0.081 | 0.027 | 0.091 | 0.075 | 0.069 | 0.069 |
| BERTHA-MA | 0.050 | 0.028 | 0.033 | 0.072 | 0.032 | 0.041 |
| BLEU-4 | 0.028 | 0.004 | 0.016 | 0.030 | 0.010 | 0.015 |
| SentBLEU | 0.036 | 0.022 | 0.043 | 0.053 | 0.027 | 0.036 |
| CIDEr | 0.017 | 0.044 | 0.059 | 0.035 | 0.107 | 0.061 |
| METEOR | 0.027 | 0.034 | 0.087 | 0.064 | 0.115 | 0.075 |
| Rouge | 0.002 | 0.017 | 0.076 | 0.046 | 0.093 | 0.058 |
| SPICE | 0.023 | 0.011 | 0.062 | 0.032 | 0.003 | 0.027 |
| VTT-16 | VTT-17 | VTT-18 | VTT-19 | VTT-20 | Mean | |
|---|---|---|---|---|---|---|
| BERTHA-SA | 0.063 | 0.060 | 0.077 | 0.147 | 0.164 | 0.112 |
| BERTHA-MA | 0.042 | 0.066 | 0.058 | 0.225 | 0.247 | 0.149 |
| BLEU-4 | 0.017 | 0.045 | 0.007 | 0.049 | 0.112 | 0.053 |
| SentBLEU | 0.024 | 0.035 | 0.010 | -0.051 | 0.077 | 0.017 |
| CIDEr | 0.049 | 0.083 | 0.114 | 0.155 | 0.208 | 0.140 |
| METEOR | 0.017 | 0.083 | 0.129 | 0.222 | 0.235 | 0.167 |
| Rouge | 0.064 | 0.056 | 0.085 | 0.158 | 0.209 | 0.127 |
| SPICE | 0.013 | 0.001 | 0.012 | 0.018 | 0.001 | 0.008 |
5.1. System-level Evaluation
Concerning system-level evaluation, each metric takes as input the set of videos from a single past TRECVid-VTT task and one or more human-generated reference captions for that video, as well as the video captions produced by all systems participating in that task. For each participating system, the metric produces a single score corresponding to the average score of each sentence produced by this system. Taking scores produced by the metric for all systems from a single TRECVid-VTT task, we calculate how well it correlates with human assessment of the same systems in terms of SA or MA scores described above.
To evaluate the system level, we use the following formula:
| (3) |
where
and
Table 1 presents the results for the full SA dataset. Notice that VTT-16 was the first year where this evaluation system was implemented, explaining why BERTHA and the other metrics behave differently. VTT-16 is also the earliest year; assuming that there is an improvement in the models each year then it is also the year with the worst system-generated captions in general terms.
In the case of the MA dataset, represented in Figure 2, VTT-16 still is the most different set in terms of results across all metrics. In this case, one of the most stable metrics is CIDEr, which always gets one of the top-3 scores in all years. BERTHA gets a good score overall: it is the second or third best performing metrics in most cases.
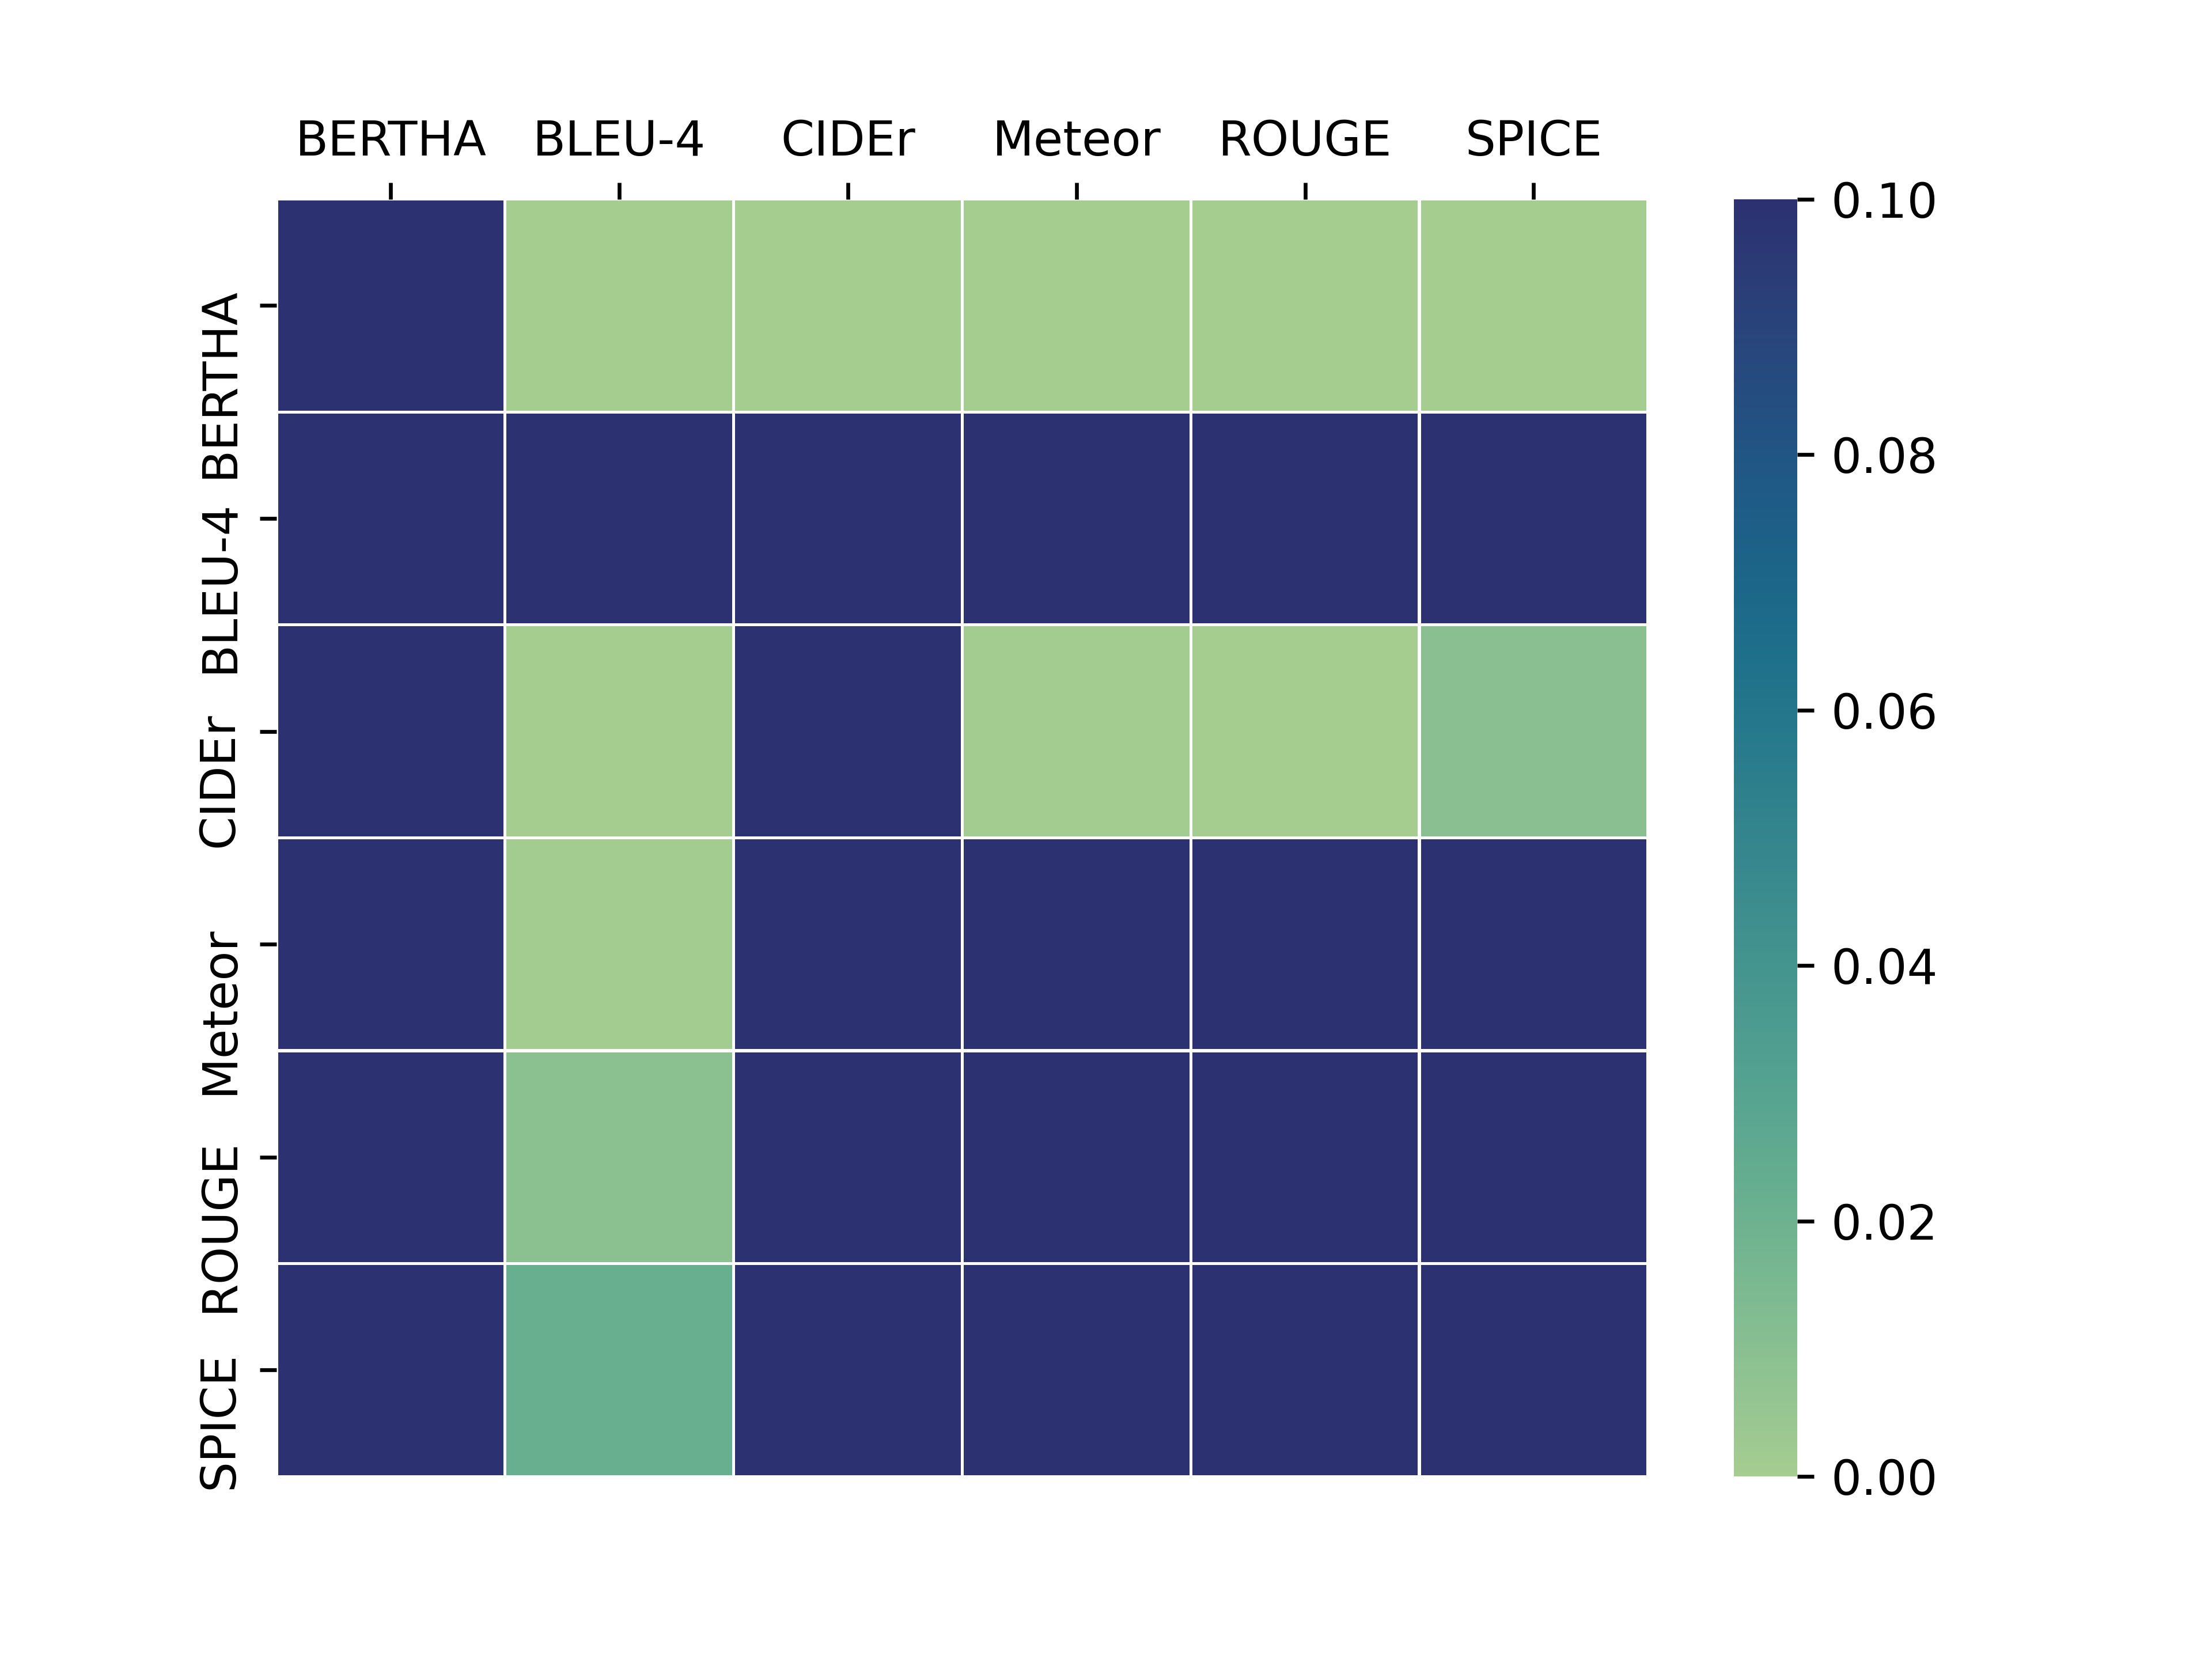
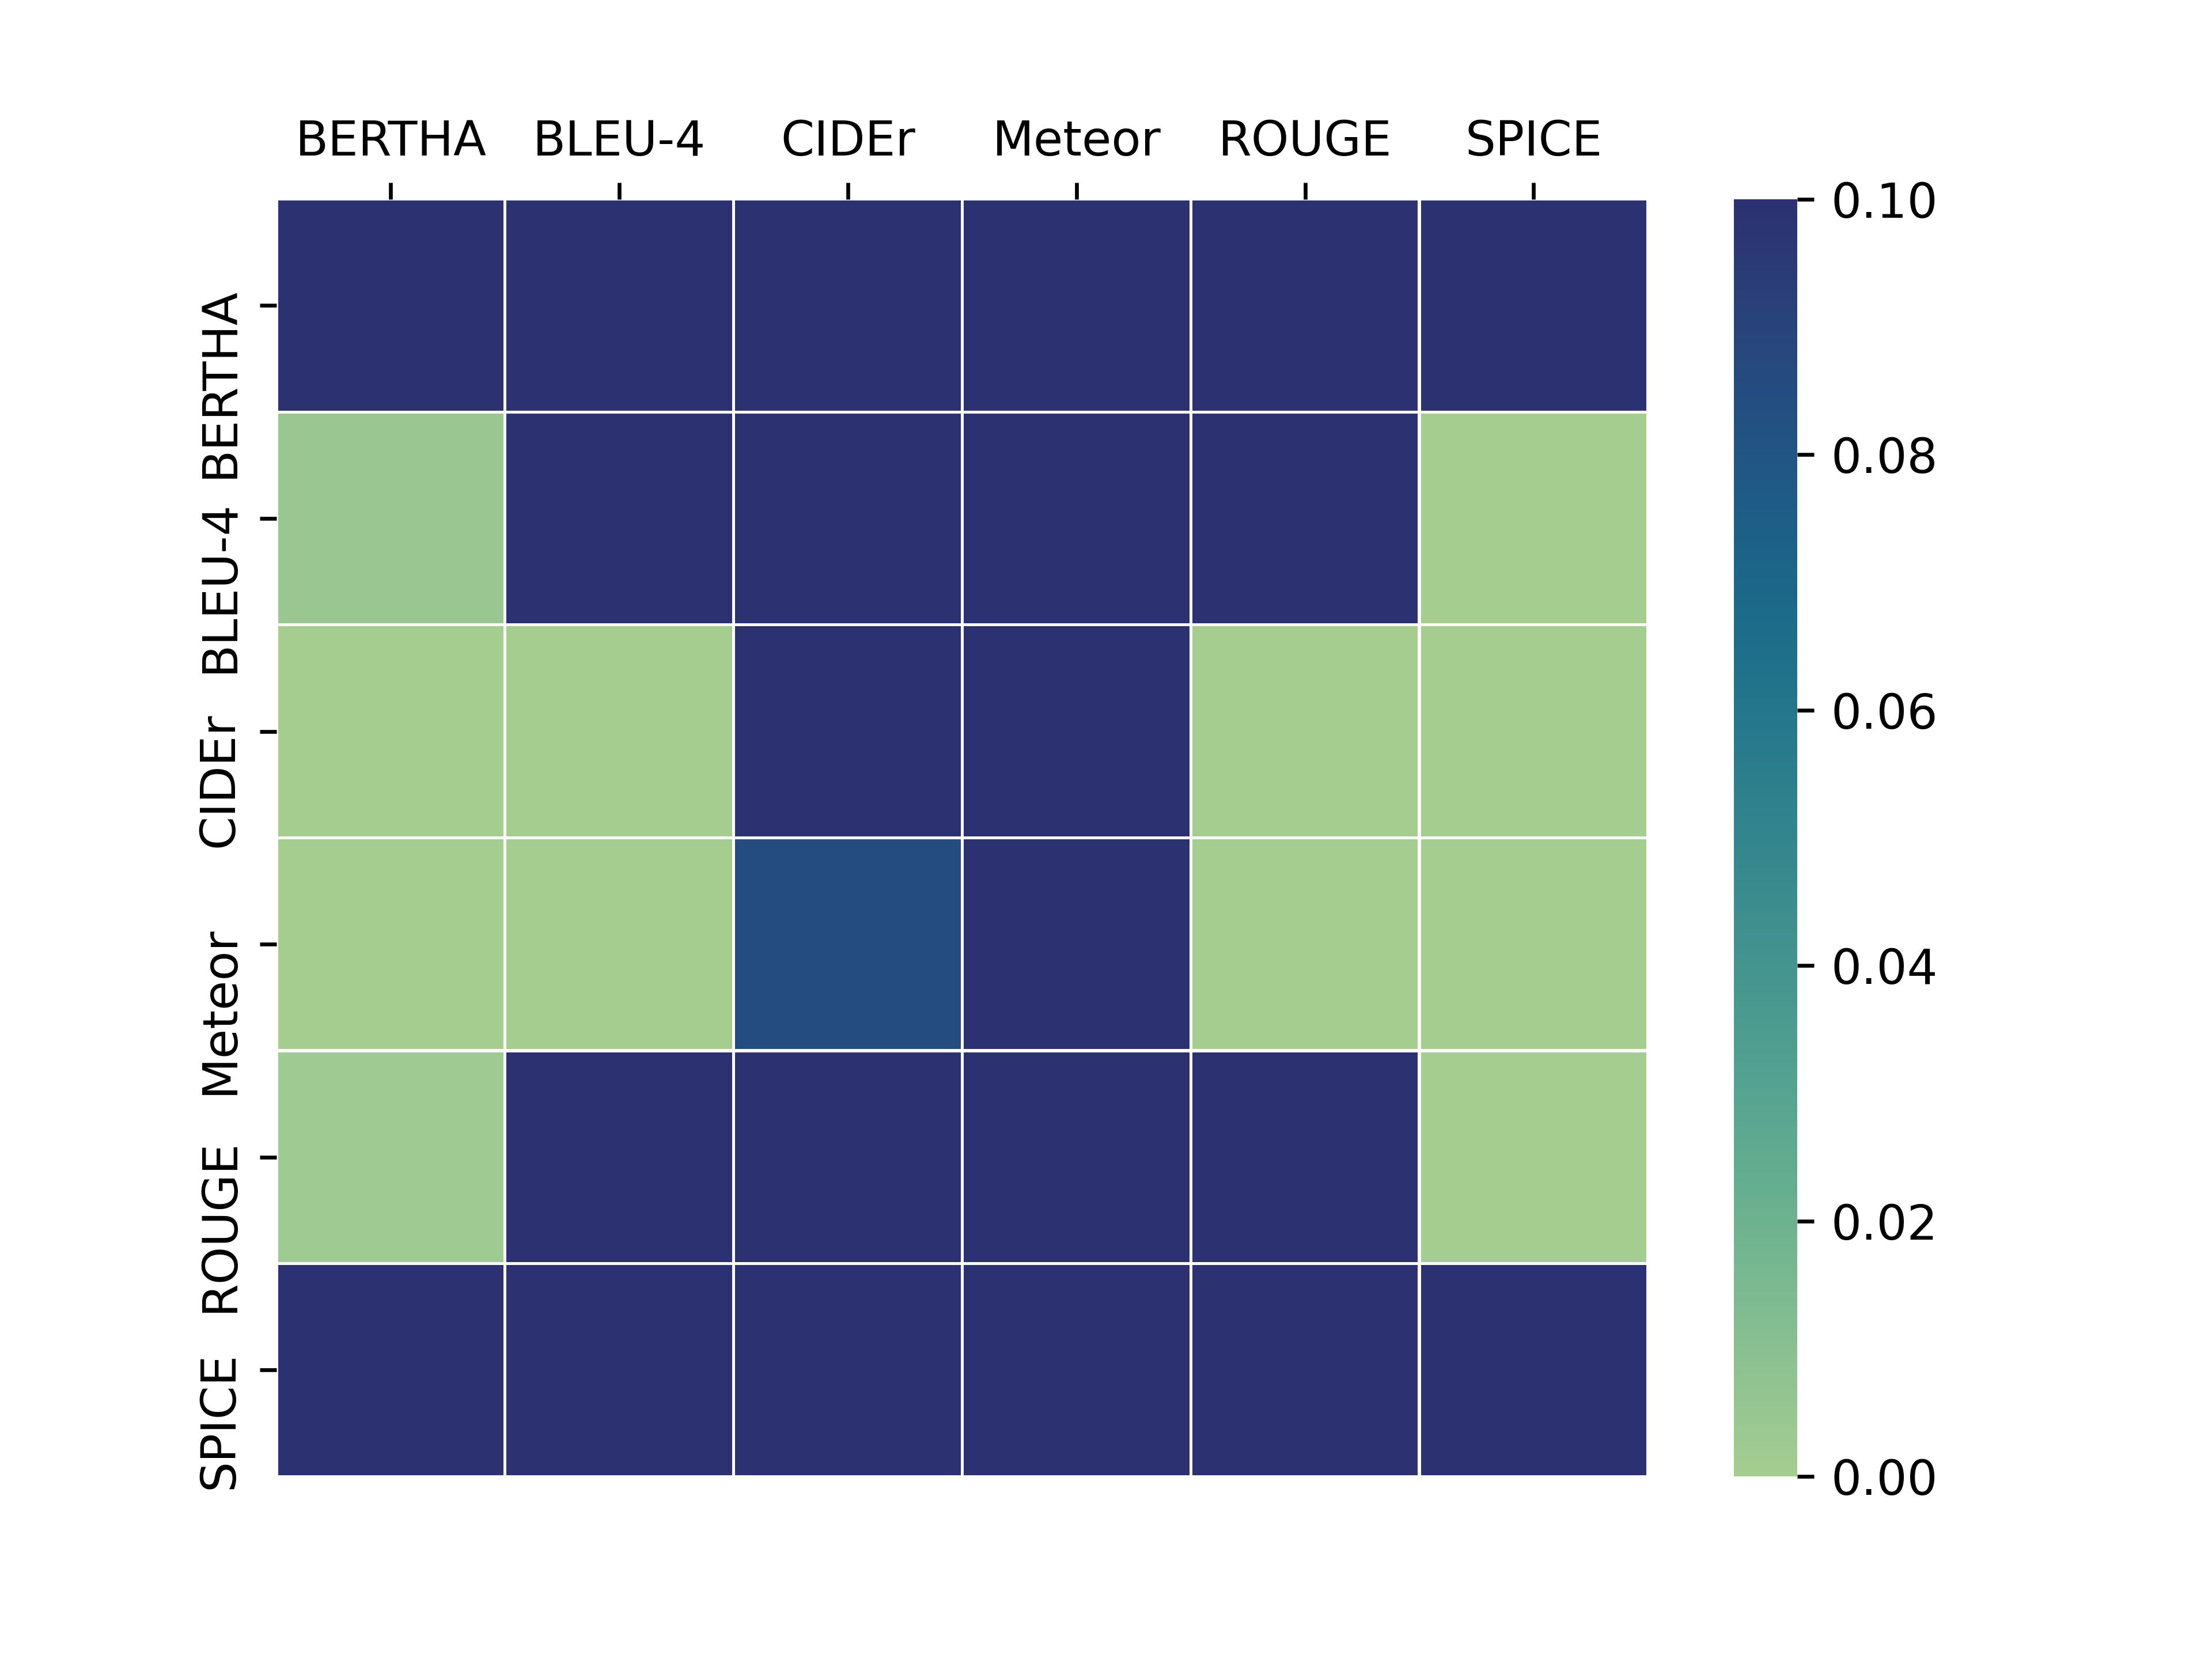
Finally, we perform a William significance test [Graham, 2015] at the system level. Considering as the references significance threshold in the William test, CIDEr is the best scoring metric, but only obtaining a clear difference from the worst-performing ones. Differences between metrics are more pronounced in the MA dataset.
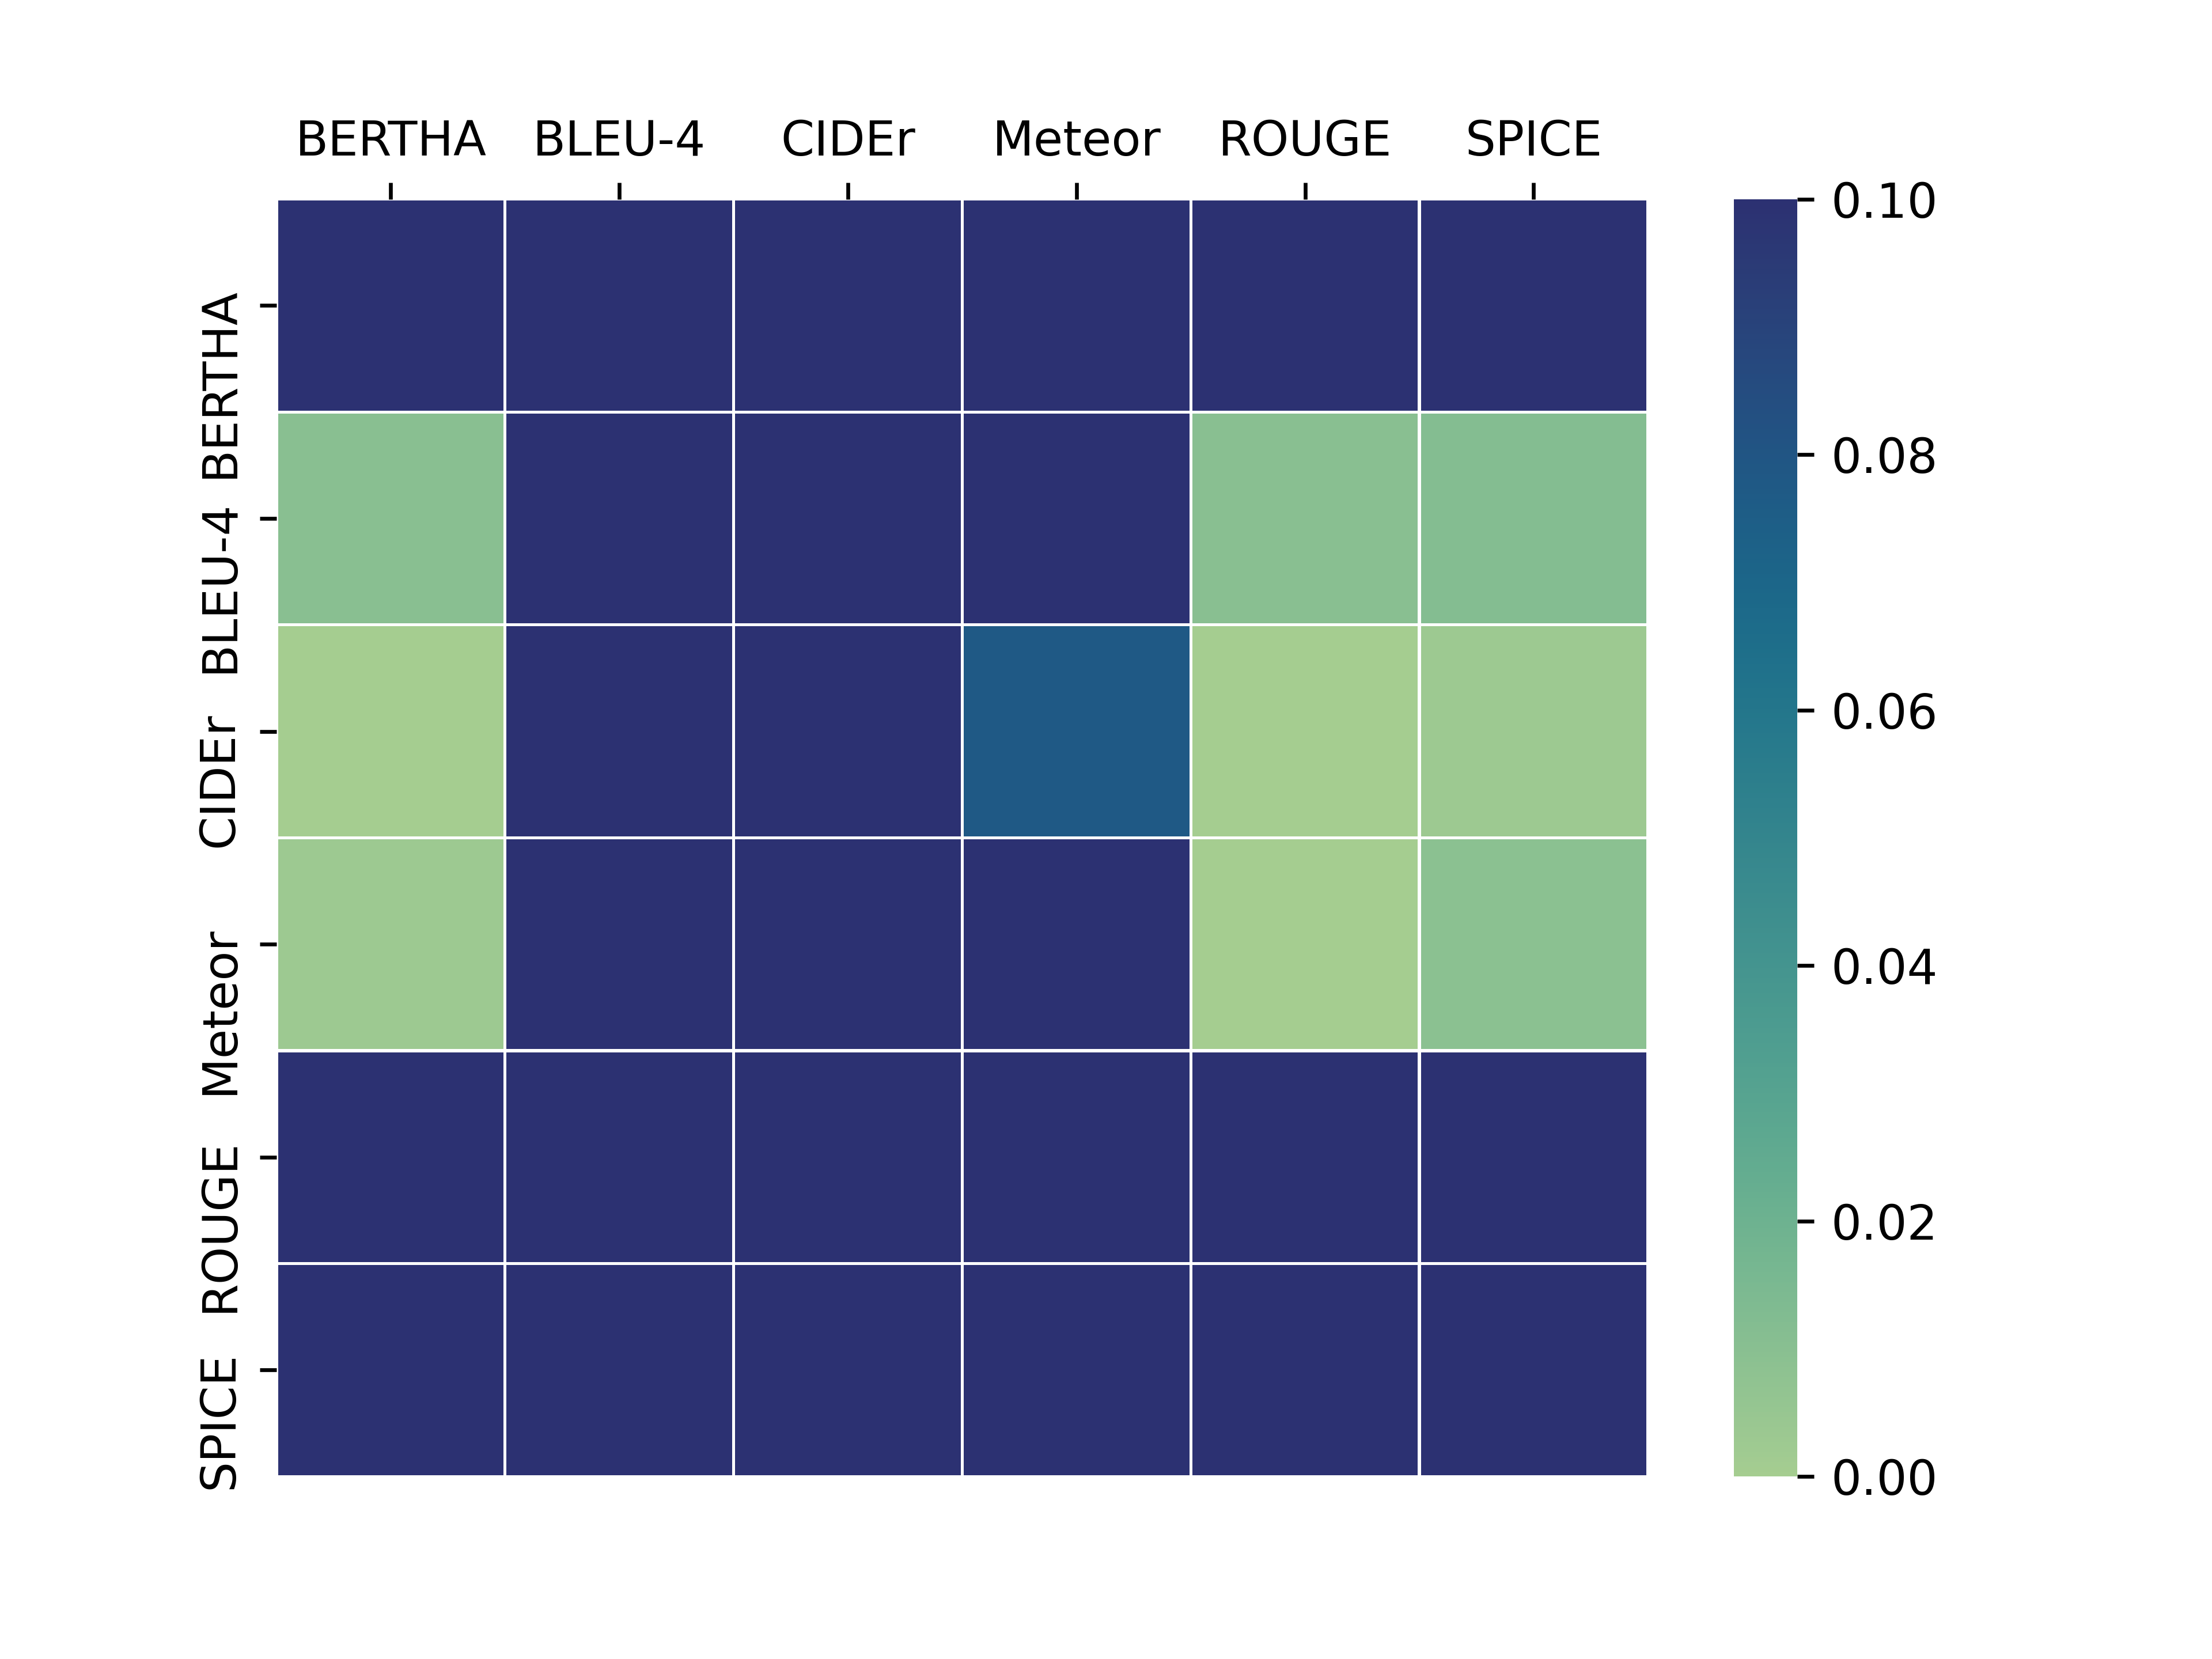
Overall the significance test shows no clear winning metric, justifying the use of multiple metrics to cover more situations. CIDEr obtains a better consistency in both datasets, but in terms of results, there are no significant differences compared to the other best-performing metrics.
In the case of BERTHA, we can see that VTT-16 performs worse than in the others years. From this, we can deduce that the tendency of VTT-16 is different from all the other SA years. However, the inclusion of this year as training seems not to affect the performance of BERTHA and it has similar behaviour to compared to the other metrics. We can argue that VTT-16 gives more examples of wrong captions, and the model aims to distinguish between good captions and incorrect captions. In the last two years, we can see an improvement in the overall scores that means that the captions were easier to catalogue, and there were better features to distinguish between good and bad sentences.
| HUMAN-A | HUMAN-B | HUMAN-C | HUMAN-D | HUMAN-E | 5 Ref Captions | |
|---|---|---|---|---|---|---|
| BERTHA-MA | 0.274 | 0.324 | 0.282 | 0.288 | 0.288 | 0.236 |
| BLEU-4 | 0.089 | 0.082 | 0.042 | 0.074 | 0.100 | 0.057 |
| CIDEr | 0.125 | 0.126 | 0.069 | 0.126 | 0.119 | 0.116 |
| METEOR | 0.123 | 0.145 | 0.095 | 0.136 | 0.107 | 0.117 |
| VTT-16 | VTT-17 | VTT-18 | VTT-19 | VTT-20 | |
|---|---|---|---|---|---|
| BERTHA-MA | 0.037 | 0.061 | 0.117 | 0.158 | 0.217 |
| BLEU-4 | 0.002 | 0.042 | 0.047 | 0.002 | 0.000 |
| CIDEr | 0.059 | 0.081 | 0.126 | 0.170 | 0.222 |
| METEOR | 0.014 | 0.077 | 0.136 | 0.218 | 0.242 |
| ROUGE | -0.088 | 0.036 | 0.048 | 0.116 | 0.166 |
5.2. Caption-level Evaluation
In this case, the system is removed from the equation, and the metric is evaluated at the caption level. For each sentence produce by each system, we get a score. Taking all the scores for a year from a single TRECVid-VTT task, we calculate how well it correlates with human assessment of the same year.
To perform the caption level evaluation the is used in the single references per caption scenario. Some videos have multiple references captions. Some traditional metrics, like CIDEr, have a mechanism to take into account these multiple sentences and obtain a better evaluation. BERTHA does not include an internal way to do it, so the mean of the predicted scores is used for the ranking:
| (4) |
where
and
Table 3 contains the results for the SA dataset at a caption-level. Overall the latest years are where the metric archive the best scores. CIDEr, METEOR, and BERTHA have similar correlations.
In the case of the MA dataset we can see a similar behaviour, as shown in Table 4. BERTHA performs well and is the second or first metric with more similar performance to the human evaluation. Again the top performing metrics in all are BERTHA, CIDEr, and METEOR without strong discrepancies between them in the recent years.
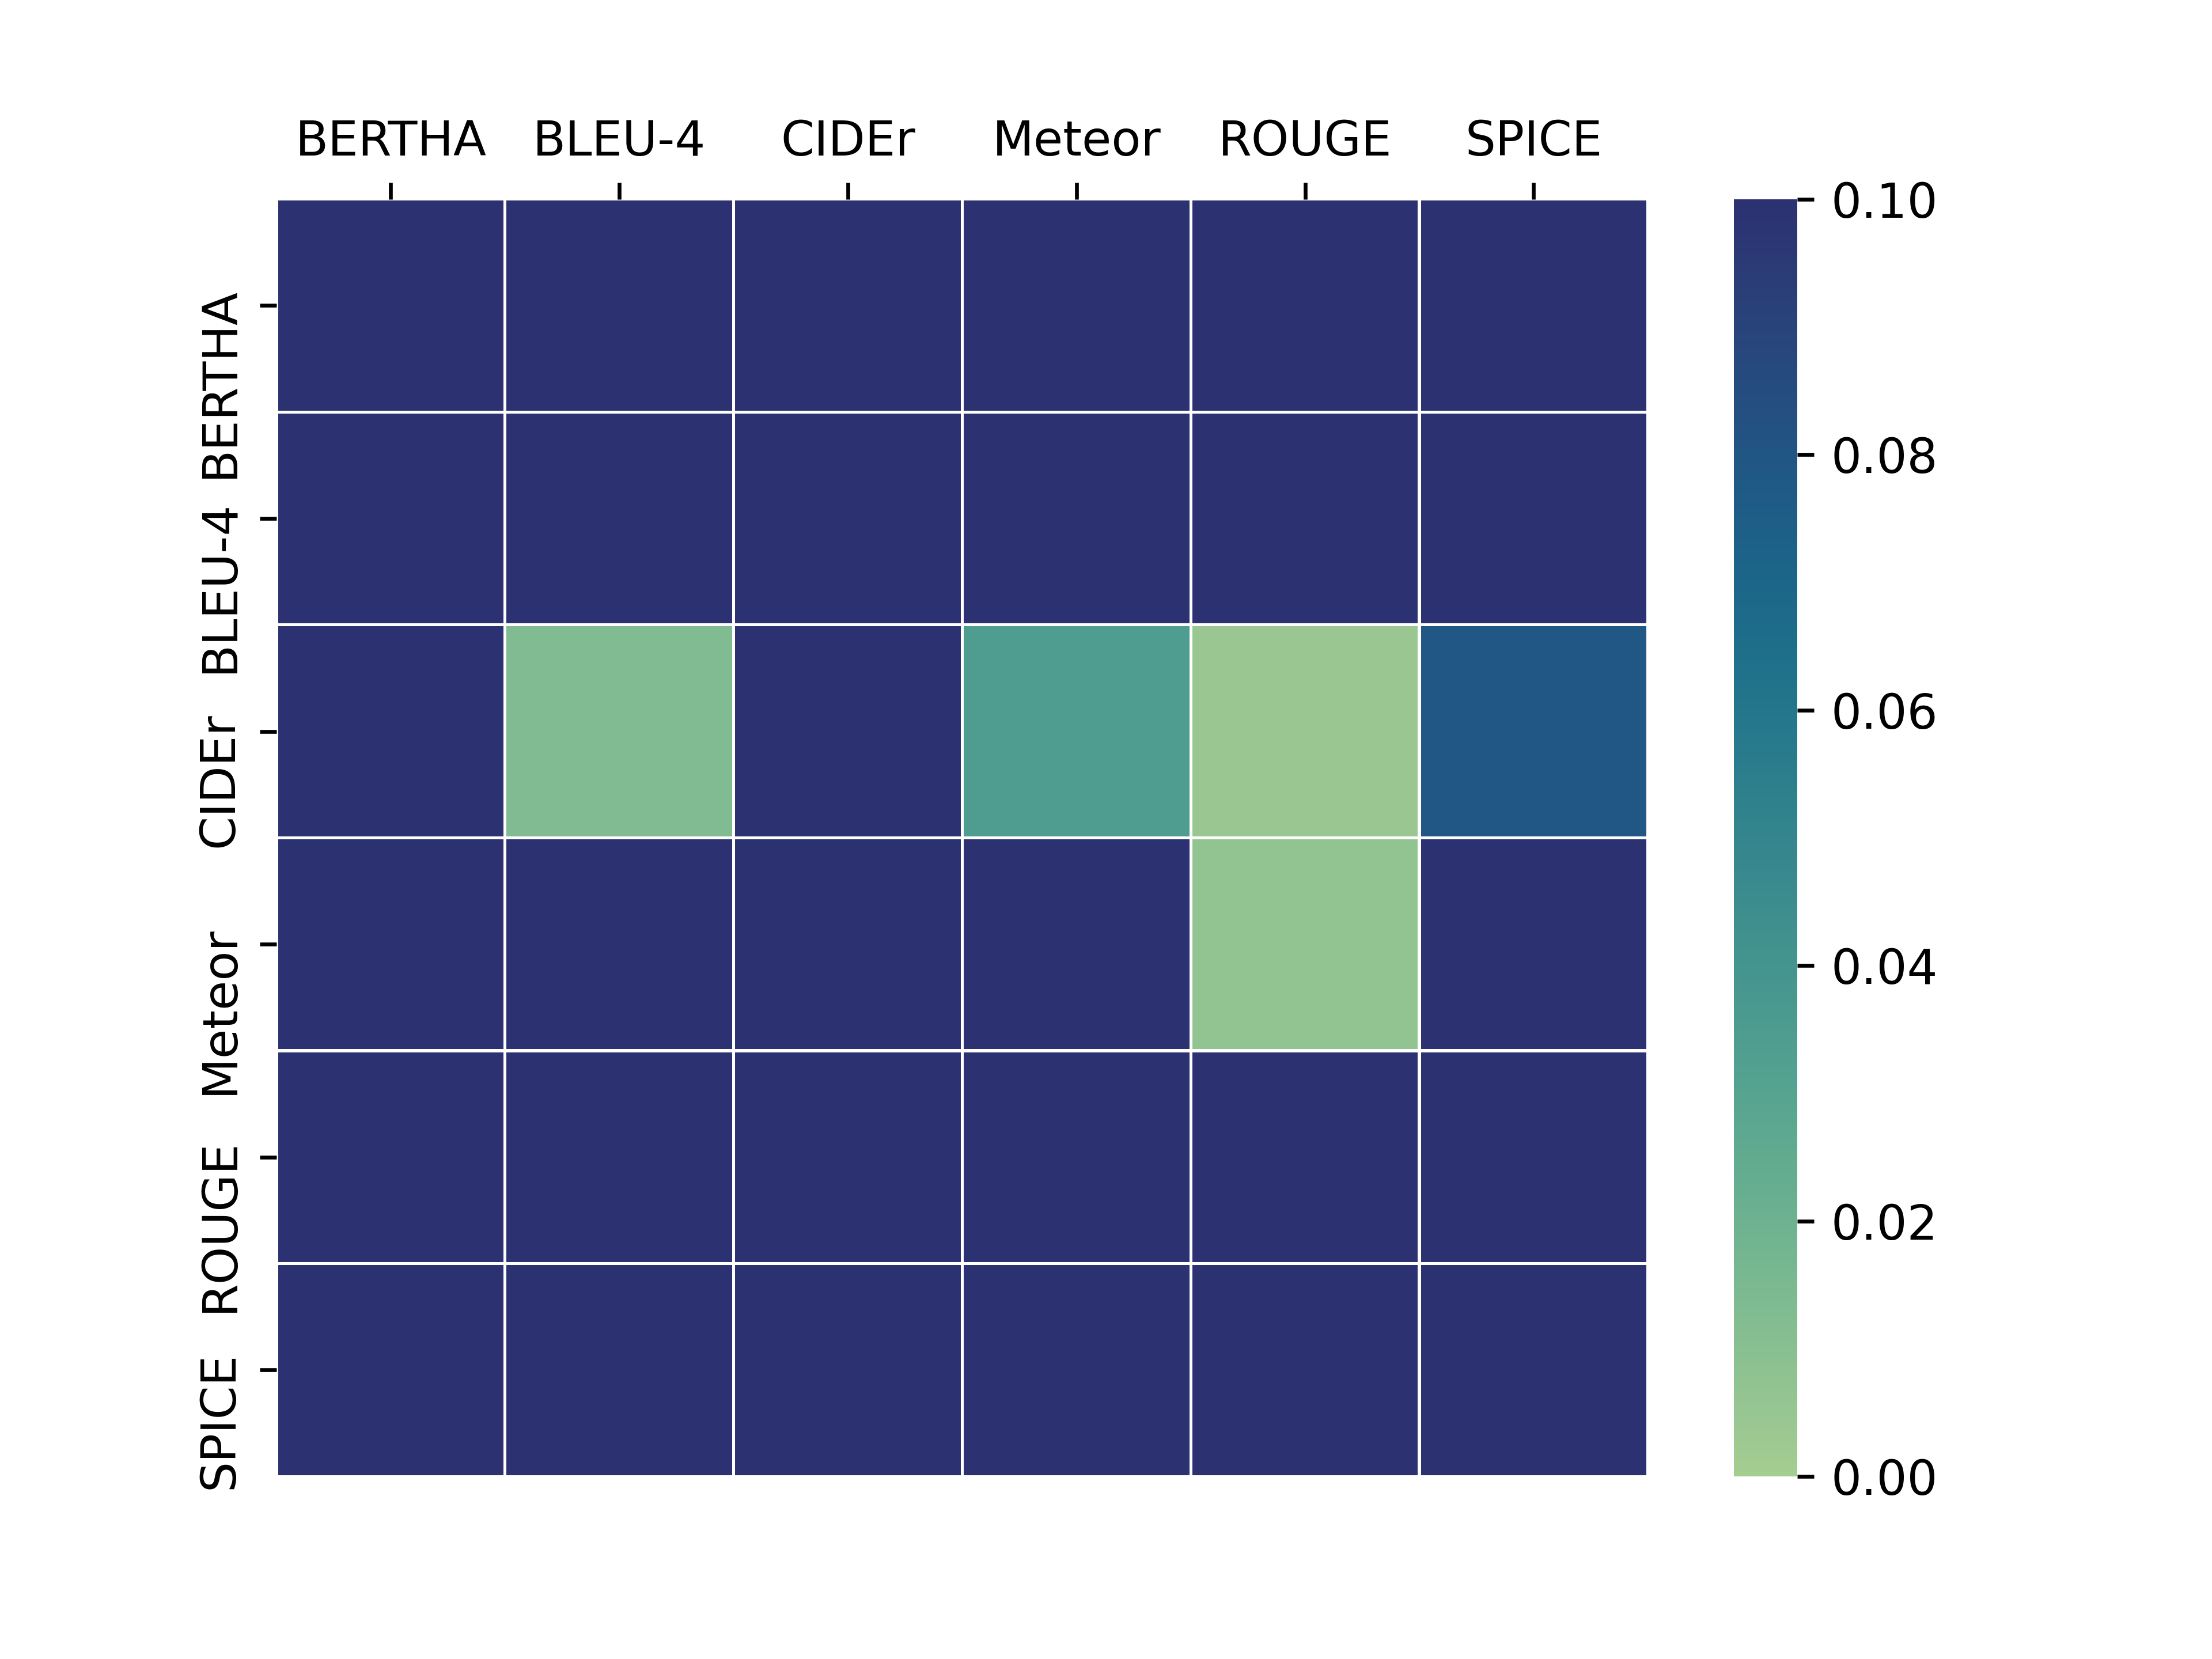
Similar to the system-level evaluation, the William significance test was performed to evaluate the correlations. Figures 4 show those results. BLEU-4 is the worst scoring metric in these scenarios. In MA, neither BERTHA nor SPICE achieve consistent results.
BERTHA outperform the other metrics in most of the test sets. In general, the MA dataset is the most complex dataset for BERTHA as it does not achieve good consistency, and the results vary depending on the year.
In general, we see a considerable drop in the correlation when comparing BERTHA train in MA and then the test in SA. On the contrary, the SA variant starts having slightly better results in the early years. However, in the last years of the task, it switches, and MA gets noticeable better results than other metrics. This means that the two datasets are not compatible, and the model can not be transferred between them in most scenarios. These cases are more relevant as the same sentence can exist in both datasets but have significantly different scores in each.
|
|
|
|
|
|
|
|
|
|
|||||||||||||||||||||
|---|---|---|---|---|---|---|---|---|---|---|---|---|---|---|---|---|---|---|---|---|---|---|---|---|---|---|---|---|---|---|
| BERTHA | 0.096 | 0.02.3 | 0.026 | 0.087 | 0.113 | 0.020 | 0.111 | 0.091 | 0.204 | 0.217 | ||||||||||||||||||||
| BLEU-4 | 0.069 | -0.001 | 0.023 | 0.006 | 0.043 | -0.050 | -0.009 | 0.115 | 0.030 | 0.110 | ||||||||||||||||||||
| CIDEr | 0.147 | 0.010 | 0.033 | 0.008 | 0.131 | 0.028 | 0.055 | 0.238 | 0.194 | 0.186 | ||||||||||||||||||||
| METEOR | 0.155 | 0.009 | 0.040 | 0.038 | 0.141 | 0.048 | 0.092 | 0.151 | 0.234 | 0.264 | ||||||||||||||||||||
| ROUGE | 0.121 | -0.011 | 0.026 | 0.009 | 0.115 | -0.08 | 0.065 | 0.083 | 0.192 | 0.229 | ||||||||||||||||||||
| Fusion | 0.148 | 0.028 | 0.041 | 0.064 | 0.145 | 0.069 | 0.100 | 0.125 | 0.244 | 0.233 |
5.2.1. Using Multiple Human References
In some years the dataset has multiple references: up to five per video. This allows comparing each system generated caption with different human references. Notice that there is no specific score for each human reference. It is shared between all the references to simplify the collection process. This is possible because the human references are closer to each other in terms of the human caption evaluation.
Table 5 shows the effect of using each of these references, named HUMAN-A, HUMAN-B, HUMAN-C, HUMAN-D, and HUMAN-E, and what happens when the five are combined. The same humans did not annotated all the years, which is why we focus on a single year for this experiment. As a single year does not have sufficient data, the training strategy is to perform 5-folds on a subset of the data and show the mean. As BERTHA does not have any mechanism to use multiple references per video, the process to evaluate the five references per system generated caption is to compute the mean of the predicted scores before performing the correlation.
In terms of results, BERTHA performs well even in the small dataset. As BERTHA is a learned metric it obtains better results than in the multiple years set up. This shows that the metric is better suited when both the human evaluation and the system are more standardized. All the other metrics obtain worse numerical results than in the previous setup but they obtain a similar ranking compare with the previous setup.
In terms of analysing the humans, HUMAN-C produces the worst outcomes for all metrics apart from BERTHA. This explains some differences between each human annotator, which in the end means that BERTHA does not perform as well in the five-captions scenario. We argue that this is the result of using the same score for five different references sentences for the same system generated caption. The system needs to learn to give the same exact score to five fairly different pair of sentences. The limited number of samples makes it difficult to generalize to this case.
5.2.2. Evaluating Word Shuffle
Table 6 shows what happens to the metrics when we train in a typical setting, but the sentences in evaluation have their words shuffled randomly.
As expected, the metric most affected is BLEU, which gets a correlation near or equal to zero in some years. All the others, including BERTHA, are consistent with the previous experiments and only see minor variations, which means that even though they are slightly penalise by the shuffling of the words they are still able to reconstruct the meaning behind sentences. This demonstrates a certain robustness to miss-written sentences and that it is not only the grammar that is evaluated.
5.2.3. Fusion of Metrics
In this experiment a linear regression model is trained to find the best combination of metrics to predict the human judgment to produce a new fusion metric. All the years are divided in 80% train and 20% test. Then all the training sets are combined and a linear regression model is trained on this new dataset. Finally each year is tested separately. Table 7 shows the final correlation for all the years of both sub-datasets. All the metrics are in a range between 0 and 1, and no additional regularization was applied. The best fit linear regression coefficients are:
BERTHA
BLEU-4
CIDEr
METEOR
ROUGE
0.0525
-0.1373
0.0315
0.2810
-0.0779
It can be observed that the fusion metric performs best in the SA dataset and performs as one of the top-3 in all the years of MA. This demonstrates that this fused metric is the most stable one. It correlates well with human judgment, making it a good reference for use in the evaluation of video captioning systems when a single metric is required.
From the regression weights, METEOR appears to be the base score for the final fusion metric while BLEU-4 is better used as a penalization when taking other metrics into account. A small weight indicates that a metric follows a similar behaviour as the main one. For instance, from Table 4 we can see that METEOR and BERTHA perform similarly; however, in the fused metric METEOR has a higher weight.
6. Conclusions
This paper proposed a new method to train an evaluation metric for video captioning. The technique learns how to compare system-generated captions with human references from human judgments. We study the robustness in a real challenge scenario. The dataset contains human assessment for system-generated captions. BERTHA obtains a better correlation than the most commonly use metrics at the caption level as can be seen in Table 3 and 4. From the Fusion analysis, we see that BERTHA can be used in a complementary way with the other metrics or as a standalone metric. BERTHA is purely a deep learning model, so it is easy to include in different architectures.
Acknowledgments
This research was supported by the Irish Research Council Enterprise Partnership Scheme together with United Technologies Research Center Ireland and the Insight SFI Research Centre for Data Analytics supported by Science Foundation Ireland (SFI) under Grant Number SFI/12/RC/2289_P2, co-funded by the European Regional Development Fund.
7. References
References
- Anderson et al., 2016 Anderson, P., Fernando, B., Johnson, M., and Gould, S. (2016). Spice: Semantic propositional image caption evaluation. In European conference on computer vision, pages 382–398. Springer.
- Awad et al., 2017 Awad, G., Butt, A. A., Fiscus, J., Joy, D., Delgado, A., Michel, M., Smeaton, A. F., Graham, Y., Kraaij, W., Quenot, G., Eskevich, M., Ordelman, R., Jones, G. J. F., and Huet, B. (2017). Trecvid 2017: Evaluating ad-hoc and instance video search, event detection, video captioning and hyperlinking. In Proceedings of TRECVID 2017, Gaithersburg, MD.
- Awad et al., 2018 Awad, G., Butt, A. A., Curtis, K., Lee, Y., Fiscus, J., Godil, A., Joy, D., Delgado, A., Smeaton, A. F., Graham, Y., Kraaij, W., Quénot, G., Magalhaes, J., Semedo, D., and Blasi, S. (2018). Trecvid 2018: Benchmarking video activity detection, video captioning and matching, video storytelling linking and video search. In Proceedings of TRECVID 2018, Gaithersburg, MD.
- Awad et al., 2020a Awad, G., Butt, A. A., Curtis, K., Lee, Y., Fiscus, J., Godil, A., Delgado, A., Zhang, J., Godard, E., Diduch, L., et al. (2020a). Trecvid 2019: An evaluation campaign to benchmark video activity detection, video captioning and matching, and video search & retrieval. arXiv preprint arXiv:2009.09984.
- Awad et al., 2020b Awad, G., Butt, A. A., Curtis, K., Lee, Y., Fiscus, J., Godil, A., Delgado, A., Zhang, J., Godard, E., Diduch, L., Smeaton, A. F., Graham, Y., Kraaij, W., and Quenot, G. (2020b). TRECVID 2019: An Evaluation Campaign to Benchmark Video Activity Detection, Video Captioning and Matching, and Video Search & Retrieval. arXiv e-prints, page arXiv:2009.09984, September.
- Awad et al., 2021 Awad, G., Butt, A. A., Curtis, K., Fiscus, J., Godil, A., Lee, Y., Delgado, A., Zhang, J., Godard, E., Chocot, B., et al. (2021). Trecvid 2020: A comprehensive campaign for evaluating video retrieval tasks across multiple application domains. Proceedings of TRECVID 2020.
- Banerjee and Lavie, 2005 Banerjee, S. and Lavie, A. (2005). Meteor: An automatic metric for mt evaluation with improved correlation with human judgments. In Proceedings of the acl workshop on intrinsic and extrinsic evaluation measures for machine translation and/or summarization, pages 65–72.
- Brown et al., 2020 Brown, T. B., Mann, B., Ryder, N., Subbiah, M., Kaplan, J., Dhariwal, P., Neelakantan, A., Shyam, P., Sastry, G., Askell, A., et al. (2020). Language models are few-shot learners. arXiv preprint arXiv:2005.14165.
- Caba Heilbron et al., 2015 Caba Heilbron, F., Escorcia, V., Ghanem, B., and Carlos Niebles, J. (2015). Activitynet: A large-scale video benchmark for human activity understanding. In Proceedings of the IEEE conference on computer vision and pattern recognition, pages 961–970.
- Chen et al., 2015 Chen, X., Fang, H., Lin, T.-Y., Vedantam, R., Gupta, S., Dollár, P., and Zitnick, C. L. (2015). Microsoft coco captions: Data collection and evaluation server. arXiv preprint arXiv:1504.00325.
- Cui et al., 2018 Cui, Y., Yang, G., Veit, A., Huang, X., and Belongie, S. (2018). Learning to evaluate image captioning. In Proceedings of the IEEE conference on computer vision and pattern recognition, pages 5804–5812.
- Devlin et al., 2018 Devlin, J., Chang, M.-W., Lee, K., and Toutanova, K. (2018). Bert: Pre-training of deep bidirectional transformers for language understanding. arXiv preprint arXiv:1810.04805.
- Graham et al., 2015 Graham, Y., Mathur, N., and Baldwin, T. (2015). Accurate evaluation of segment-level machine translation metrics. In Proceedings of the 2015 Conference of the North American Chapter of the Association for Computational Linguistics Human Language Technologies, Denver, Colorado.
- Graham et al., 2018 Graham, Y., Awad, G., and Smeaton, A. (2018). Evaluation of automatic video captioning using direct assessment. PLOS ONE, 13(9):1–20, 09.
- Graham et al., 2020 Graham, Y., Federmann, C., Eskevich, M., and Haddow, B. (2020). Assessing human-parity in machine translation on the segment level. In Proceedings of the 2020 Conference on Empirical Methods in Natural Language Processing: Findings, pages 4199–4207.
- Graham, 2015 Graham, Y. (2015). Re-evaluating automatic summarization with bleu and 192 shades of rouge. In Proceedings of the 2015 Conference on Empirical Methods in Natural Language Processing, pages 128–137, Lisbon, Portugal, September. Association for Computational Linguistics.
- Lin, 2004 Lin, C.-Y. (2004). Rouge: A package for automatic evaluation of summaries. In Text summarization branches out, pages 74–81.
- Mathur et al., 2020 Mathur, N., Wei, J., Freitag, M., Ma, Q., and Bojar, O. (2020). Results of the wmt20 metrics shared task. In Proceedings of the Fifth Conference on Machine Translation, pages 688–725.
- Papineni et al., 2002 Papineni, K., Roukos, S., Ward, T., and Zhu, W.-J. (2002). Bleu: a method for automatic evaluation of machine translation. In Proceedings of the 40th annual meeting of the Association for Computational Linguistics, pages 311–318.
- Sellam et al., 2020 Sellam, T., Das, D., and Parikh, A. P. (2020). Bleurt: Learning robust metrics for text generation. arXiv preprint arXiv:2004.04696.
- Shimanaka et al., 2019 Shimanaka, H., Kajiwara, T., and Komachi, M. (2019). Machine translation evaluation with bert regressor. arXiv preprint arXiv:1907.12679.
- Smeaton et al., 2006 Smeaton, A. F., Over, P., and Kraaij, W. (2006). Evaluation campaigns and trecvid. In MIR ’06: Proceedings of the 8th ACM International Workshop on Multimedia Information Retrieval, pages 321–330, New York, NY, USA. ACM Press.
- Tang et al., 2019 Tang, Y., Ding, D., Rao, Y., Zheng, Y., Zhang, D., Zhao, L., Lu, J., and Zhou, J. (2019). Coin: A large-scale dataset for comprehensive instructional video analysis. In Proceedings of the IEEE/CVF Conference on Computer Vision and Pattern Recognition, pages 1207–1216.
- Vaswani et al., 2017 Vaswani, A., Shazeer, N., Parmar, N., Uszkoreit, J., Jones, L., Gomez, A. N., Kaiser, Ł., and Polosukhin, I. (2017). Attention is all you need. In Advances in neural information processing systems, pages 5998–6008.
- Vedantam et al., 2015 Vedantam, R., Lawrence Zitnick, C., and Parikh, D. (2015). Cider: Consensus-based image description evaluation. In Proceedings of the IEEE conference on computer vision and pattern recognition, pages 4566–4575.
- Wu et al., 2016 Wu, Y., Schuster, M., Chen, Z., Le, Q. V., Norouzi, M., Macherey, W., Krikun, M., Cao, Y., Gao, Q., Macherey, K., et al. (2016). Google’s neural machine translation system: Bridging the gap between human and machine translation. arXiv preprint arXiv:1609.08144.
- Yi et al., 2020 Yi, Y., Deng, H., and Hu, J. (2020). Improving image captioning evaluation by considering inter references variance. In Proceedings of the 58th Annual Meeting of the Association for Computational Linguistics, pages 985–994.
- Zhu et al., 2015 Zhu, Y., Kiros, R., Zemel, R., Salakhutdinov, R., Urtasun, R., Torralba, A., and Fidler, S. (2015). Aligning books and movies: Towards story-like visual explanations by watching movies and reading books. In Proceedings of the IEEE international conference on computer vision, pages 19–27.