The Effect of Stellar Contamination on Transmission Spectroscopy: Needs Identified by NASA’s Exoplanet Exploration Program Study Analysis Group 21–A
The Effect of Stellar Contamination on Transmission Spectroscopy: Needs Identified by NASA’s Exoplanet Exploration Program Study Analysis Group 21
Abstract
Study Analysis Group 21 (SAG21) of NASA’s Exoplanet Exploration Program Analysis Group (ExoPAG) was organized to study the effect of stellar contamination on space-based transmission spectroscopy, a method for studying exoplanetary atmospheres by measuring the wavelength-dependent radius of a planet as it transits its star. Transmission spectroscopy relies on a precise understanding of the spectrum of the star being occulted. However, stars are not homogeneous, constant light sources but have temporally evolving photospheres and chromospheres with inhomogeneities like spots, faculae, plages. This SAG brought together an interdisciplinary team of more than 100 scientists, with observers and theorists from the heliophysics, stellar astrophysics, planetary science, and exoplanetary atmosphere research communities, to study the current research needs that can be addressed in this context to make the most of transit studies from current NASA facilities like HST and JWST. The analysis produced 14 findings, which fall into three Science Themes encompassing (1) how the Sun is used as our best laboratory to calibrate our understanding of stellar heterogeneities ("The Sun as the Stellar Benchmark"), (2) how stars other than the Sun extend our knowledge of heterogeneities ("Surface Heterogeneities of Other Stars") and (3) how to incorporate information gathered for the Sun and other stars into transit studies ("Mapping Stellar Knowledge to Transit Studies"). In this invited review, we reproduce the final report of SAG21 as a contribution to the peer-reviewed literature.
keywords:
Sun:activity – stars:activity – exoplanets – methods: observational – techniques: photometric – techniques: spectroscopic1 Introduction
Study Analysis Group 21 (SAG21) of Exoplanet Exploration Program Analysis Group (ExoPAG) was organized to study the effect of stellar contamination on space-based transmission spectroscopy. We begin with a brief description of the motivation for SAG21, the goals of the group, the methods by which we conducted our analysis, and the structure of this .
1.1 Motivation
Transmission spectroscopy is a method for identifying the atmospheric composition of an exoplanet by measuring a wavelength-dependent radius of a planet as it transits its star (Seager & Sasselov, 2000; Brown et al., 2001). This technique has been successfully applied to many exoplanets, primarily using and (Spitzer; e.g., Charbonneau et al., 2002; Tinetti et al., 2007; Agol et al., 2010; Désert et al., 2011b; Knutson et al., 2011; Deming et al., 2013; Fraine et al., 2014; Kreidberg et al., 2014; Sing et al., 2016), but also using ground-based telescopes (e.g., Redfield et al., 2008; Snellen et al., 2008, 2010; Bean et al., 2010; Jordán et al., 2013; Danielski et al., 2014; Nikolov et al., 2016). Most transmission spectroscopy studies to date have targeted gas giant worlds due to their larger expected signatures, which scale with the planet’s atmospheric scale height. During the next two decades, and thanks to the next generation of ground- and space-based observatories, the technique is expected to also be a major source of information on the atmospheres of rocky exoplanets.
Transmission spectroscopy relies on a precise understanding of the wavelength-dependent brightness of the star being occulted. However, stars are not homogeneous, constant light sources but have temporally evolving photospheres and chromospheres with inhomogeneities like spots, faculae, and plages (e.g., Berdyugina, 2005). The surface features of the star change both intrinsically as active regions evolve and from the perspective of an observer as the star rotates. Spots and faculae have different temperatures from the disk-averaged photosphere, and for cooler stars, can have molecular features distinct from the star itself but similar to those in a planet’s atmosphere, including H2O (Wöhl, 1971), TiO (Neff et al., 1995), and other molecules (Berdyugina et al., 2003). Some studies have found that the signal from stellar inhomogeneities can exceed the signal from the planetary spectral features (e.g., Rackham et al., 2018, 2019). In particular, small exoplanets—mini-Neptunes and rocky planets—around M-dwarf host stars are susceptible to this “transit light source effect.” To make the most of transit studies from current NASA facilities like HST and JWST, it is essential we quantify the impact of stellar contamination on transmission spectroscopy and develop methods to mitigate for it.
1.1.1 Relevance to Astro2020
This topic is directly relevant to the first science theme identified in the Astro2020 Decadal Survey, Worlds and Suns in Context, and its priority area, Pathways to Habitable Worlds. Before the launch in the 2040s of capable of directly imaging Earth-like worlds, transit observations will provide our best pathway to identifying and studying rocky exoplanets, including potentially habitable ones. These will necessarily transit cool dwarfs, which tend to remain active long after their formation and possess heterogeneous photospheres. Even with the advanced direct-imaging capabilities enabled by , transit observations will remain a critical tool in the study of exoplanetary atmospheres, as emphasized by the LUVOIR and HabEx Mission Concept Study Final Reports (The LUVOIR Team, 2019; Gaudi et al., 2020). Thus, the topic of SAG21 is especially relevant to NASA’s science priorities in the next two decades and beyond.
1.2 Goals of SAG21
This SAG brought together an interdisciplinary team of scientists, with observers and theorists from the heliophysics, stellar astrophysics, planetary science, and exoplanetary atmosphere research communities to address both the impact of stellar contamination on transmission spectra and constraints on stellar photospheric heterogeneity enabled by transiting exoplanets.
SAG21 has six goals:
-
1.
Report on what effect stellar contamination could have on future space-based transmission spectroscopy measurements;
-
2.
Identify regions of the parameter space in which care should be exercised with respect to stellar contamination in the context of transmission spectroscopy studies;
-
3.
Identify measures that can be taken to understand the magnitude of stellar contamination;
-
4.
Identify what modeling efforts can further our understanding of stellar contamination;
-
5.
Develop methods to identify measurements that might be contaminated; and
-
6.
Pinpoint complementary observations that can be combined with transmission spectroscopy to mitigate or correct for stellar contamination.
1.3 Methods
1.3.1 Soliciting contributions
The SAG21 co-chairs solicited members for the group via open calls for members to the ExoPAG newsletter and other email listserves, social media sites, presentations at ExoPAG meetings, and direct communications to researchers with relevant expertise. In total, 122 people joined the dedicated email list for SAG21, and the group ultimately included more than 60 active participants that contributed to the discussion in some form.
1.3.2 Subgroups
Given the large interest from the community, we divided the analysis of SAG21 into five thematic areas and formed subgroups with relevant expertise to study each area. The subgroups studied the topics of:
-
1.
Stellar Photospheric & Chromospheric Heterogeneity,
-
2.
Unocculted Active Regions,
-
3.
Occulted Active Regions,
-
4.
Stellar & Planetary Retrievals, and
-
5.
Future Complementary Observations.
Each subgroup held roughly a dozen virtual meetings over the timespan of the SAG to refine the questions to be considered, assign member duties, discuss updates on the analysis, and decide on its final findings. Subgroup leads met with the SAG21 co-chairs monthly to share and discuss progress. Significant conversations also took place on public channels of SAG21’s dedicated Slack Workspace. The detailed scopes of these groups are defined in their corresponding .
1.3.3 SAG21 Community Symposium
SAG21 also hosted a two-day virtual community symposium over Zoom on 8–9 Mar 2021 to share preliminary results from the analysis and solicit feedback from the wider community. The meeting included five overview presentations on the analysis from subgroup leads as well as 21 contributed community talks on subjects relevant to the SAG. In total, the symposium brought together roughly 110 attendees, including 46 active participants in question-and-answer sessions. The recordings of all talks are available on the SAG21 Community Symposium Website222https://sites.google.com/view/sag21symposium.
1.3.4 Final report
Considering the analysis of the subgroups and inputs from the community symposium, each subgroup prepared a draft report in mid-2021 outlining their top-level findings and the analysis that lead to them. Each chapter was then reviewed by at least three members from other subgroups, who provided detailed feedback that the original subgroup leads later addressed. The entire report was then thoroughly edited by the SAG21 co-chairs with an eye towards consistency, logical ordering of ideas between subgroups, and relevance to the scope of SAG21. The report was then shared again among all members for a final round of feedback and, after minor revisions, submitted to NASA and posted on the arXiv .
1.4 The tructure of this
structure of this follows that of SAG21 itself, with dedicated to the work of each subgroup. In each , we introduce the scope of the analysis and the individual topics we studied. We then present the information on each topic we considered in reaching a .
2 Stellar Photospheric & Chromospheric Heterogeneity
Essential uestions:
-
1.
What do we know about solar and stellar photospheric and chromospheric heterogeneities (PCH)?
-
2.
Which properties of photospheric and chromospheric heterogeneities are of relevance to exoplanet transit spectroscopy?
-
3.
How can the knowledge of the Sun help to constrain such PCH properties?
-
4.
Which of these PCH properties can be constrained by stellar observations? Which observations are the most useful (photometry, spectroscopy, X-ray, etc.)?
-
5.
Which of these PCH properties can be constrained using advanced MHD and HD simulations (magnetic and hydrodynamic)?
-
6.
How do stellar fundamental parameters influence PCH?
-
7.
What is known about PCH of high-priority exoplanet host stars?
-
8.
Which PCH properties of the known host stars are critical for the characterization of exoplanetary atmospheres?
2.1 Introduction
From high-spatial-resolution observations of the Sun we know that the solar atmosphere is anything but homogeneous . The main sources of the heterogeneities in the solar photosphere and chromosphere are due to the plasma flows and magnetic fields as well as the interplay between them . Observations suggest that such heterogeneities are also present in the atmospheres of other stars . They manifest themselves via, e.g., photometric and spectral variability .
When a planet transits a star, such heterogeneities lead to a background spectral signal and temporal modulation on the transit light curve, contaminating the transmission spectrum . The magnitude of the contamination is defined by the brightness contrasts and the fractional areas of various magnetic features and their fine structure . From solar observations, we know that the contrast between different solar structures is strongly wavelength dependent . Consequently, the underlying stellar transmission spectrum depends on the wavelength and can, thus, hide or mimic a genuine planetary atmospheric signal .
To distinguish between planetary and stellar signals we must observe and model the contribution of stellar heterogeneities to transmission spectra. In particular, we need to understand the dependence of the stellar signal as a function of wavelength . Modeling requires accurate knowledge of properties of various stellar features on stars with different fundamental parameters and magnetic activity levels.
The main goal of this is to summarize current knowledge, ongoing work, and limits in our understanding of stellar heterogeneities that is of relevance for transmission spectroscopy. In particular, the focus here is given to the optical and near infrared (NIR), given the relevance of these wavelengths to the topic of this : the “stellar contamination" of transmission spectra (Rackham et al., 2018, 2019). We begin in Section 2.2 by introducing observations and modeling efforts to understand the star for which we can obtain arguably the most detailed information about these heterogeneities: the Sun, together with examples of olar ystem planetary transits of the Sun-as-a-star. We then introduce simulations of surface structures on other stars in Section 2.3. We conclude this by discussing observations of stars other than our Sun in Section 2.4.
2.2 The Sun: a prime window to understand stellar heterogeneities
| Satellite | Instrument | Aperture | Wavelength | Deconvolved | Reference | |
|---|---|---|---|---|---|---|
| SDO | HMI | 14 cm | 617.3 nm | 4.0 % | 12.2 % | Yeo et al. (2014a) |
| Hinode | SOT/SP | 50 cm | 630.0 nm | 7.0 % | 14.4 % | Danilovic et al. (2008) |
| Hinode | SOT/BFI | 50 cm | 450.5 nm | 12.8 % | 26.7 % | Wedemeyer-Böhm & Rouppe van der Voort (2009) |
| 555.0 nm | 8.3 % | 19.4 % | ||||
| 668.4 nm | 6.2 % | 16.6 % |
Stellar heterogeneities in our Sun have been observed by the unaided eye at least since 800 BC, when dark spots—today known as “sunspots"—were seen to sporadically appear on the solar disk as reported by East Asian sunspot sightings (Stephenson, 1990). The advent of telescopes in the 1600s allowed for a much more detailed and systematic analysis of these features, which Galileo Galilei interpreted as surface features on the (spherical) Sun (see, e.g., Casanovas, 1997). Later observations confirmed these early explanations and, in fact, extended the diversity of solar surface heterogeneities beyond these first noticed dark spots.
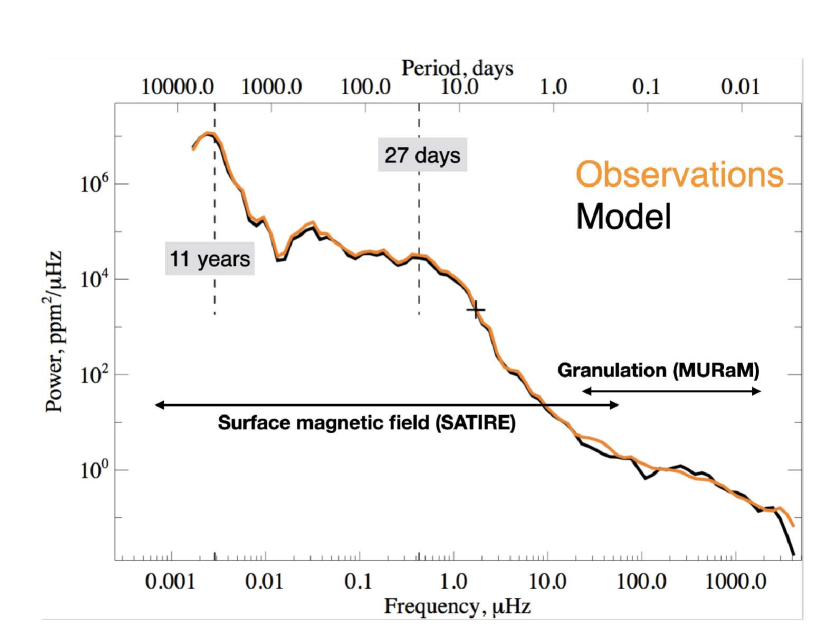
Solar (and, by extension, stellar) atmospheric heterogeneities are now understood, in general, arise from both plasma-motiondriven processes and magneticfield processes. The former features are generated by a constantly evolving cellular granulation pattern on the visible solar surface, accompanied by oscillations dominating within a rather narrow frequency interval. Surface magnetic structures, on the other hand, are driven by evolution of small-scale magnetic (a.k.a. “bright") features and spot-like magnetic (a.k.a. “dark") features. Both plasma-motion and magneticdriven processes have distinct properties, e.g., the time-scales on which they are observed to act. While plasma-motiondriven features seem to impact various solar observables (e.g., the total solar irradiance TSI) on timescales of minutes to hours (Solanki & Unruh, 2013), solar magnetic features give rise to longer time-scale variations, ranging from hours to years (Shapiro et al., 2017, see Figure 1). Even though some properties of these two main processes, such as timescales and flux variations at certain wavelengths, might not seem to depend on each other (see, e.g., Bastien et al., 2013), they are physically related to one another as plasma-driven motions are inherently impacted by magnetic processes and vice versa (e.g., Stein, 2012). Distinct spatial and wavelength-dependant signatures of these processes and their modeling are reviewed in this .
In the following sub-subsections, we summarize observed and modeled properties of solar surface plasma-motion and magnetic field structures and processes relevant for transmission spectroscopy, together with examples of Mercury and Venus transits of the Sun-as-a-star.
2.2.1 Solar granulation and oscillations
Brightness variations due to granulation and oscillations in the Sun are important for understanding their influence on transit spectroscopy studies, since the time-scales on which they occur are similar to those of transit events (minutes to hours). Also, to date, the Sun is the only star on which we can spatially resolve these features in detail, so our host star is key to understanding the properties and main mechanisms driving them. Solar granulation and oscillations are believed to be reasonably well understood for the Sun.
The granulation brightness fluctuations are driven by intensity variations of hot, bright (up-welling) granules and cool, dark (down-flowing) inter-granular lanes . The contrast between these features is typically measured through the mean-normalized RMS of the intensity fluctuations within an area/image of the Sun taken at a given wavelength or a bandpass.
The true RMS contrast of granulation, as seen in broad-band or continuum images of very quiet regions of the Sun, has been the subject of debates for decades, mainly because of the great disparity of results from early 3D hydrodynamic simulations and observations. Observations with the space-borne Hinode Solar Optical Telescope (SOT, Tsuneta et al., 2008) show 7.0 % intensity contrasts at 630 nm (Danilovic et al., 2008). Employing the highest spatial resolution simulations and convolving with SOT’s point spread function, which is believed to be well known, Danilovic et al. (2008) showed that the simulated 14.4 % at 630 nm was degraded to close to the observed 7.0 %. Wedemeyer-Böhm & Rouppe van der Voort (2009) measured contrast values of %, %, and % at disc-center for the blue, green, and red continuum, respectively using the Broadband Filter Imager (BFI) of SOT. These values translate to %, %, and % for the blue, green, and red continuum, respectively, when deconvolving the images with the appropriate . The filters were centered at 450.45 nm, 555.05 nm, and 668.40 nm, respectively. Consequently, there is now good agreement between simulations and deconvolved resolved granulation observations, which both can be considered to yield the true intensity contrast of the granular structure on the surface of the Sun. Table 1 gives a summary of these values.
These measurements show a strong decrease of the granule contrast towards longer wavelengths, which translates into smaller amplitudes of the time-dependent RMS brightness variability at longer wavelengths. Such a contrast decrease was also observed to occur towards infrared wavelengths and was shown to strongly depend on the solar limb distance and location, with the smallest contrast near the limb (see, e.g., Sánchez Cuberes et al., 2003, and references therein). This occurs because these intensity variations track temperature fluctuations: when assuming a blackbody spectrum for the granulation, its contrast and variation amplitudes are reduced at longer wavelengths. A similar argument can be made for oscillations, whose brightness fluctuation amplitudes are expected to strongly decrease with wavelength as well (; see, e.g., Kjeldsen & Bedding, 2011; Samadi et al., 2012).
In contrast to granulation, solar oscillations demonstrate much smaller brightness variability amplitudes on their time-scales (on the order of minutes). A full-disk RMS variability measurement over eight-hour time-scales of about parts-per-million (ppm) were measured by the Solar and Heliospheric Observatory (SOHO) using the Variability of solar IRradiance and Gravity Oscillations (VIRGO; Frohlich et al., 1997) instrument (Bastien et al., 2013). Also, variability of the solar reflected light from Neptune of the order of several ppm (e.g., Gaulme et al., 2016, and references therein).
Given the level of brightness fluctuations and their dependence on the wavelength discussed above, it might follow that if other stars behaved like our Sun, granulation and oscillations may not be an important part of the budget for stellar contamination in the transmission spectrum of planets orbiting Sun-like stars in the infrared. Rather, the impact of these processes could be a simple noise contribution (a.k.a. “jitter") to the transit light-curves themselves. However, we still lack multi-wavelength and precise center-to-limb variation measurements of this effect on the Sun in order to make a concrete assessment of how important this effect could be as a contamination source in transmission spectra from UV () to near-infrared wavelengths (), which are relevant for transit studies with present and future space-based observatories. In particular, some studies (e.g. Chiavassa et al., 2017) do suggest that granulation could become an important effect for EarthSun transiting exoplanet analogues. We discuss this in the light of current knowledge on granulation and oscillations for other stars in Section 2.4.
2.2.2 Small-scale magnetic heterogeneities: aculae, network, inter-network and mixed-polarity magnetic fields (bright features)
Faculae, from the Latin “torch”, are small-scale concentrations of bright patchy features with diameters of about 100–400 km, often found in the vicinity of sunspots in inter-granular spaces. The term faculae refers to the brightening observed in the photosphere; at disc center they appear as magnetic bright points. Their counterparts in the chromosphere (e.g., observed in Ca ii H and K lines) are called plages. On the Sun, faculae and plages are typically found in magnetic active regions emerging within the latitudinal activity belts. A larger pattern of bright small-scale magnetic fields appears at borders of supergranular cells, as magnetic flux is swept toward the cell boundaries by convective horizontal flows. These concentrations form the magnetic network which is distributed almost uniformly across the solar disk, at any latitude and longitude. Thus, faculae, plage, and network heterogeneities are manifestations of photospheric and chromospheric small-scale magnetic fields which are not strong enough to form sunspots (Babcock & Babcock, 1955; Kiepenheuer, 1953; Solanki, 1993). Here we summarize the main characteristics of these magnetic bright features, focusing on the aspects most relevant to exoplanet transit spectroscopy.
Solar observations at high spatial resolution (sub-arcsecond, corresponding to a few hundred kilometers on the solar surface) reveal that faculae are conglomerates of small features associated with kilogauss magnetic field concentrations . Both high- (sub-arcsec) (e.g. Berger et al., 2007; Kobel et al., 2011; Romano et al., 2012; Kahil et al., 2017; Buehler et al., 2019) and medium- (arcsec) (e.g. Ortiz et al., 2002; Yeo et al., 2013; Criscuoli et al., 2017; Chatzistergos et al., 2019b) resolution observations indicate that the radiative properties of faculae depend on their size, magnetic flux, degree of aggregation, wavelength, and position on the solar disk.
In the visible continuum, faculae are about 5–10% brighter than the quiet Sun when observed close to the limb, while they are almost indistinguishable from the quiet photosphere, if not slightly darker, when observed close to the disk center (Unruh et al., 1999; Ahern & Chapman, 2000; Ermolli et al., 2007; Yeo et al., 2013). In the infrared, faculae appear darker than the surroundings .
Facular contrast reaches several tens of percent in the cores of strong Fraunhofer lines, e.g., in the chromospheric Ca ii H & K lines (e.g., Mehltretter, 1974; Walton et al., 2003; Rutten, 2007; Chatzistergos et al., 2019b) and H-alpha wings (Dunn & Zirker, 1973). A similar facular contrast is observed in certain molecular bands: the CN-band at 388 nm (Chapman, 1970; Sheeley, 1971; Zakharov et al., 2005), the G-band at 430 nm (Kitai & Muller, 1984; Berger & Title, 2001; Langhans et al., 2004; Hirzberger & Wiehr, 2005; Berger et al., 2007) and the UV OH band at 313 nm (Berdyugina et al., 2003; Hirzberger et al., 2010). The dependence of the facular contrast on the line-of-sight magnetic field was found to be logarithmic (Kahil et al., 2017). The center-to-limb variation (CLV) of the quiescent photosphere brightness is less steep than that of faculae (Walton et al., 2003; Ermolli et al., 2010).
etwork is also a manifestation of the photospheric magnetic field (e.g. Ortiz et al., 2002; Yeo et al., 2013; Criscuoli et al., 2017), and, unlike faculae, which either are located in active regions or result from the decay of active regions, network is present at any latitude and longitude. Network also results from the aggregation of small-size magnetic elements, which are transported by surface convective motion to the edges of super-granules, thus forming a typical lattice structure particularly clear in chromospheric images (e.g., in near-UV images ).
However, solar photometric measurements currently present two main difficulties. First, these measurements are affected by both finite spatial resolution and scattered light, which reduce the observed contrasts and affect the relation between physical and photometric properties. This problem affects both ground- (Toner et al., 1997; Criscuoli & Ermolli, 2008; Viticchié et al., 2010) and space-based observations (Mathew et al., 2007; Wedemeyer-Böhm & Rouppe van der Voort, 2009; Yeo et al., 2013). Second, measurements are made relative to the quiet Sun background, whose definition is somewhat arbitrary, thus creating ambiguity and discrepancies between results presented in the literature (Peck & Rast, 2015).
Moreover, the quiet Sun is not void of magnetic fields (see a review by Bellot Rubio & Orozco Suárez, 2019). Weaker, predominantly horizontal fields occur as inter-network features flowing towards the network at supergranular borders (Livingston & Harvey, 1971; Lites et al., 2008). Also, a large volume of mixed-polarity magnetic fields occur at scales which are unresolved with current instrumentation, but fortunately this rather hidden solar magnetism can be detected via the Hanle effect (Stenflo, 1982; Faurobert-Scholl, 1993; Stenflo et al., 1998; Berdyugina & Fluri, 2004; Trujillo Bueno et al., 2004; Kleint et al., 2011; Shapiro et al., 2011). Whether these quiet-Sun magnetic features vary with the solar cycle (Kleint et al., 2010) or affect variations of the solar irradiance (Faurobert et al., 2020; Rempel, 2020; Yeo et al., 2020) is still not fully understood. High spatial resolution as well as high photometric and polarimetric sensitivity are therefore essential to improve our understanding of how solar magnetism affects irradiance variability.
Future observations with the upcoming Daniel K. Inouye Solar Telescope (DKIST, Rimmele et al., 2020) will have unprecedented spatial and temporal resolution, complemented by observations with space missions, e.g., the Interface Region Imaging Spectrograph (IRIS) and the Atacama Large Millimeter/submillimeter Array (ALMA). These data are expected to improve our understanding of the physics that underlies the radiative emission of quiet and magnetic regions, especially those occurring in the chromosphere and corona. Coordinated observations of DKIST with the recently launched Solar Orbiter are expected to improve our knowledge on polar faculae, whose properties, due to the ecliptic position of the Earth, are still poorly understood (Petrie et al., 2021). These features have negligible effects on the solar irradiance received on the Earth, but they can play a major role for planets with orbits strongly inclined with respect to the rotation axis of the host star (Shapiro et al., 2016) or for stars with more abundant or stronger polar faculae. Observations with the upcoming Solar Ultraviolet Imaging Telescope (SUIT) onboard Aditya-L1 (Ghosh et al., 2016), , will provide critical information on the contrasts and the CLV of the magnetic features in the UV between 200 and 400 nm.
2.2.3 Spot-like magnetic heterogeneities: mbra, penumbra, pores (dark features)
Sunspots are the highest-contrast features in the solar photosphere visible in the optical and near-infrared. The largest sunspot in recent history was observed in April 1947 with an area of more than 6000 millionths of the solar hemisphere area (MHS). Spots ten times smaller are visible by the protected naked eye from the Earth. Spots larger than about 2000 MHS are regularly observed near solar activity maxima. These are several times larger than the Earth’s area. There are several reviews of the literature related to physical properties of sunspots (e.g., Solanki, 2003; Borrero & Ichimoto, 2011). Here, we will only consider sunspot properties relevant to exoplanet transmission spectroscopy, and will refer to only a few important results.
Because of a strong magnetic field, up to 6 , the bolometric intensity of sunspot umbra is 0.2–0.3 of that of the surrounding quiet (non-magnetic) photosphere, implying effective temperatures of 4000–4500 K. The intensity decreases with the umbral size (Mathew et al., 2007). An umbra larger than about 4000 km in diameter is usually (but not always) surrounded by a filamentary penumbra, which include both bright filaments and dark gaps and can be symmetric or partially asymmetric, depending on the spot complexity. The total spot area (including the penumbra) may exceed that of the umbra by up to a factor of five (e.g., Solanki, 2003). The penumbra’s bolometric contrast to the photosphere is about 0.8, i.e., its effective temperature is about 5500 K (average for bright filaments and dark gaps). A strongly inclined 0.5–1 kG magnetic field is responsible for the filamentary structure of the penumbra (Siu-Tapia et al., 2019). An umbra without a penumbra is known as a pore. Pores, which generally have relatively weak magnetic field strengths (Suetterlin, 1998), are often observed to merge together and form larger spots with penumbra and structures called light-bridges, outlining the previous pores. The brightness of light-bridges is similar to that of the penumbra.
The sunspot size distribution is log-normal (Bogdan et al., 1988), with smaller spots occurring more frequently. This implies that the sunspot emergence is a fragmentation process, possibly of a large flux-tube anchored in the convection zone. The largest sunspot in a group occupies more than half the total area of all spots in a group, while the number of individual umbrae within a given group, , increases with the group size as a power law (Mandal et al., 2021). By extrapolating their results to significantly bigger spot groups, like those observed on very active stars, Mandal et al. (2021) conclude that such groups may be composed of multiple spots, with the biggest spot in a group occupying 55–75% of the total group area. This, however, does not apply to spots formed by coalescence.
Sunspots exhibit various dynamic phenomena, such as magneto-convection, flows, oscillations, and short-term events. The umbral fine structure is best revealed in images taken in the passband centered at the TiO 706 nm molecular band (Berger & Berdyugina, 2003). Remnants of convection within the umbra are observed as umbral dots, bright features of 100 km or less in diameter. In the photosphere, the intensity of is significantly higher than that of the dark umbra, and their lifetimes span from minutes up to 2 hours (Beckers & Schröter, 1968; Adjabshirzadeh & Koutchmy, 1983; Sobotka et al., 1997a; Riethmüller et al., 2008; Watanabe, 2014; Kilcik et al., 2020). Longer-lasting tend to be larger and brighter. As was found by Sobotka & Hanslmeier (2005), observed intensities of correlate with local intensities of the umbral background. In terms of temperature, were found on average hotter than the coolest area in the umbra by about 1000 K and cooler than the undisturbed photosphere by 500–1000 K, while individual reached or even exceeded the average photospheric brightness and temperature. The density and brightness of umbral dots increase towards the umbral edge (Sobotka et al., 1997a; Yadav & Mathew, 2018), and the brightness may vary quasi-periodically on time-scales of 3–30 minutes (Sobotka et al., 1997b; Kilcik et al., 2020). Umbral dots extend up to the chromosphere where they are larger and more numerous (Kitai, 1986). The horizontal outflow observed in penumbra (the Evershed effect) is reversed in the chromosphere, becoming an inflow in the penumbra and downflow in the umbra. In addition, umbral flashes—sudden brightenings of the dark umbra—are observed in the upper atmosphere and reveal a further complexity of the dark umbra near the temperature minimum and lower chromosphere (Turova, 1984; Henriques et al., 2020). Short-lived brightenings in the penumbra are associated with chromospheric micro-jets (Katsukawa et al., 2007).
Sunspots constitute active regions that emerge with an 11-year solar cycle (22 years if accounting for a magnetic reversal). A typical active region consists of larger leading and smaller trailing spots, pores, and faculae. The lifetime of sunspots linearly increases with their maximum size (the GnevyshevWaldmeier rule). The decay rate is about 11 MHS/day (Petrovay & van Driel-Gesztelyi, 1997). This implies that most spots live less than a day, but larger ones can persist for months. It is not clear whether the sunspot lifetime and/or decay rate vary with the cycle. In the context of stellar and exoplanetary research, it is important to investigate cycle-dependent characteristics of sunspots and small-scale magnetic fields. This includes the contrast and relative areas of magnetic features and their spectral variations.
In view of this, a full-disk, synoptic capability is essential to achieve a comprehensive view of solar variability in all interlinked space and time domains. These domains include: global and temporal scales ranging from transient flare outbursts to cycle timescales; spatial structures we refer to as active regions as delineated by spots, faculae and plages; and field extrapolations into the corona and heliosphere that influence solar/stellar wind properties and, in turn, their potential impact on planetary atmospheres. The SOLIS (Synoptic Long-term Investigations of the Sun) facility of the is an example of an advanced instrument for global solar synoptic vector magnetic field investigations (Keller et al., 2003). A solar synoptic capability of this kind yields the partition of magnetic energy among the fundamental constituents of solar heterogeneity for the Sun-as-a-star on all time scales and, in conjunction with DKIST, at all relevant spatial scales. Full-disk synoptic observations, uniquely characterized by long-term stability and continuity, provide a fundamental database for the understanding of magnetic activity that is encountered in our olar ystem, the planetary systems around Sun-like stars and the extrapolation of the solar example to other kinds of stellar hosts.
2.2.4 Modeling solar observables
Modeling solar observables requires, on one hand, a solid knowledge on physics of radiation, plasma and magnetic processes and, on the other hand, accounting for instrumental degradation of the observed phenomena, especially for high-resolution imaging data.
From Table 1 and other observations, one can see that the uncorrected RMS contrast of granulation measured with space telescopes increases with increasing the telescope aperture, i.e., with increasing the spatial resolution. Thus, the distribution of the intensities is resolution dependent. At low spatial resolution, the intensities show a distinct bi-modal intensity distribution, reflecting the different intensities of (bright) granular and (dark) intergranular space. With increasing spatial resolution of simulations, the bi-modality of the intensity distribution becomes less pronounced. For ground-based observations, achieving true contrasts is even more challenging because of the constantly varying terrestrial atmosphere causing image distortions on time-scales shorter than the data acquisition rates. In addition to adaptive optics corrections during observations, post-processing of imaging data is carried out with various image restoration techniques to achieve the diffraction limit of the instrument. After that, deconvolution similar to that applied to space data may allow achieving true contrasts of observed features. Alternatively, simulated and modeled observables can be convoluted with known instrumentation effects to be compared with the data. Both approaches have uncertainties and removing observing biases are to be improved. Modeling solar irradiance variability modulated by surface magnetism and comparing this with measurements are important for (1) reconstructing the solar irradiance variability (Chapman et al., 2013; Chatzistergos et al., 2020a); (2) validating atmosphere models employed in solar irradiance reconstruction (Fontenla et al., 1993, 1999, 2006, 2009; Unruh et al., 1999; Penza et al., 2004; Ermolli et al., 2010); and (3) understanding relations observed between various magnetic-activity indices (Choudhary et al., 2020; Ayres, 2021; Clette, 2021).
Understanding the physics of faculae in terms of their magnetic structure, radiative transfer, and dynamic substructure is important for predicting their effects at different wavelengths. Here both realistic 3D simulations and a detailed modeling of opacities are of great importance. For example, Schüssler et al. (2003) showed why solar magnetic flux concentrations are bright in molecular bands using radiative magnetoconvection simulations and proper molecular opacities in the presence of magnetic fields by Berdyugina et al. (2003). This was followed by similar work by Keller et al. (2004), Steiner (2005), and De Pontieu et al. (2006).
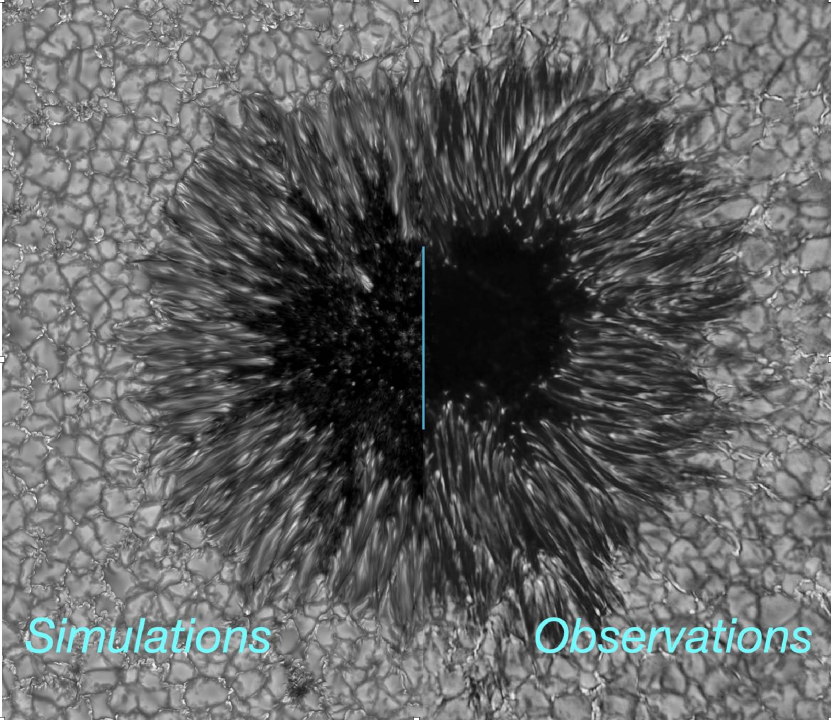
Similarly, understanding physics of sunspots and obtaining their realistic models is helpful for modeling starspot effects on other stars at different wavelengths. Rempel et al. (2009b) discussed the magnetoconvective processes that occur in a sunspot and provided the first insights into penumbral filament formation. Subsequently, Rempel et al. (2009a) simulated circular sunspots with full-fledged penumbrae that reached such levels of realism that the simulated intensity images were almost indistinguishable from observed structures (see Figure 3). However, physical drivers for forming sunspot penumbra are still not fully understood (Rempel, 2012).
The fine structure and large range of temperatures in sunspots results in a dramatic difference of their spectra as compared to that of the quiet photosphere. In particular, spectra of the dark umbra are similar to those of M dwarf’s quiet photospheres, with strong molecular bands from metal hydrides and oxides (e.g., MgH, CaH, FeH, CrH, SH, TiO, VO). In addition, CNO-based molecules (e.g., CH, NH, OH, CO, CN, C2) form in both the quiet photosphere and chromosphere as well as in sunspots (see an overview by Berdyugina, 2011). Magnetic effects in these molecules are currently well understood and implemented in the HotMol numerical library. They are employed for measuring and modeling magnetic fields on the Sun and other stars. Other molecules have been detected in sunspots in the near infrared, e.g., H2O (Wöhl, 1971; Polyansky et al., 1997). These molecular bands, along with strong atomic (resonance) lines, are spectral features that are being detected in exoplanetary atmospheres. Thus, modeling spectra of sunspot substructures is important for the decontamination of composite star-planet spectra.
2.2.5 Observations of Venus and Mercury transits of the Sun as a star
Photometric observations of exoplanets across their host stars contend with the many stellar-variability issues discussed here, including global oscillations, convection, granulation, magnetically active regions, and center-to-limb variations. In the case of the Sun, the spatially averaged variations due to oscillations, granulation, and convection cause variations in spatially and spectrally integrated light (Kopp, 2016). For comparison, the transit of the Earth across the solar disk viewed from a distant system would have a maximum transit depth of , and can thus be masked by the background solar variability.
Fortunately, the timescales of solar variability and planetary transits differ sufficiently that transits of Earth-sized planets across Sun-like stars would, in fact, be detectable since they affect different portions of the stellar light-curve power spectrum. Solar variability due to oscillations, convection, and granulation primarily occurs on timescales of several minutes, while active regions, such as sunspots and faculae, vary on multi-day timescales. In contrast, planetary transits occur on 1–10 hr timescales. This timescale difference makes the exoplanet detection of Earth-like planets across solar-like stars feasible via photometric observations.
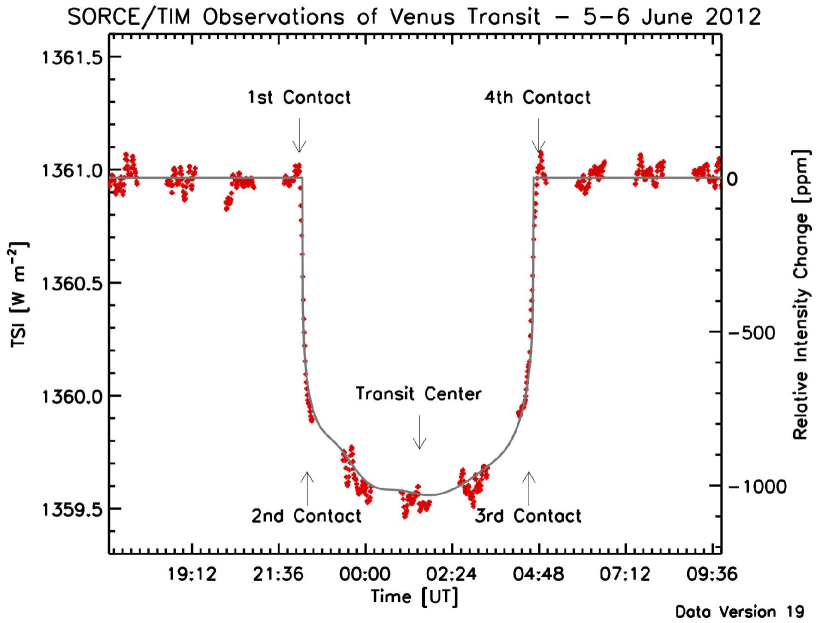
Observations of Mercury transits across the solar disk as viewed from the Earth demonstrate the difficulties in discovering small exoplanets orbiting G-type stars via photometric measurements of the stellar light curves during planetary transits. Four Mercury and two Venus transits have been observed by the Total Irradiance Monitor (TIM) on NASA’s Earth-orbiting (Kopp, 2021). This instrument measures the TSI, the spatially and spectrally integrated radiant solar energy flux incident at the top of the Earth’s atmosphere. This essentially views the Sun as a star. Instrument sensitivities are , making the TIM inherently capable of detecting both intrinsic solar variabilities and solar-disk transits by inner planets.
Viewed from the proximity of the Earth, Venus-transit light curves have large transit depths ( ), making such transits unambiguous from the smaller effects of background solar oscillations and convection. The TIM radiometric measurements of the 2012 Venus transit are shown in Figure 4. Even viewed from the Earth, Mercurial transits are much smaller. These have transit depths in integrated light, or approximately half the light-curve depth that an Earth-sized exoplanet would have when transiting a G-type star in a distant planetary system. These transits are largely masked by the ever-present background solar variability (see Figure 5).
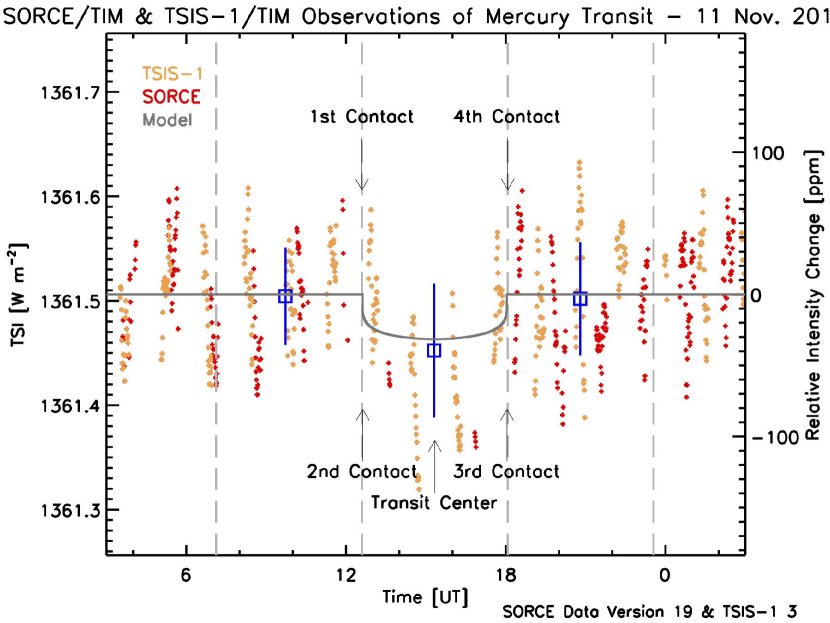
With such solar-variability masking, multiple transit observations are required for the unambiguous detection of an Earth-sized exoplanet across a solar-like star. Knowledge of the amplitudes and timescales of the host star’s intrinsic variability is also necessary for detecting small exoplanets via transits. Measurements of the Sun provide such knowledge for the most “Sun-like” star known, and actual radiometric transit observations of the Sun’s innermost planet, Mercury, exemplify the issues expected for exoplanet discoveries of Earth-sized planets across host G-type stars.
2.2.6 Our finding
From this analysis, we draw the following finding.
Finding 1.1
Summary:
The Sun provides the benchmark for stellar studies.
Studying the spatial, spectral, and temporal variations of stellar surface structures is necessary for understanding the impact of analogous structures on transmission spectroscopy of exoplanets.
Capability Needed:
More work is needed to study spatially resolved properties on timescales from minutes to years .
Capability Today:
High-resolution observations of the Sun are available for fine-structure studies of photospheric and chromospheric inhomogeneities, but their wavelength range is limited.
Advanced codes , such as the HotMol numerical library .
The total solar irradiance of the Sun can be modeled accurately with codes such as SATIRE and MURaM .
Three-dimensional (3D) magnetohydrodynamic (MHD) codes, such as MURaM , CO5BOLD , and Bifrost can be used to produce realistic simulations of the solar photosphere and chromosphere, including active regions and sunspots.
Mitigation in Progress:
When fully operational, DKIST will have unprecedented spatial and temporal resolution for observations of the solar photosphere and chromosphere at wavelengths of 0.4–5 .
The augmentation of DKIST observations with full-disk, synoptic observations, such as those from SOLIS , will provide a global context that is continuous in space and time and, with DKIST observations, will extend across all relevant spatial scales.
This complementary approach will yield a comprehensive view of solar activity and, by extension, the magnetic activity in un-like hosts of planetary systems.
| Code | Teff [K] | log g | [Fe/H] | Papers |
|---|---|---|---|---|
| STAGGER | 4185–6901 | 2.2–4.74 | 0.0 | Stein & Nordlund (1998); Trampedach et al. (2013) |
| 4000–7000 | 1.5–5.00 | -4.0–0.5 | Magic et al. (2013) | |
| C5BOLD | 3600–6750 | 1.0–5.0 | -3,-2,-1,0 | Ludwig et al. (2009) Freytag et al. (2012) |
| MURaM | 3690–6893 | 4.3–4.826 | 0.0 | Vögler et al. (2005); Rempel et al. (2009b); Beeck et al. (2011, 2013a, 2013b) |
2.3 3D tellar modeling: from the Sun to other stars
Since the first time-dependent 3D simulations of the Sun (e.g., Nordlund, 1982, 1984, 1985) and other stars (e.g., Atroshchenko et al., 1989a, b; Nordlund & Dravins, 1990; Dravins & Nordlund, 1990a, b), stellar 3D models have been improved in terms of the spatial resolution of the numerical grid, the extent of the computational box, and the included physical processes. As all these improvements compete for limited computational resources, some models are geared towards either high resolution or covering large spatial scales (even up to global simulations of giant stars, Freytag et al., 2002). Others aim for a high degree of realism by including as many of the relevant physical processes as possible. The extension from pure hydrodynamics to ideal magnetohydrodynamics for 3D models of the lower solar atmosphere was a costly but necessary step in the early 2000s. Today, considered standard for solar simulations and increasingly applied to simulations of other stars.
The selected compromise between number of grid cells and included physics is typically determined by the intended scientific application. For instance, simulations of sunspots or even active regions require large computational boxes, but the minimum spatial resolution of the computational grid is constrained by the spatial scales that need to be resolved adequately, e.g., for realistically reproducing the photospheric flow field. The resulting number of grid cells then limits the detail and extent to which physical processes can be modeled. Another example is the extension of models in height into the chromosphere or even the corona. In these layers, many assumptions that can be made for photospheric conditions are no longer valid. For instance, the ionisation of hydrogen is no longer in statistical equilibrium and instead requires detailed calculations that are computationally expensive (Carlsson & Stein, 2002; Leenaarts & Wedemeyer-Böhm, 2006; Leenaarts et al., 2007) despite using simplified model atoms. Nonetheless, these improvements are necessary for realistic simulations of the upper atmosphere and thus for the interpretation of spectral lines and phenomena originating in these layers. An example is the widely used 3D model of an enhanced network region by Carlsson et al. (2016) that has been produced with the Bifrost code. Depending on the exact application, even otherwise seemingly quiescent conditions in the solar photosphere can require models with a high degree of realism. This is because small-scale variations of the atmospheric structure in a line-forming layer and its dynamical (and magnetic) properties can have a notable impact on the resulting spectral line shapes. For instance, 3D simulations have resulted in the more precise determination of chemical abundances (see, e.g., Steffen & Holweger, 2002; Asplund et al., 2009, 2005) and insights into the formation of the H line in the solar chromosphere (Leenaarts et al., 2012).
In the context of observing the atmospheres of exoplanets, numerical simulations of the atmospheres of host stars can support the interpretation of such observations and can also aid the design of adequate observing and data reduction strategies. The first step towards producing numerical simulations for this purpose is thus to define the wanted spectral diagnostics and the required precision of the anticipated measurements. These requirements then determine the needed setup and degree of realism of the simulations. The second step is to see how to produce these models based on already existing models (discussion in the following sections). It should be emphasised that the production of advanced 3D numerical simulations of stellar atmospheres is a computationally very expensive endeavour that requires much computational time on high-performance-computing infrastructure. Substantial resources are thus needed as an integral part of the preparatory phase of the scientific strategy outlined here.
In the following sections, we detail the available state-of-the-art non-magnetic and magnetohydrodynamic 3D model grids (Section 2.3.1) and modeling considerations as they relate to heterogeneities due to plasma motion (granulation and oscillations, Section 2.3.2), small-scale bright magnetic features (faculae and network, Section 2.3.3), and dark spot-like magnetic heterogeneities (umbra, penumbra, and pores, Section 2.3.4).
2.3.1 Available non-magnetic model grids
Systematic grids of local 3D model stellar atmospheres have been produced with several radiation (magneto-)hydrodynamics (MHD) codes. The main codes used to produce grids of non-magnetic models for studying stellar near-surface convection are STAGGER (Stein & Nordlund, 1998; Magic et al., 2013; Trampedach et al., 2013), C5BOLD, and MURaM. Table 2 lists the range of spectral types, surface gravities, and metallicities covered by some of the prominent model grids. We refer the reader to Beeck et al. (2012) for a detailed comparison of the codes. Naturally, all three listed codes have been also used in numerous studies, sometimes simulating stellar atmospheres outside the listed grids. For example, C5BOLD has been used to simulate M stars with effective temperatures down to 2500 K (Wende et al., 2009; Wedemeyer et al., 2013). These model grids are complemented by small grids of local, three-dimensional stellar atmospheres including magnetic fields (Beeck et al., 2015a, b; Salhab et al., 2018) and 3D MHD models of M-dwarf atmospheres with a chromosphere (Wedemeyer et al., 2013).
In sum, there exists today a large range of 3D stellar non-magnetic models ready for future analysis. The grids cover main-sequence stars with (Table 2), spanning the parameters of exoplanet host stars333.
However, the models include varying degrees of realism in terms of setup, metallicity, the inclusion of an upper atmosphere, and more. Unfortunately, these models do not yet include the effect of magnetic fields and simulations of stellar magnetic features are currently only available for several values of effective temperature (see Section 2.3.3–2.3.4). The simulations of magnetic features on stars with a wide range of effective temperatures, metallicities, and surface gravities are urgently needed for assessing the magnetic component of stellar contamination of transmission spectra. are ready to serve as the basis for the production of models in the context of exoplanet observations, given sufficient investments in the computational and human resources required for these efforts.
2.3.2 Granulation and oscillations in stellar models
Granulation.
The intensity contrast of granules defines the amplitude of the granulation-driven contamination of the transmission spectrum and, thus, its accurate modeling for a broad class of stars is of special importance.
The first 3D simulations of granulation on the Sun were done by Nordlund (1982, 1984, 1985). Soon after that, Nordlund & Dravins (1990) extended the solar simulations to other Sun-like stars: Procyon F5 IVV, Cen A G2V, Hyi G2IV, and Cen B K1V (Teff between 5200K and 6600 K), and further computed synthetic Fe line profiles and their bisectors to compare with observations. These early simulations established the strong dependence of granular velocity, lifetimes, and size on the spectral type.
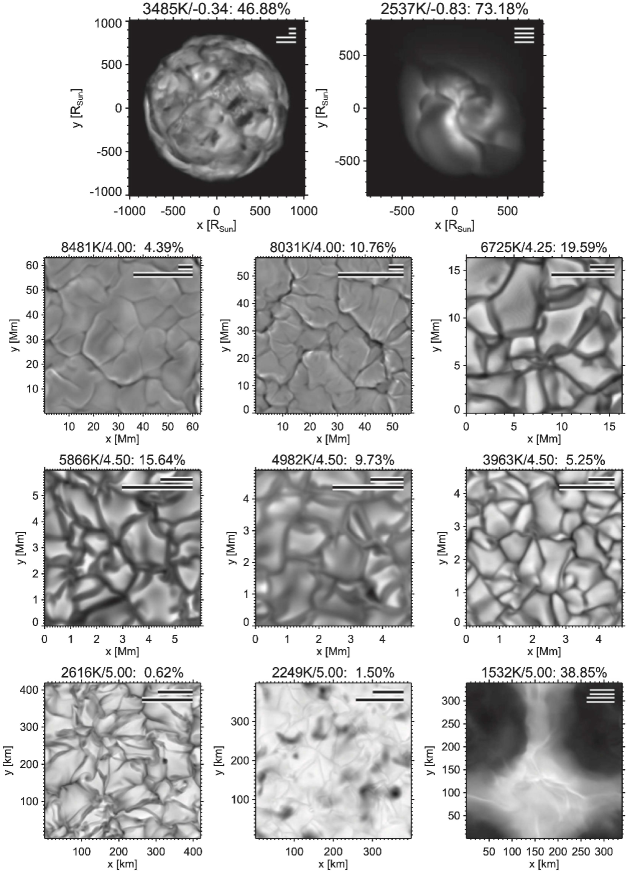
Figure 6 shows examples of granulation on stellar surfaces as bolometric intensity maps with the RMS intensity contrast given in each frame. .
For a solar effective temperature and surface gravity, the RMS contrast increases with decreasing metallicity (Magic et al., 2013; Witzke et al., 2023). The RMS granular contrast over a wide range of effective temperatures, surface gravities, and metallicities is given by Tremblay et al. (2013). They find that the intensity contrast correlates well with the Mach number, at the stellar surface over the full range of the HR diagram. This reflects the fact that both the Mach number and the intensity contrast are a measure of the vigor of convection.
The key points from these studies are as follows.
-
1.
The temperature contrast, and therefore intensity contrast, between granules and intergranular lanes depends strongly on the stellar surface temperature. Hotter stars have higher temperature contrast. The temperature contrast is weakly dependent on metallicity.
-
2.
Granule size increases with temperature and decreases with surface gravity. Thus, hotter stars with lower surface gravities have larger granules than cooler stars with higher surface gravities. In cooler stars with very low surface gravities (e.g., supergiants), granule sizes can be comparable to the stellar radius. Like the temperature contrast, granule size also shows a weak dependence on metallicity. At the same surface temperature, decreasing the metallicity results in smaller granules.
Oscillations.
Predicting the amplitudes of oscillations on other stars remains challenging (see, e.g., Aerts, 2021, for a recent review). Instead, a number of scaling relations using fundamental stellar properties have been proposed (Kjeldsen & Bedding, 2011; Samadi et al., 2012). For example, Kjeldsen & Bedding (2011) suggested
| (1) |
for velocity amplitudes, and
| (2) |
for intensity amplitudes observed at a typical wavelength . Here and refer to luminosity, mass, effective temperature, and mode lifetime, respectively. The exponent takes slightly different values in literature (see Kjeldsen & Bedding, 2011, and references therein). The second scaling relation has been extensively tested and modified based on Kepler data (e.g., Stello et al., 2011; Huber et al., 2011; Mosser et al., 2012; Corsaro et al., 2013; Kallinger et al., 2014). The oscillation amplitudes were later found to be also metallicity dependent by Yu et al. (2018) and Vrard et al. (2018). These studies showed that, all else being equal, metal-rich stars tend to have larger oscillation amplitudes, in agreement with theoretical predictions (Houdek et al., 1999; Samadi et al., 2010a, b).
These scaling relations have been used to estimate the significance of oscillation signals against granulation background and noise to prioritise the asteroseismic target selection for the Kepler, K2, and space missions (Chaplin et al., 2011a, 2015; Schofield et al., 2019). These efforts have shown that the photometric oscillation amplitudes are very low compared to granulation and noise levels in the Fourier spectra of late K- and M-type main-sequence stars.
2.3.3 Faculae and network in 3D stellar models
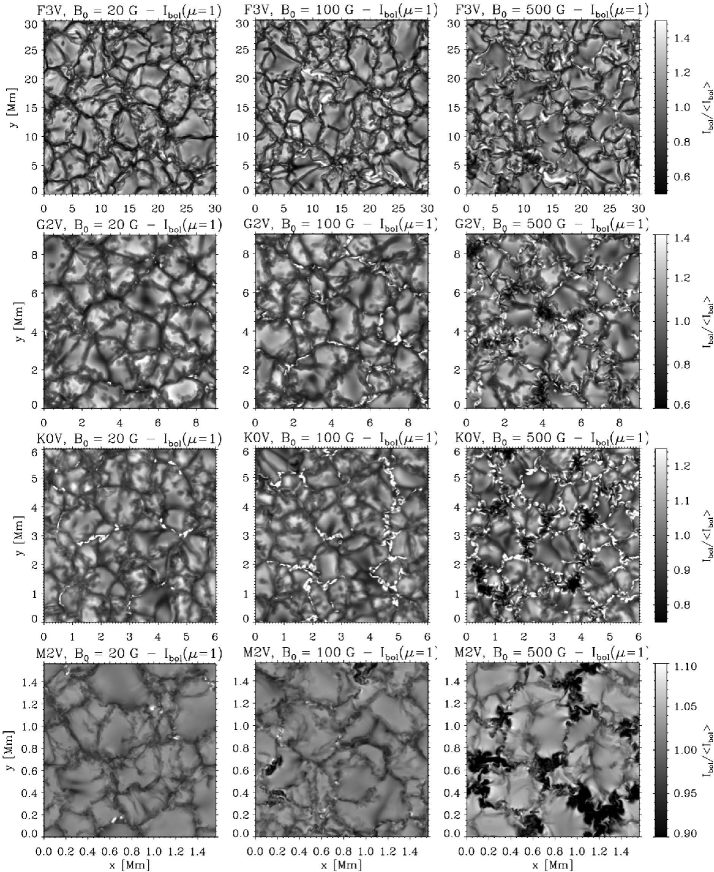
Although hydrodynamic simulations of near-surface granulation have been achieved by a number of groups, only two codes have been used to simulate magnetic fields on stars other than the Sun—MURaM (Beeck et al., 2011, 2015a, 2015b) and CO5BOLD (Steiner et al., 2014; Salhab et al., 2018). The MURaM papers covered the spectral types F3V, G2V, K0V, K5V, M0V, and M2V, while the CO5BOLD ones covered the types F5V, G2V, K2V and K8V. In both cases, the authors computed network or facular fields, starting with vertical homogeneous fields as an initial condition. Salhab et al. (2018) used an initial strength of 50 Gauss for all of the runs, while Beeck et al. (2011, 2015a, 2015b) used initial strengths of 20, 100 and 500 Gauss.
Figure 7 shows the bolometric intensity maps of models computed by Beeck et al. (2015a). The F-, G- and K-type models show the typical bright magnetic elements familiar from solar network and plage regions. Only when the initial magnetic field strength is taken to be a copious 500 G do a few dark features appear among the mostly bright magnetic structures. In contrast, in the M2V star (and in the M0V star—not shown in Figure 7), dark magnetic structures frequently form in the 100 G runs. In the 500 G runs, however, large dark structures dominate, and there are essentially no bright magnetic structures left.
One remarkable behavior of the magnetic flux concentrations that form in these simulations is that their magnetic field strength measured at the surface with mean visible optical depth of unity ) is only weakly dependent on stellar spectral type and initial magnetic field strength (for fixed solar surface gravity and metallicity). It increases towards later spectral types, from 1250 G for the F5V to 1440 G for K8V (Salhab et al., 2018), and increases with increasingly available magnetic flux (Beeck et al., 2015a) but remains in the range of kG field strength.
Steiner et al. (2014) and Salhab et al. (2018) found that the presence of small-scale magnetism (e.g., ) increases the bolometric intensity and flux in all their investigated models compared with equivalent magnetic field-free models. The surplus in radiative flux of the magnetic over the magnetic field-free atmosphere increases with increasing effective temperature, , from 0.47% for spectral type K8V to 1.05% for the solar model, but decreases again for effective temperatures greater than solar. This agrees with the results of Beeck et al. (2015a), as shown in Figure 7. Thus, for mean magnetic flux densities of approximately 50 G, we expect the small-scale magnetism of stars with spectral types F5V—K8V to produce a positive contribution to their bolometric luminosity (see also Bhatia et al., 2021, for the first simulations of small-scale dynamo in stars of various spectral classes). While the overall effective temperature changes in the presence of small-scale magnetic features can be small, the flux increases are strongly wavelength dependent, with particularly strong enhancement in the UV. The enhancement also depends strongly on the disk position so that magnetic activity is expected to noticeably affect center-to-limb variations of emergent intensity.
All the simulations described above have been performed for the solar value of the metallicity. However, metallicity has a strong effect on the opacity so that one can expect that the visibility of facular features strongly depends on the metallicity (Witzke et al., 2018, 2020). Furthermore, most hot Jupiters are discovered around stars with a higher metallicity than the Sun (e.g., Osborn & Bayliss, 2020). All in all, accounting for a metallicity effect on magnetic features is crucial for a proper characterisation of magnetic contamination and, thus, 3D MHD simulations of magnetised stellar atmospheres for a broad range of metallicities are urgently needed.
The key points from these studies are as follows.
-
1.
The presence of small-scale magnetic fields on stellar surfaces leads to the formation of network and faculae, which can lead to strong signals in transmission spectra.
-
2.
Small-scale magnetic features typical of network and faculae (plage) may be both bright and dark, depending on the spectral type of the star. In M stars, very few bright form and the change in radiative flux is largely dominated by the darker magnetic features.
-
3.
Currently very little is known about the effect of metallicity on the facular contrast. While simplified 1D modeling indicates that facular contrasts might strongly depend on the metallicity (Witzke et al., 2018, 2020), a more realistic 3D MHD modeling of faculae on stars with different metallicities is urgently needed.
2.3.4 Umbra, penumbra and pores in stellar models
Models featuring spots have attained increasing levels of realism in the last decade (e.g., Rempel et al., 2009a, b; Rempel, 2012). Building upon the first 3D sunspot simulation in a slab geometry using the MURaM code (Rempel et al., 2009b), the current state-of-the-art MHD simulations with the MURaM code produce sunspot intensity images, complete with expansive penumbral filaments that are often indistinguishable from observations (see, e.g., Figure 3).
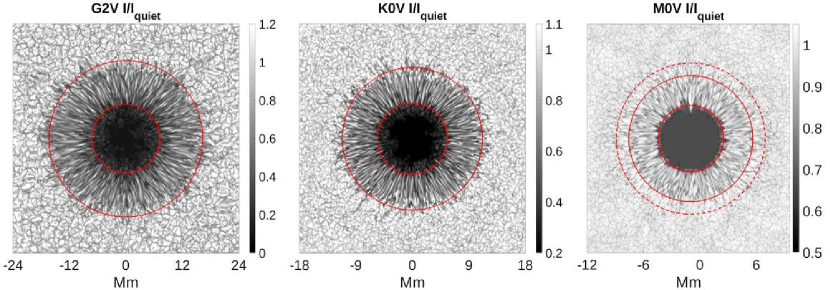
Turning to stars other than the Sun, Panja et al. (2020) recently conducted the first radiative magnetohydrodynamic simulations of spots, focusing on their umbral properties. They modeled G2V, K0V, and M0V stars and found the temperature contrast between the umbra and the surrounding photosphere to be around 1400 K for the G2V star, 650 K for the K0V star and 350 K for the M0V star. The umbral bolometric intensities relative to the quiet star intensities are 0.3, 0.5 and 0.7 for the G2V, K0V and M0V stars, respectively. The umbral magnetic field strengths are all in the range 3 to 4.5 kG. These simulations focused on the umbra; however, spots on the Sun are known to be dominated by the penumbra, with a typical umbra:penumbra areal ratio on the Sun of 1:4 (Solanki, 2003). Due to the slab geometry chosen by Panja et al. (2020) to keep computing costs manageable, the penumbra is underrepresented in these simulations. Future studies will expand on this work to understand the properties of spots with expansive penumbral filaments (Figure 8 shows such simulated spots for the spectral types G2V, K0V and M0V), including intensity contrasts of spots at different wavelengths and different disk positions (Panja et. al, in prep.).
The key points from these studies are as follows.
-
1.
Modern 3D MHD simulations of sunspots excel at producing sunspot intensity images that essential mirror solar observations.
-
2.
Only recently have studies produced 3D MHD simulations of spots on other stars. Much work remains to be done in this arena, but the existing results reveal a trend of decreasing spot–photosphere temperature contrast for later spectral types, matching observations (e.g., Berdyugina, 2005).
2.3.5 Our finding
From this analysis, we draw the following finding.
Finding 1.2
Summary:
More modeling work is needed to understand how the fundamental parameters of stars other than the Sun govern their magnetic fields and the associated properties of their surface inhomogeneities.
In accordance with observations, simulations show that many lower-activity stars, such as exoplanet hosts that for transmission spectroscopy , are -dominated
, little is known on how facular contrasts and coverages depend on stellar activity levels and fundamental parameters, such as metallicity and surface gravity.
Both observing and modeling the fine structure of spots on stellar surfaces remain a challenge.
Capability Needed:
MHD simulations of magnetic features and spectral synthesis for a larger range of stellar parameters, such as lower and higher metallicity, cooler temperatures, various stellar ages and/or activity levels are needed.
In particular, we need to understand how facular and spot contrasts and coverages depend on stellar fundamental parameters and activity.
We need to be able to infer the observational properties of photospheric and chromospheric features from easily accessible grids of simulations or, ideally, from simulations tailored to particular high-priority exoplanet host stars.
Importantly, models of cool stars ( K) are necessary to understand the hosts of many exoplanets that are high priority for follow-up.
Capability Today:
A limited amount of MHD simulations exist now.
tmospheric structures of various magnetic features are often represented by 1D radiative equilibrium models , but they fail dramatically for bright features .
3D MHD codes like MURaM and CO5BOLD have been used to simulate photospheric magnetic fields and surface features for a few (10) FGK and early-M main-sequence spectral types , but physical constraints on the fine structure of spots (umbra and penumbra) are still not understood.
Mitigation in Progress:
2.4 Observations of stars other than the Sun
2.4.1 Granulation and oscillations in other stars
While plasma-driven processes like granulation and oscillations cannot yet be spatially resolved in stars other than the Sun, their impact in other stars can still be detected in unresolved observations. These include extremely precise radial velocity and spectral line profile measurements (not reviewed here) as well as photometric time-series measurements (i.e., light curves), particularly from space-based observatories such as the Convection Rotation and Planetary Transits (CoRoT; Auvergne et al., 2009) Space Telescope, the Space Telescope, and . For example, Kepler observations of thousands of red giant stars have yielded detailed asteroseismic analyses of the oscillation frequencies of these stars, oscillations which are driven largely by surface convection. This enables accurate determination of bulk stellar properties, such as mass and radius, as well as detailed internal stellar structure and rotation profiles (see, e.g., Chaplin et al., 2011b; Huber et al., 2011; Mathur et al., 2011; Stello et al., 2013, and references therein). In terms of granulation, Bastien et al. (2013, 2016) demonstrated a technique to measure the properties of the surface convective motions of solar-type main-sequence dwarfs, known as “flicker" (). is the amplitude of stochastic variations in the light curve on timescales shorter than 8 hr and can be directly tied to the stars’ surface granulation properties (Figure 9).
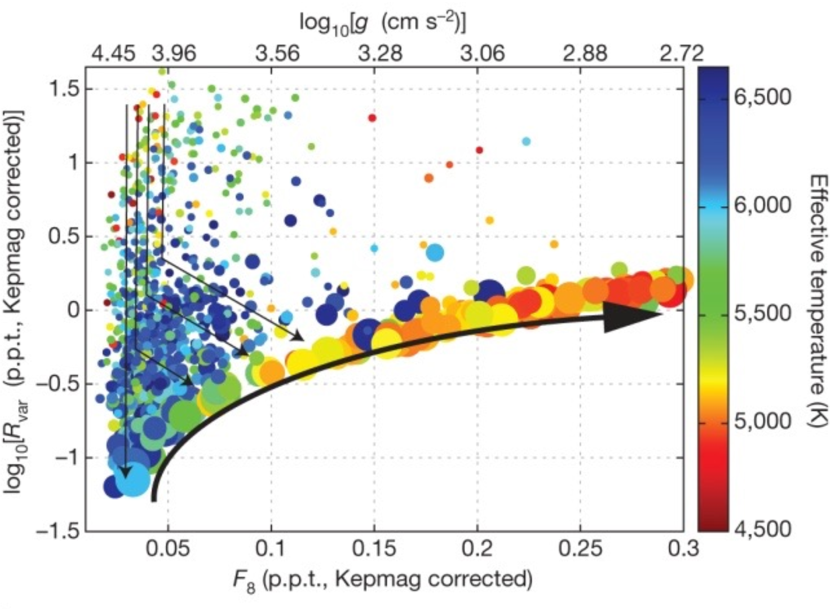
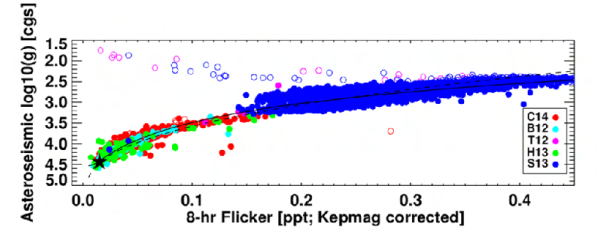
Comparisons with the predicted granulation properties (i.e., the amplitude) from 3D stellar models show good agreement in general. However, for stars hotter than 6200 K, the models predict amplitudes significantly larger (a factor of ) than what is observed. The smaller observed granulation amplitudes may imply some suppression mechanism (e.g., surface magnetic fields) that reduces the granulation amplitudes relative to expectations (Cranmer et al., 2014). In addition, comparisons of observations and models in order to understand granulation in ensemble of stars have typically not used the full array of information that exists on the power spectrum of the time-series where they are observed—a technique that studies of stellar oscillations do regularly use. Recent work, however, has begun to observationally characterize the full granulation power spectrum via data-driven inference in TESS light curves (e.g., Sayeed et al., 2021).
While an evident source of noise to be accounted for when analyzing transit light curves, the impact of granulation and oscillations as a contamination source to the transit spectrum has been only explored using simulations. Chiavassa et al. (2017), simulating transits in front of stars using 3D stellar models, suggest that indeed biases on the transit depth can occur due to the fact that exoplanets could transit on chords in the stellar surface that have a significantly different brightness due to the granulation pattern. The effect could be of the order of a few percent on the transit depth of a terrestrial exoplanet orbiting a Sun-like star in the red-end of the optical ( \micron), amounting to a few ppm in the case of an EarthSun analogue exoplanetary system—within the same order of magnitude as atmospheric features in a transiting EarthSun analogue exoplanetary system (Bétrémieux & Kaltenegger, 2013). This percentage seems to rapidly decline at longer wavelengths, which suggests could make it a negligible effect in practice for most up-coming space-based observatories focusing on the infrared. However, it could become a problem for transit observations in the optical range, such as the ones that missions proposed by, e.g., the Astro2020 Decadal Survey could perform. Validating these granulation simulations with wavelength-dependant data of both the Sun and stars other than the Sun seems to be fundamental to understand the true impact of this effect on future high-precision observations of transiting exoplanetary systems. Although likely having a smaller impact due to the smaller associated amplitudes, performing the same type of simulations and validations for oscillations would be highly beneficial to understand their impact as a contamination source.
2.4.2 Observing starspots & faculae: techniques and their interplay
Similar to granulation and oscillations, photometric monitoring of stars other than the Sun has enabled the study of the hours-to-multi-year variations produced by surface inhomogeneities for many decades (Kron, 1947). With the advent of stellar high-resolution spectroscopy and spectropolarimetry, these were found to be caused by magnetic regions similar to those on the Sun—starspots (Berdyugina, 2005).
Early attempts to interpret the observed photometric variability in other stars involved extrapolating properties from synthetic light-curves of model stars with differing spot parameters: circular uniform spots (e.g., Budding, 1977); spots with defined umbral and penumbral areas (e.g., Dorren, 1987); and active latitudes and/or longitudes (e.g., Bopp & Evans, 1973). A single-starspot model is rarely a solution for observed photometric variations. Also, it is unlikely that a light-curve analysis results in a unique solution. Instead, a set of various solutions usually satisfies the same data. s the volume of photometric data has dramatically increased, more advanced tools have been developed to analyze and interpret (e.g. Lanza et al., 1998; Berdyugina et al., 2002; Ribárik et al., 2003; Maxted, 2016; Luger et al., 2021a, b).
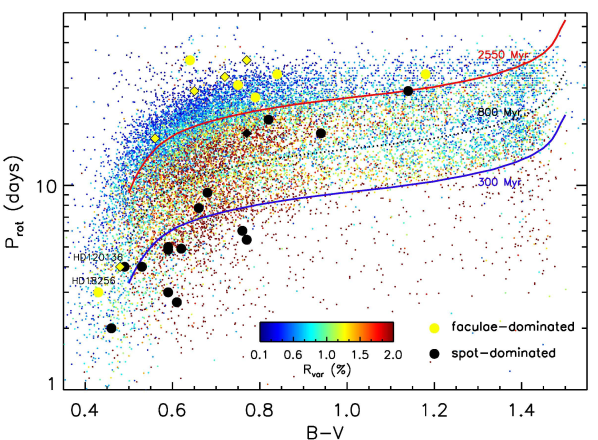
Understanding solar variability has been very helpful in solving problems posed by stellar observations—in particular, the brightness variations as detected by ground-based efforts and space-based missions such as CoRoT, Kepler and TESS . For instance, inspired by solar observations, Radick et al. (1998) and Reinhold et al. (2019) demonstrated that active stars are dominated by dark spots, whereas less-active stars are dominated by bright faculae and possibly networks. Reinhold et al. (2019) found the transition from spot- to -domination to happen at a Rossby number of about one (i.e., when the rotation period is roughly equal to the convective overturn time). This corresponds to the Vaughan–Preston gap , where a dearth of F-, G-, and K-type stars with intermediate levels of magnetic activity has been observed . They proposed an age of around 800 Myr for this transition, in accordance with the conclusions of Radick et al. (1998). This also explains the apparent lack of stellar rotation periods between 15–25 days in the Kepler field, which would result from the contributions of dark spots and bright faculae brightness cancelling at these periods . This result suggests that the observations do not necessarily imply an under-representation in the real period distribution but rather the lack of photometric modulation in the light curves. also concluded that stars at ages 2.55 Gyr should be -dominated (see Figure 10), although further investigations with a larger sample size might be required to robustly extend these results to a wider range of stellar types and properties. While good empirical models based on the Sun exist for solar-like stars, similar models for other spectral types need more investigation and data to support them (Shapiro et al., 2014; Yeo et al., 2020). For example, See et al. (2021) show a positive correlation between the variability amplitude and metallicity of stars and suggest rotation period detection might be biased toward the periods of metal-rich stars for stars of a given mass (see also Reinhold et al., 2021).
In addition to significant photometric effects, starspots and faculae demonstrate characteristic spectroscopic and spectropolarimetric signatures. Modeling of chromospheric features in the integrated spectra of stars can yield meaningful measurements of plage-like fractional area coverages (see, e.g., Andretta et al., 2017); line-depth ratios are also a reliable source for starspot temperatures (e.g., Toner & Gray, 1988; Gray & Johanson, 1991; Catalano et al., 2002). Furthermore, starspots on stars with higher effective temperatures can result in molecular lines that would not otherwise be present in their spectra (Berdyugina et al., 2003). These molecular features can be used to measure starspot properties (e.g., Vogt, 1979; Huenemoerder et al., 1989; Neff et al., 1995; O’Neal et al., 1998a; Berdyugina, 2002; Afram & Berdyugina, 2015). In general, hotter stars have a larger difference between the unspotted surface temperature and the spot temperature than cooler stars do (e.g., Berdyugina, 2005; Andersen & Korhonen, 2015). This temperature difference can be as large as 2000 K for spectral type G0 and only 200 K for spectral type M4. Spectropolarimetric analysis of many atomic and molecular lines reveals an internal, height-dependent temperature and magnetic structure of starspots with strong magnetic fields, which were found to be smaller and warmer in the lower atmospheres of earlier M-dwarfs than later M-dwarfs, where starspots with strong fields are bigger and cooler throughout their entire atmosphere (Berdyugina, 2011; Afram & Berdyugina, 2019).
The distribution of starspots on stellar surfaces can be recovered in some cases using the Doppler maging (DI) technique, as surface features induce perturbations in Doppler-broadened spectral line profiles (e.g., Deutsch, 1958; Vogt & Penrod, 1983; Piskunov et al., 1990; Berdyugina, 1998). This method is reliant on stars being rapid rotators and starspots being relatively large. Such large active regions have been detected on young, rapidly-rotating solar-type stars (e.g., Jeffers et al., 2007; Järvinen et al., 2008, 2018) as well as on evolved, rotationally synchronized binary components, such as RS CVn-type stars (e.g., Vogt et al., 1999; Berdyugina et al., 1998, 1999; Strassmeier, 2009). Time series of DI maps and photometric light-curves reveal stellar differential rotation and latitudinal activity belts longitudinal migration of active regions with respect to the stellar rotation and various activity cycles (e.g., Berdyugina & Tuominen, 1998; Järvinen et al., 2005a, b; Oláh et al., 2009). Such long-term starspot phenomena are important for monitoring transits of Earth-like planets around solar-type stars with orbital periods more than a hundred days or so. High spectral resolution is key for resolving spots and their substructure, e.g., a possible penumbra signature on a young solar analog EK Dra (Järvinen et al., 2018).
DI also shows that, for active stars, starspots can occur at much higher latitudes than within the from the equator that is typically seen on the Sun. Large spots have been found to cover even the visible pole of the star (e.g. Strassmeier & Rice, 1998; Donati, 1999; Korhonen et al., 2021). Recently, large starspots on giant stars were directly imaged using long-baseline interferometric imaging (Roettenbacher et al., 2016, 2017). This method confirmed the existence of polar starspots on active stars (Roettenbacher et al., 2016). It also allows obtaining accurate information on spot locations with respect to the stellar equator that is not possible with DI (Roettenbacher et al., 2017). A polar spot that is perfectly symmetrical around the pole does not cause rotational modulation in the light curve. On the other hand, it would still cause effects on the observed spectrum of the star and also lead to the wrong estimation of the transit depth (e.g., Rackham et al., 2018; Zhang et al., 2018). However, typically stars showing polar spots would also show large spots on other latitudes, causing significant variation in their light curves. Therefore, as with other active stars, the presence of polar spots must be taken into account when assessing targets for transit spectroscopy and analyzing observations from these systems. Here molecular spectroscopy can also help detecting such spots, even if they do not modulate photometric and spectroscopic signals.
Similar to DI, a ZeemanDoppler maging (ZDI) technique based on spectropolametric measurements can help to recover the distribution of magnetic fields on stellar surfaces . However, surface features detected photometrically and in DI maps seem not directly related to features in ZDI maps. Overcoming this discrepancy and improving underlying physical assumptions (e.g., Berdyugina, 2009) may allow in the future relate ZDI magnetic features with transit spectrophotometry.
In terms of activity level and its relation with age, a clear relation has been found between the two for G, K and M-stars. Stars are born as rapid rotators, and their rotation slows down with age due to magnetic braking (Skumanich, 1972). On the other hand, the dynamo action is enhanced with more rapid rotation until a saturation level (Pallavicini et al., 1981). Somewhat surprisingly, both fully convective and partially convective stars follow similar activityrotation relations (Kiraga & Stepien, 2007; Newton et al., 2017; Wright et al., 2018). There is evidence for the agerotation relations breaking down at the halfway point of the main sequence lifetime of the star, i.e., close to the current age of the Sun, suggested to be due weakened magnetic braking (e.g. van Saders et al., 2016; Nichols-Fleming & Blackman, 2020; Hall et al., 2021).
The study of stars other than the Sun has also been fundamental to understand the time-scales on which active regions live on stellar surfaces. From the Sun we know that the lifetime of small sunspots is proportional to their size (Gnevyshev, 1938; Waldmeier, 1955). Similar behavior for starspots has been indicated from relatively sparse photometric observations (e.g. Hall & Henry, 1994). Precise, high-cadence space photometry from Kepler and TESS has recently been used to further investigate starspot lifetimes as well (Giles et al., 2017; Namekata et al., 2020), which can be compared to theoretical and empirical models (Bradshaw & Hartigan, 2014; Namekata et al., 2019). This is also an active area of research in the radial-velocity community, which is also interested in constraining these time-scales (see, e.g., Haywood et al., 2014; Rajpaul et al., 2015; Faria et al., 2016). It seems that for other stars, starspot lifetimes fall slightly below the solar trend, but are within an order of magnitude of those expected from sunspots studies. Very large starspots on active stars can live a very long time, maybe even years (Hussain, 2002). On the other hand, it is not clear if these huge spots are really single spots or an active-region-like collection of individual spots. On rapidly rotating M dwarfs, starspot modulation, observed in photometry and spectral features, can remain coherent for months to years, suggesting long-lived features (Newton et al., 2016; Robertson et al., 2020).
2.4.3 Atmospheric heterogeneity in ultra-cool dwarfs
Stellar heterogeneity imposes special challenges for transiting planets orbiting ultracool dwarfs—stars and brown dwarfs with K. With the planet-to-star radius ratio being a key parameter underpinning the feasibility of observational studies of transiting exoplanets, ultracool dwarfs—including the smallest dwarf stars and most massive brown dwarfs—are set to play key roles in the future of exoplanet science. These stars, however, are not just smaller versions of the Sun but, instead, are a fundamentally different class of objects.
A spectral-type- and thus temperature-dependent pattern of rotational variability has been observed for the mainly temperature-driven sequence from late M-dwarfs through early L-dwarfs to T-type brown dwarfs. Time-resolved, multi-color or spectrally-resolved observations of such rotational variability provide powerful probes of the nature of the atmospheric heterogeneity in these objects. For the coolest stars and hottest brown dwarfs (at the M/L spectral type transition), it is very likely that rotational variability is caused by multi-pole magnetic fields, resulting in large starspots. Such spots, possibly anchored by large-scale magnetic fields, have been found (at least for some early L-type dwarfs) to lead to periodic variability that is stable over multiple years (e.g., Gizis et al., 2015). Indeed, a strong surface magnetic field of 5 was successfully detected on one of such young brown dwarfs displaying transient rotationally-modulated radio bursts (Berdyugina et al., 2017; Kuzmychov et al., 2017). Also, the rotational modulation of the Balmer H i, blue Ca ii and Na i D line emission as well as radio bursts were found to be related to the detected magnetic region and magnetic loops anchored in it. Since rotation periods of such objects (and thus the emission modulation) are 2–3 hr, this variability may affect transit spectra of exoplanets.
In contrast, later spectral type brown dwarfs (from mid-L to mid-T types) often display rotational variability (e.g., Buenzli et al., 2014; Radigan et al., 2014; Metchev et al., 2015) that are different in nature: their light-curve shapes are constantly evolving (e.g., Artigau et al., 2009; Biller et al., 2013; Apai et al., 2017), likely caused by cloud thickness variations (e.g., Radigan et al., 2012; Apai et al., 2013) (although chemical disequilibrium may also play a role, Tremblin et al. 2020). Due to the low atmospheric temperatures and ionization rates, the cloud thickness modulations are very likely independent of the magnetic field strengths (Miles-Páez et al., 2017). Instead, cloud thickness variations are driven by atmospheric circulation and lead to atmospheric jets and zonal circulation Zhang & Showman (2014); Apai et al. (2017); Millar-Blanchaer et al. (2020); Tan & Showman (2021); Apai et al. (2021).
2.4.4 Limb-darkening & its interplay with stellar heterogeneities
As has been discussed in this , understanding center-to-limb variations on stars (limb-darkening or brightening profiles) is fundamental to constraining stellar heterogeneities. They are not only critical for constraining the amplitude and contrast of granulation in stars and the observed contrast variations of faculae and spots as a function of their position on stellar surfaces, but they also impact transit light-curve modeling itself and hence the transit spectrum that is derived from this modeling. Through simulations, it has been shown that inaccurate modeling of limb darkening may lead to a 1–10 % discrepancy in the determination of exoplanetary radii obtained from transit photometry observed at UV or visible wavelengths (see, e.g., Espinoza & Jordán, 2015; Csizmadia et al., 2013). Studies trying to constrain how well theoretical limb-darkening profiles extracted from stellar model atmospheres compare against empirically determined limb-darkening profiles from precise photometry have typically found disagreement between the two (Cabrera et al., 2010; Claret, 2009; Espinoza & Jordán, 2015; Maxted, 2018).
Limb darkening has an important interplay with stellar heterogeneities too. Csizmadia et al. (2013) showed that if stellar heterogeneities are present in the star, this can effectively modify the limb-darkening profile. Using theoretical limb-darkening laws to model this effect, which do not account for the presence of those features, will create a bias on the model that would translate to a bias in the retrieved transit depth. This could itself be an important source of contamination on the transit modeling.
Taking into account polarization due to scattering in stellar atmospheres was also found important for theoretical limb-darkening models. This is especially true closer to the limb and for cooler atmospheres, where scattering becomes significant as compared to absorption (Kostogryz & Berdyugina, 2015; Kostogryz et al., 2016, 2017). Hence near-limb transits of cooler stars will be most sensitive to (and, thus, biased if not accounted for) polarization effects.
2.4.5 Our finding
From this analysis, we draw the following finding.
Finding 1.3
Summary:
Simultaneous multi-wavelength (multi-instrument) stellar observations are needed to provide feedback to modeling efforts and improve our understanding of the photospheres and chromospheres of other stars, including high-priority exoplanet host stars.
This is particularly critical for K, M, and L dwarfs, for which models are relatively poorly constrained.
Capability Needed:
Time-resolved multiband photometry, spectroscopy, and spectropolarimetry of high-priority exoplanet host stars are to provide feedback for simulations of these stars.
In particular, we need to understand the variability of exoplanet hosts within the wavelength range of interest for current and upcoming missions (0.3–5 m) at timescales relevant to granulation (minutes), transits (minutes to hours), rotation periods (days to months), and magnetic cycles (years).
Limb darkening as a function of wavelength and stellar activity should be constrained with future observations in order to better understand its impact as a contamination source on the transit spectrum.
Capability Today:
Precise broad-band photometric light curves from CoRoT, Kepler/K2, and TESS probe surface convective motions and spot distribution and evolution , providing feedback for 3D models of stellar surface features.
Multi-decade monitoring of stellar chromospheric emission as well as recent population studies relying on photometric light curves have been used to infer that more-active stars are dominated by dark spots while less-active stars are dominated by bright faculae.
Ground-based spectroscopy and spectropolarimetry provide constraints on physical properties of stellar magnetic features .
(Zeeman) Doppler imaging can probe structures in photospheres of rapidly rotating stars , but it is unclear how well these findings may extend to the general population of exoplanet host stars, which tend to rotate more slowly .
Mitigation in Progress:
high-resolution spectroscopy and spectropolarimetry, precise space photometry, and interferometric imaging helps to construct stellar surface maps of cool stars , more recently also including exoplanet host .
3 Occulted Active Regions
Essential uestions:
-
1.
What is the state of the art for modeling and observing occulted active regions?
-
2.
What are the outstanding theoretical challenges for this work?
-
3.
What are the available modeling tools for active-region occultations? Are they sufficient for the precise transit datasets that are expected in the next decade?
3.1 Introduction
As described in Section 1, stellar surfaces are very inhomogeneous. In particular, active regions, including dark (spots and pores) and bright (faculae, plage, and network) magnetic features, are of concern to transmission spectroscopy due to their effects on transmission spectra. If the transit chord of a planet crosses a spot (facula), this will appear as a temporal brightening (darkening) in the resulting light curve. The prime effect of unocculted active regions, which are discussed in Section 4, is a change in apparent transit depth. Here we focus on the effects of occulted active regions on the observed transit light curves. We consider three topics in this context: the state of the art for observations and models of occulted active regions (Section 3.2), outstanding theoretical challenges in this context (Section 3.3), and the availability of well-maintained tools for conducting these analyses (Section 3.4). In the following sections, we summarize the analysis that leads to our primary findings in these areas.
3.2 State of the art for observations and models
3.2.1 Observations of spot occultations
Due to spots’ high contrast with respect to the quiet stellar surface and their more distinct structure as compared to faculae, spot occultations are significantly easier to identify, manifesting as temporal bumps in the transit light curves (see panel of Figure 11 for an example). Having lower contrast, faculae are much patchier in their surface structure and thus are more difficult to separate from noise and stellar variability. The following paragraphs summarize some notable studies of spot crossings from space- and ground-based observations.
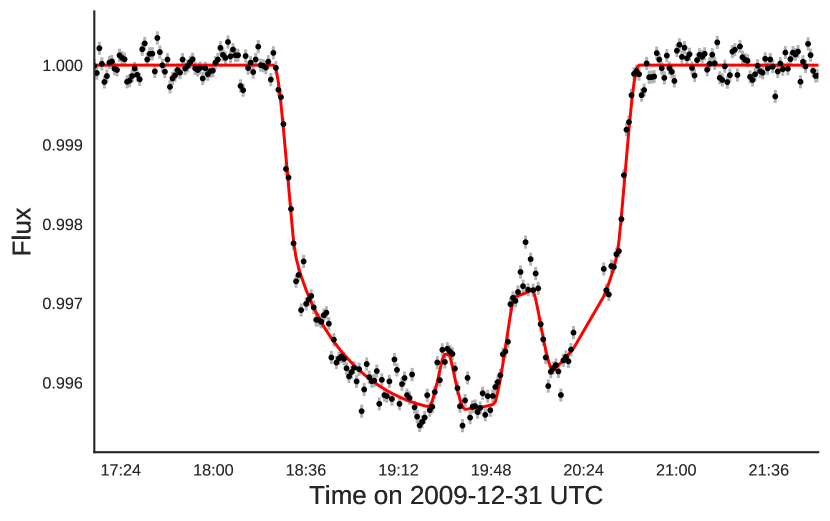
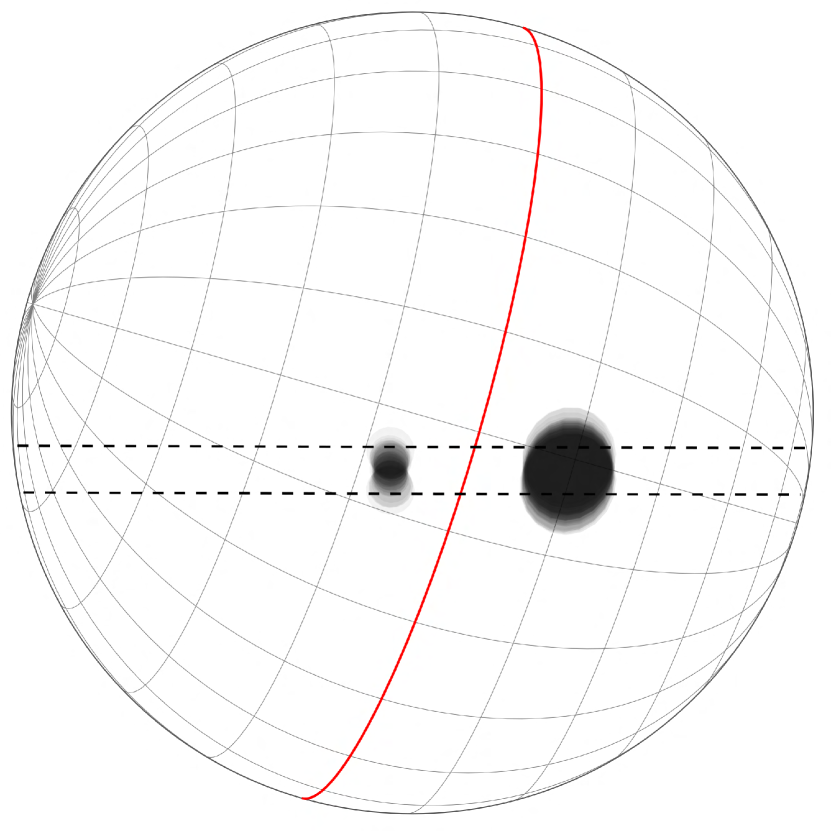
Space-based.
The first known transiting exoplanet, HD 209458b (Charbonneau et al., 2000; Henry et al., 2000), also provided the first observation of a exoplanet occulting a starspot, both from space with HST (Brown et al., 2001) and from the ground (Deeg et al., 2001). The occulted spots on HD 209458 were first modeled by Silva (2003), yielding their sizes and temperatures. The next detection was with the CoRoT telescope of CoRoT-2 (Silva-Valio et al., 2010). The number of observed starspot occultation events has increased since Kepler and the extended K2 mission (e.g., Kepler-30; Sanchis-Ojeda et al. 2012; Netto & Valio 2020: Kepler-63; Sanchis-Ojeda et al. 2013: Kepler-539; Mancini et al. 2016; Kepler-17: Désert et al. 2011a; Valio et al. 2017; HAT-P-11: Sanchis-Ojeda & Winn 2011; Oshagh et al. 2013a; Morris et al. 2017; Murgas et al. 2019; Kepler-71: Zaleski et al. 2019; Kepler-45: Zaleski et al. 2020; Kepler-411: Araújo & Valio 2021), although with low-cadence temporal sampling (30-min cadence), the Kepler mission is neither ideal nor well suited to such detections. The cadence has a strong impact on the detection limits of starspot anomalies for planetary systems with small planet-to-star radius ratios (Tregloan-Reed & Unda-Sanzana, 2019). This effect is mostly evident in the detection limits of the smallest and/or hottest (low contrast, , where is the intensity of the spot relative to the photosphere) dark starspots, when the timescale of the occultation event is equivalent to or shorter than the observational cadence. Starspot occultations are more easily detected with the 1-min-cadence K2 observations. Such detection examples include the aligned WASP-85 (Močnik et al., 2016) and Qatar-2 (Močnik et al., 2017b) systems with recurring occultation events, and the misaligned WASP-107 system, where the occultations were not found to be recurring (Dai & Winn, 2017; Močnik et al., 2017a).
Ground-based.
| Planetary system | Telescope/Instrument | Reference |
|---|---|---|
| HD 209458 | Observatorio de Sierra Nevada 90 cm/Strömgren Photometer | Deeg et al. (2001) |
| WASP-4 | 1.54-m Danish Telescope/DFOSC | Southworth et al. (2009) |
| Magellan Baade 6.5 m/MagIC | Sanchis-Ojeda et al. (2011) | |
| HAT-P-11 | Astrophysical Research Consortium 3.5 m/ARCTIC | Morris et al. (2018e) |
| WASP-19 | 1.54-m Danish Telescope/DFOSC | Mancini et al. (2013) |
| MPG/ESO 2.2 m/GROND | Mancini et al. (2013) | |
| 3.6-m New Technology Telescope/EFOSC2 | Tregloan-Reed et al. (2013) | |
| 8.2-m VLT/FORS2 | Sedaghati et al. (2015) | |
| Magellan Baade 6.5 m/IMACS | Espinoza et al. (2019) | |
| HATS-2 | MPG/ESO 2.2 m/GROND | Mohler-Fischer et al. (2013) |
| WASP-21 | Cassini 1.52 m/BFOSC | Ciceri et al. (2013) |
| Calar Alto 1.23-m/DLR-MKIII | Ciceri et al. (2013) | |
| Qatar-2 | MPG/ESO 2.2 m/GROND | Mancini et al. (2014b) |
| CAHA 2.2 m/BUSCA | Mancini et al. (2014b) | |
| Cassini 1.52 m/BFOSC | Mancini et al. (2014b) | |
| Calar Alto 1.23-m/DLR-MKIII | Mancini et al. (2014b) | |
| WASP-89 | TRAPPIST 0.6 m/TRAPPIST photometer | Hellier et al. (2015) |
| Euler 1.2 m/EulerCAM | Hellier et al. (2015) | |
| WASP-6 | 1.54-m Danish Telescope/DFOSC | Tregloan-Reed et al. (2015) |
| HAT-P-36 | Cassini 1.52 m/BFOSC | Mancini et al. (2015) |
| Calar Alto 1.23-m/DLR-MKIII | Mancini et al. (2015) | |
| WASP-41 | 1.54-m Danish Telescope/DFOSC | Southworth et al. (2016) |
| TRAPPIST 0.6 m/TRAPPIST photometer | Neveu-VanMalle et al. (2016) | |
| 1.54-m Danish Telescope/DFOSC | Neveu-VanMalle et al. (2016) | |
| WASP-52 | William Herschel Telescope 4.2 m/ULTRACAM | Kirk et al. (2016) |
| MPG/ESO 2.2 m/GROND | Mancini et al. (2017) | |
| 1.54-m Danish Telescope/DFOSC | Mancini et al. (2017) | |
| Cassini 1.52 m/BFOSC | Mancini et al. (2017) | |
| Calar Alto 1.23-m/DLR-MKIII | Mancini et al. (2017) | |
| Euler 1.2 m/EulerCAM | Mancini et al. (2017) | |
| HAT-P-20 | YO 1 m/Andor CCD Camera | Sun et al. (2017) |
| GJ 3470 | 10.4-m Gran Telescopio Canarias/OSIRIS | Chen et al. (2017) |
| GJ 1214 | 8.4-m Large Binocular Telescope/Large Binocular Camera | Nascimbeni et al. (2015) |
There is a substantially greater number of observed starspot occultation events in transit light curves from ground-based telescopes compared to those from space-based telescopes. This is principally due to the many observations using high-cadence ( min) observations, which allows for smaller starspots to be detected. A sample of systems with starspot detections from ground-based photometry is given in Table 3.
3.2.2 Influences on the retrieved transmission spectra
When occulted during planetary transits, starspots and faculae decrease and increase the apparent transit depth, respectively, (e.g. Czesla et al., 2009), especially in the visible (Figure 12). As their effect is wavelength-dependent, uncorrected active region crossings produce effects opposing those of unocculted active regions. In broadband data, occultations of stellar active regions (spots/faculae) during planetary transits can mimic broadband characteristics of planetary atmospheres in transmission spectra, as has been shown with both observations and simulations (Sing, 2010; Pont et al., 2011; Oshagh et al., 2014; Herrero et al., 2016). In the context of narrow-band features, several studies have explored the possibility that realistic stellar active regions (both occulted and unocculted) on various types of stellar hosts could also have a significant impact on the strength of atomic and molecular features (Rackham et al., 2017, 2018, 2019; Tinetti et al., 2018; Apai et al., 2018; Chachan et al., 2019).
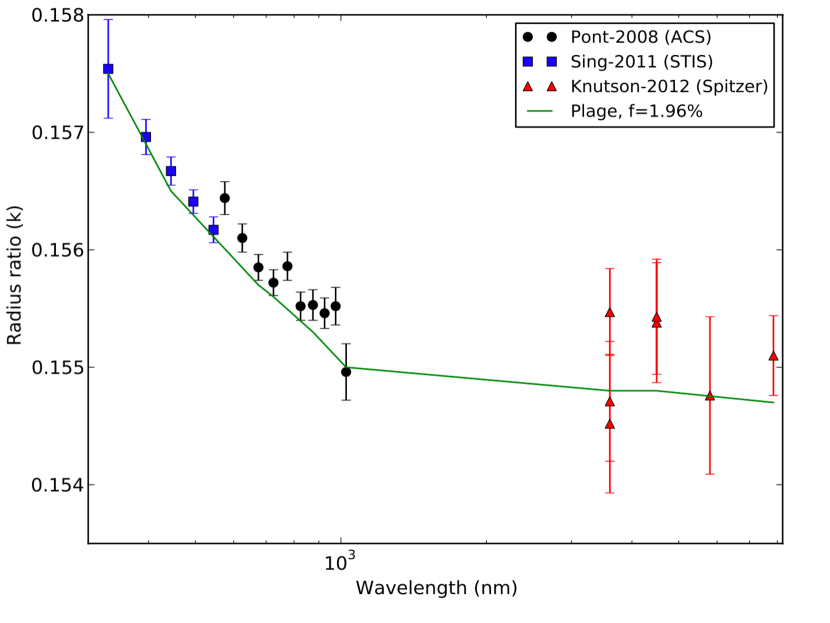

If the occultation is isolated and its signal large compared to the noise level, it is usually removed from the transit. However, Barros et al. (2013) showed that the occulted feature can impact multiple transit parameters other than the transit depth, such as mid-transit time, scaled orbital semi-major axis, and orbital inclination. In particular, impact parameter variations due to the effect of active regions on limb-darkening parameters can introduce positive or negative slopes from the visible to the infrared transmission spectrum (Alexoudi et al., 2020). Such effects can reach up to one or more scale heights.
Hence, simply removing active region occultations from the transit profile likely does not completely negate their effect on the determination of transit parameters, particularly with high-precision spectrophotometry. The problem becomes trickier still when multiple occultations are observed in the same transit, as has been found in many cases in the visible (e.g., Czesla et al., 2009; Désert et al., 2011a; Morris et al., 2017). In these cases, removing the occultations might simply not leave enough data points for the fit of the transit profile, such that using a transit-starspot model becomes a necessity. In addition, modeling active-region occultations, instead of removing them, allows us to leverage their wavelength-dependent impact on planetary transits to derive active-region parameters (Sing et al., 2011; Bruno et al., 2022)—valuable information for correcting transmission spectra for the effects of stellar activity (see Section 5). Finally, even in cases without obvious active-region occultations, occultation models can be used to place upper limits on the impact of low signal-to-noise occulted active regions, which introduce an uncertainty in the level of stellar-activity contamination similar to that of unocculted active regions but with an opposite sign (Ballerini et al., 2012).
3.2.3 Our finding
From this analysis, we draw the following finding.
Finding 2.1
Summary:
Precise transit observations increasingly reveal occultations of stellar active regions.
Rather than flagging and removing active region occultations, which results in decreased observing efficiency and possibly biased transit depth measurements, future observations should move towards joint inference of the active region and planetary properties.
Capability Needed:
Detections of occulted active regions are more common in precise datasets.
From a practical perspective, discarding data impacted by active region occultations in many interesting systems will result in continuously lower observing efficiencies as precisions improve.
Additionally, more study is needed to understand the extent to which transit depths may be biased by active regions that are occulted but undetected.
Capability Today:
Many recent studies have included joint inferences of transit and active region properties using a variety of spot modeling codes .
However, the active regions we can detect in precise transit light curves, both ground- and space-based, are much larger than those that have been observed on the Sun .
At the same time, data impacted by active region occultations are commonly discarded in other studies.
Mitigation in Progress:
Joint analyses of active region and planetary properties from impacted light curves have been presented recently .
Additionally, some groups are beginning to look into the impact of heavily spotted transit chords on inferences .
3.3 Theoretical challenges for active region occultations
3.3.1 Solar spots and comparison to models of stellar spots
In the context of studying transiting planets occulting starspots, the most relevant property is the relative brightness of the starspot with respect to its surroundings. For spots on the Sun, there is a clear connection between the size of the spot and its umbral intensity: larger spots tend to have darker umbrae than smaller spots (Mathew et al., 2007; Schad, 2014; Valio et al., 2020). In the study by Mathew et al. (2007), spots that have an umbral radius between 5 (1 km) and 15 , the mean umbral relative intensity drops from 0.5 to 0.3 relative to the quiet-Sun intensity at the continuum near the Ni i line at 676.8 nm. They also found a very weak dependence of penumbral intensity on spot size, between 0.84 and 0.81 at the same wavelength.
Another property determining the effective brightness of a spot on a star is the ratio of penumbral to umbral area. For the Sun, this factor is roughly 4 and generally independent of spot area above a minimal spot area (although there is some scatter in the literature; e.g., Solanki, 2003).
For starspots, there is a strong connection between the surface temperature of the star and the spot contrast (Berdyugina, 2005). The spot temperature contrast is larger for hotter stars, and this seems to be valid for stars of different surface gravities. Updated summaries of starspot contrasts as a function of stellar surface temperature can be found in Mancini et al. (2014a) and Herbst et al. (2021). Interestingly, starspot temperatures inferred from planetary transits seem to be warmer than temperatures retrieved by other methods. This may be because the transit method returns the average temperature of the entire spot while methods like modeling of molecular bands are mainly sensitive to the umbral temperatures (due to the non-linear response of molecular lines to temperature).
A particularly useful example for drawing comparisons to solar activity is that of the active G-dwarf Kepler-71. Both spots and plages have been detected in its photosphere via occultations by its transiting hot Jupiter (Zaleski et al., 2019). Despite the higher contrast of Kepler-71 faculae than the solar counterparts, these plages showed similar properties, such as increasing contrast towards the limb and larger sizes than sunspots. Assuming a solar-type differential-rotation profile, the results obtained from independent modeling of starspots and faculae indicated similar rotational periods at the transit latitude and the same rotational shear.
3.3.2 The importance of MHD simulations for modeling occulted active regions
Johnson et al. (2021) have used quiet-Sun limb darkening and limb-dependent facular contrasts derived from MURaM 3D MHD simulations by Beeck et al. (2015a), together with spot contrasts computed from 1D model atmospheres with effective temperatures in agreement with 3D MHD results by Panja et al. (2020), to model rotational light curves of active G2, K0, M0, and M2 stars in the Kepler band. They found that the spot temperature together with spot coverage determines the amplitude of the variability, while faculae have a strong influence on mean brightness levels and the shape of light curves. The latter might have significant implications for occultation modeling.
Using 3D radiative magnetohydrodynamic simulations, Panja et al. (2020) have recently confirmed the dependence of spot contrast on stellar surface temperature for dwarfs within the spectral range G2V–M0V. These authors simulated the spectral types G2V, K0V and M0V and obtained umbral bolometric intensities of 0.3, 0.5, and 0.7 relative to the stellar photospheric intensities. Ongoing work includes simulations of spots with expansive penumbral filaments, similar to those observed in sunspots for the simulated G2V starspot, and simulations that allow the calculation of spot contrasts as a function of wavelength and disk position (Panja et al., in prep).
3.3.3 Common degeneracies in the retrieved spot and properties
The main difficulty in accounting for surface inhomogeneities is that these are essentially never single, isolated features. Thus, dark and bright features are likely present simultaneously, both occulted and unocculted. Simultaneous ground-based spectroscopic and space-based photometric observations of G and K stars show that starspots and plage are often, although not always, spatially associated, as is true on the Sun (Morris et al., 2018d). Moreover, it is not always clear whether a bright or dark feature is being occulted, as models with either type of feature at different times may offer comparable fits to transit light curves (Kirk et al., 2016; Bruno et al., 2016). The resulting effect from all features depends on their coverage (size), location, and the wavelength of observations, and is generally impossible to separate.
When observing stellar rotation in a single photometric bandpass, both faculae and starspots can produce rotational modulation signatures. Observing in more than one bandpass nearly simultaneously can break this degeneracy and suggest whether spots or faculae dominate. This technique has been applied to photometry of the planet-hosting M8 dwarf TRAPPIST-1, which shows (1) no clear spot occultations in transit photometry, (2) strong rotational modulation in the Kepler bandpass , and (3) very little modulation in Spitzer photometry .
3.3.4 Our finding
From this analysis, we draw the following finding.
Finding 2.2
Summary:
Theoretical advances are needed to understand the limits of what we can infer about active-region properties from transit light curves and how best to incorporate prior knowledge from magnetohydrodynamic models into transit studies.
Capability Needed:
More study is needed to understand the limits of inferences from occultations and how to break degeneracies in retrieved parameters of occulted active regions, such as size and contrast, with additional observations, such as spectroscopic transit depths or multiwavelength monitoring.
Additionally, more study is needed to understand best approaches for propagating information from stellar magnetic activity models into priors on spot properties, such as typical size and contrast, as a function of stellar spectral type and activity level.
Capability Today:
priors on active-region properties .
Retrieved sizes are generally large and contrasts are generally small relative to those inferred from other methods , which may point to biases with the technique or the combined impact of umbral, penumbral, and facular areas.
Mitigation in Progress:
Multiple groups are developing magnetohydrodynamic models for active regions on stars with differing spectral types and activity levels .
3.4 The availability of well-maintained, open-source tools
Over the years, there have been multiple starspot occultation models developed both by the eclipsing binary star community (e.g., Wilson-Devinney code: Wilson & Devinney 1971; Wilson 1979, 1990, 2012; : Prša & Zwitter 2005; Prša et al. 2016) and the exoplanet community (e.g., ECLIPSE: Silva 2003; SOAP-T: Oshagh et al. 2013a; PRISM: Tregloan-Reed et al. 2013, 2015, 2018; SPOTROD: Béky et al. 2014; KSint: Montalto et al. 2014; ellc: Maxted 2016; StarSim: Herrero et al. 2016; PyTranSpot: Juvan et al. 2018); STSP Morris et al. 2017; TOSC: Scandariato et al. 2017). Such models require integration over a 2D grid on the stellar surface or in the projection plane, which is computationally expensive, with computational time growing as the square of the grid resolution. The only exceptions to our knowledge are the semi-analytical SPOTROD and STSP models. At the same time, full 2D integration (pixelation) has the advantage that it allows individual intensities (accounting for surface inhomogeneities) to be assigned to every individual element at specific coordinates.
We summarize some of the most prominent models below.
ECLIPSE.
ECLIPSE (Silva, 2003), a code first written in IDL and then translated to Python, models active-region occultations using a 2D image of a synthetic star with spots (dark features) or plages (bright features) on the surface of the limb-darkened stellar disk. The planet, modeled as a circular dark disk, is positioned in its elliptical orbit every two minutes (or the desired time interval) and the intensity of all pixels in the image is summed to yield the light curve intensity at a given time. The spots (or plages) are simulated as dark (or bright) circles positioned along the transit chord. Spot intensities vary from 0–1, whereas the plage intensities vary from 1–1.5, where 1 is the brightness of the activity-free stellar disk center. The temperature of the spots can be estimated assuming blackbody emission for both the spots/plages and the stellar photosphere (Valio et al., 2017). Foreshortening of the spots is taken into account when they are close to the stellar limb. This model was first applied to HD 209458 (Silva, 2003) and has since been applied to many targets with high-cadence Kepler data (e.g., Silva-Valio et al., 2010; Valio et al., 2017; Netto & Valio, 2020; Zaleski et al., 2020; Araújo & Valio, 2021). An example of such modeling is shown in Figure 13 for Kepler-17 with three spots. can be found at GitHub444https://github.com/biaduque/astronomy and was last updated in 2021.
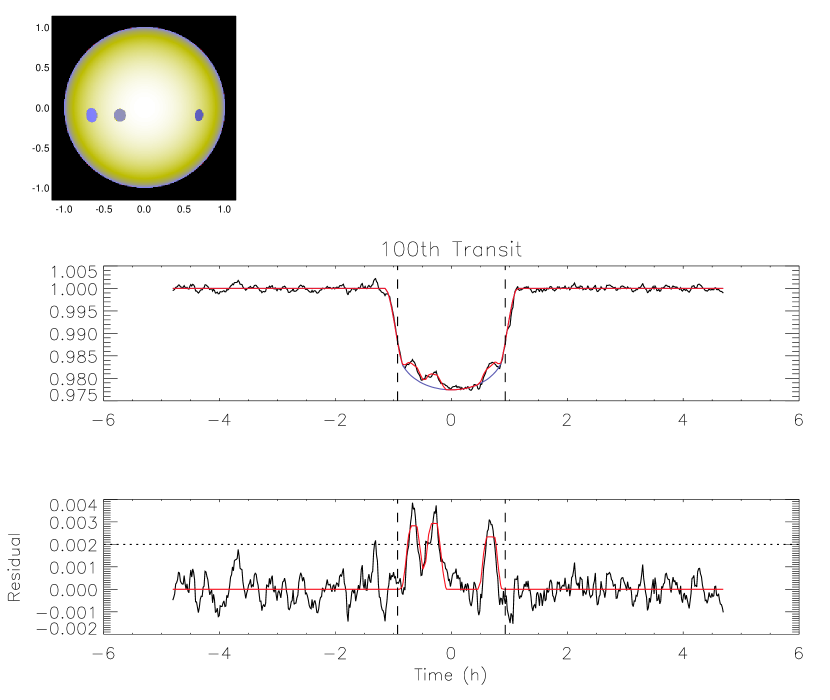
SOAP-T.
Spot Oscillation and Planet Transit (SOAP-T) (Oshagh et al., 2013a) is a SOAP (Boisse et al., 2012) adaptation that can generate light curves and radial velocity variations for systems containing a rotating spotted star and a transiting planet. The stellar disk, active regions on it, and a transiting exoplanet are simulated numerically using a pixelation approach. This tool has been used to investigate spot-crossing anomalies within transit light curves (Oshagh et al., 2013b), as well as to assess their impacts on the estimation of the transit duration, depth, and timing. was used to study, for the first time, the impact of the occultation of a stellar spot and plage on the transmission spectra of transiting exoplanets (Oshagh et al., 2014). was also used to study the impact of stellar active region occultation on the Rossiter-McLaughlin effect signal (Oshagh et al., 2016; Boldt et al., 2020), as well as on the estimation of orbital configuration and properties of planetary systems (Oshagh et al., 2018) and active regions on their host stars (Oshagh et al., 2015; Serrano et al., 2020). SOAP-T is available via an online interface555http://www.astro.up.pt/resources/soap-t/.
PRISM.
The Planetary Retrospective Integrated Starspot Model is written in IDL and uses a pixelation approach to model the stellar disc in a 2D array by subdividing the star into many individual elements. These elements can then be described by a 2D vector in Cartesian coordinates. Each element is then assigned an intensity value based on whether a stellar feature is present at that location and then the quadratic limb darkening law is applied over the entire stellar disc. The planet is then set to transit the star. For each data point in the transit light curve, the total received intensity is calculated based on which elements of the star are visible. The PRISM model has been used primarily to model starspots found in ground-based transit exoplanetary light curves (e.g. Tregloan-Reed et al., 2013, 2015; Chen et al., 2017; Mancini et al., 2017). More recently, PRISM has also been used to simulate spotted transits observed with 2-min-cadence TESS data (e.g. Tregloan-Reed & Unda-Sanzana, 2019, 2021). An example of the use of PRISM is provided by Figure 14. PRISM is available on GitHub666https://github.com/JTregloanReed/PRISM_GEMC and was last updated in 2019.
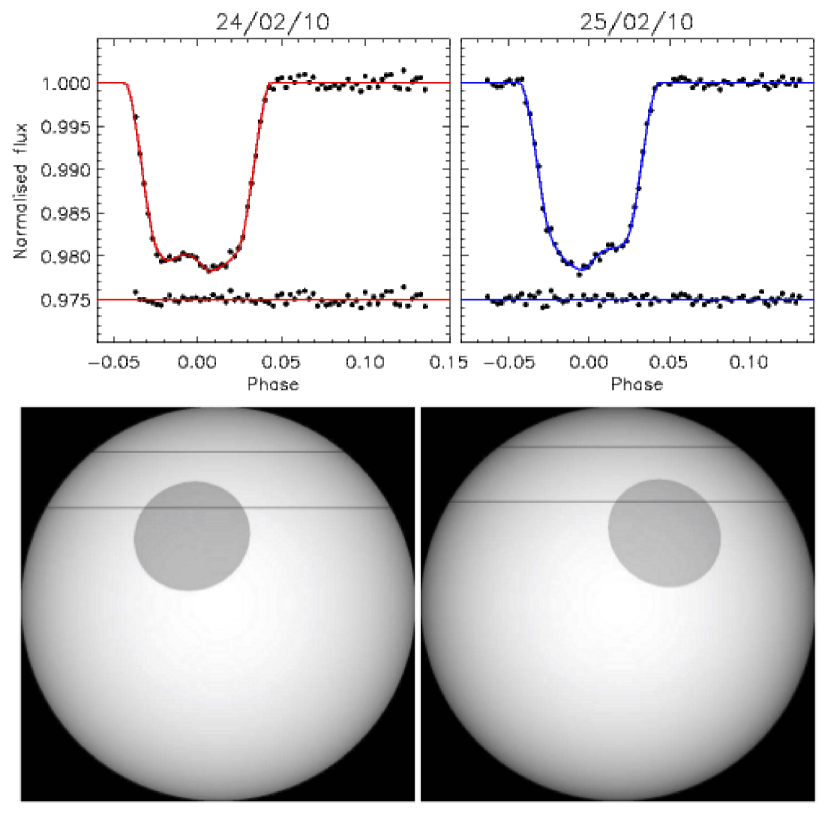
SPOTROD.
SPOTROD (Béky et al., 2014) is a semi-analytic tool for modeling planetary transits of stars having an arbitrary limb-darkening law (being identical for spots and the stellar photosphere) along with a number of homogeneous, circular spots on the stellar surface. It can account for both eclipsed and uneclipsed starspots. The program is written in C and available in Python. The homogeneous spots are represented by their flux ratio, , which is the ratio of the flux from a spot (as viewed by the observer) to the flux from an unocculted stellar surface at the same disc location. Umbra-penumbra structures of spots can be accounted for by superimposing two concentric spots of differing intensities, and bright features can be introduced by using . SPOTROD works in polar coordinates, with the advantage being that the integral over the polar angle can be computed analytically and only the integral over the radial coordinate requires numerical integration. The significant reduction of the required computation time is the main advantage of this model compared to other, typically 2D, models. Thus, SPOTROD can be used for fitting large numbers of transits with occulted active regions and also for efficient statistical investigations using MCMC approaches. SPOTROD is available on GitHub777https://github.com/bencebeky/spotrod and was last updated in 2015. It has been wrapped into a nested-sampling retrieval framework, SpotNest (Espinoza et al., 2019), which is also available on GitHub888https://github.com/nespinoza/spotnest and was last updated in 2018.
StarSim2.
StarSim2 (Rosich et al., 2020), an update of the StarSim tool (Herrero et al., 2016), uses a fine grid of surface elements to model integrated spectral contributions of a spotted rotating photosphere. It is written in Python and Fortran 90. The flux intensities and wavelengths of spectral features produced by active regions are included in the model. The original StarSim tool has been used to derive stellar surface parameters from light curve inversion as well as to mitigate their impacts on the transiting planet’s transmission spectrum (Mallonn et al., 2018). StarSim2 is available on GitHub999https://github.com/rosich/Starsim-2 and was last updated in 2020.
STSP.
STSP is a fast forward model for starspot occultations by transiting exoplanets and unocculted spot modulation, written in C by L. Hebb and G. Rohn (Davenport, 2015; Morris et al., 2017; Schutte et al., 2022). It computes the overlap between the planet, circular starspots with geometric foreshortening, and concentric nested disks of varying intensity to approximate stellar limb darkening. The code is highly efficient and coupled to a Markov Chain Monte Carlo sampler also written in C, making it ideal for studies on high performance computing facilities. STSP is available on GitHub101010https://github.com/lesliehebb/stsp and was last updated in 2021.
ellc.
ellc (Maxted, 2016) is a semi-analytical and semi-numerical model to analyse the light curves of detached eclipsing binary stars and transiting exoplanet systems. It can include the effects of both occulted and unocculted starspots simultaneously. It is implemented as Fortran subroutines called directly from a user interface written in Python, and is fast enough to enable the use of modern Monte Carlo methods for data analysis and model testing. The source code is available at the via anonymous 111111http://cdsarc.u-strasbg.fr/viz-bin/qcat?J/A+A/591/A111.
3.4.1 Our finding
From this analysis, we draw the following finding.
Finding 2.3
Summary:
publicly available tools for forward-modeling active-region occultations.
Their maintenance and further development is necessary to ensure their utility for analyses of precise transit observations.
Capability Needed:
Publicly accessible, well-maintained, and up-to-date tools for modeling active-region occultations are necessary for analyses of precise transit observations from current and future facilities.
Capability Today:
publicly available tools for active-region occultations in broad photometric bandpasses today.
However, many are not actively developed or maintained.
Mitigation in Progress:
Multiple groups have developed
4 Unocculted Active Regions
Essential uestions:
-
1.
Can we learn about unocculted active regions through the study of transit depth variations in large photometric planet search surveys?
-
2.
How well can other signatures of stellar activity in these datasets such as flares provide information about ?
-
3.
What are the limitations of what we can learn about from transit photometry?
-
4.
Can additional photometric or spectroscopic data taken simultaneously with transit data help to better understand the information encoded in light curves?
-
5.
What data can best inform our knowledge of active region filling factors?
-
6.
How can we best distinguish between starspots and faculae?
-
7.
Can we quantify the noise floor due to granulation as a function of stellar parameters?
4.1 Introduction
4.1.1 Motivation
Unocculted active regions on the heterogeneous surface of a star can impact measured transmission spectra of planets (e.g., Pont et al., 2008; Czesla et al., 2009; Rackham et al., 2017, 2018, 2019; Zellem et al., 2017). In transit photometry, the particular configuration of active regions produces a degenerate signal with an infinite number of different configurations, making unique identification of unocculted regions challenging. Moreover, while the most obvious signature of rotational modulation in broadband stellar time-series photometry is often the signal from starspots, facular regions are expected to induce a more significant impact on transmission spectra due to their complicated spectral signatures (e.g., Cauley et al., 2018). In this , we examine our understanding of unocculted regions and our ability to infer their presence before and during transmission spectroscopy of active stars.
4.1.2 Scope
We focus on three areas of interest , primarily centered around the measurement and understanding of unocculted active regions rather than their impacts on atmospheric retrievals, which is instead discussed in . First, in Section 4.2 we investigate what information can be obtained about unocculted active regions from high-cadence transit photometry. In Section 4.3 we explore the usefulness of other datasets, current or planned, in understanding these regions. Finally, in Section 4.4 we discuss the effects of stellar granulation on transmission spectra.
4.2 Information from high-cadence transit photometry
High-cadence and high-precision transit photometry, such as that enabled by the Kepler and TESS missions (Borucki et al., 2010; Ricker et al., 2015), also encodes information about the underlying stellar surfaces. Here we investigate opportunities from these datasets to directly infer properties of unocculted active regions.
4.2.1 Transit depth variations
Transit shapes can be affected by dynamical interactions between multiple planets or between a planet and its host star, which affects the relative geometry of the system along our line of sight. Transit shapes can also be affected by variability on the stellar surface with no change in the geometry (Agol et al., 2005; Ragozzine & Wolf, 2009; Barros et al., 2013). In this section, we explore how to disambiguate between the two.
Changes in the observed parameters of transiting planets have provided significant opportunities to understand planet-planet and star-planet dynamical interactions. The most dramatic result of a perturbation to a planet’s orbital parameters is in the measured transit timing, which has been used to determine orbital configurations and planet masses, as well as to identify tidal inspiral of hot Jupiter systems (Maciejewski et al., 2016; Patra et al., 2020). In other systems, transit duration variations have provided information about orbital precession.
Transit depth variations, in which the magnitude of the depth of the transit changes over time, are at their most fundamental a change in the relative brightness of the occulted stellar chord compared to the unocculted starlight in the atmosphere. This change can be the result of a few different physical variations. The transit chord geometry itself could be changing as a result of dynamical interactions (Carter & Winn, 2010; Hamann et al., 2019). The unocculted stellar surface could also change in brightness due to a change in the rotational phase of active regions or their emergence or decay. The occulted stellar surface could change in brightness for the same reason, producing an equivalent effect in the opposite direction.
The last of these possibilities is discussed more fully in Section 3. Here we note active regions on the occulted surface produce additional structure in observed transit photometry (Sanchis-Ojeda & Winn, 2011), while unocculted active regions do not: sufficiently high-precision photometry can disambiguate between these cases.
Separating depth variations from dynamical interactions compared to those from unocculted active regions is also possible. One straightforward consideration is that a change in the transit chord should also produce a change in the impact parameter, and thus the transit duration, while brightness variations should not significantly affect the transit duration as observed in broadband photometry. Transit duration variations from long- photometry can be detected at high confidence, with variations of 1 minute/year expected to be common (Boley et al., 2020). In most cases, duration variations should be more significant than depth variations (Holczer et al., 2016). Careful observations over a long baseline, whether from the same telescope or others, can provide the evidence needed to separate these cases.
If a system is observed to have transit depth variations and not timing or duration variations, and there is no evidence for these variations to be predominantly caused by the growth of active regions along the transit chord, then it is plausible that this is the result of changes in the unocculted stellar surface. However, for Kepler and TESS photometry, the primary hindrance in inferring these changes is in identifying which stellar surface—that of the target star or another nearby—is changing. The Kepler telescope point spread function is approximately 6 in size; for TESS, it is typically 30–50 .121212For both telescopes, the is a strong function of location on the focal plane and, more weakly, a function of magnitude and color. A typical photometric aperture used in the Kepler mission has a diameter of 10–20 pixels; for TESS the typical diameter is more than 1 . As a result, each aperture is contaminated by the light of multiple nearby stars, and it is not uncommon for the Exoplanet Follow-up Observing Program (ExoFOP) database131313https://exofop.ipac.caltech.edu/tess/ to report 50 or more stars within one arcminute of a TESS Object of Interest (TOI). In addition, at least 25% of TOIs have unresolved stellar binary companions (Ziegler et al., 2020), which can equally plausibly be the root of stellar brightness variations even when all known nearby stars can be ruled out. It is therefore challenging from transit photometry alone to determine whether a depth variation is due to a change in brightness of the target star, or a change in brightness of a background star, which would have an equivalent effect on the light curve.
This issue can be mitigated at some level by obtaining high-resolution imaging of these systems to limit the parameter space in which relatively bright nearby stars can evade seeing-limited detection (e.g., Law et al., 2014; Baranec et al., 2016; Ziegler et al., 2017). monitoring of potential candidate transits with ground- or space-based telescopes with considerably higher pixel scales a benefit over large photometric surveys themselves. An even more promising route would be to use the existence of transit depth variations in concert with other proxies of stellar activity indicators. For example, chromospheric activity indicators whether potential transit duration variations are due to the target star or chance brightening of star in the aperture.
4.2.2 Active region distributions
In the context of transmission spectroscopy observations, not all active regions may be equally important to consider. Cauley et al. (2018) demonstrate that spectral line contrast absorption decreases dramatically as the separation between a planet and an active latitude increases, with the most significant events occurring when the two are within five degrees of each other. Although not all planets have a low obliquity between their orbital axis and the stellar spin axis (Winn et al., 2010), for the systems where the obliquity can be measured, this consideration can impact our interpretation significantly if we can determine the distribution of active regions on the surface of the star.
Inferring the two-dimensional distribution of active regions on a stellar surface from one-dimensional transit photometry is an ill-posed and degenerate problem, with different stellar surface models able to produce identical light curves (Vogt et al., 1987; Basri & Shah, 2020; Luger et al., 2021b). This is the case even if one is trying to recover information on dark (or bright) features alone. However, the problem is compounded as active regions typically contain bright (facular or plage-like) features and dark spots. The contributions from these can add or partially cancel, depending on the location of the features, the wavelength at which the star is observed, and the feature size (or magnetic field strength) and the stellar spectral type. The contribution of faculae is particularly poorly characterised (see Section 2.3.3 and Section 5.3).
In general, longitudinal information is more easily recovered than information about the latitudes of unocculted active regions (Luger et al., 2021b), although this is complicated further by the potential of active regions that manifest at all longitudes, such as a banded region or a polar spot. While there is some asymmetry even in banded features, their photometric signal is only representative of the asymmetry rather than the total filling factor, requiring other techniques to infer their structure.
As discussed in Section 3, significantly more information can be learned about the size and structure of active regions when they are occulted by a planet. In the context of transmission spectroscopy, the most promising avenue to use transit photometry to understand active regions outside of a narrow transit chord is to consider multi-planet systems with strong dynamical interactions. Over years to decades, multi-body perturbations can affect neighboring planets’ inclinations by a few degrees; in some cases, planets can move from transiting the stellar equator to not transiting.
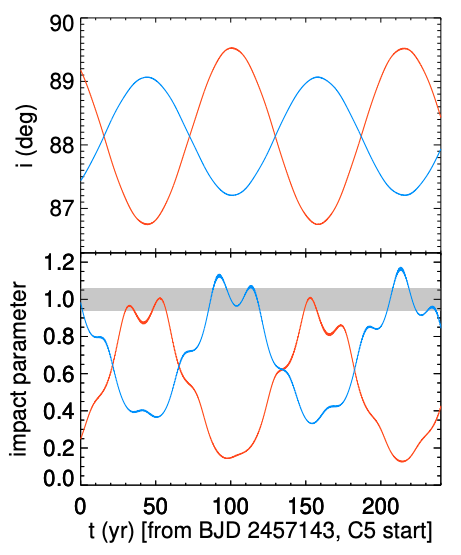
The K2-146 system, described by Hamann et al. (2019) and Lam et al. (2020), provides an example of these perturbations in action (Figure 15). Over 10 years, the impact parameter for both planets can change by 10%, leading to a 10-degree change in the projected latitude of the transit chord on the surface of the star. Regular monitoring of occulted active regions over many years can then give a broader understanding of unocculted surfaces at the time of transmission spectroscopy observations, especially those surfaces within a few degrees of the transiting planet that are most critical for interpreting the transmission spectrum.
It is also helpful to know the inclination and rotation period of the star, and to observe a large number of rotations (Basri & Shah, 2020). This could, in particular, help to distinguish between the effects of the active regions on the light curves due to the stellar rotation (change in the projected area and contrasts) and the evolution of active regions (e.g., redistribution of the magnetic flux between the dark and bright components leading to a change in their relative contributions as well as flux decay). Furthermore, a promising tool to distinguish between the signatures of planets, starspots and faculae in the light curves is offered by multiband photometry, due to the different center-to-limb contrasts of the different occulters (see Section 4.3.1 for further details).
4.2.3 Stellar flares
The presence of unocculted active regions can also be traced in principle by measuring the occurrence rate and energy of stellar flares. Kepler and TESS have been effective flare-finding missions (e.g., Davenport, 2016; Günther et al., 2020). Flares appear in these light curves as stochastic spikes, which can be separated from slower and usually weaker variations or sources of noise (Feinstein et al., 2020). Since flares are distinct events, it can be easier to unambiguously measure their specific occurrence rate for stars, compared with the degeneracies in estimating the true filling factor of, e.g., starspots, as discussed above.
Detailed statistical analyses of flares on Sun-like stars (e.g. Maehara et al., 2015; Notsu et al., 2019; Okamoto et al., 2021) are limited in their ability to compare directly to the Sun itself: the smallest flares on Sun-like stars observed by Kepler are still more energetic than the largest flares observed on the Sun or even than the upper limit on the possible solar flare energy (Schrijver et al., 2012; Aulanier et al., 2013). Yet these so-called “superflares” seem to follow the same relationship between occurrence and emitted energy as smaller flares, suggesting a common physical origin. There is clear and convincing evidence that the energies of solar flares are correlated with the magnetic energy in active regions on the Sun (Mayfield & Lawrence, 1985). For example, flare rates on the Sun are higher during activity cycle maximum, when the largest number of sunspots and active regions are present (Aschwanden & Freeland, 2012). Three potential extreme solar particle events, identified by Brehm et al. (2021) in the newest radiocarbon data with annual resolution, all occurred close to solar activity maxima (Usoskin et al., 2021). Notsu et al. (2013) similarly demonstrate that the energies of superflares observed on solar-type stars trace the total starspot coverage on these stars. Yet the occurrence of strongest flares or flare candidates on the Sun does not seem to be closely correlated with the strength of the cycle, and strong events can happen even during relatively weak cycles (Bazilevskaya et al., 2014; Omodei et al., 2018; Usoskin et al., 2021). From an analysis of main-sequence stars, Roettenbacher & Vida (2018) found that only low-amplitude flares were correlated with observed starspot phase.
For stars that are different from the Sun, there are more uncertainties about the relationship between active region coverage and flare frequency, making a more difficult proxy to interpret for transmission spectroscopy analyses. flare energies on stars provides us with key information about the overall active region coverage on these stars. However, locating these active regions on the stellar surface is not possible from observing the flares alone, somewhat limiting our ability to infer the impact of these active regions on exoplanet transmission spectra.
Doyle et al. (2018) find no correlation with rotational phase for any flares on M dwarfs, an interpretation matched by Feinstein et al. (2020) in an analysis of stars in young moving groups. These observations may suggest very large (80%) active-region filling factors are typical for M dwarfs and young stars, consistent with values inferred via spectroscopic methods of the young star LkCa4 (Gully-Santiago et al., 2017), or may suggest variations in the underlying relations between active-region size and flares on non-Sun-like stars. For M dwarfs, flares may primarily occur from smaller active regions spread across the entire photosphere, while the starspot modulations observed by Kepler and TESS may be tracing larger and more stable active regions or “spot caps” (Hawley et al., 2014). There is an opportunity for continued theoretical modeling of active regions on these stars to be combined with the additional photometry for young and low-mass stars that will be collected over the coming years with TESS to more fully understand the relations between flares and active regions on stars different from the Sun.
4.2.4 The potential for improved data analysis methods
While some features of active regions, such as the overall latitude distribution, can demonstrably not be uniquely inferred from transit photometry, here we consider what limitations may be due to current data processing practices.
The Kepler and TESS data analysis pipelines are motivated by the search for exoplanets. While they do try to preserve stellar signals when possible, attempting to maintain those signals is sometimes at odds with the goal of planet detection.
Planet transits are relatively small signals (hundreds of ppm) with sharp features, few-hour timescales, and characteristic shapes, and are mostly achromatic. Therefore, relative precision is only needed on timescales of hours to a few days, while slow variability can be effectively removed by data processing pipelines. Since the signals are nearly achromatic, single-bandpass broadband photometry is acceptable for finding transits.
Significant effort has been made towards increasing the photometric precision achievable by analyzing these data for transits, though there is clear evidence that additional information can be recovered to better understand the observed stars themselves. For example, Montet et al. (2017) used the Kepler full-frame images, a set of calibration data obtained approximately monthly over the Kepler mission, to calibrate photometry from that telescope and measure absolute brightness variations over multi-year timescales. That data product provides the opportunity to probe the relative contributions of facular and spot regions on the surface of the star as they grow and decay due to changing activity levels.
Similarly, Hedges et al. (2021) characterized the color dependence of the Kepler point spread function, enabling identification of changing average stellar temperatures (and thus colors) over the course of the mission. This technique has the potential to further our knowledge of large active regions, possibly breaking some degeneracies between starspot size and temperature by providing effective multi-wavelength photometry over a four-year baseline. It also could enable improved inference of temperatures of stellar flares observed by Kepler.
Further development of new data analysis methods for Kepler and TESS data can help understand unocculted active regions in spaces where information may be quashed by the instrument pipeline or otherwise overwhelmed by systematic effects. Possible opportunities where significant progress may be both achievable and particularly beneficial include the improved recoverability of low-amplitude or long-period rotational modulation, the characterization of the smallest flares, and the development of machine learning methods to separate astrophysical and instrumental signals.
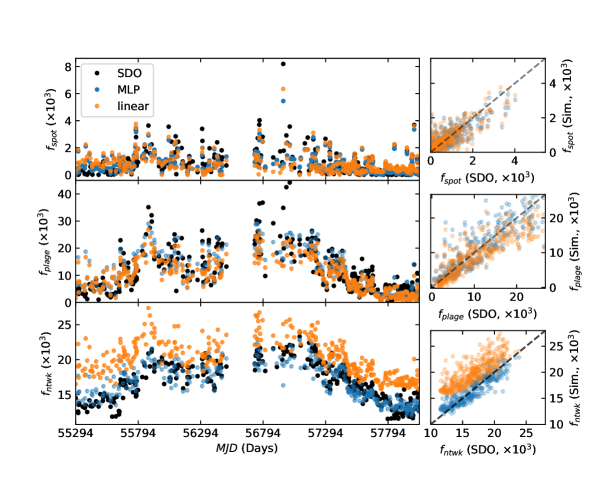
4.2.5 Our finding
From this analysis, we draw the following finding.
Finding 3.1
Summary:
High-cadence light curves provide the potential to understand unocculted active regions, but the information is not comprehensive enough to make unambiguous measurements at present.
Theoretical advances are needed to make full use of these light curves.
Capability Needed:
Significant theoretical work is needed to understand the relations between observational signatures of stellar activity in light curves
advances in data analysis methods developed to re-analyze archival data sets can provide major improvements in our ability to leverage information from .
Capability Today:
are producing opportunities for improved data analysis tools .
can be supported by programs such as NASA .
Mitigation in Progress:
The NASANSF enabled opportunities for the development of theoretical work to improve our understanding of the effects of stellar activity on time-series spectroscopy , which is a parallel need to the theoretical work outlined here.
4.3 Information from other datasets
In characterizing the effects of unocculted active regions on transmission spectra, the high-cadence photometry obtained to discover these systems does not exist in a vacuum. Here we consider other observations, whether or not they are obtained simultaneously with the transmission spectrum, and their ability to understand active regions. Solar observations show that the absolute as well as the relative surface coverage of spots and faculae (or plage) varies as a function of time. As the transmission spectrum “contamination” depends on the feature contrasts in the given spectral band, a single active-region tracer is generally insufficient and ideally two active region tracers should be combined, ideally with very distinct sensitivity levels to bright and dark active region components.
4.3.1 Multiband photometry
Both Kepler and TESS observe with a single broadband filter. With simultaneous observations at multiple wavelengths, the changing color of an active stellar surface over time can be inferred. This strategy has been used to determine temperatures of stellar flares (Howard et al., 2020), and there is a long tradition of using multiband photometric light curve modeling to infer spot temperatures and covering fractions on active stars (see Section 2.4.2 and Berdyugina (2005) for a review on starspot properties and observations). While multiband photometry can lift some of the degeneracies between filling factors and active region temperatures (e.g. Rosich et al., 2020), spot contrasts only vary slowly as a function of wavelength, meaning that spot temperature determinations remain very uncertain. Recovering active-region filling factors becomes even more of a problem when trying to map spots and faculae simultaneously using broad-band photometry. However, as facular regions have a much stronger spectral signature than starspot regions (Shapiro et al., 2014), narrow-band photometry focused on particular spectral regions (e.g., Ca ii H & K and molecular bands such as CN bands, the CH G-band, or the TiO band in the red optical; Zellem et al. 2010) could provide an outsized benefit in understanding the distributions of faculae, motivating future theoretical modeling. These spectral regions are also discussed more fully in Section 4.3.4.
Work by Milbourne et al. (2021) suggests that for solar twins, where spot and facular contrasts are relatively well constrained by theory and solar observations, it should be possible to recover spot and facular filling factors using a combination of high-fidelity broadband photometry and a magnetic-activity tracer such as the Ca S-index (which can either be obtained using high-resolution spectroscopy or narrow-band photometry). The first results are promising (Figure 16), though they rely on accurate knowledge of the spot and facular contrasts. There is also both theoretical and observational evidence that spot and facular contrasts are affected by stellar metallicity, but the effects have not been fully explored in detail for a large population (Karoff et al., 2018; Witzke et al., 2018). Thus, more information on active-region contrasts for different spectral types and metallicities is needed before this can be extended to stars with non-solar spectral types. Further work will also be needed to explore how the location and relative importance of spots and faculae affects such reconstructions.
To map and understand the distribution of faculae, their spectral signatures should be further explored. Faculae have strong UV contrasts, though this has as yet been not fully explored, mainly due to a lack of time-resolved UV photometry. Broadly, optical photometry has been traditionally considered to retrieve stellar heterogeneities from long-term photometry, with the Strömgren and filters commonly considered (e.g. Gray, 2005). photometry may provide a promising addition to this set, though current capabilities may enable only a limited benefit compared to monitoring of stellar calcium emission features (Findeisen et al., 2011). In the , there is some evidence that signatures of stellar activity may be even smaller than anticipated for some young stars (Miyakawa et al., 2021), making them a sub-optimal choice to measure long-term photometric variability. However, Stefansson et al. (2018) highlight a promising custom filter, wide and centered at . This filter spans the Ca ii infrared triplet and minimises the effects of telluric absorption. These authors suggest this filter offers an inexpensive opportunity to study stellar activity in the ; further work should be undertaken to determine the usefulness of this or other potential bandpasses in the context of identifying and quantifying the extent of stellar surface heterogeneities.
4.3.2 photometry
For many bright stars, additional photometry exists from ground-based surveys with baselines extending ten years or more before the present day. These data are often leveraged by the exoplanet community to great effect in the confirmation and characterization of planetary systems, demonstrating their utility in combination with high-cadence transit photometry. In particular, the (Pollacco et al., 2006), (Pepper et al., 2007), and (Kochanek et al., 2017) surveys often have the precision to separate planet candidates from background eclipsing binaries and infer stellar rotation periods through starspot modulation. On much longer timescales, the survey provides photometry with 0.1 magnitude precision over 100 years through the digitization of a photographic survey that began in 1885. These data have been used to study long-term variability in the Kepler field (Tang et al., 2013).
These datasets offer a tradeoff between time baseline and photometric precision, with a century of data available at % precision or a decade at % precision. or the growth and decay of large polar spots.
While these data have information about unocculted active regions that can be used to understand the overall activity level of the star, they are collected years or decades before the transmission spectra are obtained. Long- observations do provide data on the relative overall activity of the star at the current time, through spectroscopic tracers such as a single measurement of chromospheric activity from the Ca ii H and K lines can provide a similar level of information contemporaneously with the transmission spectrum. There is currently a paucity of theoretical motivation suggesting that these observations can provide useful information in interpreting a transmission spectrum. The converse has even been suggested: Iyer & Line (2020) suggest that prior knowledge of stellar heterogeneities does not improve precision in planetary parameters achievable from an atmospheric retrieval if the heterogeneities are appropriately marginalized. Expanded theoretical work highlighting benefits of this long-term photometry specifically in the context of transmission spectroscopy would help to motivate the future utility of these data in this context.
4.3.3 Interferometry
The nearby active star And is among the so far few stars for which a global surface temperature map has been successfully constructed via aperture synthesis imaging (Roettenbacher et al., 2016). The data, which were obtained with the interferometric Array at a wavelength of 1600 nm and an angular resolution of 0.5 mas, reveal variations in the surface temperature that are related to starspots.
Interferometric observations are possible with present technology only for bright stars with large angular sizes; these are typically red giants. Recent work has enabled constraints on the spot locations for the K2V exoplanet host Eridani through a combination of RV spectroscopy, TESS photometry, and (Roettenbacher et al., 2022), though the spot detections are marginal with this dataset, underscoring the challenge of imaging exoplanet hosts. Thus, the primary utility of optical interferometry at present is in enabling a better understanding of possible configurations of active regions on stellar surfaces, which can be compared to theoretical models to provide constraints on the stellar dynamo. In the context of transmission spectroscopy, an important step is theoretical modeling of the differences between the dynamo and resultant magnetic fields between typical planet-hosting stars and the giants that are observable with optical interferometry.
4.3.4 Low- and medium-resolution spectroscopy
Photometric observations of active stars can be used to identify active regions, especially starspots. However, they typically produce a degeneracy between filling factors and active region temperature: a given amount of photometric modulation could be produced by a relatively small but very dark starspot or a larger spot with a relatively small differential between its temperature and the unocculted stellar surface. Low- and medium-resolution spectroscopy can offer a more detailed view than photometry, provided the instrumental stability is sufficient to monitor relatively subtle spectral changes. An example of (facular-dominated) solar cycle variability observed at mid-resolution () with the is shown in Figure 17 (Marchenko et al., 2019). The blue and UV wavelength regions are of particular use here as facular contrasts are much larger at shorter wavelengths. A number of relatively broad spectral features stand out, such as the Ca ii H & K lines, the CH G-band, and the CN violet system (see Section 4.3.1).
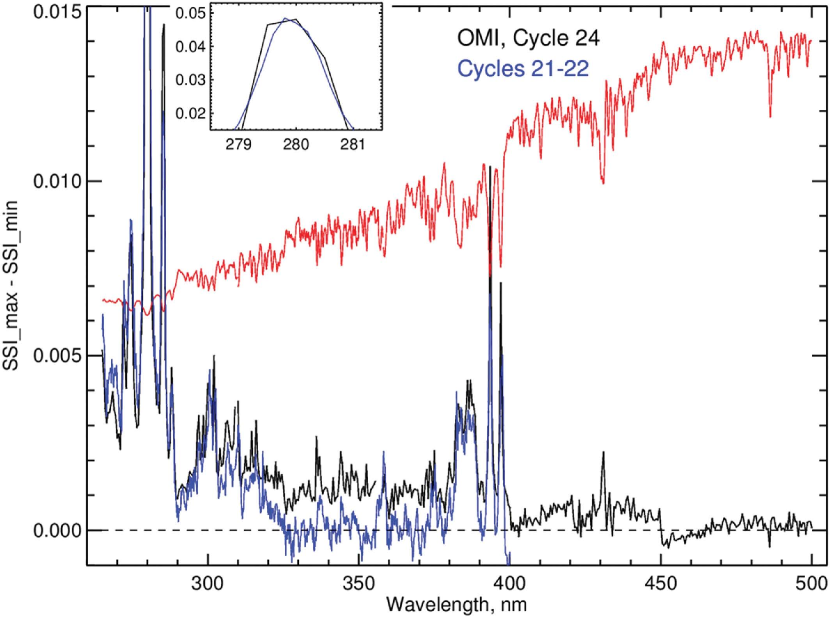
little is known about contrasts of active regions on stars of spectral types other than the Sun and more theoretical work is needed to understand and model bright features (see Section 5.3). Magnetoconvection simulations show that faculae will become less bright for later spectral types, in particular for M stars (Beeck et al., 2015a). Preliminary calculations suggest variability in the CN and CH bands will decrease, while TiO bands become more important; at the same time, facular UV contrasts remain comparable to those observed for Sun-like stars (Norris, 2018).
4.3.5 High-resolution spectroscopy
Much as in the low/medium resolution spectroscopy discussed in the previous section, high-resolution spectroscopy can be used to better understand active-region filling factors. With sufficiently high resolution, molecular bands can be detected at high significance. Spectroscopic signatures of molecular features are strong functions of temperature and pressure, so these features provide an ideal laboratory to understand the stellar surface as the sum of multiple components at different temperatures (e.g., Berdyugina et al., 2003). For example, O’Neal et al. (1998b) demonstrated that the active K star II Peg had a coverage fraction of 50% from observations of TiO molecular bands. Gully-Santiago et al. (2017) showed an even higher filling factor for the young star Lk Ca 4 using the same molecular features. In fact, the most studied active K stars II Peg and IM Peg were never observed in their unspotted states, as evidenced by the continued presence of variable TiO bands in their spectra (Neff et al., 1995; Berdyugina et al., 1998, 1999). Thus, the disappearance of the TiO bands forming only in cool spots can provide the reference for the unspotted stellar atmosphere and brightness (Berdyugina et al., 1998). Similar observations of other stars at different levels of activity remain critical to understanding overall active-region filling factors and thus the underlying sizes, atmospheric parameters, and distributions of active regions.
Additionally, molecular features trace the stellar magnetic field through their polarization (Berdyugina, 2011). High-resolution spectropolarimetry of these lines provide estimates of magnetic fields on active stars, also directly within spatially unresolved spots (Berdyugina, 2002; Berdyugina et al., 2006). In particular, Afram & Berdyugina (2015) highlight that high-resolution spectropolarimetry of TiO on M dwarfs, CaH on K dwarfs, and MgH and FeH on G dwarfs provide particularly promising avenues to understand stellar magnetic fields. This has been demonstrated for M dwarfs by studying atomic and molecular spectropolarimetric signatures, revealing variations of the magnetic field complexity on stellar surfaces, with the height in the atmosphere and depending on the stellar effective temperature (Berdyugina, 2011; Afram & Berdyugina, 2019).
Extreme precision radial velocity (EPRV) observations to measure planet masses and orbits also require care to mitigate the effects of active regions on stellar spectra . Considerable effort has been expended to attempt to separate the effects of stellar active regions from planetary signals. These efforts have been successful in developing methods that can effectively predict the RV signal from active regions from observed photometric variability (e.g. Aigrain et al., 2012) and to model the surfaces of very active stars to measure the masses of their planets (e.g. Barragán et al., 2019). Observations of the Sun with the spectrograph also demonstrate that RVs can effectively be modeled in the face of known active region distributions (Milbourne et al., 2021).
A common finding in EPRV studies of active regions is the importance of simultaneous photometry and spectroscopy to condition data-driven models. Having both data sets is critical in many cases to measure planet masses (Oshagh et al., 2017); it is likely that in many cases simultaneous observations will also provide a benefit to uniquely characterise unocculted active regions in transmission spectroscopy data.
4.3.6 Conclusion
Each of the methods described in this section holds the potential to improve our understanding of unocculted active regions for transmission spectroscopy. While there is evidence from EPRV observations that simultaneous photometry is highly important for active stars, it is not as obvious for stars with lower activity levels. An important step forward is not just understanding what data additional sets are important, but to what level the answer is a function of spectral type, age, and/or activity level. Theoretical work that can effectively predict the effects of stellar activity on transmission spectra would be beneficial in answering this question.
4.3.7 Our finding
From this analysis, we draw the following finding.
Finding 3.2
Summary:
Simultaneous multi-band photometry and contemporaneous spectroscopy provide critical information towards understanding the potential effects of active regions on transmission spectroscopy observations.
While other data sets can provide information on filling factors, theoretical work is needed to maximise the utility of these data for transmission spectroscopy.
Capability Needed:
A better understanding of the emergent flux from stellar active regions, including both photometric (SED) and spectral signatures (e.g., Na D , etc.), especially for spectral types and metallicities other than the Sun, is essential to robustly interpret transmission spectra.
Capability Today:
There is a relatively good understanding of active-region contrasts for solar twins from solar observations and modeling.
Mitigation in Progress:
Ab-initio modelling of emergent fluxes from spots and faculae for different spectral types is being developed by multiple research groups .
4.4 Stellar granulation
One of the ultimate sources of an astrophysical “noise floor” in stellar light curves is stellar surface granulation. Because it is a fundamental feature of stars with convective envelopes (i.e., K), it represents a true lower limit to the photometric variability that any star can attain. This is summarized in Figure 9, where the lower “granulation flicker floor" shows the lowest possible photometric variability amplitude for otherwise inactive stars, as a function principally of the stellar surface gravity, . On the timescale of typical planet transits (i.e., 8 hr), in the Kepler bandpass (i.e., visible light), the “granulation flicker” noise ranges from 0.02 ppt for the least active dwarfs to 0.4 ppt for the least active giants.
The amplitude of the “granulation flicker” noise scales with the granule/inter-granule brightness contrast, which is minimized at longer wavelengths. For example, the granular brightness contrast for a solar-type star is lower at 10 than in visible light. Thus, for inactive dwarfs, the “granulation flicker” noise at 10 should be as low as 0.2 ppm on planet-transit timescales.
While these are relatively small contributions to the overall stellar photometric noise, from the standpoint of a planet transit spectrum, the impact can become the dominant source of uncertainty, particularly for transits around larger stars and at shorter wavelengths. That is because a larger star of a given mass will have a lower surface gravity, hence a stronger granulation signal, and as noted above, that signal is strongest in the visible. for planets transiting Sun-like stars observed in the visible, the absolute error on the retrieved planet radius due to granulation noise can be as large as 2% and 10% for super-Earth and Earth-sized planets, respectively.
In practice, stellar granulation can impact the transit spectrum thus in two ways. The first and most obvious one is the one related to the extra noise this granulation adds to light curves, effectively setting a lower limit to the possible precision attainable on the retrieved transit depths as a function of wavelength. This source of noise, however, should be minor in most cases. While studying this, Sarkar et al. (2018) considered the relative and absolute contributions to the error budget for atmosphere retrieval of the planets HD 209458b (a hot Jupiter orbiting a G0V-type star) and GJ 1214b (a super-Earth orbiting an M4.5V-type star). The results are summarized in Figure 18 and Table 4, where we see that in the worst case (HD 209458b in the visible), where the stellar noise from granulation dominates over the photon noise, the impact on the transit-depth measurement for atmospheric retrieval is at most 0.05%.

| Channel | GJ 1214b | HD 209458b | ||
|---|---|---|---|---|
| (µm) | ||||
| ppm | % | ppm | % | |
| AIRS Ch1 (3.9–7.8) | 1.5 | 0.01 | 3.6 | 0.01 |
| AIRS Ch0 (1.95–3.9) | 2.3 | 0.01 | 3.5 | 0.01 |
| NIRSpec (1.25–1.9) | 3.1 | 0.01 | 4.5 | 0.02 |
| FGS 2 (1.1) | 2.8 | 0.01 | 7.5 | 0.03 |
| FGS 1 (0.9) | 4.4 | 0.02 | 9.0 | 0.03 |
| VisPhot (0.5) | 9.6 | 0.04 | 14.9 | 0.05 |
The second way in which granulation could impact on the transit spectrum, however, is through the transit light source effect, similar to the impact caused by unnoculted spots and faculae described by Rackham et al. (2018, 2019), but produced by the effectively different granulation pattern in different parts of the stellar surface. This is an effect that Chiavassa et al. (2017) studied through 3D simulations using the STAGGER grid and synthetic images computed with the radiative transfer code OPTIM3D . The study concluded that the impact of this contamination could be as large as a few percent in the transit depth of small, terrestrial exoplanets orbiting Sun-like stars at m. While Chiavassa et al. (2017) did this experiment with simulations for both a Sun-like star and a K-dwarf star, it is unclear how big this impact is in reality, and how realistic those simulations are both as a function of wavelength and granulation amplitudes. This latter effect is one that should be studied in detail, especially given missions such as the ones proposed in the Astro2020 Decadal Survey, which could perform precise optical spectrophotometry.
4.4.1 Our finding
From this analysis, we draw the following finding.
Finding 3.3
Summary:
Stellar “granulation flicker" constitutes a fundamental “noise floor" on stellar light curves that increases with decreasing stellar surface gravity and at shorter wavelengths.
The impact of this stellar granulation can enter as a source of noise and/or contamination for transmission spectroscopy in two ways.
The first is through extra light curve scatter, impact is minimal in most cases (at most 0.05% error on the transit depth in the visible and even less at longer wavelengths).
The second is through a contamination source similar to that of spots and faculae, albeit at a much lower amplitude ( of the transit depth at about 0.7 m).
This second source is significant at short wavelengths for smaller exoplanets around Sun-like stars, but decreases strongly as a function of wavelength.
Capability Needed:
3D granulation simulations need to be validated against observed light curves as a function of spectral type and wavelengths relevant for future space-based observatories (0.3–5 ).
Simulations of exoplanets crossing those simulated stellar surfaces should be to study the full impact of these features as a contamination source in the transmission spectrum of high-profile exoplanet systems.
Capability Today:
Granulation is well understood in large optical bandpasses from space-based missions such as Kepler TESS.
Methodology is in place in order to understand and analyze its amplitude given an observed precise light curve.
3D stellar models can be used to model granulation as a function of wavelength for different spectral types.
Mitigation in Progress:
All-sky missions such as TESS can retrieve the properties of the granulation signal for high-profile exoplanet host stars .
5 Stellar & Planetary Retrievals
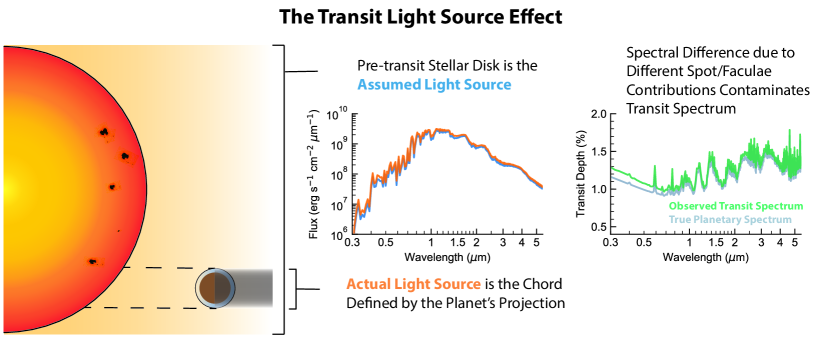
Essential uestions:
-
1.
What is the state of the art for stellar and planetary retrievals of transmission spectra?
-
2.
What wavelengths and resolutions are necessary for useful constraints on active-region contrasts and coverages? Do these requirements vary with spectral type?
-
3.
What are the best practices for propagating stellar spectral information into atmospheric retrievals of transit observations?
-
4.
What additional information is necessary to uniquely disentangle stellar and planetary signals via retrievals?
-
5.
What are the limitations of using retrievals to disentangle stellar and planetary features?
-
6.
What future work should be pursued in this context?
5.1 Introduction
As noted in Section 1, a primary concern with transmission spectroscopy is the potential of unocculted active regions (including, e.g., spots or faculae) to alter transit depths through the transit light source effect (TLSE, see Figure 19) and, thus, bias inferences of the properties of the exoplanetary atmosphere. Here we examine the state of the art for Bayesian frameworks that jointly fit for the properties of a planetary atmosphere and a heterogeneous stellar photosphere, i.e., one with magnetic active regions. We begin by defining more precisely these retrieval frameworks and outlining the scope of our analysis.
5.1.1 Retrievals
Atmospheric retrieval refers to a broad class of techniques used to extract constraints on properties of a planetary atmosphere (e.g., composition, temperature, clouds) from an observed spectrum. Retrieval codes start with a set of spectral observations, such as HST transmission spectra, and compute the range of models consistent with the data, as illustrated in Figure 20. A retrieval model describes an atmosphere by a set of free parameters (e.g., molecular abundances, planetary radius) and uses a Bayesian sampling algorithm (typically MCMC or nested sampling) to explore the posterior distribution of the model. A retrieval typically computes spectra to map the parameter space defining a model, with nested models then compared to identify the statistical significance of each model component (e.g., whether a given molecule is supported by the data).
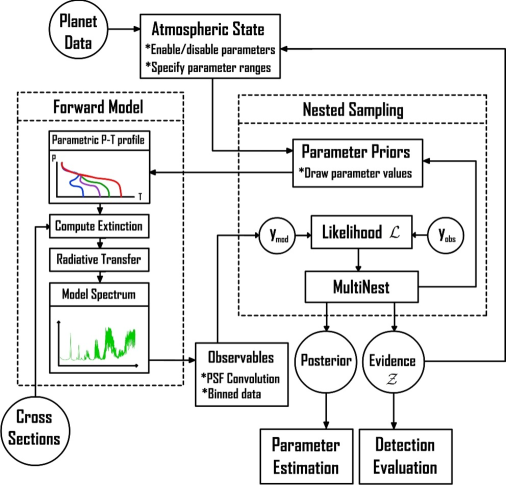
5.1.2 The scope of this analysis
Extracting the most information from transmission spectra requires inference frameworks that allow us to constrain the properties of stars and planets simultaneously. In this context, the analysis presented here considers how we can best use the information we receive on both stars and planets in transit observations from space-based facilities. We focus on three areas of interest: the utility of joint stellar and planetary retrievals generally (Section 5.2); the known limitations of the approach, with a focus on the availability of suitable model spectra for stellar active regions (Section 5.3); and the complementarity of short-wavelength observations to HST and JWST NIR observations for inferring stellar photospheric properties (Section 5.4). In the following sections, we summarize the analysis that leads to our top-level findings in these three areas.
5.2 The utility of joint stellar and planetary retrievals
We first consider the general utility of employing joint stellar and planetary retrievals over other, simpler approaches. In reaching our finding, we how unocculted stellar heterogeneities modify transmission spectra, approaches for directly correcting for stellar spottedness without using retrievals, the current state of the art for modeling stellar photospheric heterogeneity in retrievals recent studies that suggest direct approaches for corrections may underestimate the actual level of stellar heterogeneity the utility of retrievals.
5.2.1 Unocculted stellar heterogeneities modify transmission spectra

When a stellar surface contains heterogeneities residing outside the transit chord (i.e., unocculted spots and faculae), the transmission spectrum of a transiting planet can accrue a wavelength dependence not caused by the planetary atmosphere. The origin of this effect is a mismatch between the stellar intensity incident on the planetary atmosphere and the average intensity of the full stellar surface (see Figure 19). The TLSE can be expressed by the following functional form:
| (3) |
where is the observed transmission spectrum, is the intrinsic transmission spectrum of the planetary atmosphere (i.e., the square of the wavelength-dependent planet-to-star radius ratio), and is the wavelength-dependent “contamination factor” introduced by the TLSE. For a stellar surface with a single type of unocculted heterogeneity (i.e., a population of similar spots or, alternatively, faculae), the contamination factor can be written as (e.g., Rackham et al., 2018)
| (4) |
where is the fractional coverage area of the heterogeneous regions, and are the specific intensities of the heterogeneity and background photosphere, respectively, with and being their corresponding temperatures. Figure 21 shows example model spectra of (left panel) and the contamination spectra (right panel). We see that the contamination factor deviates from unity significantly at short wavelengths (), with transit depths enhanced by unocculted spots and lowered by unocculted faculae.
5.2.2 Non-retrieval approaches for correcting for stellar spottedness
Without even turning to retrievals, a rich body of work exists on mitigating the impact of stellar heterogeneities on transmission spectra (see review by Bruno & Deleuil, 2021). In the transmission spectroscopy literature, the primary non-retrieval approach used to account for a heterogeneous stellar photosphere is to apply a direct correction for stellar heterogeneity based on the photometric variability of the star. Modeling the stellar flux as a linear combination of the flux from the quiescent photosphere and spots , which cause a total dimming of at a nominal wavelength , Sing et al. (2011) derive an expression for the correction required for the transit depth , given by
| (5) |
This implies a concomitant correction to the planet-to-star radius ratio of
| (6) |
Zellem et al. (2017) present a similar approach, relying on the variability of the out-of-transit stellar spectra, which are used to establish the baseline for transmission spectroscopy studies, to infer a per-visit stellar activity correction.
However, as noted by Berta et al. (2011), who derived a correction similar to that of Sing et al. (2011), this approach (whether photometric or spectroscopic) relies on the assumption that the maximum brightness in a light curve corresponds to an unspotted photosphere. This is an increasingly poorer assumption for active stars, which can have many active regions that contribute to a persistent level of spottedness as the star rotates.
These highly spotted stars are those for which corrections for stellar heterogeneity are most important to consider. McCullough et al. (2014), for example, note that the strongly sloped transmission spectrum of HD 189733 b could be explained by spots alone (without any contribution from haze in the planetary atmosphere) if the total covering fraction of unocculted spots were 5.6%, not the 1–1.7% coverage that had been inferred through variability monitoring and previously taken into account (Pont et al., 2008, 2013; Sing et al., 2009, 2011). From this example and others, we conclude that rotational variability provides a lower limit on the heterogeneity of a stellar photosphere. Thus, applying a direct correction based on the stellar variability may underestimate the actual correction required.
5.2.3 Including stellar heterogeneities in retrievals
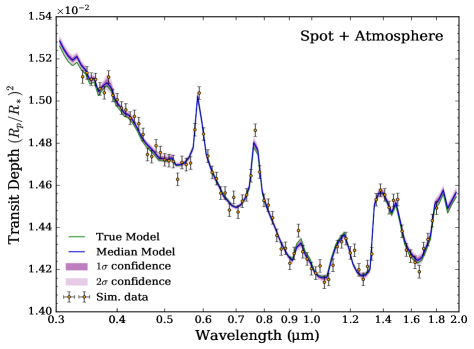
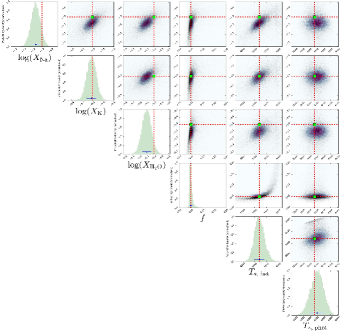
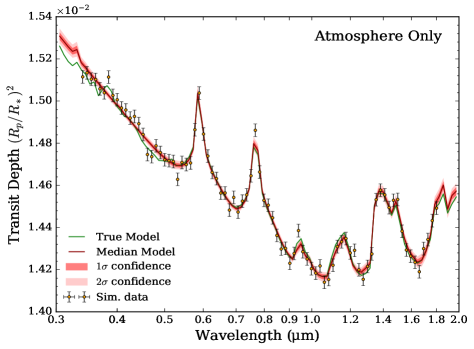
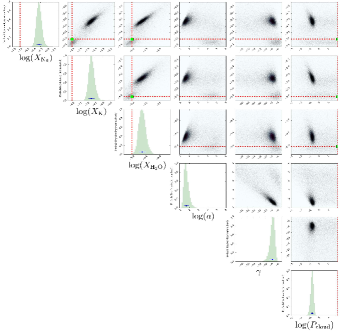
By constraining the impact of stellar contamination directly from transmission spectra, retrievals can identify photospheric heterogeneity that is not evident in variability monitoring. These analyses can fit simultaneously for the properties of the planetary atmosphere and any heterogeneities and appropriately marginalize over the contamination signal while estimating planetary parameters. Retrieval codes typically accomplish this by adding three additional free parameters encoding the heterogeneous regions (e.g., Pinhas et al., 2018; Rathcke et al., 2021): , , and . During parameter space exploration, each pair of and are used to compute spectra of the heterogeneity and the photosphere by interpolating grids of stellar models, e.g., the PHOENIX (Husser et al., 2013) or Castelli-Kurucz grids (Castelli & Kurucz, 2003). Given the interpolated stellar spectra and , the contamination factor is computed using Equation 4 and combined with the atmospheric spectrum as in Equation 3. The combined transmission spectrum is then compared with the observations at each point in the parameter space.
We provide an example retrieval analysis in Figure 22. We generated a simulated transmission spectrum of a hot Jupiter (with planet properties based on HD 209458b) transiting a star with unocculted spots. For this example, we assumed 5% spot coverage with a spot temperature 900 K colder than the photosphere. The unocculted spots produce a steep slope at visible wavelengths and secondary features imprinted by stellar absorption. The simulated data cover 0.34–1.80 , roughly corresponding to the range of HST/STIS+WFC3, at a precision of 30 ppm. We subjected this dataset to two retrievals with the POSEIDON code (MacDonald & Madhusudhan, 2017) under different assumptions: (i) unocculted spots are included within the retrieval; and (ii) no spots are considered, only the planetary atmosphere shapes the spectrum. We find that the atmosphere-only retrieval attempts to account for the lack of spots by adding a haze (producing a similar optical slope) and a cloud deck. While both models result in an acceptable fit, the atmospheric properties are significantly biased when unocculted spots are not considered: the Na and K abundances are biased by 5, the H2O abundance is biased by 3, and one would incorrectly conclude that the atmosphere has potent aerosols. Conversely, the retrieval including unocculted spots correctly recovers all input parameters within the 1–2 expected from Gaussian scatter. The Bayesian evidence also prefers the model including spots (), showing that a retrieval code can differentiate between these scenarios. This exercise demonstrates that biases in atmospheric properties can be mitigated by including stellar heterogeneities in retrievals.

The confidence with which unocculted stellar spots or faculae can be identified is a function of spectral precision, coverage fraction, and wavelength range. Using simulated JWST/NIRISS data and Bayesian model comparisons, Iyer & Line (2020) show how the level of preference for stellar contamination varies with these factors for typical sub-Neptunes orbiting M-dwarfs. For large covering fractions of unocculted spots (above 1, see Figure 23), the Bayes factor increasingly favors a model including the proper TLSE correction across spectrophotometric precisions from 15 to 120 ppm. For small spot covering fractions (below 1), the TLSE signal is evident in high-fidelity JWST/NIRISS data (15 ppm precision). However, it may be harder to identify stellar contamination for small spot coverage at more typical precisions ( 30 ppm). Iyer & Line (2020) draw consistent conclusions for including the TLSE in retrievals—in their case, for JWST/NIRISS data of sub-Neptunes transiting M-dwarfs—compared to those we draw from the analysis of simulated HST/STIS+WFC3 data of a hot Jupiter transiting a G dwarf in Figure 22. Notwithstanding these analyses, there is considerable scope for future work to further quantify when the inclusion of stellar contamination within a retrieval framework is necessary, e.g., considering the sensitivity of such inferences to other instruments with different precisions, wavelength coverage, and spectral resolutions.
The inclusion of unocculted stellar heterogeneities within retrievals is a relatively new addition to the literature. Consequently, approaches can vary between different studies and a “best practice” consensus has yet to emerge. Four of the main differences are as follows.
-
1.
Free parameters: A single heterogeneity can be described by three free parameters (, , and , see Pinhas et al. 2018), or a subset can be fixed (e.g., Bruno & Deleuil, 2021). Additional parameters could be added for multiple heterogeneities. When such models (e.g., including both spots and faculae; Zhang et al., 2018) are necessary is unclear and worthy of future study.
-
2.
Out-of-transit stellar spectra: Recent studies have leveraged baseline, out-of-transit stellar spectra in real and simulated datasets to fit for stellar heterogeneity parameters, either while simultaneously modeling their impact on transmission spectra or simply gathering prior information for analyses of transmission spectra (Zhang et al., 2018; Wakeford et al., 2019; Iyer & Line, 2020; Cracchiolo et al., 2021). It is unclear whether this approach provides an additional advantage over analyses of transmission spectra alone.
- 3.
-
4.
Stellar grids: Many model stellar grids are available, with different grids implemented in different retrieval codes. We consider the impact of this further in Section 5.3.
Alongside these differences, other common assumptions include: fixing the metallicity and surface gravity of any heterogeneities to those of the photosphere (both set to a priori values) and, as noted previously, the consideration of only one heterogeneity. The variety of approaches in the literature to date serves to illustrate that more work on retrievals including stellar heterogeneities will be beneficial.
5.2.4 Existing spectra are impacted
Recent studies employing retrievals have found mounting evidence for unocculted heterogeneities impacting transmission spectra, in many cases at a level beyond what was previously inferred via variability measurements. Pinhas et al. (2018) reanalyzed nine hot Jupiter transmission spectra from HST and Spitzer (Sing et al., 2016), finding moderate evidence (3.1) for stellar heterogeneity in the spectrum of WASP-6b, beyond that previously estimated to be present from variability measurements (Jordán et al., 2013; Nikolov et al., 2015). Another three hot Jupiters show moderate to weak suggestions of stellar heterogeneity: WASP-39b (2.5), HD 209458b (1.6), and HAT-P-12b (1.4). Rathcke et al. (2021) studied the optical and NIR transmission spectrum of the hot Jupiter WASP-79b and inferred the presence of unocculted faculae (4.7) covering 15% of the disk of the F5V host star with a temperature contrast of 500 K. Similarly, Kirk et al. (2021) studied the optical and NIR transmission spectrum of the ultrahot Jupiter WASP-103b, notably using 11 optical transits that paint a consistent picture between epochs and across four instruments. From this spectrum, which shows a marked decrease in transit depth at blue-optical wavelengths, they inferred the presence of unocculted faculae (4.1) covering 20% of the stellar disk with a temperature contrast of 400 K. In these examples, the impact of stellar heterogeneity on the transmission spectra was either underestimated in previous studies applying direct corrections or may have been missed if not for the use of retrievals, which points to the utility of this approach for identifying and disentangling signals from stellar heterogeneity and planetary atmospheres in transmission spectra.
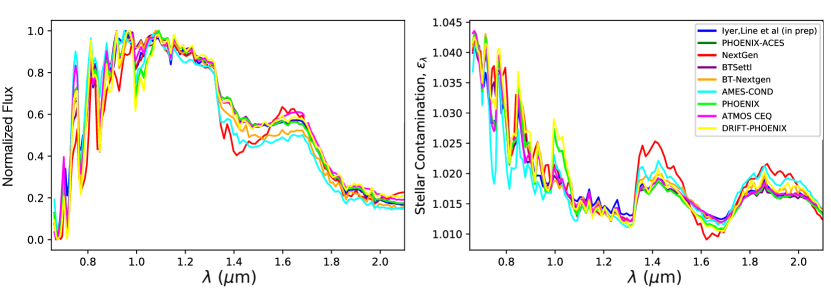
5.2.5 Our finding
From this analysis, we draw the following finding.
Finding 4.1
Summary:
Retrievals of transmission spectra that include the effects of unocculted active regions can guard against biases.
More work is needed to understand when these retrievals are necessary and what are the limitations and best practices of this approach.
Capability Needed:
A detailed understanding is needed of when to marginalize over stellar heterogeneity in retrievals of planetary atmospheric parameters and the best practices for doing so.
Capability Today:
Multiple groups have developed retrievals that use simple parameterizations of unocculted heterogeneities and rely on stellar models .
Mitigation in Progress:
5.3 Limitations of the approach
We next consider the known limitations of the retrieval approach, focusing on the availability of suitable model spectra for stellar magnetic active regions. In reaching our finding, we considered the disagreement among current model stellar spectra and the related impact of employing different stellar spectra on retrieved planetary properties as well as recent advances in modeling spectra of stellar magnetic active regions.
5.3.1 Disagreement among model stellar spectra and its impact on retrievals
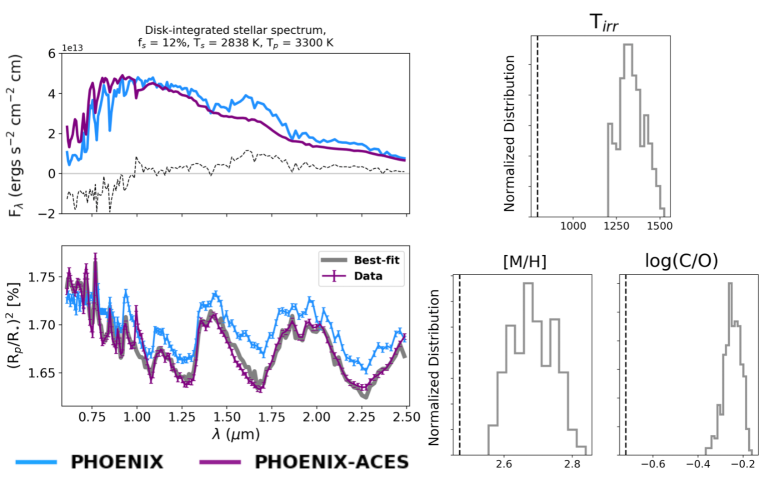
A primary limitation of retrieval approaches for handling stellar contamination is their reliance on stellar models, which vary substantially in their predictions of the spectra of cool stars. Substantial variations in spectral shape among widely used stellar models (Figure 24, left panel) owe to a variety of factors, including the choice of opacity data included and spectral line list completeness; treatment of line-broadening effects; and physical assumptions, such as plane-parallel vs. spherical geometry and vs. non-LTE chemistry conditions. The variation is more pronounced for mid-to-late M stars (3500 K) than for FGK stars due to molecular opacities dominating such atmospheres and photospheric surface heterogeneities that are common in active cool stars (Hawley & Pettersen, 1991; Hawley et al., 2014; Schmidt et al., 2014). As a result, the choice of stellar models used while correcting for TLSE signals can impact planetary properties retrieved from transmission spectra.
This impact has been explored quantitatively in a recent study by Iyer & Line (2020, Figure 25). These authors used the PHOENIX-ACES model grid (Husser et al., 2013) to mimic a “true” disk-integrated stellar spectrum of an M dwarf ( K) contaminated by unocculted spots ( K) covering a fractional area fs of 12. They performed a retrieval on a simulated transmission spectrum with this contamination, using the PHOENIX model grid (Allard et al., 2003) to calculate the TLSE contribution to the transmission spectrum. They find the fit reasonably explains the shape of the transmission spectrum. However, the induced variations in the best-fit spectrum are probably due to false opacity signatures or incorrect estimates of the thermal profile—evident in the form of bias in the posterior probability distributions of the planetary irradiation temperature Tirr, metallicity [M/H], and carbon-to-oxygen ratio (C/O) (Figure 25, right panel). This exercise highlights that, despite an appropriate implementation of the TLSE, our ability to correct for the contribution of stellar contamination heavily depends on the accuracy of the stellar models used to represent the contaminated stellar photosphere—particularly for cooler host stars (K- and M-type)—thereby emphasizing the need for improved stellar atmosphere models.
5.3.2 Advances in modeling spectra of active regions
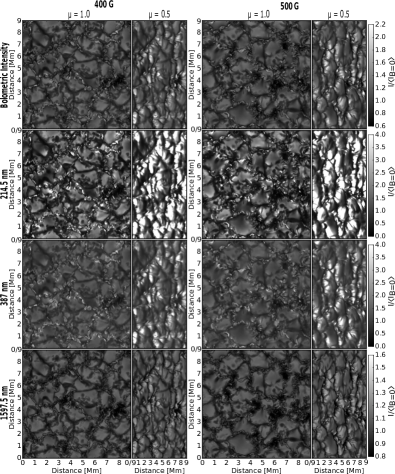
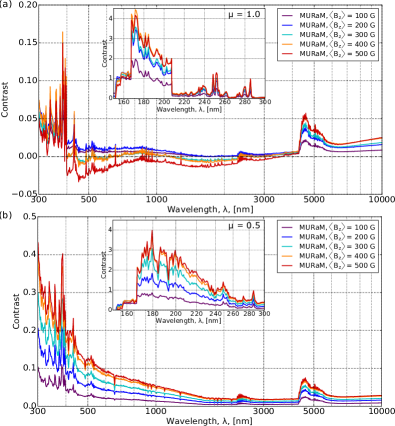
Facular and sunspot contrasts employed by retrieval models are typically derived from 1D, plane-parallel, semi-empirical model atmospheres (e.g., Vernazza et al., 1981; Kurucz, 1992a, b, c; Fontenla et al., 1993, 1999, 2002, 2006). For faculae in particular, such models are adjusted to agree with solar observations (Vernazza et al., 1981). However, for stars other than the Sun, such observations are not available, and thus adjustment of the models is not possible. Furthermore, while such semi-empirical models capture the overall disc-integrated properties of faculae reasonably well, they do not recover the observed center-to-limb variation (CLV) of the facular contrast (e.g., Yeo et al., 2013).
More realistic CLV of facular contrasts is provided by 3D simulations, as discussed in Section 2. The first 3D radiative simulations for stars were reported by Nordlund & Dravins (1990). The magnetic field was introduced in such simulations more recently, and by now a series of models for stars of spectral types F to M with different mean vertical magnetic fields is available (Beeck et al., 2011; Beeck, 2014; Beeck et al., 2015a; Wedemeyer et al., 2013; Steiner et al., 2014; Salhab et al., 2018). Norris et al. (2017) and Johnson et al. (2021) used the 3D MURaM atmospheres from Beeck et al. (2015a) to calculate the CLV of the facular contrast for G2 (see Figure 26), K0, M0, and M2 stars with the mean vertical magnetic field ranging between 100 G and 500 G. Norris et al. (2017) found the computed CLV profiles of a G2 star to be in good agreement with solar observations (Neckel & Labs, 1994). More recently, simulations by Johnson et al. (2021) have clearly demonstrated a strong effect of faculae on the mean brightness and shape of stellar light curves, pointing to the need for more accurate facular models. Using a self-consistent approach and 1D model atmospheres, Witzke et al. (2018) have additionally shown that facular contrast increases with stellar metallicity, underscoring the importance of accurate fundamental stellar parameters when modeling stellar magnetic activity.
In the case of spots, 3D MHD simulations using the MURaM code have been largely successful in reproducing the fundamental observed features of spots, both on the Sun and other stars. Rempel et al. (2009a, b) have produced MURaM simulations of sunspots and found good agreement with observations. Recently, Panja et al. (2020) have used the MURaM code to perform the first ab initio simulations of spots on cool main-sequence stars other than the Sun. Their simulations for G2V, K0V, and M0V stars provide umbral and penumbral effective temperatures for these stars, along with other fundamental parameters of starspots, such as the brightness relative to the stellar surface and magnetic field strength. They conclude that the trend of increasing temperature difference with photospheric temperature that they observe is consistent with observations of starspots.
Taken together, these studies highlight recent advances in modeling spectra of magnetic active regions and underscore the existing limitations. While 1D models, such as those used to derive template spectra for state-of-the-art retrievals of transmission spectra, generally reproduce well the observed features of spots, they fail to capture aspects of facular contrasts that can impact transit observations. In particular, the CLV of the facular contrast and the dependence of facular contrast on stellar metallicity are important in this context but not addressed in modern retrievals. Recent work with 3D MHD simulations can be leveraged to improve template spectra for spots and faculae, though the output of these realistic stellar models has yet to be incorporated into exoplanetary retrieval analyses.
5.3.3 Our finding
From this analysis, we draw the following finding.
Finding 4.2
Summary:
Retrieval approaches rely on stellar models, and thus their accuracy is limited by model fidelity .
Further efforts to develop model spectra for spots and faculae and incorporate them into exoplanetary atmospheric retrievals are needed.
Capability Needed:
More work is needed to (1) further test and develop models for cool stars, (2) assess the impact of using stellar spectra to approximate active regions, and (3) develop model spectra for active regions, particularly faculae, for different spectral types.
Capability Today:
Retrieval analyses today rely on stellar spectra derived from 1D models as templates for spot and spectra.
Mitigation in Progress:
Recent studies have produced ab initio spot and spectra from 3D MHD models for a few FGKM spectral types .
These studies reveal spectral differences with respect to spectra from 1D stellar spectral models that underscore the limitation of this approach, particularly for faculae .
5.4 The complementarity of short-wavelength observations
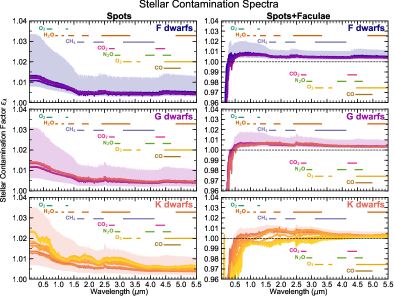

The third and final general aspect we considered is the complementarity of short-wavelength observations to HST and JWST NIR observations for inferring stellar photospheric properties. In reaching our finding, we considered forward-modeling efforts that suggest the impacts of heterogeneous stellar photospheres are largest at UV and blue-optical wavelengths and recent studies that either point to stellar contamination in short-wavelength transit data or increase the model preference for a heterogeneous stellar photosphere by including optical data.
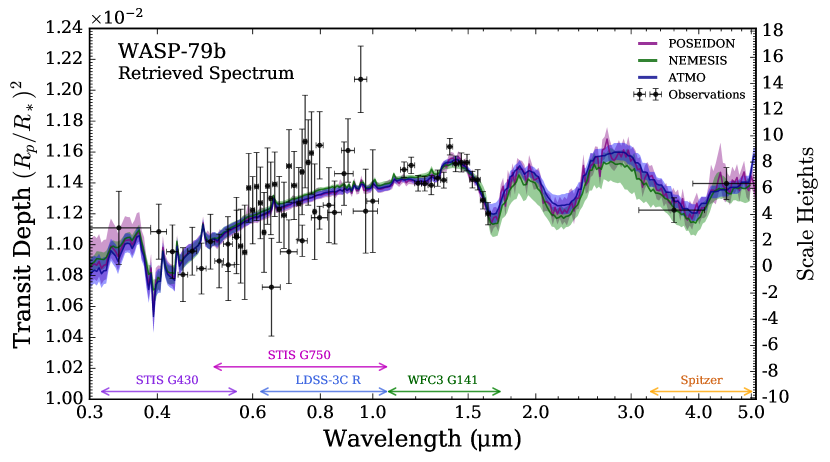
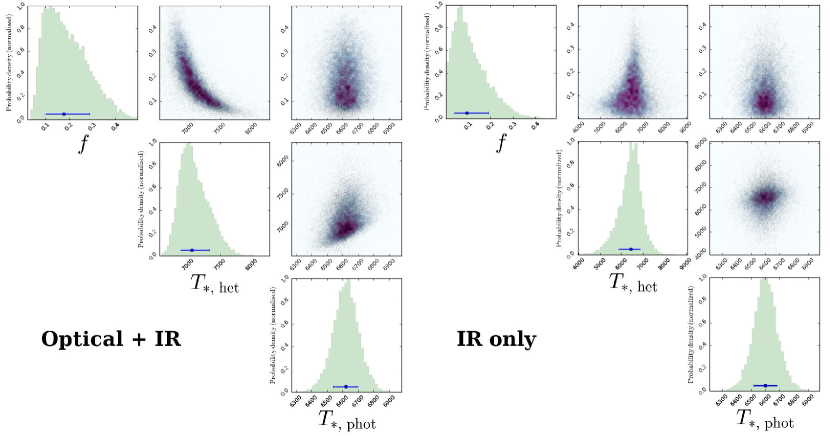
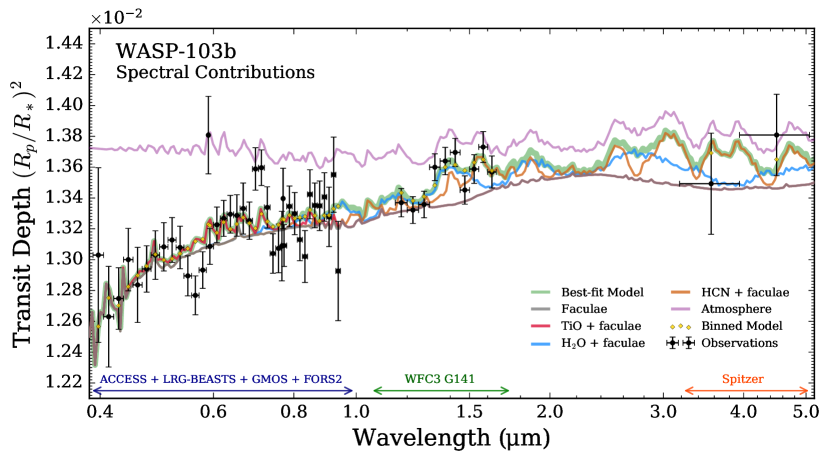
5.4.1 Projected impacts are strongest at short wavelengths
Many studies in the past decade have considered the impact of unocculted active regions on transit observations. Usually, these studies focus on interpretations of transmission spectra from individual systems with active host stars, such as HD 189733 (Pont et al., 2008, 2013; Sing et al., 2009, 2011; McCullough et al., 2014; Oshagh et al., 2014), WASP-6 (Jordán et al., 2013; Nikolov et al., 2015), and GJ 1214 (Berta et al., 2011, 2012; Rackham et al., 2017). Despite the different spectral types and activity levels of these host stars, studies of individual targets like these consistently find that the projected impacts of unocculted active regions are most evident at blue-optical and shorter wavelengths, where the contrasts between active regions (whether spots or faculae) and the quiescent photosphere are greatest.
This finding is borne out as well by studies of unocculted active regions for less-active stars, like the Sun. Llama & Shkolnik (2015) studied the impact of solar-like photospheric heterogeneity on transits by injecting a hot Jupiter transit into resolved observations of Solar Cycle 24 from NASA’s Solar Dynamics Observatory. While they recovered accurate planetary radii in the optical (4500 Å), they found that solar-like unocculted active regions biased their recovered values in 20% of their simulated soft X-ray (94 Å) and UV (131–1700 Å) light curves. At these wavelengths, unocculted active regions generally led to a mean underestimate of 10% of the planetary radius, with up to 25% underestimates occurring during high-activity periods
Turning to stars other than the Sun, Rackham et al. (2018, 2019) estimated the impact of unocculted active regions for FGKM stars with typical activity levels. Using a suite of Monte Carlo simulations, they estimated the spot and covering fractions that correspond to the observed variabilities of FGKM dwarfs by spectral type. They found that spot covering fractions, in particular, increase from 0.1% for F dwarfs to 2–4% for late-K dwarfs to 10% for M dwarfs. If present on the unocculted stellar disk, spots and faculae alter transit depths in the 0.3–5.5 wavelength range by a few to tens of percent, depending on assumptions about spot size and spot-to- areal ratio (Figure 27). Along with the other studies summarized here, these studies of exoplanet host stars with typical activity levels agree that impacts should be most evident at blue-optical and UV wavelengths.
5.4.2 Short-wavelength observations reveal stellar contamination
Many existing exoplanet transmission spectra are assembled piece-wise via observations with various instruments covering different wavelength ranges (e.g., HST/STIS, HST/WFC3, Spitzer/IRAC; Sing et al., 2016). Consequently, the atmospheric interpretations inferred from a given planet’s spectrum can change over time as the spectral wavelength range becomes more complete. Given that the impact of unocculted stellar heterogeneities is most pronounced at short wavelengths, one may anticipate that initial atmospheric reconnaissance using only infrared observations can miss signatures of stellar contamination. Here we focus on one recent case study demonstrating the utility of short-wavelength transmission spectra to reveal unocculted stellar heterogeneities.
The hot Jupiter WASP-79b (Smalley et al., 2012) has been considered a strong candidate for the JWST Early Release Science program (Bean et al., 2018). Sotzen et al. (2020) presented initial observations of WASP-79b obtained with HST/WFC3, Spitzer/IRAC, TESS, and Magellan/LDSS3. They inferred the presence of H2O absorption from the infrared observations and attributed a blue downward slope from the ground-based LDSS3 data to FeH. An independent analysis by Skaf et al. (2020), using only HST/WFC3 data, reached similar conclusions. However, neither of these studies considered unocculted stellar heterogeneities in their retrievals. Recently, Rathcke et al. (2021) presented additional HST/STIS observations of WASP-79b, which extended the transmission spectrum down to 0.3 and confirmed the lower transit depths at short wavelengths suggested by LDSS3 (see Figure 28). Their retrieval analysis identified a strong preference for unocculted faculae (4.7), covering 15% of the stellar disk with a temperature contrast of 500 K, but without the need for FeH. This provides another demonstration that, in the presence of informative data, atmospheric interpretations can be biased if stellar contamination is not considered (see Section 5.2.3).
Since JWST observations will be confined to wavelengths longer than 0.6 , we assessed the information content provided by optical transmission spectra in the context of WASP-79b. Figure 28 shows how the inferred stellar properties alter when only the infrared () observations are considered. We see that the retrieval does not identify unocculted faculae when the optical data is omitted ( is consistent with and is consistent with 0). This suggests that complementary blue-UV observations, at shorter wavelengths than JWST can observe, may aid the identification of unocculted stellar heterogeneities. However, additional work would be beneficial to explore whether the conclusions from this case study apply more broadly.
5.4.3 Combining visible and NIR spectra improves physical inferences
The inclusion of visible wavelength observations provides an additional quantitative benefit: better inferences for both the planetary atmospheric properties and any unocculted stellar heterogeneities. Kirk et al. (2021) recently demonstrated this with a retrieval analysis of the ultrahot Jupiter WASP-103b. Similar to the case of WASP-79b, they found the transit depth of WASP-103b to decrease towards blue wavelengths (Figure 29). They showed that retrievals including only infrared HST and Spitzer observations can infer unocculted faculae (2.4) from a slope in the WFC3 observations, but the addition of precise ground-based observations helps confirm this inference (4.3). At the same time, the detection significance of the planetary atmosphere increased marginally from 1.9 to 2.8. This provides a quantitative example of how short-wavelength observations can increase our confidence in a given interpretation of an exoplanet’s transmission spectrum.
5.4.4 Our finding
From this analysis, we draw the following finding.
Finding 4.3
Summary:
For low-resolution transmission spectra, the impact of unocculted active regions is larger at shorter wavelengths.
More work is needed to quantify the complementary nature of such spectra for JWST observations.
Capability Needed:
understanding of when short-wavelength data are necessary to complement NIR transmission spectra from HST and JWST.
Similarly, an understanding of what biases may be introduced by studying NIR spectra alone—even in the context of joint stellar and planetary retrievals.
Capability Today:
Mitigation in Progress:
6 Future Complementary Observations
Essential uestions:
-
1.
What datasets and/or techniques can help to unveil stellar photospheres?
-
2.
What strategies would optimize transit spectroscopy given the findings of the SAG?
6.1 Introduction
Exoplanet transmission spectroscopy is a key science case for (e.g., Barstow & Irwin, 2016; Greene et al., 2016; Morley et al., 2017) and the focus for the upcoming will have unprecedented precision to probe exoplanet atmospheres. Guided by the findings from Section 2 through Section 5, the goal of this is to identify current capabilities and future complementary observations that could provide datasets and techniques to constrain stellar heterogeneities in aid of exoplanet transmission spectroscopy studies. Here we describe the current landscape for ground- and space-based facilities, and identify gaps in observations and capabilities that are needed to mitigate or correct for stellar contamination. We focus first on observations of the Sun and second on observations of exoplanetary host stars.
6.2 Observations of the Sun
Observations of our nearest star provide the best opportunity to resolve and characterize stellar active regions over time. Here we describe two lines of research that leverage solar observations to inform our understanding of exoplanetary transits: studying the Sun as a resolved star, and studying the Sun as a resolved planetary host. In each context, we discuss the parameters of useful observations and current or future facilities for gathering these data.
6.2.1 Studying the Sun as a resolved star
As described in Section 2, the brightness of the Sun (total and over selected spectral ranges) has been monitored from space since 1978. The Sun’s brightness varies on all timescales accessible to observations, from minutes to decades (e.g., Kopp, 2016). Despite the wealth of solar observations collected to date, resolved observations of the Sun in the visible and IR are still needed to study spectral variations of active regions on minute-to-year timescales, as noted in Finding 1.1. These are the relevant timescales spanning single-transit observations and observational campaigns that stack ten or more transits to build up the necessary signal-to-noise ratio to probe atmospheric features for smaller, cooler exoplanets (e.g., Kreidberg et al., 2014; Benneke et al., 2019a, b).
To understand and model the effect of stellar active regions on these timescales, it is important to combine information obtained from both long-term, full-disk (i.e., disk-integrated) observations and high-spatial-resolution (sub-arcsecond) observations. The former allows an estimate of the temporal evolution of the areal coverage by the different features and an analysis of their properties (both individual and statistical), such as typical sizes, magnetic field, and photometric contrast in specific spectral bands. These quantities are fundamental ingredients of irradiance models and are the main observables for the validation of global dynamo models.
Full-disk observations.
A number of existing facilities provide systematic full-disk observations of the Sun. Ground-based facilities targeted to investigate solar variability are typically furnished with broadband Ca ii K filters (see Petrie et al. 2021 for a recent review on Ca ii K solar observations), and other broadband photospheric filters and/or H-alpha filters. Examples of current facilities include the Precision Solar Photometric Telescopes in Rome (Ermolli et al., 1998) and Hawaii (Rast et al., 1999), and the Solar Observatories of Kanzelhöhe, Tenerife, San Fernando, Kodaikanal and Mitaka. Furthermore, multiple historical Ca ii K archives have been compiled, together providing more than a century of solar full-disk observations (Chatzistergos et al., 2019a, 2020b). Full-disk observations in the UV and EUV, fundamental to understanding and modelling the variability at the shortest wavelengths, are currently provided by AIA and the 16 and 17. These will be complemented in the near future with observations acquired in the UV by the SUIT instrument on the Indian Aditya-L1 mission (Ghosh et al., 2016). Full-disk continuum images, such as those provided SOHO/MDI or SDO/HMI, have been used to study brightness and other properties of sunspots and their changes over the solar cycle (e.g., Mathew et al., 2007; Watson et al., 2014; Kiess et al., 2014). Full-disk magnetograms acquired in both the photosphere (e.g., SOHO/MDI, SDO/HMI, ) and chromosphere (e.g., , ISS) allow studies of the evolution of the magnetic field over the activity cycle. A combination of full-disk magnetograms and broad-band imagery allows understanding of the relation between the magnetic field and the radiative properties of different features (e.g., Yeo et al., 2013; Criscuoli et al., 2017), and are assimilated in some irradiance reconstruction models (e.g., Krivova et al., 2003).
High-spatial-resolution observations.
High-spatial-resolution observations are fundamental to understanding the physical processes that generate, sustain, and dissipate magnetic structures, and that determine their radiative properties. These, in turn, are fundamental for the development and validation of models. Current ground-based facilities Dunn Solar Telescope, Swedish Solar Tower , Goode Solar Telescope , GREGOR Solar Telescope and space-based facilities IRIS allow the Sun to be observed at sub-arcsecond spatial resolution (corresponding to a few hundred kilometers on the Solar surface), at high temporal cadence, and at moderate-to-high spectral resolution. These facilities also typically support spectropolarimetric observations to infer properties of the magnetic fields. The five first-light instruments of (Rimmele et al., 2020) provide solar observations at unprecedented spatial and temporal resolution, at high spectropolarimetric sensitivity, and in a wide spectral range (380–5000 nm) that allows observations of the Sun from the base of the photosphere to the corona. Synergistic observations in the millimeter spectral range with ALMA (Wootten & Thompson, 2009) and in the UV with IRIS will provide essential information to validate and improve modeling, especially of the chromosphere and corona. Finally, the recently launched Solar Orbiter (Müller et al., 2020) will observe for the first time polar magnetic fields at sub-arcsecond spatial resolution, thus providing essential information to improve our understanding of the global dynamo and of the radiative emission of faculae at high latitude.
Although breakthrough discoveries are expected in the understanding of the multi-scale, dynamical processes occurring in the solar atmosphere, it should be noted that, because detailed information about physical and magnetic properties of plasma are derived from the analysis of spectral and spectropolarimetric observations, current and future solar facilities typically acquire data at high spectral resolution in relatively narrow spectral ranges (usually not more than 1 nm). For the purposes of studying the impact of stellar variability on both planetary atmospheres themselves and our observations of them, however, we are often interested in variability over wider—and sometimes poorly studied—spectral ranges (e.g., Ermolli et al., 2013; Matthes et al., 2017). UV variability, in particular, is known to affect planetary atmospheres and their habitability (Linsky, 2017), but unfortunately, this is also the region in which models present the largest discrepancies. Additionally, with the exception of IRIS, which has been providing solar spectra in three UV regions since 2012, spatially and spectrally resolved observations in the UV and shorter wavelength ranges, necessary to validate and improve models are scarce (Criscuoli, 2019). Most of spatially and spectrally resolved observations in the UV/EUV ranges have been so far rocket- or balloon-born, such as the recently launched (2015) Chromospheric Lyman-Alpha Spectro-Polarimeter (CLASP) or the 2019 Chromospheric Layer Spectropolarimeter (CLASP2), which have collected spectropolarimetric data in the Mg ii h & k range (Narukage et al., 2016). The Sunrise UV Spectropolarimeter and Imager (Feller et al., 2020) board the SUNRISE III balloon, , will provide for the first time sub-arcsecond, spectropolarimetric observations of the Sun in the near-UV (300–400 nm) at a spectral resolution of 2 nm. The SUIT instrument on the Indian Aditya-L1 space mission, , will image the Sun in both broad and narrow spectral bands in the UV range from 200 to 400 nm (Ghosh et al., 2016).
6.2.2 Studying the Sun as a resolved planetary host
In addition to using the Sun to learn about other stars, the planets in our Solar System provide opportunities to learn about exoplanets. Several “Earth as an exoplanet” studies have discussed the potential of using observations of the Earth from past planetary science missions (fly-bys) or current Earth science missions (e.g., EPOXI/DISCOVR) to identify key features that are observable for exoplanets (e.g., Cowan et al., 2009; Llama & Shkolnik, 2015, 2016; Berdyugina & Kuhn, 2019). Recently, Mayorga et al. (2021) proposed that a small spacecraft at EarthSun L2 could potentially observe transits of the Earth and Moon across the Sun during periods of high activity. These observations would provide several means towards understanding the biases imparted on transmission spectra from active regions. For example, knowing a priori that a planet transits a star with numerous active regions and has a flat transmission spectrum (because the planet has no atmosphere, a high mean-molecular-weight atmosphere, or high gravity) would provide a testing ground for understanding the effects of occulted and unocculted active regions on the planet’s measured transmission spectrum. Such an experiment would benefit from our knowledge of the properties of active regions from ground-based solar telescopes, thus providing quantitative points of comparison with the ground truth for active regions of various temperatures and sizes.
6.2.3 Our finding
From this analysis, we draw the following finding.
Finding 5.1
Summary:
Our understanding of stellar photospheric heterogeneity and its impact on observations of transiting exoplanets is informed greatly by studies of the Sun.
While many suitable facilities exist to study the Sun as a star, the field would benefit from additional capabilities to study planetary transits of the Sun.
Capability Needed:
Resolved observations of the Sun in the visible and IR are needed to study spectral variations of active regions on minute-to-year timescales.
Observations of planetary bodies transiting the Sun, either resolved or unresolved, are needed to provide the ground-truth for exoplanetary transits.
Capability Today:
Many ground- and space-based facilities exist to study the Sun as a resolved star.
No dedicated facilities exist to study planetary transits of the Sun.
Mitigation in Progress:
DKIST will provide sensitive solar observations with unprecedented spatial and temporal resolution and across a wide spectral range of interest to exoplanetary transit observations (380–5000 nm).
6.3 Observations of exoplanetary host stars
Understanding stellar activity, both the observations and the theory behind what physical processes drive the observations, requires a multiwavelength, multi-facility approach. Here we describe useful avenues to better constrain exoplanet host stars in upcoming years in the context of photometry, UV observations, and advances in interferometry.
6.3.1 Photometric approaches to constrain active-region parameters
Long-baseline photometry.
Precise, time-domain photometric surveys (e.g., CoRoT, Kepler, K2, and TESS) have revolutionized our understanding of stellar activity by enabling the measurements of stellar flares and stellar rotation for a wide range of spectral types. As discussed in Section 4.3.2, long-baseline photometry of exoplanet host stars can be used effectively to monitor for epoch-to-epoch stellar variability (e.g., Knutson et al., 2012; Sing et al., 2015; Mallonn & Strassmeier, 2016; Mallonn et al., 2018; Zellem et al., 2017; Mansfield et al., 2018; Kilpatrick et al., 2020; Rosich et al., 2020). Complementary observations from the ground allow us to place comparatively temporally-limited observations with space-based observatories into a larger baseline to explore whether any observed variations can be attributed to the variability of the host star. These observations can be conducted on a variety of platforms, from automatic robotic telescopes (e.g., Dukes, 1992) to even -class telescopes, which have the potential to observe even a relatively dim 11.3 V-mag host star with a per-minute precision of 0.67% (Zellem et al., 2020). From space, the recently selected Pandora SmallSat Mission (Quintana et al., 2021) will explore the potential of small telescopes (0.45 m) to reliably constrain stellar photospheres and exoplanetary atmospheres by collecting multi-epoch, long-baseline transit observations of active K- and M-type exoplanet hosts with simultaneous visible photometry and NIR spectroscopy.
Multiband photometry.
While photometric monitoring of exoplanet host stars can give insights into their epoch-to-epoch variability, detailed modeling of the stellar activity is generally limited by degeneracies between the spot temperature and spot size. For instance, a small, cool spot can produce the same amount of flux to first order as a large, comparatively warm/bright spot. As discussed in Section 4.3.1, however, multiband photometry can provide the necessary constraints to resolve this degeneracy and better understand the impact of active regions on stellar spectral contamination in exoplanetary transmission spectra. For example, TiO forms in cooler spots but dissociates at hotter temperatures (Mirtorabi et al., 2003; Berdyugina et al., 2003). Therefore, one can perform simultaneous observations of the host star both inside the TiO band and just outside to provide measurements of the starspot temperature and, thus, its size (e.g., Zellem et al., 2010). Such a study was done of the chromospherically active star IM Peg using the relatively small 0.75-m Four College Consortium elescope (Dukes, 1992) as well as spectroscopy with the 2.5-m Nordic Optical Telescope (Berdyugina et al., 1999). This study and others like it show that, while these observations can be time-consuming, they potentially could be shifted to smaller telescopes, alleviating the need for larger telescopes (Zellem et al., 2020). Here too the Pandora SmallSat Mission (Quintana et al., 2021) will provide a relevant space-based counterpart with its simultaneous visible photometry and NIR spectroscopy designed to uniquely identify the properties of heterogeneous photospheres with absolutely calibrated, multi-epoch observations.
Existing datasets and underutilized avenues for photometry.
Existing single- or multi-band photometry may be available for a given exoplanet host, given the abundance of existing time-domain photometric surveys, including those searching for transiting exoplanets, such as Kepler (Borucki et al., 2010), TESS (Ricker et al., 2014), HAT-P (Bakos et al., 2004), WASP (Pollacco et al., 2006), HATS (Bakos et al., 2013), MEarth (Nutzman & Charbonneau, 2008), NGTS (Wheatley et al., 2018), SPECULOOS (Delrez et al., 2018), EDEN (Gibbs et al., 2020), and more. If data is not already available from a targeted or wide-field survey, monitoring the star over multiple rotation periods could be time-consuming. Spun-down M dwarfs, for example, can have periods as long as 140 days (Newton et al., 2018). However, while monitoring exoplanet host stars over multiple rotation periods is challenging due to the oversubscription of professional observatories, there is the opportunity for amateur astronomers to contribute. For example, the American Association of Variable Star Observers has been observing variable stars for 100 years and has over 2 million stars in its Variable Star Index (VSX, Watson et al., 2006).
High-cadence photometry.
Finally, obtaining high-cadence photometry will help in a number of areas. 20-sec cadence mode, which can be used to resolved short-duration activity such as flares, but the number of stars observed at short cadence is typically limited. High-cadence observations which fully resolve the ingress and egress of the transit can independently constrain the planetary radius even when the transit is contaminated by significant spot occultation events (Morris et al., 2018b).
6.3.2 UV observations to inform models of host-star atmospheres
With the wealth and quality of existing solar observations, highly sophisticated semi-empirical models of the Sun have been developed, including complex models of spots, flares, and other magnetic phenomena (See Section 2). Extensive modeling efforts have furthered our understanding of the solar interior (e.g., Vinyoles et al., 2017), the detailed structure in the upper atmosphere (Fontenla et al., 2006), and the solar activity cycle and associated energetic events . current state-of-the-art for stellar atmosphere models is not at the same level as solar models. Stellar modeling efforts would greatly benefit from a future EUV/FUV/NUV dedicated mission with time-dependent measurements to improve our understanding of active-region coverage and temperature, and flare frequency, size, and color on these low-mass, planet-host stars. With this knowledge, composite semi-empirical models of stellar atmospheres could be developed, complete with accurate modeling of photospheric and chromospheric heterogeneities that would, amongst other things, advance the general understanding of stellar atmospheres and improve our ability to disentangle the stellar and planetary contributions from UV transit spectra.
6.3.3 Constraining host-star surface inhomogeneities through interferometric imaging
Global surface temperature maps.
Stellar surfaces have been indirectly imaged for decades using Doppler imaging (e.g., Berdyugina, 2005; Strassmeier, 2009; Korhonen et al., 2021) and light-curve imaging (e.g., Lanza et al., 1998; Berdyugina et al., 2002; Roettenbacher et al., 2013) in order to detect surface inhomogeneities, such as starspots and faculae (see also Section 2). In these methods, either high-resolution spectra or photometric observations are used to obtain maps of the stellar surface with inversion methods. Light-curve inversion imaging reconstructs the stellar surface based upon the observed brightness fluctuations. Doppler imaging utilizes the evolution of distortions of absorption lines caused by surface features rotating in and out of view to reconstruct the features of the stellar surface. Both methods suffer from degeneracies, especially for the latitudinal information of the spots. The determination of starspot latitudes is constrained in light-curve inversion with limb-darkening laws and estimated coefficients, while in Doppler imaging with the location of the spot feature within absorption line profiles and the speed at which it crosses the profile as the star rotates. While the light-curve method cannot provide starspot latitudes, the Doppler imaging can locate spot latitudes and longitudes within the stellar hemisphere that is best visible to the observer with respect to the equator, as was demonstrated by modeling various spots (e.g., Vogt & Penrod, 1983; Piskunov et al., 1990; Berdyugina, 1998).
In recent years, advances in long-baseline optical/near-infrared interferometry have enabled the direct-imaging of starspots on stellar surfaces (Roettenbacher et al., 2016, 2017; Parks et al., 2021; Martinez et al., 2021). This is the only method that can obtain reliable, unambiguous information of the spot locations in latitude and longitude within both stellar hemispheres relative to the equator. However, the targets currently accessible with present interferometric resources are limited, as this technique requires very bright targets with spots that appear large enough on the sky. Additionally, obtaining a complete image of the stellar surface requires repeated observations with phase coverage across a rotation. This can require large amounts of dedicated observing time. The relative rate of evolution of the surface structure compared to the stellar rotation must also be considered.
Currently, the highest spatial resolution can be reached by instrument (Anugu et al., 2020) at the CHARA Array (ten Brummelaar et al., 2005), which can provide an angular resolution of about 0.4 mas. MIRC-X is also the only instrument that can combine light from all the six 1-meter telescopes of the CHARA Array, making it the instrument that is best suited for interferometric imaging of stellar surfaces. Another facility that can be used for interferometric imaging is European Southern Observatory’s Very Large Telescope Interferometer (VLTI). The best angular resolution of the VLTI can be reached using the Precision Integrated Optics Near Infrared ExpeRiment instrument (PIONIER; Le Bouquin et al., 2011) that gives angular resolution of about 1.3 mas. VLTI can combine four telescopes simultaneously and has changeable array configurations with the 1.8-meter auxiliary telescopes. VLTI can also combine the light from the four 8.2-meter Unit Telescopes telescopes, which gives the current faintest limiting magnitudes for infra-red interferometry (GRAVITY instrument: for on-axis observations and when using a close-by bright fringe tracker star; Gravity Collaboration et al., 2017).
The number of targets that can be accurately mapped using interferometric imaging is still limited to a handful of bright, nearby stars that have angular diameters of about 2.0 mas or larger. The technique, however, importantly opens a new parameter space that is not accessible using Doppler or light-curve inversion imaging: cool, aged, main-sequence stars. Due to their slow rotation, Doppler imaging cannot be used to image these stars. Cool, nearby, main-sequence stars include some exoplanet hosts, like Eridani.
New exciting discoveries are made with each new image obtained of stellar surfaces. Future advances in interferometric imaging can be made by: increasing the number of telescope that are combined to improve the image fidelity, moving towards shorter wavelengths to obtain higher angular resolution, and increasing the length of the longest baselines to obtain higher angular resolution. Many of these aspects will be addressed, for example, by the Visible Imaging System for Interferometric Observations (VISION; Garcia et al., 2016) instrument at the upgraded Navy Precision Optical Interferometer (NPOI; van Belle et al., 2020a) and the Stellar Parameters and Images with a Cophased Array (SPICA; Pannetier et al., 2020) at (ten Brummelaar et al., 2005).
Because the light detected with long-baseline optical interferometers must be combined at the telescopes, there are physical limitations to the size of ground-based interferometers. While efforts are being made to investigate kilometer baselines (e.g., Monnier et al., 2018), space-based interferometers (e.g., Monnier et al., 2018; van Belle et al., 2020b) could alleviate some of the constraints on ground-based optical interferometers, allowing for increased resolution and increased targets.
Empirical determination of fundamental stellar parameters.
Precise stellar parameters, including stellar radius, surface temperature, and limb darkening, are crucial for correctly interpreting exoplanet observations. . While most stars cannot be resolved with current single-dish, ground- and space-based telescopes, long-baseline optical and near-infrared interferometers consisting of individual telescopes connected as an array can provide accurate information on these parameters. When resolved stars are observed with interferometry the measured squared visibility changes with the baseline (distance between two telescopes) and wavelength. When limb-darkened disk models are fit to the observed squared visibilities, the apparent stellar diameter and limb-darkening profile can be determined. Additionally, the effective temperature can be measured when the stellar diameter is combined with observations of the bolometric flux.
Stellar diameters and limb-darkening laws have been determined interferometrically for many stars, both giants and mainsequence stars . Diameter measurements have also been carried out for exoplanet host stars (see, e.g., Baines et al., 2008, 2009; Bazot et al., 2011; Crida et al., 2018; White et al., 2018). These observations have shown the necessity of having sufficiently long baselines for accurately resolving targets with small angular diameters. Additionally, one has to take great care when selecting the calibration stars. Calibration stars are ideally nearby on the sky, of similar spectral type, single, and unresolved by the interferometer. Instrumentation developments that are ideally suited for studying smaller exoplanet host stars include VISION at NPOI (Garcia et al., 2016; van Belle et al., 2020a) and SPICA at the CHARA Array (ten Brummelaar et al., 2005; Pannetier et al., 2020). With instruments working in the visible wavelength range and with the long baselines of 432 m and 330 m, respectively, NPOI and the CHARA Array are ideal facilities for studying fundamental stellar parameters of the exoplanet host stars in the future.
Complementing these capabilities is the method of “pseudo-interferometry" (Stassun et al., 2017, 2018), in which the stellar angular radius is determined through an inversion of the Stefan-Boltzmann relation, . The physical radius then follows directly via the distance as determined, e.g., with a precise Gaia parallax. This approach does require an independent determination of , preferably via a high quality spectroscopic analysis. As demonstrated by Stassun et al. (2017), the availability of broadband apparent magnitudes spanning from the UV to the mid-IR allows to be determined with a typical precision of a few percent, and in the best cases determined to a precision of 1–2%, such that angular radii for typical planet-host stars can be measured to 2–3 , rivaling that of interferometric imaging for the brightest stars (though without the benefit of resolving surface inhomogeneities, of course). Moreover, as ultra-precise parallaxes are now routinely available with Gaia, physical radii for typical stars via pseudo-interferometry can be determined to better than a few percent (Stassun et al., 2017). Finally, such pseudo-interferometric stellar radii can be further leveraged to measure the masses of single stars empirically as well, if a precise surface gravity is available such as through the technique of granulation “flicker" from a light curve (Bastien et al., 2013, 2016). Masses of individual via this pseudo-interferometric flicker gravity method to better than 10% in many cases and as good as a few percent in the best cases (Stassun et al., 2018).
6.3.4 Our finding
From this analysis, we draw the following finding.
Finding 5.2
Summary:
Many existing facilities can be leveraged to study exoplanet host stars photometrically, though there is a need to scale observations to study a large number of exoplanet host stars with long-term, multi-band photometry.
UV observations are also essential to inform models of host-star atmospheres, and time-dependent measurements provide valuable information on active-region coverage and temperature as well as flare frequency and magnitude.
At the same time, advances in interferometric technique enable constraints on photospheric properties of nearby dwarfs, including some exoplanet hosts;
of specific interest is the direct mapping of temperature inhomogeneities on stellar surfaces.
Capability Needed:
Long-baseline, multi-band photometry of active exoplanet host stars is needed to uniquely constrain active region temperatures and sizes.
Stellar modeling efforts would greatly benefit from a future EUV/FUV/NUV dedicated mission with time-dependent measurements to improve our understanding of active-region coverage and temperature, and flare frequency, size, and color on these low-mass, planet-host stars.
Much longer baseline interferometric imaging capabilities on the ground and/or in space would allow mapping of stellar surface inhomogeneities for a much larger sample of stars;
currently this can only be done for a handful of bright, nearby stars with angular diameters larger than 2 mas.
Capability Today:
Photometric studies of exoplanet host stars benefit from many capable facilities, including dedicated transit-search networks and longstanding contributions from amateur astronomers .
Mitigation in Progress:
The extended TESS mission continues to provide long-baseline photometry in a broad red-optical bandpass for targets over nearly the whole sky.
The recently selected Pandora SmallSat Mission will provide both long-baseline monitoring and transit observations simultaneously in a visible photometric bandpass and a NIR spectroscopic channel .
7 Conclusions

To summarize these findings further, Figure 30 presents a set of summary science questions and needs that are common to several findings at a time. These fall into three Science Themes encompassing (1) how the Sun is used as our best laboratory to calibrate our understanding of stellar heterogeneities (“The Sun as the Stellar Benchmark"), (2) how stars other than the Sun extend our knowledge of heterogeneities (“Surface Heterogeneities of Other Stars") and (3) how to incorporate information gathered for the Sun and other stars into transit studies (“Mapping Stellar Knowledge to Transit Studies").
The following subsections summarize in turn the scope of the five subgroups and their findings. For brevity, only the summary statement of each finding is reproduced here. The full findings , including descriptions of the capability needed, capability today, and mitigation in progress, are available in their respective .
7.1 Stellar Photospheric & Chromospheric Heterogeneity
The Stellar Photospheric & Chromospheric Heterogeneity subgroup was tasked with summarizing our knowledge of the heterogeneity of stellar photospheres and chromospheres and ongoing work to understand relevant properties for the purpose of transmission spectroscopy. The members considered observational and modeling efforts to understand the heterogeneity of the Sun at wavelengths relevant to transit studies and comparable efforts for other stars, including exoplanet hosts. Their analysis produced three findings.
Finding 1.1
The Sun provides the benchmark for stellar studies. Studying the spatial, spectral, and temporal variations of stellar surface structures is necessary for understanding the impact of analogous structures on transmission spectroscopy of exoplanets.
Finding 1.2
More modeling work is needed to understand how the fundamental parameters of stars other than the Sun govern their magnetic fields and the associated properties of their surface inhomogeneities. In accordance with observations, simulations show that many lower-activity stars, such as exoplanet hosts that for transmission spectroscopy , are -dominated , little is known on how facular contrasts and coverages depend on stellar activity levels and fundamental parameters, such as metallicity and surface gravity. Both observing and modeling the fine structure of spots on stellar surfaces remain a challenge.
Finding 1.3
Simultaneous multi-wavelength (multi-instrument) stellar observations are needed to provide feedback to modeling efforts and improve our understanding of the photospheres and chromospheres of other stars, including high-priority exoplanet host stars. This is particularly critical for K, M, and L dwarfs, for which models are relatively poorly constrained.
7.2 Occulted Active Regions
The Occulted Active Regions subgroup was tasked with evaluating what we can learn from planetary occultations of stellar active regions during transits. The members considered the state of the art for observations and models of active-region occultations, outstanding theoretical challenges for these studies, and the availability of well-maintained tools for conducting these analyses. Their analysis produced three findings.
Finding 2.1
Precise transit observations increasingly reveal occultations of stellar active regions. Rather than flagging and removing active region occultations, which results in decreased observing efficiency and possibly biased transit depth measurements, future observations should move towards joint inference of the active region and planetary properties.
Finding 2.2
Theoretical advances are needed to understand the limits of what we can infer about active-region properties from transit light curves and how best to incorporate prior knowledge from magnetohydrodynamic models into transit studies.
Finding 2.3
publicly available tools for forward-modeling active-region occultations. Their maintenance and further development is necessary to ensure their utility for analyses of precise transit observations.
7.3 Unocculted Active Regions
The Unocculted Active Regions subgroup was tasked with examining our knowledge of host-star active regions that are not occulted by transiting exoplanets. The members considered what information can be obtained about unocculted active regions from high-cadence transit photometry, the utility of other datasets—current or planned—for inferring the presence of active regions and their properties, and the effects of stellar granulation on transmission spectra. Their analysis produced three findings.
Finding 3.1
High-cadence light curves provide the potential to understand unocculted active regions, but the information is not comprehensive enough to make unambiguous measurements at present. Theoretical advances are needed to make full use of these light curves.
Finding 3.2
Simultaneous multi-band photometry and contemporaneous spectroscopy provide critical information towards understanding the potential effects of active regions on transmission spectroscopy observations. While other data sets can provide information on filling factors, theoretical work is needed to maximise the utility of these data for transmission spectroscopy.
Finding 3.3
Stellar “granulation flicker" constitutes a fundamental “noise floor" on stellar light curves that increases with decreasing stellar surface gravity and at shorter wavelengths. The impact of this stellar granulation can enter as a source of noise and/or contamination for transmission spectroscopy in two ways. The first is through extra light curve scatter, impact is minimal in most cases (at most 0.05% error on the transit depth in the visible and even less at longer wavelengths). The second is through a contamination source similar to that of spots and faculae, albeit at a much lower amplitude ( of the transit depth at about 0.7 m). This second source is significant at short wavelengths for smaller exoplanets around Sun-like stars, but decreases strongly as a function of wavelength.
7.4 Stellar & Planetary Retrievals
The Stellar & Planetary Retrievals subgroup was tasked with studying how we can best use inference frameworks to constrain the properties of stellar photospheres and exoplanetary atmospheres jointly from transmission spectra and other relevant inputs. The members considered the utility of joint stellar and planetary retrievals generally, the known limitations of the approach, and the complementarity of short-wavelength observations to HST and JWST NIR observations for inferring stellar photospheric properties. Their analysis produced three findings.
Finding 4.1
Retrievals of transmission spectra that include the effects of unocculted active regions can guard against biases. More work is needed to understand when these retrievals are necessary and what are the limitations and best practices of this approach.
Finding 4.2
Retrieval approaches rely on stellar models, and thus their accuracy is limited by model fidelity . Further efforts to develop model spectra for spots and faculae and incorporate them into exoplanetary atmospheric retrievals are needed.
Finding 4.3
For low-resolution transmission spectra, the impact of unocculted active regions is larger at shorter wavelengths. More work is needed to quantify the complementary nature of such spectra for JWST observations.
7.5 Future Complementary Observations
The Future Complementary Observations subgroup was tasked with assessing the current landscape for ground- and space-based facilities that can provide useful complements for HST and JWST studies of transiting exoplanets. The subgroup was also tasked with identifying gaps in capabilities that are needed to mitigate or correct for stellar contamination. The members considered observations of the Sun that are informative in this context as well as observations of exoplanetary host stars themselves. Their analysis produced two findings.
Finding 5.1
Our understanding of stellar photospheric heterogeneity and its impact on observations of transiting exoplanets is informed greatly by studies of the Sun. While many suitable facilities exist to study the Sun as a star, the field would benefit from additional capabilities to study planetary transits of the Sun.
Finding 5.2
Many existing facilities can be leveraged to study exoplanet host stars photometrically, though there is a need to scale observations to study a large number of exoplanet host stars with long-term, multi-band photometry. UV observations are also essential to inform models of host-star atmospheres, and time-dependent measurements provide valuable information on active-region coverage and temperature as well as flare frequency and magnitude. At the same time, advances in interferometric technique enable constraints on photospheric properties of nearby dwarfs, including some exoplanet hosts; of specific interest is the direct mapping of temperature inhomogeneities on stellar surfaces.
List of affiliations
1Department of Earth, Atmospheric and Planetary Sciences, Massachusetts Institute of Technology, 77 Massachusetts Avenue, Cambridge, MA 02139, USA
2Kavli Institute for Astrophysics and Space Research, Massachusetts Institute of Technology, Cambridge, MA 02139, USA
3Space Telescope Science Institute, 3700 San Martin Drive, Baltimore, MD 21218, USA
4Leibniz-Institut für Sonnenphysik (KIS), Schöneckstrasse 6, D-79104 Freiburg, Germany
5Istituto Ricerche Solari Aldo e Cele Daccò (IRSOL), Faculty of Informatics, Università della Svizzera italiana, Locarno, Switzerland
6European Southern Observatory (ESO), Alonso de Córdova 3107, Vitacura, Santiago, Chile
7Department of Astronomy, University of Michigan, 1085 S. University Ave, Ann Arbor, MI 48109, USA
8School of Physics, University of New South Wales, Sydney, NSW 2052, Australia
9Center for Space and Habitability, University of Bern, Gesellschaftsstrasse 6, 3012 Bern, Switzerland
10Instituto de Astrofísica de Canarias, 38200 La Laguna, Tenerife, Spain
11Max-Planck-Institut für Sonnensystemforschung, Justus-von-Liebig-Weg 3, 37077 Göttingen, Germany
12Department of Physics, Imperial College London, Prince Consort Road, London SW7 2AZ, UK
13NASA Goddard Space Flight Center, 8800 Greenbelt Road, Greenbelt, MD 20771, USA
14Jet Propulsion Laboratory, California Institute of Technology, 4800 Oak Grove Drive, Pasadena, CA 91109, USA
15Steward Observatory, The University of Arizona, 933 N. Cherry Avenue, Tucson, AZ 85721, USA
16Lunar and Planetary Laboratory, The University of Arizona, 1629 E. University Blvd., Tucson, AZ 85721, USA
17University of Maryland, Baltimore County, 1000 Hilltop Circle, Baltimore, MD 21250, USA
18School of Physical Sciences, The Open University, Walton Hall, Milton Keynes, MK7 6AA, UK
19INAF, Osservatorio Astrofisico di Catania, Via S. Sofia 78, 95123 Catania, Italy
20Space Research Institute, Austrian Academy of Sciences, Schmiedlstrasse 6, A-8042 Graz, Austria
21School of Physics and Astronomy, University of Leicester, University Road, Leicester LE1 7RH, UK
22Department of Physics, University of Warwick, Coventry, CV4 7AL, UK
23National Solar Observatory, 3665 Discovery Drive, Boulder, CO 80303, USA
24Observatoire de Genève, Université de Genève, Chemin des Maillettes 51, 1290 Versoix, Switzerland
25School of Earth and Space Exploration, Arizona State University, 525 E. University Dr., Tempe AZ 85281
26Laboratory for Atmospheric and Space Physics, University of Colorado Boulder, Boulder, CO, USA
27Leibniz-Institut für Astrophysik Potsdam (AIP), An der Sternwarte 16, 14482 Potsdam, Germany
28Center for Astrophysics | Harvard & Smithsonian, 60 Garden St, Cambridge, MA 02138, USA
29Universitäts-Sternwarte, Ludwig-Maximilians-Universität München, Scheinerstrasse 1, 81679 München, Germany
30Exzellenzcluster Origins, Boltzmannstraße 2, 85748 Garching, Germany
31Landessternwarte, Zentrum für Astronomie der Universität Heidelberg, Königstuhl 12, 69117 Heidelberg, Germany
32Department of Physics and Astronomy, Dartmouth College, Hanover, NH 03755, USA
33National Solar Observatory, Boulder, CO 80303, USA
34Department of Astrophysics and Planetary Sciences, University of Colorado, Boulder, CO 80303, USA
35Yale Center for Astronomy and Astrophysics, Yale University, 46 Hillhouse Avenue, New Haven, CT 06511, USA
36Department of Astronomy, Yale University, 52 Hillhouse Avenue, New Haven, CT 06511, USA
37Department of Physics and Astronomy, Vanderbilt University, Nashville, TN 37235, USA
38Johns Hopkins University Applied Physics Laboratory, 11100 Johns Hopkins Rd, Laurel, MD 20723, USA
39Instituto de Investigación en Astronomia y Ciencias Planetarias, Universidad de Atacama, Copiapó, Atacama, Chile
40Centro de Rádio Astronomia e Astrofisica Mackenzie, Mackenzie Presbyterian University, Rua da Consolacao, 896, Sao Paulo, Brazil
41Rosseland Centre for Solar Physics, University of Oslo, Postboks 1029 Blindern, 0315 Oslo, Norway
42Institute of Theoretical Astrophysics, University of Oslo, Postboks 1029 Blindern, 0315 Oslo, Norway
43Carnegie Earth & Planets Laboratory, 5241 Broad Branch Road NW, Washington, DC 20015, USA
44Astronomy Department, University of Washington, Box 951580, Seattle, WA 98195, USA
45Department of Astronomy, University of Maryland, College Park, MD 20742, USA
46Department of Astronomy, Boston University, Boston, MA 02215
47Department of Astrophysical Sciences, Princeton University, Princeton, NJ, USA
48Astrobiology Research Unit, Université de Liège, 19C Allée du 6 Aout, 4000 Liège, Belgium
49Department of Astronomy and Astrophysics, University of Chicago, 5640 S. Ellis Avenue, Chicago, IL 60637, USA
50SETI Institute, 189 Bernardo Avenue, Suite 200, Mountain View, CA 94043, USA
51Gemini Observatory/NSF’s NOIRLab, 670 N. A’ohoku Place, Hilo, HI 96720, USA
52NASA Goddard Space Flight Center / University of Maryland, Baltimore County
53Institut de Ciències de l’Espai (ICE, CSIC), Campus UAB, C/Can Magrans s/n, 08193 Bellaterra, Spain
54Institut d’Estudis Espacials de Catalunya (IEEC), 08034 Barcelona, Spain
Acknowledgements
J.K.B. acknowledges support from an STFC Ernest Rutherford Fellowship. S.V.B. was supported by the European Research Council Advanced Grant HotMol ERC-2011-AdG291659. G.B. acknowledges support from CHEOPS ASI-INAF agreement n. 2019-29-HH.0. H.M.C. acknowledges support from a UKRI Future Leaders Fellowship fellowship MR/S035214/1. C.D. acknowledges the support from NASA XRP grant 80NSSC21K0608. E.D. acknowledges the Paris Region fellowship programme which is supported by the Ile-de-France Region and has received funding under the Horizon 2020 innovation framework programme and the Marie Sklodowska-Curie grant agreement no. 945298. A.I. and M.L. acknowledge support from NSF Award Number: 2009592. G.K. was supported by NASA’s TSIS program under contract NNG09HP02C. B.V.R. and R.M.R. thank the Heising-Simons Foundation for support. A.I.S. is supported by the by the European Research Council (ERC) under the European Union’s Horizon 2020 research and innovation programme (grant agreement No. 715947). K.G.S. acknowledges generous support from NASA XRP grant 80NSSC18K0445. Y.C.U. acknowledges support from STFC through grant ST/S000372/1. S.W. is supported by the European Research Council (ERC) under the European Union’s Horizon 2020 research and innovation programme (grant agreement No. 682462), and by the Research Council of Norway through its Centres of Excellence scheme (project number 262622) and FRIPRO scheme (project number 286853). Part of the research was carried out at the Jet Propulsion Laboratory, California Institute of Technology, under a contract with the National Aeronautics and Space Administration (80NM0018D0004). NASA’s Nexus for Exoplanet System Science (NExSS) research coordination network sponsored by NASA’s Science Mission Directorate. This research was supported by the Excellence Cluster ORIGINS which is funded by the Deutsche Forschungsgemeinschaft (DFG, German Research Foundation) under Germany’s Excellence Strategy - EXC-2094 - 390783311. The National Solar Observatory is operated by the Association of Universities for Research in Astronomy, Inc. (AURA), under cooperative agreement with the National Science Foundation.
Data Availability
Most datasets presented in this report have been summarized from the scientific literature and can be found at the cited references. Data relating to any new analyses presented here are available upon reasonable request.
References
- Adjabshirzadeh & Koutchmy (1983) Adjabshirzadeh, A. & Koutchmy, S., 1983. Photometric analysis of sunspot umbral dots. III Spectrophotometry and preliminary model of a 2-component umbra, A&A, 122(1-2), 1–8.
- Aerts (2021) Aerts, C., 2021. Probing the interior physics of stars through asteroseismology, Reviews of Modern Physics, 93(1), 015001.
- Afram & Berdyugina (2015) Afram, N. & Berdyugina, S. V., 2015. Molecules as magnetic probes of starspots, A&A, 576, A34.
- Afram & Berdyugina (2019) Afram, N. & Berdyugina, S. V., 2019. Complexity of magnetic fields on red dwarfs, A&A, 629, A83.
- Agol et al. (2005) Agol, E., Steffen, J., Sari, R., & Clarkson, W., 2005. On detecting terrestrial planets with timing of giant planet transits, MNRAS, 359, 567–579.
- Agol et al. (2010) Agol, E., Cowan, N. B., Knutson, H. A., Deming, D., Steffen, J. H., Henry, G. W., & Charbonneau, D., 2010. The Climate of HD 189733b from Fourteen Transits and Eclipses Measured by Spitzer, ApJ, 721(2), 1861–1877.
- Ahern & Chapman (2000) Ahern, S. & Chapman, G. A., 2000. An analysis of full-disk observations of facular contrast in the blue and red, Sol. Phys., 191(1), 71–84.
- Aigrain et al. (2012) Aigrain, S., Pont, F., & Zucker, S., 2012. A simple method to estimate radial velocity variations due to stellar activity using photometry, MNRAS, 419(4), 3147–3158.
- Alexoudi et al. (2020) Alexoudi, X., Mallonn, M., Keles, E., Poppenhäger, K., von Essen, C., & Strassmeier, K. G., 2020. Role of the impact parameter in exoplanet transmission spectroscopy, A&A, 640, A134.
- Allard et al. (2003) Allard, F., Guillot, T., Ludwig, H.-G., Hauschildt, P. H., Schweitzer, A., Alexander, D. R., & Ferguson, J. W., 2003. Model Atmospheres and Spectra: The Role of Dust, in Brown Dwarfs, vol. 211, p. 325.
- Andersen & Korhonen (2015) Andersen, J. M. & Korhonen, H., 2015. Stellar activity as noise in exoplanet detection - II. Application to M dwarfs, MNRAS, 448(4), 3053–3069.
- Andretta et al. (2017) Andretta, V., Giampapa, M. S., Covino, E., Reiners, A., & Beeck, B., 2017. Estimates of Active Region Area Coverage through Simultaneous Measurements of the He I 5876 and 10830 Lines, ApJ, 839(2), 97.
- Anugu et al. (2020) Anugu, N., Le Bouquin, J.-B., Monnier, J. D., Kraus, S., Schaefer, G., Setterholm, B. R., Davies, C. L., Gardner, T., Labdon, A., Lanthermann, C., Ennis, J., ten Brummelaar, T., Sturmann, J., Anderson, M., Farrington, C., Vargas, N., & Majoinen, O., 2020. CHARA/MIRC-X: a high-sensitive six telescope interferometric imager concept, commissioning and early science, in Society of Photo-Optical Instrumentation Engineers (SPIE) Conference Series, vol. 11446 of Society of Photo-Optical Instrumentation Engineers (SPIE) Conference Series, p. 114460N.
- Apai et al. (2013) Apai, D., Radigan, J., Buenzli, E., Burrows, A., Reid, I. N., & Jayawardhana, R., 2013. HST Spectral Mapping of L/T Transition Brown Dwarfs Reveals Cloud Thickness Variations, ApJ, 768(2), 121.
- Apai et al. (2017) Apai, D., Karalidi, T., Marley, M. S., Yang, H., Flateau, D., Metchev, S., Cowan, N. B., Buenzli, E., Burgasser, A. J., Radigan, J., Artigau, E., & Lowrance, P., 2017. Zones, spots, and planetary-scale waves beating in brown dwarf atmospheres, Science, 357(6352), 683–687.
- Apai et al. (2018) Apai, D., Rackham, B. V., Giampapa, M. S., Angerhausen, D., Teske, J., Barstow, J., Carone, L., Cegla, H., Domagal-Goldman, S. D., Espinoza, N., Giles, H., Gully-Santiago, M., Haywood, R., Hu, R., Jordan, A., Kreidberg, L., Line, M., Llama, J., López-Morales, M., Marley, M. S., & de Wit, J., 2018. Understanding Stellar Contamination in Exoplanet Transmission Spectra as an Essential Step in Small Planet Characterization, arXiv e-prints.
- Apai et al. (2021) Apai, D., Nardiello, D., & Bedin, L. R., 2021. TESS Observations of the Luhman 16 AB Brown Dwarf System: Rotational Periods, Lightcurve Evolution, and Zonal Circulation, ApJ, 906(1), 64.
- Araújo & Valio (2021) Araújo, A. & Valio, A., 2021. Kepler-411 Differential Rotation from Three Transiting Planets, ApJ, 907(1), L5.
- Artigau et al. (2009) Artigau, É., Bouchard, S., Doyon, R., & Lafrenière, D., 2009. Photometric Variability of the T2.5 Brown Dwarf SIMP J013656.5+093347: Evidence for Evolving Weather Patterns, ApJ, 701(2), 1534–1539.
- Aschwanden & Freeland (2012) Aschwanden, M. J. & Freeland, S. L., 2012. Automated Solar Flare Statistics in Soft X-Rays over 37 Years of GOES Observations: The Invariance of Self-organized Criticality during Three Solar Cycles, ApJ, 754, 112.
- Asplund et al. (2005) Asplund, M., Grevesse, N., & Sauval, A. J., 2005. The Solar Chemical Composition, in Cosmic Abundances as Records of Stellar Evolution and Nucleosynthesis, vol. 336 of Astronomical Society of the Pacific Conference Series, p. 25.
- Asplund et al. (2009) Asplund, M., Grevesse, N., Sauval, A. J., & Scott, P., 2009. The Chemical Composition of the Sun, ARA&A, 47(1), 481–522.
- Atroshchenko et al. (1989a) Atroshchenko, I. N., Gadun, A. S., & Kostyk, R. I., 1989a. The Simulation of the Convective Motions in the Procyon Envelope - Part One - Ideology and Analysis of the Three-Dimensional Inhomogeneous Models, Astrofizika, 31, 281.
- Atroshchenko et al. (1989b) Atroshchenko, I. N., Gadun, A. S., & Kostyk, R. I., 1989b. Three-Dimensional Simulation of Convective Motions in the Procyon Envelope, in Solar and Stellar Granulation, vol. 263 of NATO ASIC Proc., p. 521.
- Aulanier et al. (2013) Aulanier, G., Démoulin, P., Schrijver, C. J., Janvier, M., Pariat, E., & Schmieder, B., 2013. The standard flare model in three dimensions. II. Upper limit on solar flare energy, A&A, 549, A66.
- Auvergne et al. (2009) Auvergne, M., Bodin, P., Boisnard, L., Buey, J. T., Chaintreuil, S., Epstein, G., Jouret, M., Lam-Trong, T., Levacher, P., Magnan, A., Perez, R., Plasson, P., Plesseria, J., Peter, G., Steller, M., Tiphène, D., Baglin, A., Agogué, P., Appourchaux, T., Barbet, D., Beaufort, T., Bellenger, R., Berlin, R., Bernardi, P., Blouin, D., Boumier, P., Bonneau, F., Briet, R., Butler, B., Cautain, R., Chiavassa, F., Costes, V., Cuvilho, J., Cunha-Parro, V., de Oliveira Fialho, F., Decaudin, M., Defise, J. M., Djalal, S., Docclo, A., Drummond, R., Dupuis, O., Exil, G., Fauré, C., Gaboriaud, A., Gamet, P., Gavalda, P., Grolleau, E., Gueguen, L., Guivarc’h, V., Guterman, P., Hasiba, J., Huntzinger, G., Hustaix, H., Imbert, C., Jeanville, G., Johlander, B., Jorda, L., Journoud, P., Karioty, F., Kerjean, L., Lafond, L., Lapeyrere, V., Landiech, P., Larqué, T., Laudet, P., Le Merrer, J., Leporati, L., Leruyet, B., Levieuge, B., Llebaria, A., Martin, L., Mazy, E., Mesnager, J. M., Michel, J. P., Moalic, J. P., Monjoin, W., Naudet, D., Neukirchner, S., Nguyen-Kim, K., Ollivier, M., Orcesi, J. L., Ottacher, H., Oulali, A., Parisot, J., Perruchot, S., Piacentino, A., Pinheiro da Silva, L., Platzer, J., Pontet, B., Pradines, A., Quentin, C., Rohbeck, U., Rolland, G., Rollenhagen, F., Romagnan, R., Russ, N., Samadi, R., Schmidt, R., Schwartz, N., Sebbag, I., Smit, H., Sunter, W., Tello, M., Toulouse, P., Ulmer, B., Vandermarcq, O., Vergnault, E., Wallner, R., Waultier, G., & Zanatta, P., 2009. The CoRoT satellite in flight: description and performance, A&A, 506(1), 411–424.
- Ayres (2021) Ayres, T. R., 2021. In the Trenches of the Solar-Stellar Connection. II. Extreme Ultraviolet Flux-Flux Correlations across Solar Cycle 24, ApJ, 908(2), 205.
- Babcock & Babcock (1955) Babcock, H. W. & Babcock, H. D., 1955. The Sun’s Magnetic Field, 1952-1954., ApJ, 121, 349.
- Baines et al. (2008) Baines, E. K., McAlister, H. A., ten Brummelaar, T. A., Turner, N. H., Sturmann, J., Sturmann, L., Goldfinger, P. J., & Ridgway, S. T., 2008. CHARA Array Measurements of the Angular Diameters of Exoplanet Host Stars, ApJ, 680(1), 728–733.
- Baines et al. (2009) Baines, E. K., McAlister, H. A., ten Brummelaar, T. A., Sturmann, J., Sturmann, L., Turner, N. H., & Ridgway, S. T., 2009. Eleven Exoplanet Host Star Angular Diameters from the Chara Array, ApJ, 701(1), 154–162.
- Bakos et al. (2004) Bakos, G., Noyes, R. W., Kovács, G., Stanek, K. Z., Sasselov, D. D., & Domsa, I., 2004. Wide-Field Millimagnitude Photometry with the HAT: A Tool for Extrasolar Planet Detection, PASP, 116(817), 266–277.
- Bakos et al. (2013) Bakos, G. Á., Csubry, Z., Penev, K., Bayliss, D., Jordán, A., Afonso, C., Hartman, J. D., Henning, T., Kovács, G., Noyes, R. W., Béky, B., Suc, V., Csák, B., Rabus, M., Lázár, J., Papp, I., Sári, P., Conroy, P., Zhou, G., Sackett, P. D., Schmidt, B., Mancini, L., Sasselov, D. D., & Ueltzhoeffer, K., 2013. HATSouth: A Global Network of Fully Automated Identical Wide-Field Telescopes, PASP, 125(924), 154.
- Baliunas et al. (1995) Baliunas, S. L., Donahue, R. A., Soon, W. H., Horne, J. H., Frazer, J., Woodard-Eklund, L., Bradford, M., Rao, L. M., Wilson, O. C., Zhang, Q., Bennett, W., Briggs, J., Carroll, S. M., Duncan, D. K., Figueroa, D., Lanning, H. H., Misch, T., Mueller, J., Noyes, R. W., Poppe, D., Porter, A. C., Robinson, C. R., Russell, J., Shelton, J. C., Soyumer, T., Vaughan, A. H., & Whitney, J. H., 1995. Chromospheric variations in main-sequence stars, ApJ, 438, 269–287.
- Ballerini et al. (2012) Ballerini, P., Micela, G., Lanza, A. F., & Pagano, I., 2012. Multiwavelength flux variations induced by stellar magnetic activity: effects on planetary transits, A&A, 539, A140.
- Baranec et al. (2016) Baranec, C., Ziegler, C., Law, N. M., Morton, T., Riddle, R., Atkinson, D., Schonhut, J., & Crepp, J., 2016. Robo-AO Kepler Planetary Candidate Survey. II. Adaptive Optics Imaging of 969 Kepler Exoplanet Candidate Host Stars, AJ, 152(1), 18.
- Barragán et al. (2019) Barragán, O., Aigrain, S., Kubyshkina, D., Gandolfi, D., Livingston, J., Fridlund, M. C. V., Fossati, L., Korth, J., Parviainen, H., Malavolta, L., Palle, E., Deeg, H. J., Nowak, G., Rajpaul, V. M., Zicher, N., Antoniciello, G., Narita, N., Albrecht, S., Bedin, L. R., Cabrera, J., Cochran, W. D., de Leon, J., Eigmüller, P., Fukui, A., Granata, V., Grziwa, S., Guenther, E., Hatzes, A. P., Kusakabe, N., Latham, D. W., Libralato, M., Luque, R., Montañés-Rodríguez, P., Murgas, F., Nardiello, D., Pagano, I., Piotto, G., Persson, C. M., Redfield, S., & Tamura, M., 2019. Radial velocity confirmation of K2-100b: a young, highly irradiated, and low-density transiting hot Neptune, MNRAS, 490(1), 698–708.
- Barros et al. (2013) Barros, S. C. C., Boué, G., Gibson, N. P., Pollacco, D. L., Santerne, A., Keenan, F. P., Skillen, I., & Street, R. A., 2013. Transit timing variations in WASP-10b induced by stellar activity, MNRAS, 430, 3032–3047.
- Barstow & Irwin (2016) Barstow, J. K. & Irwin, P. G. J., 2016. Habitable worlds with JWST: transit spectroscopy of the TRAPPIST-1 system?, MNRAS, 461(1), L92–L96.
- Basri (2021) Basri, G., 2021. An Introduction to Stellar Magnetic Activity.
- Basri & Shah (2020) Basri, G. & Shah, R., 2020. The Information Content in Analytic Spot Models of Broadband Precision Light Curves. II. Spot Distributions and Lifetimes and Global and Differential Rotation, ApJ, 901(1), 14.
- Bastien et al. (2013) Bastien, F. A., Stassun, K. G., Basri, G., & Pepper, J., 2013. An observational correlation between stellar brightness variations and surface gravity, Nature, 500(7463), 427–430.
- Bastien et al. (2016) Bastien, F. A., Stassun, K. G., Basri, G., & Pepper, J., 2016. A Granulation “Flicker”-based Measure of Stellar Surface Gravity, ApJ, 818(1), 43.
- Bazilevskaya et al. (2014) Bazilevskaya, G. A., Cliver, E. W., Kovaltsov, G. A., Ling, A. G., Shea, M. A., Smart, D. F., & Usoskin, I. G., 2014. Solar Cycle in the Heliosphere and Cosmic Rays, Space Sci. Rev., 186(1-4), 409–435.
- Bazot et al. (2011) Bazot, M., Ireland, M. J., Huber, D., Bedding, T. R., Broomhall, A. M., Campante, T. L., Carfantan, H., Chaplin, W. J., Elsworth, Y., Meléndez, J., Petit, P., Théado, S., Van Grootel, V., Arentoft, T., Asplund, M., Castro, M., Christensen-Dalsgaard, J., Do Nascimento, J. D., Dintrans, B., Dumusque, X., Kjeldsen, H., McAlister, H. A., Metcalfe, T. S., Monteiro, M. J. P. F. G., Santos, N. C., Sousa, S., Sturmann, J., Sturmann, L., ten Brummelaar, T. A., Turner, N., & Vauclair, S., 2011. The radius and mass of the close solar twin 18 Scorpii derived from asteroseismology and interferometry, A&A, 526, L4.
- Bean et al. (2010) Bean, J. L., Miller-Ricci Kempton, E., & Homeier, D., 2010. A ground-based transmission spectrum of the super-Earth exoplanet GJ 1214b, Nature, 468(7324), 669–672.
- Bean et al. (2018) Bean, J. L., Stevenson, K. B., Batalha, N. M., Berta-Thompson, Z., Kreidberg, L., Crouzet, N., Benneke, B., Line, M. R., Sing, D. K., Wakeford, H. R., Knutson, H. A., Kempton, E. M. R., Désert, J.-M., Crossfield, I., Batalha, N. E., de Wit, J., Parmentier, V., Harrington, J., Moses, J. I., Lopez-Morales, M., Alam, M. K., Blecic, J., Bruno, G., Carter, A. L., Chapman, J. W., Decin, L., Dragomir, D., Evans, T. M., Fortney, J. J., Fraine, J. D., Gao, P., García Muñoz, A., Gibson, N. P., Goyal, J. M., Heng, K., Hu, R., Kendrew, S., Kilpatrick, B. M., Krick, J., Lagage, P.-O., Lendl, M., Louden, T., Madhusudhan, N., Mandell, A. M., Mansfield, M., May, E. M., Morello, G., Morley, C. V., Nikolov, N., Redfield, S., Roberts, J. E., Schlawin, E., Spake, J. J., Todorov, K. O., Tsiaras, A., Venot, O., Waalkes, W. C., Wheatley, P. J., Zellem, R. T., Angerhausen, D., Barrado, D., Carone, L., Casewell, S. L., Cubillos, P. E., Damiano, M., de Val-Borro, M., Drummond, B., Edwards, B., Endl, M., Espinoza, N., France, K., Gizis, J. E., Greene, T. P., Henning, T. K., Hong, Y., Ingalls, J. G., Iro, N., Irwin, P. G. J., Kataria, T., Lahuis, F., Leconte, J., Lillo-Box, J., Lines, S., Lothringer, J. D., Mancini, L., Marchis, F., Mayne, N., Palle, E., Rauscher, E., Roudier, G., Shkolnik, E. L., Southworth, J., Swain, M. R., Taylor, J., Teske, J., Tinetti, G., Tremblin, P., Tucker, G. S., van Boekel, R., Waldmann, I. P., Weaver, I. C., & Zingales, T., 2018. The Transiting Exoplanet Community Early Release Science Program for JWST, Publications of the Astronomical Society of the Pacific, 130(993), 114402.
- Beckers & Schröter (1968) Beckers, J. M. & Schröter, E. H., 1968. The Intensity, Velocity and Magnetic Structure of a Sunspot Region. II: Some Properties of Umbral Dots, Sol. Phys., 4(3), 303–314.
- Beeck (2014) Beeck, B., 2014. Simulations of magnetoconvection in cool main-sequence stars, Ph.D. thesis, Georg-August-UniversitGoettingen.
- Beeck et al. (2011) Beeck, B., Schüssler, M., & Reiners, A., 2011. MHD Simulations Reveal Crucial Differences Between Solar and Very Cool Star Magnetic Structures, in 16th Cambridge Workshop on Cool Stars, Stellar Systems, and the Sun, vol. 448 of Astronomical Society of the Pacific Conference Series, p. 1071.
- Beeck et al. (2012) Beeck, B., Collet, R., Steffen, M., Asplund, M., Cameron, R. H., Freytag, B., Hayek, W., Ludwig, H. G., & Schüssler, M., 2012. Simulations of the solar near-surface layers with the CO5BOLD, MURaM, and Stagger codes, A&A, 539, A121.
- Beeck et al. (2013a) Beeck, B., Cameron, R. H., Reiners, A., & Schüssler, M., 2013a. Three-dimensional simulations of near-surface convection in main-sequence stars. I. Overall structure, A&A, 558, A48.
- Beeck et al. (2013b) Beeck, B., Cameron, R. H., Reiners, A., & Schüssler, M., 2013b. Three-dimensional simulations of near-surface convection in main-sequence stars. II. Properties of granulation and spectral lines, A&A, 558, A49.
- Beeck et al. (2015a) Beeck, B., Schüssler, M., Cameron, R. H., & Reiners, A., 2015a. Three-dimensional simulations of near-surface convection in main-sequence stars. III. The structure of small-scale magnetic flux concentrations, A&A, 581, A42.
- Beeck et al. (2015b) Beeck, B., Schüssler, M., Cameron, R. H., & Reiners, A., 2015b. Three-dimensional simulations of near-surface convection in main-sequence stars. IV. Effect of small-scale magnetic flux concentrations on centre-to-limb variation and spectral lines, A&A, 581, A43.
- Béky et al. (2014) Béky, B., Kipping, D. M., & Holman, M. J., 2014. SPOTROD: a semi-analytic model for transits of spotted stars, MNRAS, 442, 3686–3699.
- Bellot Rubio & Orozco Suárez (2019) Bellot Rubio, L. & Orozco Suárez, D., 2019. Quiet Sun magnetic fields: an observational view, Living Reviews in Solar Physics, 16(1), 1.
- Benneke et al. (2019a) Benneke, B., Knutson, H. A., Lothringer, J., Crossfield, I. J. M., Moses, J. I., Morley, C., Kreidberg, L., Fulton, B. J., Dragomir, D., Howard, A. W., Wong, I., Désert, J.-M., McCullough, P. R., Kempton, E. M. R., Fortney, J., Gilliland, R., Deming, D., & Kammer, J., 2019a. A sub-Neptune exoplanet with a low-metallicity methane-depleted atmosphere and Mie-scattering clouds, Nature Astronomy, 3, 813–821.
- Benneke et al. (2019b) Benneke, B., Wong, I., Piaulet, C., Knutson, H. A., Lothringer, J., Morley, C. V., Crossfield, I. J. M., Gao, P., Greene, T. P., Dressing, C., Dragomir, D., Howard, A. W., McCullough, P. R., Kempton, E. M. R., Fortney, J. J., & Fraine, J., 2019b. Water Vapor and Clouds on the Habitable-zone Sub-Neptune Exoplanet K2-18b, ApJ, 887(1), L14.
- Benz et al. (2021) Benz, W., Broeg, C., Fortier, A., Rando, N., Beck, T., Beck, M., Queloz, D., Ehrenreich, D., Maxted, P. F. L., Isaak, K. G., Billot, N., Alibert, Y., Alonso, R., António, C., Asquier, J., Bandy, T., Bárczy, T., Barrado, D., Barros, S. C. C., Baumjohann, W., Bekkelien, A., Bergomi, M., Biondi, F., Bonfils, X., Borsato, L., Brandeker, A., Busch, M. D., Cabrera, J., Cessa, V., Charnoz, S., Chazelas, B., Collier Cameron, A., Corral Van Damme, C., Cortes, D., Davies, M. B., Deleuil, M., Deline, A., Delrez, L., Demangeon, O., Demory, B. O., Erikson, A., Farinato, J., Fossati, L., Fridlund, M., Futyan, D., Gandolfi, D., Garcia Munoz, A., Gillon, M., Guterman, P., Gutierrez, A., Hasiba, J., Heng, K., Hernandez, E., Hoyer, S., Kiss, L. L., Kovacs, Z., Kuntzer, T., Laskar, J., Lecavelier des Etangs, A., Lendl, M., López, A., Lora, I., Lovis, C., Lüftinger, T., Magrin, D., Malvasio, L., Marafatto, L., Michaelis, H., de Miguel, D., Modrego, D., Munari, M., Nascimbeni, V., Olofsson, G., Ottacher, H., Ottensamer, R., Pagano, I., Palacios, R., Pallé, E., Peter, G., Piazza, D., Piotto, G., Pizarro, A., Pollaco, D., Ragazzoni, R., Ratti, F., Rauer, H., Ribas, I., Rieder, M., Rohlfs, R., Safa, F., Salatti, M., Santos, N. C., Scandariato, G., Ségransan, D., Simon, A. E., Smith, A. M. S., Sordet, M., Sousa, S. G., Steller, M., Szabó, G. M., Szoke, J., Thomas, N., Tschentscher, M., Udry, S., Van Grootel, V., Viotto, V., Walter, I., Walton, N. A., Wildi, F., & Wolter, D., 2021. The CHEOPS mission, Experimental Astronomy, 51(1), 109–151.
- Berdyugina (1998) Berdyugina, S. V., 1998. Surface imaging by the Occamian approach. Basic principles, simulations, and tests, A&A, 338, 97–105.
- Berdyugina (2002) Berdyugina, S. V., 2002. Sunspot and starspot interiors as seen from molecular lines, Astronomische Nachrichten, 323, 192–195.
- Berdyugina (2005) Berdyugina, S. V., 2005. Starspots: A Key to the Stellar Dynamo, Living Reviews in Solar Physics, 2(1), 8.
- Berdyugina (2009) Berdyugina, S. V., 2009. Stellar magnetic fields across the H-R diagram: observational evidence, in Cosmic Magnetic Fields: From Planets, to Stars and Galaxies, vol. 259, pp. 323–332.
- Berdyugina (2011) Berdyugina, S. V., 2011. Polarimetry of Cool Atmospheres: From the Sun to Exoplanets, in Solar Polarization 6, vol. 437 of Astronomical Society of the Pacific Conference Series, p. 219.
- Berdyugina & Fluri (2004) Berdyugina, S. V. & Fluri, D. M., 2004. Evidence for the Hanle effect in molecular lines, A&A, 417, 775–784.
- Berdyugina & Henry (2007) Berdyugina, S. V. & Henry, G. W., 2007. Butterfly Diagram and Activity Cycles in HR 1099, ApJ, 659(2), L157–L160.
- Berdyugina & Kuhn (2019) Berdyugina, S. V. & Kuhn, J. R., 2019. Surface Imaging of Proxima b and Other Exoplanets: Albedo Maps, Biosignatures, and Technosignatures, AJ, 158(6), 246.
- Berdyugina & Solanki (2002) Berdyugina, S. V. & Solanki, S. K., 2002. The molecular Zeeman effect and diagnostics of solar and stellar magnetic fields. I. Theoretical spectral patterns in the Zeeman regime, A&A, 385, 701–715.
- Berdyugina & Tuominen (1998) Berdyugina, S. V. & Tuominen, I., 1998. Permanent active longitudes and activity cycles on RS CVn stars, A&A, 336, L25–L28.
- Berdyugina et al. (1998) Berdyugina, S. V., Jankov, S., Ilyin, I., Tuominen, I., & Fekel, F. C., 1998. The active RS Canum Venaticorum binary II Pegasi. I. Stellar and orbital parameters, A&A, 334, 863–872.
- Berdyugina et al. (1999) Berdyugina, S. V., Ilyin, I., & Tuominen, I., 1999. The long-period RS Canum Venaticorum binary IM Pegasi. I. Orbital and stellar parameters, A&A, 347, 932–936.
- Berdyugina et al. (2000) Berdyugina, S. V., Frutiger, C., Solanki, S. K., & Livingstone, W., 2000. Successful spectral synthesis of Zeeman-split molecular bands in sunspot spectra, A&A, 364, L101–L104.
- Berdyugina et al. (2002) Berdyugina, S. V., Pelt, J., & Tuominen, I., 2002. Magnetic activity in the young solar analog LQ Hydrae. I. Active longitudes and cycles, A&A, 394, 505–515.
- Berdyugina et al. (2003) Berdyugina, S. V., Solanki, S. K., & Frutiger, C., 2003. The molecular Zeeman effect and diagnostics of solar and stellar magnetic fields. II. Synthetic Stokes profiles in the Zeeman regime, A&A, 412, 513–527.
- Berdyugina et al. (2005) Berdyugina, S. V., Braun, P. A., Fluri, D. M., & Solanki, S. K., 2005. The molecular Zeeman effect and diagnostics of solar and stellar magnetic fields. III. Theoretical spectral patterns in the Paschen-Back regime, A&A, 444(3), 947–960.
- Berdyugina et al. (2006) Berdyugina, S. V., Petit, P., Fluri, D. M., Afram, N., & Arnaud, J., 2006. Detection of the Molecular Zeeman Effect in Circular Polarization on Cool Active Stars, in Solar Polarization 4, vol. 358 of Astronomical Society of the Pacific Conference Series, p. 381.
- Berdyugina et al. (2017) Berdyugina, S. V., Harrington, D. M., Kuzmychov, O., Kuhn, J. R., Hallinan, G., Kowalski, A. F., & Hawley, S. L., 2017. First Detection of a Strong Magnetic Field on a Bursty Brown Dwarf: Puzzle Solved, ApJ, 847(1), 61.
- Berger & Berdyugina (2003) Berger, T. E. & Berdyugina, S. V., 2003. The Observation of Sunspot Light-Bridge Structure and Dynamics, ApJ, 589(2), L117–L121.
- Berger & Title (2001) Berger, T. E. & Title, A. M., 2001. On the Relation of G-Band Bright Points to the Photospheric Magnetic Field, ApJ, 553(1), 449–469.
- Berger et al. (2007) Berger, T. E., Rouppe van der Voort, L., & Löfdahl, M., 2007. Contrast Analysis of Solar Faculae and Magnetic Bright Points, ApJ, 661(2), 1272–1288.
- Berta et al. (2011) Berta, Z. K., Charbonneau, D., Bean, J., Irwin, J., Burke, C. J., Désert, J.-M., Nutzman, P., & Falco, E. E., 2011. The GJ1214 Super-Earth System: Stellar Variability, New Transits, and a Search for Additional Planets, ApJ, 736(1), 12.
- Berta et al. (2012) Berta, Z. K., Charbonneau, D., Désert, J.-M., Miller-Ricci Kempton, E., McCullough, P. R., Burke, C. J., Fortney, J. J., Irwin, J., Nutzman, P., & Homeier, D., 2012. The Flat Transmission Spectrum of the Super-Earth GJ1214b from Wide Field Camera 3 on the Hubble Space Telescope, ApJ, 747(1), 35.
- Beskin et al. (1988) Beskin, G. M., Chekh, S. A., Gershberg, R. E., Mitronova, S. N., Neizvestnyi, S. I., Plakhotnichenko, V. L., Pustilnik, L. A., Shvartsman, V. F., & Zhurovkov, A. V., 1988. A Search at 0.3-MICROSECOND Resolution for Fine Structure in Uv-Ceti Type Flares, Soviet Astronomy Letters, 14, 65.
- Bétrémieux & Kaltenegger (2013) Bétrémieux, Y. & Kaltenegger, L., 2013. Transmission Spectrum of Earth as a Transiting Exoplanet from the Ultraviolet to the Near-infrared, ApJ, 772(2), L31.
- Bhatia et al. (2021) Bhatia, T., Cameron, R., Solanki, S., Peter, H., Przybylski, D., Witzke, V., & Shapiro, A., 2021. Small-scale Dynamo in Cool Main-Sequence Stars: Effect on Stratification, Convection and Bolometric Intensity, in American Astronomical Society Meeting Abstracts, vol. 53 of American Astronomical Society Meeting Abstracts, p. 304.04.
- Bhatia et al. (2022) Bhatia, T. S., Cameron, R. H., Solanki, S. K., Peter, H., Przybylski, D., Witzke, V., & Shapiro, A., 2022. Small-scale dynamo in cool stars. I. Changes in stratification and near-surface convection for main-sequence spectral types, A&A, 663, A166.
- Biazzo et al. (2022) Biazzo, K., D’Orazi, V., Desidera, S., Turrini, D., Benatti, S., Gratton, R., Magrini, L., Sozzetti, A., Baratella, M., Bonomo, A. S., Borsa, F., Claudi, R., Covino, E., Damasso, M., Di Mauro, M. P., Lanza, A. F., Maggio, A., Malavolta, L., Maldonado, J., Marzari, F., Micela, G., Poretti, E., Vitello, F., Affer, L., Bignamini, A., Carleo, I., Cosentino, R., Fiorenzano, A. F. M., Giacobbe, P., Harutyunyan, A., Leto, G., Mancini, L., Molinari, E., Molinaro, M., Nardiello, D., Nascimbeni, V., Pagano, I., Pedani, M., Piotto, G., Rainer, M., & Scandariato, G., 2022. The GAPS Programme at TNG. XXXV. Fundamental properties of transiting exoplanet host stars, A&A, 664, A161.
- Biller et al. (2013) Biller, B. A., Crossfield, I. J. M., Mancini, L., Ciceri, S., Southworth, J., Kopytova, T. G., Bonnefoy, M., Deacon, N. R., Schlieder, J. E., Buenzli, E., Brandner, W., Allard, F., Homeier, D., Freytag, B., Bailer-Jones, C. A. L., Greiner, J., Henning, T., & Goldman, B., 2013. Weather on the Nearest Brown Dwarfs: Resolved Simultaneous Multi-wavelength Variability Monitoring of WISE J104915.57-531906.1AB, ApJ, 778(1), L10.
- Blanco Rodríguez & Kneer (2010) Blanco Rodríguez, J. & Kneer, F., 2010. Faculae at the poles of the Sun revisited: infrared observations, A&A, 509, A92.
- Bogdan et al. (1988) Bogdan, T. J., Gilman, P. A., Lerche, I., & Howard, R., 1988. Distribution of Sunspot Umbral Areas: 1917–1982, ApJ, 327, 451.
- Boisse et al. (2012) Boisse, I., Bonfils, X., & Santos, N. C., 2012. SOAP. A tool for the fast computation of photometry and radial velocity induced by stellar spots, A&A, 545, A109.
- Boldt et al. (2020) Boldt, S., Oshagh, M., Dreizler, S., Mallonn, M., Santos, N. C., Claret, A., Reiners, A., & Sedaghati, E., 2020. Stellar activity consequence on the retrieved transmission spectra through chromatic Rossiter-McLaughlin observations, A&A, 635, A123.
- Boley et al. (2020) Boley, A. C., Van Laerhoven, C., & Granados Contreras, A. P., 2020. Transit Duration Variations in Multiplanet Systems, AJ, 159(5), 207.
- Bonifacio et al. (2018) Bonifacio, P., Caffau, E., Ludwig, H. G., Steffen, M., Castelli, F., Gallagher, A. J., Kučinskas, A., Prakapavičius, D., Cayrel, R., Freytag, B., Plez, B., & Homeier, D., 2018. Using the CIFIST grid of CO5BOLD 3D model atmospheres to study the effects of stellar granulation on photometric colours. I. Grids of 3D corrections in the UBVRI, 2MASS, HIPPARCOS, Gaia, and SDSS systems, A&A, 611, A68.
- Bopp & Evans (1973) Bopp, B. W. & Evans, D. S., 1973. The spotted flare stars BY Dra and CC Eri: a model for the spots and some astrophysical implications., MNRAS, 164, 343–356.
- Borrero & Ichimoto (2011) Borrero, J. M. & Ichimoto, K., 2011. Magnetic Structure of Sunspots, Living Reviews in Solar Physics, 8(1), 4.
- Borucki et al. (2010) Borucki, W. J., Koch, D., Basri, G., Batalha, N., Brown, T., Caldwell, D., Caldwell, J., Christensen-Dalsgaard, J., Cochran, W. D., DeVore, E., Dunham, E. W., Dupree, A. K., Gautier, T. N., Geary, J. C., Gilliland, R., Gould, A., Howell, S. B., Jenkins, J. M., Kondo, Y., Latham, D. W., Marcy, G. W., Meibom, S., Kjeldsen, H., Lissauer, J. J., Monet, D. G., Morrison, D., Sasselov, D., Tarter, J., Boss, A., Brownlee, D., Owen, T., Buzasi, D., Charbonneau, D., Doyle, L., Fortney, J., Ford, E. B., Holman, M. J., Seager, S., Steffen, J. H., Welsh, W. F., Rowe, J., Anderson, H., Buchhave, L., Ciardi, D., Walkowicz, L., Sherry, W., Horch, E., Isaacson, H., Everett, M. E., Fischer, D., Torres, G., Johnson, J. A., Endl, M., MacQueen, P., Bryson, S. T., Dotson, J., Haas, M., Kolodziejczak, J., Van Cleve, J., Chandrasekaran, H., Twicken, J. D., Quintana, E. V., Clarke, B. D., Allen, C., Li, J., Wu, H., Tenenbaum, P., Verner, E., Bruhweiler, F., Barnes, J., & Prsa, A., 2010. Kepler Planet-Detection Mission: Introduction and First Results, Science, 327, 977–.
- Boyajian et al. (2012a) Boyajian, T. S., McAlister, H. A., van Belle, G., Gies, D. R., ten Brummelaar, T. A., von Braun, K., Farrington, C., Goldfinger, P. J., O’Brien, D., Parks, J. R., Richardson, N. D., Ridgway, S., Schaefer, G., Sturmann, L., Sturmann, J., Touhami, Y., Turner, N. H., & White, R., 2012a. Stellar Diameters and Temperatures. I. Main-sequence A, F, and G Stars, ApJ, 746(1), 101.
- Boyajian et al. (2012b) Boyajian, T. S., von Braun, K., van Belle, G., McAlister, H. A., ten Brummelaar, T. A., Kane, S. R., Muirhead, P. S., Jones, J., White, R., Schaefer, G., Ciardi, D., Henry, T., López-Morales, M., Ridgway, S., Gies, D., Jao, W.-C., Rojas-Ayala, B., Parks, J. R., Sturmann, L., Sturmann, J., Turner, N. H., Farrington, C., Goldfinger, P. J., & Berger, D. H., 2012b. Stellar Diameters and Temperatures. II. Main-sequence K- and M-stars, ApJ, 757(2), 112.
- Boyajian et al. (2013) Boyajian, T. S., von Braun, K., van Belle, G., Farrington, C., Schaefer, G., Jones, J., White, R., McAlister, H. A., ten Brummelaar, T. A., Ridgway, S., Gies, D., Sturmann, L., Sturmann, J., Turner, N. H., Goldfinger, P. J., & Vargas, N., 2013. Stellar Diameters and Temperatures. III. Main-sequence A, F, G, and K Stars: Additional High-precision Measurements and Empirical Relations, ApJ, 771(1), 40.
- Bradshaw & Hartigan (2014) Bradshaw, S. J. & Hartigan, P., 2014. On Sunspot and Starspot Lifetimes, ApJ, 795(1), 79.
- Brehm et al. (2021) Brehm, N., Bayliss, A., Christl, M., Synal, H.-A., Adolphi, F., Beer, J., Kromer, B., Muscheler, R., Solanki, S. K., Usoskin, I., Bleicher, N., Bollhalder, S., Tyers, C., & Wacker, L., 2021. Eleven-year solar cycles over the last millennium revealed by radiocarbon in tree rings, Nature Geoscience, 14(1), 10–15.
- Brown (2014) Brown, D. J. A., 2014. Discrepancies between isochrone fitting and gyrochronology for exoplanet host stars?, MNRAS, 442(2), 1844–1862.
- Brown et al. (2001) Brown, T. M., Charbonneau, D., Gilliland, R. L., Noyes, R. W., & Burrows, A., 2001. Hubble Space Telescope Time-Series Photometry of the Transiting Planet of HD 209458, ApJ, 552, 699–709.
- Bruno & Deleuil (2021) Bruno, G. & Deleuil, M., 2021. Stellar activity and transits, arXiv e-prints, p. arXiv:2104.06173.
- Bruno et al. (2016) Bruno, G., Deleuil, M., Almenara, J. M., Barros, S. C. C., Lanza, A. F., Montalto, M., Boisse, I., Santerne, A., Lagrange, A. M., & Meunier, N., 2016. Disentangling planetary and stellar activity features in the CoRoT-2 light curve, A&A, 595, A89.
- Bruno et al. (2022) Bruno, G., Lewis, N. K., Valenti, J. A., Pagano, I., Wilson, T. J., Schlawin, E., Lothringer, J., Lanza, A. F., Fraine, J., Scandariato, G., Micela, G., & Cracchiolo, G., 2022. Hiding in plain sight: observing planet-starspot crossings with the James Webb Space Telescope, MNRAS, 509(4), 5030–5045.
- Budding (1977) Budding, E., 1977. The Interpretation of Cyclical Photometric Variations in Certain Dwarf ME-Type Stars, Ap&SS, 48(1), 207–223.
- Buehler et al. (2019) Buehler, D., Lagg, A., van Noort, M., & Solanki, S. K., 2019. A comparison between solar plage and network properties, A&A, 630, A86.
- Buenzli et al. (2014) Buenzli, E., Apai, D., Radigan, J., Reid, I. N., & Flateau, D., 2014. Brown Dwarf Photospheres are Patchy: A Hubble Space Telescope Near-infrared Spectroscopic Survey Finds Frequent Low-level Variability, ApJ, 782(2), 77.
- Burdanov et al. (2019) Burdanov, A. Y., Lederer, S. M., Gillon, M., Delrez, L., Ducrot, E., de Wit, J., Jehin, E., Triaud, A. H. M. J., Lidman, C., Spitler, L., Demory, B. O., Queloz, D., & Van Grootel, V., 2019. Ground-based follow-up observations of TRAPPIST-1 transits in the near-infrared, MNRAS, 487(2), 1634–1652.
- Cabrera et al. (2010) Cabrera, J., Bruntt, H., Ollivier, M., Díaz, R. F., Csizmadia, S., Aigrain, S., Alonso, R., Almenara, J. M., Auvergne, M., Baglin, A., Barge, P., Bonomo, A. S., Bordé, P., Bouchy, F., Carone, L., Carpano, S., Deleuil, M., Deeg, H. J., Dvorak, R., Erikson, A., Ferraz-Mello, S., Fridlund, M., Gandolfi, D., Gazzano, J. C., Gillon, M., Guenther, E. W., Guillot, T., Hatzes, A., Havel, M., Hébrard, G., Jorda, L., Léger, A., Llebaria, A., Lammer, H., Lovis, C., Mazeh, T., Moutou, C., Ofir, A., von Paris, P., Pätzold, M., Queloz, D., Rauer, H., Rouan, D., Santerne, A., Schneider, J., Tingley, B., Titz-Weider, R., & Wuchterl, G., 2010. Transiting exoplanets from the CoRoT space mission . XIII. CoRoT-13b: a dense hot Jupiter in transit around a star with solar metallicity and super-solar lithium content, A&A, 522, A110.
- Campante et al. (2016) Campante, T. L., Schofield, M., Kuszlewicz, J. S., Bouma, L., Chaplin, W. J., Huber, D., Christensen-Dalsgaard, J., Kjeldsen, H., Bossini, D., North, T. S. H., Appourchaux, T., Latham, D. W., Pepper, J., Ricker, G. R., Stassun, K. G., Vanderspek, R., & Winn, J. N., 2016. The Asteroseismic Potential of TESS: Exoplanet-host Stars, ApJ, 830(2), 138.
- Carlsson & Stein (2002) Carlsson, M. & Stein, R. F., 2002. Dynamic Hydrogen Ionization, ApJ, 572(1), 626–635.
- Carlsson et al. (2016) Carlsson, M., Hansteen, V. H., Gudiksen, B. V., Leenaarts, J., & De Pontieu, B., 2016. A publicly available simulation of an enhanced network region of the Sun, A&A, 585, A4.
- Carter & Winn (2010) Carter, J. A. & Winn, J. N., 2010. The Detectability of Transit Depth Variations Due to Exoplanetary Oblateness and Spin Precession, ApJ, 716(1), 850–856.
- Casanovas (1997) Casanovas, J., 1997. Early Observations of Sunspots: Scheiner and Galileo, in 1st Advances in Solar Physics Euroconference. Advances in Physics of Sunspots, vol. 118 of Astronomical Society of the Pacific Conference Series, p. 3.
- Castelli & Kurucz (2003) Castelli, F. & Kurucz, R. L., 2003. New Grids of ATLAS9 Model Atmospheres, in Modelling of Stellar Atmospheres, vol. 210 of IAU Symposium, p. A20.
- Catalano et al. (2002) Catalano, S., Biazzo, K., Frasca, A., & Marilli, E., 2002. Measuring starspot temperature from line depth ratios. I. The method, A&A, 394, 1009–1021.
- Cauley et al. (2018) Cauley, P. W., Kuckein, C., Redfield, S., Shkolnik, E. L., Denker, C., Llama, J., & Verma, M., 2018. The Effects of Stellar Activity on Optical High-resolution Exoplanet Transmission Spectra, AJ, 156(5), 189.
- Chachan et al. (2019) Chachan, Y., Knutson, H. A., Gao, P., Kataria, T., Wong, I., Henry, G. W., Benneke, B., Zhang, M., Barstow, J., Bean, J. L., Mikal-Evans, T., Lewis, N. K., Mansfield, M., López-Morales, M., Nikolov, N., Sing, D. K., & Wakeford, H., 2019. A Hubble PanCET Study of HAT-P-11b: A Cloudy Neptune with a Low Atmospheric Metallicity, AJ, 158(6), 244.
- Chaplin et al. (2011a) Chaplin, W. J., Kjeldsen, H., Bedding, T. R., Christensen-Dalsgaard, J., Gilliland, R. L., Kawaler, S. D., Appourchaux, T., Elsworth, Y., García, R. A., Houdek, G., Karoff, C., Metcalfe, T. S., Molenda-Żakowicz, J., Monteiro, M. J. P. F. G., Thompson, M. J., Verner, G. A., Batalha, N., Borucki, W. J., Brown, T. M., Bryson, S. T., Christiansen, J. L., Clarke, B. D., Jenkins, J. M., Klaus, T. C., Koch, D., An, D., Ballot, J., Basu, S., Benomar, O., Bonanno, A., Broomhall, A. M., Campante, T. L., Corsaro, E., Creevey, O. L., Esch, L., Gai, N., Gaulme, P., Hale, S. J., Handberg, R., Hekker, S., Huber, D., Mathur, S., Mosser, B., New, R., Pinsonneault, M. H., Pricopi, D., Quirion, P. O., Régulo, C., Roxburgh, I. W., Salabert, D., Stello, D., & Suran, M. D., 2011a. Predicting the Detectability of Oscillations in Solar-type Stars Observed by Kepler, ApJ, 732(1), 54.
- Chaplin et al. (2011b) Chaplin, W. J., Kjeldsen, H., Christensen-Dalsgaard, J., Basu, S., Miglio, A., Appourchaux, T., Bedding, T. R., Elsworth, Y., García, R. A., Gilliland, R. L., Girardi, L., Houdek, G., Karoff, C., Kawaler, S. D., Metcalfe, T. S., Molenda-Żakowicz, J., Monteiro, M. J. P. F. G., Thompson, M. J., Verner, G. A., Ballot, J., Bonanno, A., Brandão, I. M., Broomhall, A. M., Bruntt, H., Campante, T. L., Corsaro, E., Creevey, O. L., Doğan, G., Esch, L., Gai, N., Gaulme, P., Hale, S. J., Handberg, R., Hekker, S., Huber, D., Jiménez, A., Mathur, S., Mazumdar, A., Mosser, B., New, R., Pinsonneault, M. H., Pricopi, D., Quirion, P. O., Régulo, C., Salabert, D., Serenelli, A. M., Silva Aguirre, V., Sousa, S. G., Stello, D., Stevens, I. R., Suran, M. D., Uytterhoeven, K., White, T. R., Borucki, W. J., Brown, T. M., Jenkins, J. M., Kinemuchi, K., Van Cleve, J., & Klaus, T. C., 2011b. Ensemble Asteroseismology of Solar-Type Stars with the NASA Kepler Mission, Science, 332(6026), 213.
- Chaplin et al. (2015) Chaplin, W. J., Lund, M. N., Handberg, R., Basu, S., Buchhave, L. A., Campante, T. L., Davies, G. R., Huber, D., Latham, D. W., Latham, C. A., Serenelli, A., Antia, H. M., Appourchaux, T., Ball, W. H., Benomar, O., Casagrande, L., Christensen-Dalsgaard, J., Coelho, H. R., Creevey, O. L., Elsworth, Y., García, R. A., Gaulme, P., Hekker, S., Kallinger, T., Karoff, C., Kawaler, S. D., Kjeldsen, H., Lundkvist, M. S., Marcadon, F., Mathur, S., Miglio, A., Mosser, B., Régulo, C., Roxburgh, I. W., Silva Aguirre, V., Stello, D., Verma, K., White, T. R., Bedding, T. R., Barclay, T., Buzasi, D. L., Dehuevels, S., Gizon, L., Houdek, G., Howell, S. B., Salabert, D., & Soderblom, D. R., 2015. Asteroseismology of Solar-Type Stars with K2: Detection of Oscillations in C1 Data, PASP, 127(956), 1038.
- Chapman (1970) Chapman, G. A., 1970. An Interference Filter for Observing the Photospheric Network, Sol. Phys., 13(1), 78–84.
- Chapman et al. (2013) Chapman, G. A., Cookson, A. M., & Preminger, D. G., 2013. Modeling Total Solar Irradiance with San Fernando Observatory Ground-Based Photometry: Comparison with ACRIM, PMOD, and RMIB Composites, Sol. Phys., 283(2), 295–305.
- Charbonneau et al. (2000) Charbonneau, D., Brown, T. M., Latham, D. W., & Mayor, M., 2000. Detection of Planetary Transits Across a Sun-like Star, ApJ, 529, L45–L48.
- Charbonneau et al. (2002) Charbonneau, D., Brown, T. M., Noyes, R. W., & Gilliland, R. L., 2002. Detection of an Extrasolar Planet Atmosphere, ApJ, 568(1), 377–384.
- Chatzistergos et al. (2019a) Chatzistergos, T., Ermolli, I., Krivova, N. A., & Solanki, S. K., 2019a. Analysis of full disc Ca II K spectroheliograms. II. Towards an accurate assessment of long-term variations in plage areas, A&A, 625, A69.
- Chatzistergos et al. (2019b) Chatzistergos, T., Ermolli, I., Solanki, S. K., Krivova, N. A., Giorgi, F., & Yeo, K. L., 2019b. Recovering the unsigned photospheric magnetic field from Ca II K observations, A&A, 626, A114.
- Chatzistergos et al. (2020a) Chatzistergos, T., Ermolli, I., Giorgi, F., Krivova, N. A., & Puiu, C. C., 2020a. Modelling solar irradiance from ground-based photometric observations, J. Space Weather Space Clim., 10, 45.
- Chatzistergos et al. (2020b) Chatzistergos, T., Ermolli, I., Krivova, N. A., Solanki, S. K., Banerjee, D., Barata, T., Belik, M., Gafeira, R., Garcia, A., Hanaoka, Y., Hegde, M., Klimeš, J., Korokhin, V. V., Lourenço, A., Malherbe, J.-M., Marchenko, G. P., Peixinho, N., Sakurai, T., & Tlatov, A. G., 2020b. Analysis of full-disc Ca II K spectroheliograms. III. Plage area composite series covering 1892-2019, A&A, 639, A88.
- Chen et al. (2017) Chen, G., Guenther, E. W., Pallé, E., Nortmann, L., Nowak, G., Kunz, S., Parviainen, H., & Murgas, F., 2017. The GTC exoplanet transit spectroscopy survey. V. A spectrally-resolved Rayleigh scattering slope in GJ 3470b, A&A, 600, A138.
- Chiavassa et al. (2009) Chiavassa, A., Plez, B., Josselin, E., & Freytag, B., 2009. Radiative hydrodynamics simulations of red supergiant stars. I. interpretation of interferometric observations, A&A, 506(3), 1351–1365.
- Chiavassa et al. (2017) Chiavassa, A., Caldas, A., Selsis, F., Leconte, J., Von Paris, P., Bordé, P., Magic, Z., Collet, R., & Asplund, M., 2017. Measuring stellar granulation during planet transits, A&A, 597, A94.
- Choudhary et al. (2020) Choudhary, D. P., Cadavid, A. C., Cookson, A., & Chapman, G. A., 2020. Variability in Irradiance and Photometric Indices During the Last Two Solar Cycles, Sol. Phys., 295(2), 15.
- Ciceri et al. (2013) Ciceri, S., Mancini, L., Southworth, J., Nikolov, N., Bozza, V., Bruni, I., Calchi Novati, S., D’Ago, G., & Henning, T., 2013. Simultaneous follow-up of planetary transits: revised physical properties for the planetary systems HAT-P-16 and WASP-21, A&A, 557, A30.
- Claret (2009) Claret, A., 2009. Does the HD 209458 planetary system pose a challenge to the stellar atmosphere models?, A&A, 506(3), 1335–1340.
- Clette (2021) Clette, F., 2021. Is the F10.7cm - Sunspot Number relation linear and stable?, Journal of Space Weather and Space Climate, 11, 2.
- Corsaro et al. (2013) Corsaro, E., Fröhlich, H. E., Bonanno, A., Huber, D., Bedding, T. R., Benomar, O., De Ridder, J., & Stello, D., 2013. A Bayesian approach to scaling relations for amplitudes of solar-like oscillations in Kepler stars, MNRAS, 430(3), 2313–2326.
- Cowan et al. (2009) Cowan, N. B., Agol, E., Meadows, V. S., Robinson, T., Livengood, T. A., Deming, D., Lisse, C. M., A’Hearn, M. F., Wellnitz, D. D., Seager, S., Charbonneau, D., & EPOXI Team, 2009. Alien Maps of an Ocean-bearing World, ApJ, 700(2), 915–923.
- Cowan et al. (2013) Cowan, N. B., Fuentes, P. A., & Haggard, H. M., 2013. Light curves of stars and exoplanets: estimating inclination, obliquity and albedo, MNRAS, 434(3), 2465–2479.
- Cracchiolo et al. (2021) Cracchiolo, G., Micela, G., & Peres, G., 2021. Correcting the effect of stellar spots on ARIEL transmission spectra, MNRAS, 501(2), 1733–1747.
- Cranmer et al. (2014) Cranmer, S. R., Bastien, F. A., Stassun, K. G., & Saar, S. H., 2014. Stellar Granulation as the Source of High-frequency Flicker in Kepler Light Curves, ApJ, 781(2), 124.
- Crida et al. (2018) Crida, A., Ligi, R., Dorn, C., & Lebreton, Y., 2018. Mass, Radius, and Composition of the Transiting Planet 55 Cnc e: Using Interferometry and Correlations, ApJ, 860(2), 122.
- Criscuoli (2019) Criscuoli, S., 2019. Effects of Continuum Fudging on Non-LTE Synthesis of Stellar Spectra. I. Effects on Estimates of UV Continua and Solar Spectral Irradiance Variability, ApJ, 872(1), 52.
- Criscuoli & Ermolli (2008) Criscuoli, S. & Ermolli, I., 2008. Stray-light restoration of full-disk CaII K solar observations: a case study, A&A, 484(2), 591–599.
- Criscuoli et al. (2017) Criscuoli, S., Norton, A., & Whitney, T., 2017. Photometric Properties of Network and Faculae Derived from HMI Data Compensated for Scattered Light, ApJ, 847(2), 93.
- Csizmadia et al. (2013) Csizmadia, S., Pasternacki, T., Dreyer, C., Cabrera, J., Erikson, A., & Rauer, H., 2013. The effect of stellar limb darkening values on the accuracy of the planet radii derived from photometric transit observations, A&A, 549, A9.
- Czesla et al. (2009) Czesla, S., Huber, K. F., Wolter, U., Schröter, S., & Schmitt, J. H. M. M., 2009. How stellar activity affects the size estimates of extrasolar planets, A&A, 505, 1277–1282.
- Dai & Winn (2017) Dai, F. & Winn, J. N., 2017. The Oblique Orbit of WASP-107b from K2 Photometry, AJ, 153(5), 205.
- Danielski et al. (2014) Danielski, C., Deroo, P., Waldmann, I. P., Hollis, M. D. J., Tinetti, G., & Swain, M. R., 2014. 0.94-2.42 m Ground-based Transmission Spectra of the Hot Jupiter HD-189733b, ApJ, 785(1), 35.
- Danielski et al. (2022) Danielski, C., Brucalassi, A., Benatti, S., Campante, T., Delgado-Mena, E., Rainer, M., Sacco, G., Adibekyan, V., Biazzo, K., Bossini, D., Bruno, G., Casali, G., Kabath, P., Magrini, L., Micela, G., Morello, G., Palladino, P., Sanna, N., Sarkar, S., Sousa, S., Tsantaki, M., Turrini, D., & Van der Swaelmen, M., 2022. The homogeneous characterisation of Ariel host stars, Experimental Astronomy, 53(2), 473–510.
- Danilovic et al. (2008) Danilovic, S., Gandorfer, A., Lagg, A., Schüssler, M., Solanki, S. K., Vögler, A., Katsukawa, Y., & Tsuneta, S., 2008. The intensity contrast of solar granulation: comparing Hinode SP results with MHD simulations, A&A, 484, L17–L20.
- Davenport (2015) Davenport, J., 2015. Spots and Flares: Stellar Activity in the Time Domain Era, Ph.D. thesis, University of Washington.
- Davenport (2016) Davenport, J. R. A., 2016. The Kepler Catalog of Stellar Flares, ApJ, 829, 23.
- de la Cruz Rodríguez et al. (2013) de la Cruz Rodríguez, J., Rouppe van der Voort, L., Socas-Navarro, H., & van Noort, M., 2013. Physical properties of a sunspot chromosphere with umbral flashes, A&A, 556, A115.
- De Pontieu et al. (2006) De Pontieu, B., Carlsson, M., Stein, R., Rouppe van der Voort, L., Löfdahl, M., van Noort, M., Nordlund, Å., & Scharmer, G., 2006. Rapid Temporal Variability of Faculae: High-Resolution Observations and Modeling, ApJ, 646, 1405–1420.
- De Pontieu et al. (2014) De Pontieu, B., Title, A. M., Lemen, J. R., Kushner, G. D., Akin, D. J., Allard, B., Berger, T., Boerner, P., Cheung, M., Chou, C., Drake, J. F., Duncan, D. W., Freeland, S., Heyman, G. F., Hoffman, C., Hurlburt, N. E., Lindgren, R. W., Mathur, D., Rehse, R., Sabolish, D., Seguin, R., Schrijver, C. J., Tarbell, T. D., Wülser, J. P., Wolfson, C. J., Yanari, C., Mudge, J., Nguyen-Phuc, N., Timmons, R., van Bezooijen, R., Weingrod, I., Brookner, R., Butcher, G., Dougherty, B., Eder, J., Knagenhjelm, V., Larsen, S., Mansir, D., Phan, L., Boyle, P., Cheimets, P. N., DeLuca, E. E., Golub, L., Gates, R., Hertz, E., McKillop, S., Park, S., Perry, T., Podgorski, W. A., Reeves, K., Saar, S., Testa, P., Tian, H., Weber, M., Dunn, C., Eccles, S., Jaeggli, S. A., Kankelborg, C. C., Mashburn, K., Pust, N., Springer, L., Carvalho, R., Kleint, L., Marmie, J., Mazmanian, E., Pereira, T. M. D., Sawyer, S., Strong, J., Worden, S. P., Carlsson, M., Hansteen, V. H., Leenaarts, J., Wiesmann, M., Aloise, J., Chu, K. C., Bush, R. I., Scherrer, P. H., Brekke, P., Martinez-Sykora, J., Lites, B. W., McIntosh, S. W., Uitenbroek, H., Okamoto, T. J., Gummin, M. A., Auker, G., Jerram, P., Pool, P., & Waltham, N., 2014. The Interface Region Imaging Spectrograph (IRIS), Sol. Phys., 289(7), 2733–2779.
- de Wijn et al. (2009) de Wijn, A. G., Stenflo, J. O., Solanki, S. K., & Tsuneta, S., 2009. Small-Scale Solar Magnetic Fields, Space Sci. Rev., 144(1-4), 275–315.
- Deeg et al. (2001) Deeg, H. J., Garrido, R., & Claret, A., 2001. Probing the stellar surface of HD 209458 from multicolor transit observations, New Astronomy, 6(2), 51–60.
- Delrez et al. (2018) Delrez, L., Gillon, M., Queloz, D., Demory, B.-O., Almleaky, Y., de Wit, J., Jehin, E., Triaud, A. H. M. J., Barkaoui, K., Burdanov, A., Burgasser, A. J., Ducrot, E., McCormac, J., Murray, C., Silva Fernandes, C., Sohy, S., Thompson, S. J., Van Grootel, V., Alonso, R., Benkhaldoun, Z., & Rebolo, R., 2018. SPECULOOS: a network of robotic telescopes to hunt for terrestrial planets around the nearest ultracool dwarfs, in Ground-based and Airborne Telescopes VII, vol. 10700 of Society of Photo-Optical Instrumentation Engineers (SPIE) Conference Series, p. 107001I.
- Delrez et al. (2022) Delrez, L., Murray, C. A., Pozuelos, F. J., Narita, N., Ducrot, E., Timmermans, M., Watanabe, N., Burgasser, A. J., Hirano, T., Rackham, B. V., Stassun, K. G., Van Grootel, V., Aganze, C., Cointepas, M., Howell, S., Kaltenegger, L., Niraula, P., Sebastian, D., Almenara, J. M., Barkaoui, K., Baycroft, T. A., Bonfils, X., Bouchy, F., Burdanov, A., Caldwell, D. A., Charbonneau, D., Ciardi, D. R., Collins, K. A., Daylan, T., Demory, B. O., de Wit, J., Dransfield, G., Fajardo-Acosta, S. B., Fausnaugh, M., Fukui, A., Furlan, E., Garcia, L. J., Gnilka, C. L., Gómez Maqueo Chew, Y., Gómez-Muñoz, M. A., Günther, M. N., Harakawa, H., Heng, K., Hooton, M. J., Hori, Y., Ikoma, M., Jehin, E., Jenkins, J. M., Kagetani, T., Kawauchi, K., Kimura, T., Kodama, T., Kotani, T., Krishnamurthy, V., Kudo, T., Kunovac, V., Kusakabe, N., Latham, D. W., Littlefield, C., McCormac, J., Melis, C., Mori, M., Murgas, F., Palle, E., Pedersen, P. P., Queloz, D., Ricker, G., Sabin, L., Schanche, N., Schroffenegger, U., Seager, S., Shiao, B., Sohy, S., Standing, M. R., Tamura, M., Theissen, C. A., Thompson, S. J., Triaud, A. H. M. J., Vanderspek, R., Vievard, S., Wells, R. D., Winn, J. N., Zou, Y., Zúñiga-Fernández, S., & Gillon, M., 2022. Two temperate super-Earths transiting a nearby late-type M dwarf, A&A, 667, A59.
- Deming et al. (2013) Deming, D., Wilkins, A., McCullough, P., Burrows, A., Fortney, J. J., Agol, E., Dobbs-Dixon, I., Madhusudhan, N., Crouzet, N., Desert, J.-M., Gilliland, R. L., Haynes, K., Knutson, H. A., Line, M., Magic, Z., Mandell, A. M., Ranjan, S., Charbonneau, D., Clampin, M., Seager, S., & Showman, A. P., 2013. Infrared Transmission Spectroscopy of the Exoplanets HD 209458b and XO-1b Using the Wide Field Camera-3 on the Hubble Space Telescope, ApJ, 774(2), 95.
- Desai & Giacalone (2016) Desai, M. & Giacalone, J., 2016. Large gradual solar energetic particle events, Living Reviews in Solar Physics, 13(1), 3.
- Désert et al. (2011a) Désert, J.-M., Charbonneau, D., Demory, B.-O., Ballard, S., Carter, J. A., Fortney, J. J., Cochran, W. D., Endl, M., Quinn, S. N., Isaacson, H. T., Fressin, F., Buchhave, L. A., Latham, D. W., Knutson, H. A., Bryson, S. T., Torres, G., Rowe, J. F., Batalha, N. M., Borucki, W. J., Brown, T. M., Caldwell, D. A., Christiansen, J. L., Deming, D., Fabrycky, D. C., Ford, E. B., Gilliland, R. L., Gillon, M., Haas, M. R., Jenkins, J. M., Kinemuchi, K., Koch, D., Lissauer, J. J., Lucas, P., Mullally, F., MacQueen, P. J., Marcy, G. W., Sasselov, D. D., Seager, S., Still, M., Tenenbaum, P., Uddin, K., & Winn, J. N., 2011a. The Hot-Jupiter Kepler-17b: Discovery, Obliquity from Stroboscopic Starspots, and Atmospheric Characterization, ApJS, 197, 14.
- Désert et al. (2011b) Désert, J. M., Sing, D., Vidal-Madjar, A., Hébrard, G., Ehrenreich, D., Lecavelier Des Etangs, A., Parmentier, V., Ferlet, R., & Henry, G. W., 2011b. Transit spectrophotometry of the exoplanet HD 189733b. II. New Spitzer observations at 3.6 m, A&A, 526, A12.
- Deutsch (1958) Deutsch, A. J., 1958. Harmonic Analysis of the Periodic Spectrum Variables, in Electromagnetic Phenomena in Cosmical Physics, vol. 6, p. 209.
- Di Folco et al. (2004) Di Folco, E., Thévenin, F., Kervella, P., Domiciano de Souza, A., Coudé du Foresto, V., Ségransan, D., & Morel, P., 2004. VLTI near-IR interferometric observations of Vega-like stars. Radius and age of PsA, Leo, Pic, Eri and Cet, A&A, 426, 601–617.
- Donati (1999) Donati, J. F., 1999. Magnetic cycles of HR 1099 and LQ Hydrae, MNRAS, 302(3), 457–481.
- Donati & Collier Cameron (1997) Donati, J. F. & Collier Cameron, A., 1997. Differential rotation and magnetic polarity patterns on AB Doradus, MNRAS, 291(1), 1–19.
- Donati & Landstreet (2009) Donati, J. F. & Landstreet, J. D., 2009. Magnetic Fields of Nondegenerate Stars, ARA&A, 47(1), 333–370.
- Donati et al. (1997) Donati, J.-F., Semel, M., Carter, B. D., Rees, D. E., & Collier Cameron, A., 1997. Spectropolarimetric observations of active stars, MNRAS, 291, 658.
- Dorren (1987) Dorren, J. D., 1987. A New Formulation of the Starspot Model, and the Consequences of Starspot Structure, ApJ, 320, 756.
- Doyle et al. (2018) Doyle, L., Ramsay, G., Doyle, J. G., Wu, K., & Scullion, E., 2018. Investigating the rotational phase of stellar flares on M dwarfs using K2 short cadence data, MNRAS, 480(2), 2153–2164.
- Dravins & Nordlund (1990a) Dravins, D. & Nordlund, Å., 1990a. Stellar Granulation - Part Four - Line Formation in Inhomogeneous Stellar Photospheres, A&A, 228, 184.
- Dravins & Nordlund (1990b) Dravins, D. & Nordlund, Å., 1990b. Stellar Granulation - Part Five - Synthetic Spectral Lines in Disk Integrated Starlight, A&A, 228, 203.
- Ducrot et al. (2020) Ducrot, E., Gillon, M., Delrez, L., Agol, E., Rimmer, P., Turbet, M., Günther, M. N., Demory, B. O., Triaud, A. H. M. J., Bolmont, E., Burgasser, A., Carey, S. J., Ingalls, J. G., Jehin, E., Leconte, J., Lederer, S. M., Queloz, D., Raymond, S. N., Selsis, F., Van Grootel, V., & de Wit, J., 2020. TRAPPIST-1: Global results of the Spitzer Exploration Science Program Red Worlds, A&A, 640, A112.
- Dukes (1992) Dukes, Robert J., J., 1992. Results from the Four College APT., in Robotic Telescopes in the 1990s, vol. 103 of Astronomical Society of the Pacific Conference Series, pp. 9–18.
- Dunn & Zirker (1973) Dunn, R. B. & Zirker, J. B., 1973. The Solar Filigree, Sol. Phys., 33(2), 281–304.
- Engvold et al. (2019) Engvold, O., Vial, J.-C., & Skumanich, A., 2019. The Sun as a Guide to Stellar Physics.
- Ermolli et al. (1998) Ermolli, I., Fofi, M., Bernacchia, C., Berrilli, F., Caccin, B., Egidi, A., & Florio, A., 1998. The Prototype Rise-Pspt Instrument Operating in Rome, Sol. Phys., 177, 1–10.
- Ermolli et al. (2007) Ermolli, I., Criscuoli, S., Centrone, M., Giorgi, F., & Penza, V., 2007. Photometric properties of facular features over the activity cycle, A&A, 465(1), 305–314.
- Ermolli et al. (2010) Ermolli, I., Criscuoli, S., Uitenbroek, H., Giorgi, F., Rast, M. P., & Solanki, S. K., 2010. Radiative emission of solar features in the Ca II K line: comparison of measurements and models, A&A, 523, A55.
- Ermolli et al. (2013) Ermolli, I., Matthes, K., Dudok de Wit, T., Krivova, N. A., Tourpali, K., Weber, M., Unruh, Y. C., Gray, L., Langematz, U., Pilewskie, P., Rozanov, E., Schmutz, W., Shapiro, A., Solanki, S. K., & Woods, T. N., 2013. Recent variability of the solar spectral irradiance and its impact on climate modelling, Atmospheric Chemistry & Physics, 13(8), 3945–3977.
- Espinoza & Jordán (2015) Espinoza, N. & Jordán, A., 2015. Limb darkening and exoplanets: testing stellar model atmospheres and identifying biases in transit parameters, MNRAS, 450(2), 1879–1899.
- Espinoza et al. (2019) Espinoza, N., Rackham, B. V., Jordán, A., Apai, D., López-Morales, M., Osip, D. J., Grimm, S. L., Hoeijmakers, J., Wilson, P. A., Bixel, A., McGruder, C., Rodler, F., Weaver, I., Lewis, N. K., Fortney, J. J., & Fraine, J., 2019. ACCESS: a featureless optical transmission spectrum for WASP-19b from Magellan/IMACS, MNRAS, 482(2), 2065–2087.
- Faria et al. (2016) Faria, J. P., Haywood, R. D., Brewer, B. J., Figueira, P., Oshagh, M., Santerne, A., & Santos, N. C., 2016. Uncovering the planets and stellar activity of CoRoT-7 using only radial velocities, A&A, 588, A31.
- Faurobert et al. (2020) Faurobert, M., Criscuoli, S., Carbillet, M., & Contursi, G., 2020. A new spectroscopic method for measuring the temperature gradient in the solar photosphere. Generalized application in magnetized regions, A&A, 642, A186.
- Faurobert-Scholl (1993) Faurobert-Scholl, M., 1993. Investigation of microturbulent magnetic fields in the solar photosphere by their Hanle effect in the Sr I 4607 angstroms line., A&A, 268, 765–774.
- Feinstein et al. (2019) Feinstein, A. D., Montet, B. T., Foreman-Mackey, D., Bedell, M. E., Saunders, N., Bean, J. L., Christiansen, J. L., Hedges, C., Luger, R., Scolnic, D., & Cardoso, J. V. d. M., 2019. eleanor: An Open-source Tool for Extracting Light Curves from the TESS Full-frame Images, PASP, 131(1003), 094502.
- Feinstein et al. (2020) Feinstein, A. D., Montet, B. T., Ansdell, M., Nord, B., Bean, J. L., Günther, M. N., Gully-Santiago, M. A., & Schlieder, J. E., 2020. Flare Statistics for Young Stars from a Convolutional Neural Network Analysis of TESS Data, AJ, 160(5), 219.
- Feller et al. (2020) Feller, A., Gandorfer, A., Iglesias, F. A., Lagg, A., Riethmüller, T. L., Solanki, S. K., Katsukawa, Y., & Kubo, M., 2020. The SUNRISE UV Spectropolarimeter and imager for SUNRISE III, in Society of Photo-Optical Instrumentation Engineers (SPIE) Conference Series, vol. 11447 of Society of Photo-Optical Instrumentation Engineers (SPIE) Conference Series, p. 11447AK.
- Findeisen et al. (2011) Findeisen, K., Hillenbrand, L., & Soderblom, D., 2011. Stellar Activity in the Broadband Ultraviolet, AJ, 142(1), 23.
- Fligge et al. (2000) Fligge, M., Solanki, S. K., & Unruh, Y. C., 2000. Modelling irradiance variations from the surface distribution of the solar magnetic field, A&A, 353, 380–388.
- Fontenla et al. (1999) Fontenla, J., White, O. R., Fox, P. A., Avrett, E. H., & Kurucz, R. L., 1999. Calculation of Solar Irradiances. I. Synthesis of the Solar Spectrum, ApJ, 518(1), 480–499.
- Fontenla et al. (1993) Fontenla, J. M., Avrett, E. H., & Loeser, R., 1993. Energy Balance in the Solar Transition Region. III. Helium Emission in Hydrostatic, Constant-Abundance Models with Diffusion, ApJ, 406, 319.
- Fontenla et al. (2002) Fontenla, J. M., Avrett, E. H., & Loeser, R., 2002. Energy Balance in the Solar Transition Region. IV. Hydrogen and Helium Mass Flows with Diffusion, ApJ, 572(1), 636–662.
- Fontenla et al. (2006) Fontenla, J. M., Avrett, E., Thuillier, G., & Harder, J., 2006. Semiempirical Models of the Solar Atmosphere. I. The Quiet- and Active Sun Photosphere at Moderate Resolution, ApJ, 639(1), 441–458.
- Fontenla et al. (2009) Fontenla, J. M., Curdt, W., Haberreiter, M., Harder, J., & Tian, H., 2009. Semiempirical Models of the Solar Atmosphere. III. Set of Non-LTE Models for Far-Ultraviolet/Extreme-Ultraviolet Irradiance Computation, ApJ, 707(1), 482–502.
- Fossati et al. (2015) Fossati, L., Ingrassia, S., & Lanza, A. F., 2015. A Bimodal Correlation between Host Star Chromospheric Emission and the Surface Gravity of Hot Jupiters, ApJ, 812(2), L35.
- Fraine et al. (2014) Fraine, J., Deming, D., Benneke, B., Knutson, H., Jordán, A., Espinoza, N., Madhusudhan, N., Wilkins, A., & Todorov, K., 2014. Water vapour absorption in the clear atmosphere of a Neptune-sized exoplanet, Nature, 513(7519), 526–529.
- France et al. (2016) France, K., Loyd, R. O. P., Youngblood, A., Brown, A., Schneider, P. C., Hawley, S. L., Froning, C. S., Linsky, J. L., Roberge, A., Buccino, A. P., Davenport, J. R. A., Fontenla, J. M., Kaltenegger, L., Kowalski, A. F., Mauas, P. J. D., Miguel, Y., Redfield, S., Rugheimer, S., Tian, F., Vieytes, M. C., Walkowicz, L. M., & Weisenburger, K. L., 2016. The MUSCLES Treasury Survey. I. Motivation and Overview, ApJ, 820(2), 89.
- Freytag et al. (2002) Freytag, B., Steffen, M., & Dorch, B., 2002. Spots on the surface of Betelgeuse – Results from new 3D stellar convection models, Astronomische Nachrichten, 323, 213–219.
- Freytag et al. (2012) Freytag, B., Steffen, M., Ludwig, H. G., Wedemeyer-Böhm, S., Schaffenberger, W., & Steiner, O., 2012. Simulations of stellar convection with CO5BOLD, Journal of Computational Physics, 231(3), 919–959.
- Frohlich et al. (1997) Frohlich, C., Andersen, B. N., Appourchaux, T., Berthomieu, G., Crommelynck, D. A., Domingo, V., Fichot, A., Finsterle, W., Gomez, M. F., Gough, D., Jimenez, A., Leifsen, T., Lombaerts, M., Pap, J. M., Provost, J., Roca Cortes, T., Romero, J., Roth, H., Sekii, T., Telljohann, U., Toutain, T., & Wehrli, C., 1997. First Results from VIRGO, the Experiment for Helioseismology and Solar Irradiance Monitoring on SOHO, Sol. Phys., 170(1), 1–25.
- Fuhrmeister et al. (2022) Fuhrmeister, B., Czesla, S., Nagel, E., Reiners, A., Schmitt, J. H. M. M., Jeffers, S. V., Caballero, J. A., Shulyak, D., Johnson, E. N., Zechmeister, M., Montes, D., López-Gallifa, Á., Ribas, I., Quirrenbach, A., Amado, P. J., Galadí-Enríquez, D., Hatzes, A. P., Kürster, M., Danielski, C., Béjar, V. J. S., Kaminski, A., Morales, J. C., & Zapatero Osorio, M. R., 2022. The CARMENES search for exoplanets around M dwarfs. Diagnostic capabilities of strong K I lines for photosphere and chromosphere, A&A, 657, A125.
- Gaidos et al. (2023) Gaidos, E., Claytor, Z., Dungee, R., Ali, A., & Feiden, G. A., 2023. The TIME Table: Rotation and ages of cool exoplanet host stars, MNRAS.
- Gan et al. (2022a) Gan, T., Lin, Z., Wang, S. X., Mao, S., Fouqué, P., Fan, J., Bedell, M., Stassun, K. G., Giacalone, S., Fukui, A., Murgas, F., Ciardi, D. R., Howell, S. B., Collins, K. A., Shporer, A., Arnold, L., Barclay, T., Charbonneau, D., Christiansen, J., Crossfield, I. J. M., Dressing, C. D., Elliott, A., Esparza-Borges, E., Evans, P., Gnilka, C. L., Gonzales, E. J., Howard, A. W., Isogai, K., Kawauchi, K., Kurita, S., Liu, B., Livingston, J. H., Matson, R. A., Narita, N., Palle, E., Parviainen, H., Rackham, B. V., Rodriguez, D. R., Rose, M., Rudat, A., Schlieder, J. E., Scott, N. J., Vezie, M., Ricker, G. R., Vanderspek, R., Latham, D. W., Seager, S., Winn, J. N., & Jenkins, J. M., 2022a. TOI-530b: a giant planet transiting an M-dwarf detected by TESS, MNRAS, 511(1), 83–99.
- Gan et al. (2022b) Gan, T., Soubkiou, A., Wang, S. X., Benkhaldoun, Z., Mao, S., Artigau, É., Fouqué, P., Arnold, L., Giacalone, S., Theissen, C. A., Aganze, C., Burgasser, A., Collins, K. A., Shporer, A., Barkaoui, K., Ghachoui, M., Howell, S. B., Lamman, C., Demangeon, O. D. S., Burdanov, A., Cadieux, C., Chouqar, J., Collins, K. I., Cook, N. J., Delrez, L., Demory, B.-O., Doyon, R., Dransfield, G., Dressing, C. D., Ducrot, E., Fan, J., Garcia, L., Gill, H., Gillon, M., Gnilka, C. L., Gómez Maqueo Chew, Y., Günther, M. N., Henze, C. E., Huang, C. X., Jehin, E., Jensen, E. L. N., Lin, Z., Manset, N., McCormac, J., Murray, C. A., Niraula, P., Pedersen, P. P., Pozuelos, F. J., Queloz, D., Rackham, B. V., Savel, A. B., Schanche, N., Schwarz, R. P., Sebastian, D., Thompson, S., Timmermans, M., Triaud, A. H. M. J., Vezie, M., Wells, R. D., de Wit, J., Ricker, G. R., Vanderspek, R., Latham, D. W., Seager, S., Winn, J. N., & Jenkins, J. M., 2022b. TESS discovery of a sub-Neptune orbiting a mid-M dwarf TOI-2136, MNRAS, 514(3), 4120–4139.
- Garcia et al. (2016) Garcia, E. V., Muterspaugh, M. W., van Belle, G., Monnier, J. D., Stassun, K. G., Ghasempour, A., Clark, J. H., Zavala, R. T., Benson, J. A., Hutter, D. J., Schmitt, H. R., Baines, E. K., Jorgensen, A. M., Strosahl, S. G., Sanborn, J., Zawicki, S. J., Sakosky, M. F., & Swihart, S., 2016. Vision: A Six-telescope Fiber-fed Visible Light Beam Combiner for the Navy Precision Optical Interferometer, PASP, 128(963), 055004.
- Gaudi et al. (2020) Gaudi, B. S., Seager, S., Mennesson, B., Kiessling, A., Warfield, K., Cahoy, K., Clarke, J. T., Domagal-Goldman, S., Feinberg, L., Guyon, O., Kasdin, J., Mawet, D., Plavchan, P., Robinson, T., Rogers, L., Scowen, P., Somerville, R., Stapelfeldt, K., Stark, C., Stern, D., Turnbull, M., Amini, R., Kuan, G., Martin, S., Morgan, R., Redding, D., Stahl, H. P., Webb, R., Alvarez-Salazar, O., Arnold, W. L., Arya, M., Balasubramanian, B., Baysinger, M., Bell, R., Below, C., Benson, J., Blais, L., Booth, J., Bourgeois, R., Bradford, C., Brewer, A., Brooks, T., Cady, E., Caldwell, M., Calvet, R., Carr, S., Chan, D., Cormarkovic, V., Coste, K., Cox, C., Danner, R., Davis, J., Dewell, L., Dorsett, L., Dunn, D., East, M., Effinger, M., Eng, R., Freebury, G., Garcia, J., Gaskin, J., Greene, S., Hennessy, J., Hilgemann, E., Hood, B., Holota, W., Howe, S., Huang, P., Hull, T., Hunt, R., Hurd, K., Johnson, S., Kissil, A., Knight, B., Kolenz, D., Kraus, O., Krist, J., Li, M., Lisman, D., Mandic, M., Mann, J., Marchen, L., Marrese-Reading, C., McCready, J., McGown, J., Missun, J., Miyaguchi, A., Moore, B., Nemati, B., Nikzad, S., Nissen, J., Novicki, M., Perrine, T., Pineda, C., Polanco, O., Putnam, D., Qureshi, A., Richards, M., Eldorado Riggs, A. J., Rodgers, M., Rud, M., Saini, N., Scalisi, D., Scharf, D., Schulz, K., Serabyn, G., Sigrist, N., Sikkia, G., Singleton, A., Shaklan, S., Smith, S., Southerd, B., Stahl, M., Steeves, J., Sturges, B., Sullivan, C., Tang, H., Taras, N., Tesch, J., Therrell, M., Tseng, H., Valente, M., Van Buren, D., Villalvazo, J., Warwick, S., Webb, D., Westerhoff, T., Wofford, R., Wu, G., Woo, J., Wood, M., Ziemer, J., Arney, G., Anderson, J., Maíz-Apellániz, J., Bartlett, J., Belikov, R., Bendek, E., Cenko, B., Douglas, E., Dulz, S., Evans, C., Faramaz, V., Feng, Y. K., Ferguson, H., Follette, K., Ford, S., García, M., Geha, M., Gelino, D., Götberg, Y., Hildebrandt, S., Hu, R., Jahnke, K., Kennedy, G., Kreidberg, L., Isella, A., Lopez, E., Marchis, F., Macri, L., Marley, M., Matzko, W., Mazoyer, J., McCandliss, S., Meshkat, T., Mordasini, C., Morris, P., Nielsen, E., Newman, P., Petigura, E., Postman, M., Reines, A., Roberge, A., Roederer, I., Ruane, G., Schwieterman, E., Sirbu, D., Spalding, C., Teplitz, H., Tumlinson, J., Turner, N., Werk, J., Wofford, A., Wyatt, M., Young, A., & Zellem, R., 2020. The Habitable Exoplanet Observatory (HabEx) Mission Concept Study Final Report, arXiv e-prints, p. arXiv:2001.06683.
- Gaulme et al. (2016) Gaulme, P., Rowe, J. F., Bedding, T. R., Benomar, O., Corsaro, E., Davies, G. R., Hale, S. J., Howe, R., Garcia, R. A., Huber, D., Jiménez, A., Mathur, S., Mosser, B., Appourchaux, T., Boumier, P., Jackiewicz, J., Leibacher, J., Schmider, F. X., Hammel, H. B., Lissauer, J. J., Marley, M. S., Simon, A. A., Chaplin, W. J., Elsworth, Y., Guzik, J. A., Murphy, N., & Silva Aguirre, V., 2016. A Distant Mirror: Solar Oscillations Observed on Neptune by the Kepler K2 Mission, ApJ, 833(1), L13.
- Ghosh et al. (2016) Ghosh, A., Chatterjee, S., Khan, A. R., Tripathi, D., Ramaprakash, A. N., Banerjee, D., Chordia, P., Gandorfer, A. M., Krivova, N., Nandy, D., Rajarshi, C., Solanki, S. K., & Sriram, S., 2016. The Solar Ultraviolet Imaging Telescope onboard Aditya-L1, in Space Telescopes and Instrumentation 2016: Ultraviolet to Gamma Ray, vol. 9905 of Society of Photo-Optical Instrumentation Engineers (SPIE) Conference Series, p. 990503.
- Gibbs et al. (2020) Gibbs, A., Bixel, A., Rackham, B. V., Apai, D., Schlecker, M., Espinoza, N., Mancini, L., Chen, W.-P., Henning, T., Gabor, P., Boyle, R., Perez Chavez, J., Mousseau, A., Dietrich, J., Jay Socia, Q., Ip, W., Ngeow, C.-C., Tsai, A.-L., Bhandare, A., Marian, V., Baehr, H., Brown, S., Häberle, M., Keppler, M., Molaverdikhani, K., & Sarkis, P., 2020. EDEN: Sensitivity Analysis and Transiting Planet Detection Limits for Nearby Late Red Dwarfs, AJ, 159(4), 169.
- Giles et al. (2017) Giles, H. A. C., Collier Cameron, A., & Haywood, R. D., 2017. A Kepler study of starspot lifetimes with respect to light-curve amplitude and spectral type, MNRAS, 472(2), 1618–1627.
- Gizis et al. (2015) Gizis, J. E., Dettman, K. G., Burgasser, A. J., Camnasio, S., Alam, M., Filippazzo, J. C., Cruz, K. L., Metchev, S., Berger, E., & Williams, P. K. G., 2015. Kepler Monitoring of an L Dwarf. II. Clouds with Multi-year Lifetimes, ApJ, 813(2), 104.
- Gnevyshev (1938) Gnevyshev, M. N., 1938. On the nature of solar activity, Izvestiya Glavnoj Astronomicheskoj Observatorii v Pulkove, 16, 36–45.
- Goode et al. (2010) Goode, P. R., Coulter, R., Gorceix, N., Yurchyshyn, V., & Cao, W., 2010. The NST: First results and some lessons for ATST and EST, Astronomische Nachrichten, 331(6), 620.
- Gravity Collaboration et al. (2017) Gravity Collaboration, Abuter, R., Accardo, M., Amorim, A., Anugu, N., Ávila, G., Azouaoui, N., Benisty, M., Berger, J. P., Blind, N., Bonnet, H., Bourget, P., Brandner, W., Brast, R., Buron, A., Burtscher, L., Cassaing, F., Chapron, F., Choquet, É., Clénet, Y., Collin, C., Coudé Du Foresto, V., de Wit, W., de Zeeuw, P. T., Deen, C., Delplancke-Ströbele, F., Dembet, R., Derie, F., Dexter, J., Duvert, G., Ebert, M., Eckart, A., Eisenhauer, F., Esselborn, M., Fédou, P., Finger, G., Garcia, P., Garcia Dabo, C. E., Garcia Lopez, R., Gendron, E., Genzel, R., Gillessen, S., Gonte, F., Gordo, P., Grould, M., Grözinger, U., Guieu, S., Haguenauer, P., Hans, O., Haubois, X., Haug, M., Haussmann, F., Henning, T., Hippler, S., Horrobin, M., Huber, A., Hubert, Z., Hubin, N., Hummel, C. A., Jakob, G., Janssen, A., Jochum, L., Jocou, L., Kaufer, A., Kellner, S., Kendrew, S., Kern, L., Kervella, P., Kiekebusch, M., Klein, R., Kok, Y., Kolb, J., Kulas, M., Lacour, S., Lapeyrère, V., Lazareff, B., Le Bouquin, J. B., Lèna, P., Lenzen, R., Lévêque, S., Lippa, M., Magnard, Y., Mehrgan, L., Mellein, M., Mérand, A., Moreno-Ventas, J., Moulin, T., Müller, E., Müller, F., Neumann, U., Oberti, S., Ott, T., Pallanca, L., Panduro, J., Pasquini, L., Paumard, T., Percheron, I., Perraut, K., Perrin, G., Pflüger, A., Pfuhl, O., Phan Duc, T., Plewa, P. M., Popovic, D., Rabien, S., Ramírez, A., Ramos, J., Rau, C., Riquelme, M., Rohloff, R. R., Rousset, G., Sanchez-Bermudez, J., Scheithauer, S., Schöller, M., Schuhler, N., Spyromilio, J., Straubmeier, C., Sturm, E., Suarez, M., Tristram, K. R. W., Ventura, N., Vincent, F., Waisberg, I., Wank, I., Weber, J., Wieprecht, E., Wiest, M., Wiezorrek, E., Wittkowski, M., Woillez, J., Wolff, B., Yazici, S., Ziegler, D., & Zins, G., 2017. First light for GRAVITY: Phase referencing optical interferometry for the Very Large Telescope Interferometer, A&A, 602, A94.
- Gray (2005) Gray, D. F., 2005. The Observation and Analysis of Stellar Photospheres, Cambridge University Press.
- Gray & Johanson (1991) Gray, D. F. & Johanson, H. L., 1991. Precise Measurement of Stellar Temperatures Using Line-Depth Ratios, PASP, 103, 439.
- Greene et al. (2016) Greene, T. P., Line, M. R., Montero, C., Fortney, J. J., Lustig-Yaeger, J., & Luther, K., 2016. Characterizing Transiting Exoplanet Atmospheres with JWST, ApJ, 817(1), 17.
- Grindlay et al. (2009) Grindlay, J., Tang, S., Simcoe, R., Laycock, S., Los, E., Mink, D., Doane, A., & Champine, G., 2009. DASCH to Measure (and preserve) the Harvard Plates: Opening the 100-year Time Domain Astronomy Window, in Preserving Astronomy’s Photographic Legacy: Current State and the Future of North American Astronomical Plates, vol. 410 of Astronomical Society of the Pacific Conference Series, p. 101.
- Grindlay et al. (2012) Grindlay, J., Tang, S., Los, E., & Servillat, M., 2012. Opening the 100-Year Window for Time-Domain Astronomy, in New Horizons in Time Domain Astronomy, vol. 285, pp. 29–34.
- Gudiksen et al. (2011) Gudiksen, B. V., Carlsson, M., Hansteen, V. H., Hayek, W., Leenaarts, J., & Martínez-Sykora, J., 2011. The stellar atmosphere simulation code Bifrost. Code description and validation, A&A, 531, A154.
- Gully-Santiago et al. (2017) Gully-Santiago, M. A., Herczeg, G. J., Czekala, I., Somers, G., Grankin, K., Covey, K. R., Donati, J. F., Alencar, S. H. P., Hussain, G. A. J., Shappee, B. J., Mace, G. N., Lee, J.-J., Holoien, T. W. S., Jose, J., & Liu, C.-F., 2017. Placing the Spotted T Tauri Star LkCa 4 on an HR Diagram, ApJ, 836(2), 200.
- Günther et al. (2020) Günther, M. N., Zhan, Z., Seager, S., Rimmer, P. B., Ranjan, S., Stassun, K. G., Oelkers, R. J., Daylan, T., Newton, E., Kristiansen, M. H., Olah, K., Gillen, E., Rappaport, S., Ricker, G. R., Vanderspek, R. K., Latham, D. W., Winn, J. N., Jenkins, J. M., Glidden, A., Fausnaugh, M., Levine, A. M., Dittmann, J. A., Quinn, S. N., Krishnamurthy, A., & Ting, E. B., 2020. Stellar Flares from the First TESS Data Release: Exploring a New Sample of M Dwarfs, AJ, 159(2), 60.
- Hale (1908) Hale, G. E., 1908. On the Probable Existence of a Magnetic Field in Sun-Spots, ApJ, 28, 315.
- Hall & Henry (1994) Hall, D. S. & Henry, G. W., 1994. The Law of Starspot Lifetimes, International Amateur-Professional Photoelectric Photometry Communications, 55, 51.
- Hall et al. (2021) Hall, O. J., Davies, G. R., van Saders, J., Nielsen, M. B., Lund, M. N., Chaplin, W. J., García, R. A., Amard, L., Breimann, A. A., Khan, S., See, V., & Tayar, J., 2021. Weakened magnetic braking supported by asteroseismic rotation rates of Kepler dwarfs, Nature Astronomy.
- Hamann et al. (2019) Hamann, A., Montet, B. T., Fabrycky, D. C., Agol, E., & Kruse, E., 2019. K2-146: Discovery of Planet c, Precise Masses from Transit Timing, and Observed Precession, AJ, 158(3), 133.
- Harvey & Livingston (1969) Harvey, J. & Livingston, W., 1969. Magnetograph Measurements with Temperature-Sensitive Lines, Sol. Phys., 10(2), 283–293.
- Hathaway (2015) Hathaway, D. H., 2015. The Solar Cycle, Living Reviews in Solar Physics, 12(1), 4.
- Hawley & Pettersen (1991) Hawley, S. L. & Pettersen, B. R., 1991. The Great Flare of 1985 April 12 on AD Leonis, ApJ, 378, 725.
- Hawley et al. (2014) Hawley, S. L., Davenport, J. R. A., Kowalski, A. F., Wisniewski, J. P., Hebb, L., Deitrick, R., & Hilton, E. J., 2014. Kepler Flares. I. Active and Inactive M Dwarfs, ApJ, 797(2), 121.
- Haywood et al. (2014) Haywood, R. D., Collier Cameron, A., Queloz, D., Barros, S. C. C., Deleuil, M., Fares, R., Gillon, M., Lanza, A. F., Lovis, C., Moutou, C., Pepe, F., Pollacco, D., Santerne, A., Ségransan, D., & Unruh, Y. C., 2014. Planets and stellar activity: hide and seek in the CoRoT-7 system, MNRAS, 443, 2517–2531.
- Hedges et al. (2021) Hedges, C., Luger, R., Dotson, J., Foreman-Mackey, D., & Barentsen, G., 2021. Multiwavelength Photometry Derived from Monochromatic Kepler Data, AJ, 161(2), 95.
- Hellier et al. (2015) Hellier, C., Anderson, D. R., Collier Cameron, A., Delrez, L., Gillon, M., Jehin, E., Lendl, M., Maxted, P. F. L., Pepe, F., Pollacco, D., Queloz, D., Ségransan, D., Smalley, B., Smith, A. M. S., Southworth, J., Triaud, A. H. M. J., Turner, O. D., Udry, S., & West, R. G., 2015. Three WASP-South Transiting Exoplanets: WASP-74b, WASP-83b, and WASP-89b, AJ, 150(1), 18.
- Henriques et al. (2020) Henriques, V. M. J., Nelson, C. J., Rouppe van der Voort, L. H. M., & Mathioudakis, M., 2020. Umbral chromospheric fine structure and umbral flashes modelled as one: The corrugated umbra, A&A, 642, A215.
- Henry et al. (2000) Henry, G. W., Marcy, G. W., Butler, R. P., & Vogt, S. S., 2000. A Transiting “51 Peg-like” Planet, ApJ, 529, L41–L44.
- Henry et al. (1996) Henry, T. J., Soderblom, D. R., Donahue, R. A., & Baliunas, S. L., 1996. A Survey of Ca II H and K Chromospheric Emission in Southern Solar-Type Stars, AJ, 111, 439.
- Herbst et al. (2021) Herbst, K., Papaioannou, A., Airapetian, V. S., & Atri, D., 2021. From Starspots to Stellar Coronal Mass Ejections—Revisiting Empirical Stellar Relations, ApJ, 907(2), 89.
- Herrero et al. (2016) Herrero, E., Ribas, I., Jordi, C., Morales, J. C., Perger, M., & Rosich, A., 2016. Modelling the photosphere of active stars for planet detection and characterization, A&A, 586, A131.
- Hirzberger & Wiehr (2005) Hirzberger, J. & Wiehr, E., 2005. Solar limb faculae, A&A, 438(3), 1059–1065.
- Hirzberger et al. (2010) Hirzberger, J., Feller, A., Riethmüller, T. L., Schüssler, M., Borrero, J. M., Afram, N., Unruh, Y. C., Berdyugina, S. V., Gandorfer, A., Solanki, S. K., Barthol, P., Bonet, J. A., Martínez Pillet, V., Berkefeld, T., Knölker, M., Schmidt, W., & Title, A. M., 2010. Quiet-sun Intensity Contrasts in the Near-ultraviolet as Measured from SUNRISE, ApJ, 723(2), L154–L158.
- Holczer et al. (2016) Holczer, T., Mazeh, T., Nachmani, G., Jontof-Hutter, D., Ford, E. B., Fabrycky, D., Ragozzine, D., Kane, M., & Steffen, J. H., 2016. Transit Timing Observations from Kepler. IX. Catalog of the Full Long-cadence Data Set, ApJS, 225, 9.
- Houdek et al. (1999) Houdek, G., Balmforth, N. J., Christensen-Dalsgaard, J., & Gough, D. O., 1999. Amplitudes of stochastically excited oscillations in main-sequence stars, A&A, 351, 582–596.
- Howard et al. (2020) Howard, W. S., Corbett, H., Law, N. M., Ratzloff, J. K., Galliher, N., Glazier, A. L., Gonzalez, R., Vasquez Soto, A., Fors, O., del Ser, D., & Haislip, J., 2020. EvryFlare. III. Temperature Evolution and Habitability Impacts of Dozens of Superflares Observed Simultaneously by Evryscope and TESS, ApJ, 902(2), 115.
- Huber et al. (2011) Huber, D., Bedding, T. R., Stello, D., Hekker, S., Mathur, S., Mosser, B., Verner, G. A., Bonanno, A., Buzasi, D. L., Campante, T. L., Elsworth, Y. P., Hale, S. J., Kallinger, T., Silva Aguirre, V., Chaplin, W. J., De Ridder, J., García, R. A., Appourchaux, T., Frandsen, S., Houdek, G., Molenda-Żakowicz, J., Monteiro, M. J. P. F. G., Christensen-Dalsgaard, J., Gilliland, R. L., Kawaler, S. D., Kjeldsen, H., Broomhall, A. M., Corsaro, E., Salabert, D., Sanderfer, D. T., Seader, S. E., & Smith, J. C., 2011. Testing Scaling Relations for Solar-like Oscillations from the Main Sequence to Red Giants Using Kepler Data, ApJ, 743(2), 143.
- Huenemoerder et al. (1989) Huenemoerder, D. P., Ramsey, L. W., & Buzasi, D. L., 1989. Titanium Oxide Variations in II Pegasi, AJ, 98, 2264.
- Hussain (2002) Hussain, G. A. J., 2002. Starspot lifetimes, Astronomische Nachrichten, 323, 349–356.
- Husser et al. (2013) Husser, T. O., Wende-von Berg, S., Dreizler, S., Homeier, D., Reiners, A., Barman, T., & Hauschildt, P. H., 2013. A new extensive library of PHOENIX stellar atmospheres and synthetic spectra, A&A, 553, A6.
- Iyer & Line (2020) Iyer, A. R. & Line, M. R., 2020. The Influence of Stellar Contamination on the Interpretation of Near-infrared Transmission Spectra of Sub-Neptune Worlds around M-dwarfs, ApJ, 889(2), 78.
- Iyer et al. (2023) Iyer, A. R., Line, M. R., Muirhead, P. S., Fortney, J. J., & Gharib-Nezhad, E., 2023. The SPHINX M-dwarf Spectral Grid. I. Benchmarking New Model Atmospheres to Derive Fundamental M-dwarf Properties, ApJ, 944(1), 41.
- Järvinen et al. (2005a) Järvinen, S. P., Berdyugina, S. V., & Strassmeier, K. G., 2005a. Spots on EK Draconis. Active longitudes and cycles from long-term photometry, A&A, 440(2), 735–741.
- Järvinen et al. (2005b) Järvinen, S. P., Berdyugina, S. V., Tuominen, I., Cutispoto, G., & Bos, M., 2005b. Magnetic activity in the young solar analog AB Dor. Active longitudes and cycles from long-term photometry., A&A, 432(2), 657–664.
- Järvinen et al. (2008) Järvinen, S. P., Korhonen, H., Berdyugina, S. V., Ilyin, I., Strassmeier, K. G., Weber, M., Savanov, I., & Tuominen, I., 2008. Magnetic activity on V889 Herculis. Combining photometry and spectroscopy, A&A, 488(3), 1047–1055.
- Järvinen et al. (2018) Järvinen, S. P., Strassmeier, K. G., Carroll, T. A., Ilyin, I., & Weber, M., 2018. Mapping EK Draconis with PEPSI. Possible evidence for starspot penumbrae, A&A, 620, A162.
- Jeffers et al. (2007) Jeffers, S. V., Donati, J. F., & Collier Cameron, A., 2007. Magnetic activity on AB Doradus: temporal evolution of star-spots and differential rotation from 1988 to 1994, MNRAS, 375(2), 567–583.
- Johnson et al. (2021) Johnson, L. J., Norris, C. M., Unruh, Y. C., Solanki, S. K., Krivova, N., Witzke, V., & Shapiro, A. I., 2021. Forward modelling of Kepler-band variability due to faculae and spots, MNRAS, 504(4), 4751–4767.
- Jordán et al. (2013) Jordán, A., Espinoza, N., Rabus, M., Eyheramendy, S., Sing, D. K., Désert, J.-M., Bakos, G. Á., Fortney, J. J., López-Morales, M., Maxted, P. F. L., Triaud, A. H. M. J., & Szentgyorgyi, A., 2013. A Ground-based Optical Transmission Spectrum of WASP-6b, ApJ, 778(2), 184.
- Juvan et al. (2018) Juvan, I. G., Lendl, M., Cubillos, P. E., Fossati, L., Tregloan-Reed, J., Lammer, H., Guenther, E. W., & Hanslmeier, A., 2018. PyTranSpot: A tool for multiband light curve modeling of planetary transits and stellar spots, A&A, 610, A15.
- Kahil et al. (2017) Kahil, F., Riethmüller, T. L., & Solanki, S. K., 2017. Brightness of Solar Magnetic Elements As a Function of Magnetic Flux at High Spatial Resolution, ApJS, 229(1), 12.
- Kallinger et al. (2014) Kallinger, T., De Ridder, J., Hekker, S., Mathur, S., Mosser, B., Gruberbauer, M., García, R. A., Karoff, C., & Ballot, J., 2014. The connection between stellar granulation and oscillation as seen by the Kepler mission, A&A, 570, A41.
- Karoff et al. (2018) Karoff, C., Metcalfe, T. S., Santos, Â. R. G., Montet, B. T., Isaacson, H., Witzke, V., Shapiro, A. I., Mathur, S., Davies, G. R., Lund, M. N., Garcia, R. A., Brun, A. S., Salabert, D., Avelino, P. P., van Saders, J., Egeland, R., Cunha, M. S., Campante, T. L., Chaplin, W. J., Krivova, N., Solanki, S. K., Stritzinger, M., & Knudsen, M. F., 2018. The Influence of Metallicity on Stellar Differential Rotation and Magnetic Activity, ApJ, 852(1), 46.
- Katsukawa et al. (2007) Katsukawa, Y., Berger, T. E., Ichimoto, K., Lites, B. W., Nagata, S., Shimizu, T., Shine, R. A., Suematsu, Y., Tarbell, T. D., Title, A. M., & Tsuneta, S., 2007. Small-Scale Jetlike Features in Penumbral Chromospheres, Science, 318(5856), 1594.
- Keller et al. (2003) Keller, C. U., Harvey, J. W., & Giampapa, M. S., 2003. SOLIS: an innovative suite of synoptic instruments, in Innovative Telescopes and Instrumentation for Solar Astrophysics, vol. 4853 of Society of Photo-Optical Instrumentation Engineers (SPIE) Conference Series, pp. 194–204.
- Keller et al. (2004) Keller, C. U., Schüssler, M., Vögler, A., & Zakharov, V., 2004. On the Origin of Solar Faculae, ApJ, 607(1), L59–L62.
- Kervella & Fouqué (2008) Kervella, P. & Fouqué, P., 2008. The angular sizes of dwarf stars and subgiants. Non-linear surface brightness relations in BVR_cIc from interferometry, A&A, 491(3), 855–858.
- Kervella et al. (2004a) Kervella, P., Bersier, D., Mourard, D., Nardetto, N., Fouqué, P., & Coudé du Foresto, V., 2004a. Cepheid distances from infrared long-baseline interferometry. III. Calibration of the surface brightness-color relations, A&A, 428, 587–593.
- Kervella et al. (2004b) Kervella, P., Thévenin, F., Di Folco, E., & Ségransan, D., 2004b. The angular sizes of dwarf stars and subgiants. Surface brightness relations calibrated by interferometry, A&A, 426, 297–307.
- Keys et al. (2019) Keys, P. H., Reid, A., Mathioudakis, M., Shelyag, S., Henriques, V. M. J., Hewitt, R. L., Del Moro, D., Jafarzadeh, S., Jess, D. B., & Stangalini, M., 2019. The magnetic properties of photospheric magnetic bright points with high-resolution spectropolarimetry, MNRAS, 488(1), L53–L58.
- Kiepenheuer (1953) Kiepenheuer, K. O., 1953. Photoelectric Measurements of Solar Magnetic Fields., ApJ, 117, 447.
- Kiess et al. (2014) Kiess, C., Rezaei, R., & Schmidt, W., 2014. Properties of sunspot umbrae observed in cycle 24, A&A, 565, A52.
- Kilcik et al. (2020) Kilcik, A., Sarp, V., Yurchyshyn, V., Rozelot, J.-P., & Ozguc, A., 2020. Physical Characteristics of Umbral Dots Derived from a High-Resolution Observations, Sol. Phys., 295(4), 58.
- Kilpatrick et al. (2020) Kilpatrick, B. M., Kataria, T., Lewis, N. K., Zellem, R. T., Henry, G. W., Cowan, N. B., de Wit, J., Fortney, J. J., Knutson, H., Seager, S., Showman, A. P., & Tucker, G. S., 2020. Evaluating Climate Variability of the Canonical Hot-Jupiters HD 189733b and HD 209458b through Multi-epoch Eclipse Observations, AJ, 159(2), 51.
- Kiraga & Stepien (2007) Kiraga, M. & Stepien, K., 2007. Age-Rotation-Activity Relations for M Dwarf Stars, Acta Astron., 57, 149–172.
- Kirk et al. (2016) Kirk, J., Wheatley, P. J., Louden, T., Littlefair, S. P., Copperwheat, C. M., Armstrong, D. J., Marsh, T. R., & Dhillon, V. S., 2016. Transmission spectroscopy of the inflated exoplanet WASP-52b, and evidence for a bright region on the stellar surface, MNRAS, 463(3), 2922–2931.
- Kirk et al. (2021) Kirk, J., Rackham, B., MacDonald, R., López-Morales, M., Espinoza, N., Lendl, M., Wilson, J., Osip, D. J., Wheatley, P. J., Skillen, I., Apai, D., Bixel, A., Gibson, N. P., Jordan, A., Lewis, N. K., Louden, T., McGruder, C. D., Nikolov, N., Rodler, F., & Weaver, I. C., 2021. ACCESS & LRG-BEASTS: a precise new optical transmission spectrum of the ultrahot Jupiter WASP-103b, arXiv e-prints, p. arXiv:2105.00012.
- Kitai (1986) Kitai, R., 1986. Photospheric and Chromospheric Umbral Dots in a Decaying Sunspot, Sol. Phys., 104(2), 287–301.
- Kitai & Muller (1984) Kitai, R. & Muller, R., 1984. On the Relation Between Chromospheric and Photospheric Fine Structure in an Active Region, Sol. Phys., 90(2), 303–314.
- Kjeldsen & Bedding (2011) Kjeldsen, H. & Bedding, T. R., 2011. Amplitudes of solar-like oscillations: a new scaling relation, A&A, 529, L8.
- Kleint et al. (2010) Kleint, L., Berdyugina, S. V., Shapiro, A. I., & Bianda, M., 2010. Solar turbulent magnetic fields: surprisingly homogeneous distribution during the solar minimum, A&A, 524, A37.
- Kleint et al. (2011) Kleint, L., Shapiro, A. I., Berdyugina, S. V., & Bianda, M., 2011. Solar turbulent magnetic fields: Non-LTE modeling of the Hanle effect in the C2 molecule, A&A, 536, A47.
- Knutson et al. (2011) Knutson, H. A., Madhusudhan, N., Cowan, N. B., Christiansen, J. L., Agol, E., Deming, D., Désert, J.-M., Charbonneau, D., Henry, G. W., Homeier, D., Langton, J., Laughlin, G., & Seager, S., 2011. A Spitzer Transmission Spectrum for the Exoplanet GJ 436b, Evidence for Stellar Variability, and Constraints on Dayside Flux Variations, ApJ, 735(1), 27.
- Knutson et al. (2012) Knutson, H. A., Lewis, N., Fortney, J. J., Burrows, A., Showman, A. P., Cowan, N. B., Agol, E., Aigrain, S., Charbonneau, D., Deming, D., Désert, J.-M., Henry, G. W., Langton, J., & Laughlin, G., 2012. 3.6 and 4.5 m Phase Curves and Evidence for Non-equilibrium Chemistry in the Atmosphere of Extrasolar Planet HD 189733b, ApJ, 754(1), 22.
- Kobel et al. (2011) Kobel, P., Solanki, S. K., & Borrero, J. M., 2011. The continuum intensity as a function of magnetic field. I. Active region and quiet Sun magnetic elements, A&A, 531, A112.
- Kochanek et al. (2017) Kochanek, C. S., Shappee, B. J., Stanek, K. Z., Holoien, T. W. S., Thompson, T. A., Prieto, J. L., Dong, S., Shields, J. V., Will, D., Britt, C., Perzanowski, D., & Pojmański, G., 2017. The All-Sky Automated Survey for Supernovae (ASAS-SN) Light Curve Server v1.0, PASP, 129(980), 104502.
- Kopp (2016) Kopp, G., 2016. Magnitudes and timescales of total solar irradiance variability, Journal of Space Weather and Space Climate, 6, A30.
- Kopp (2021) Kopp, G., 2021. Science Highlights and Final Updates from 17 Years of Total Solar Irradiance from the SOlar Radiation and Climate Experiment/Total Irradiance Monitor (SORCE/TIM), Solar Physics.
- Korhonen et al. (2021) Korhonen, H., Roettenbacher, R. M., Gu, S., Grundahl, F., Andersen, M. F., Henry, G. W., Jessen-Hansen, J., Antoci, V., & Pallé, P. L., 2021. Observing the changing surface structures of the active K giant Geminorum with SONG, A&A, 646, A6.
- Kostogryz & Berdyugina (2015) Kostogryz, N. M. & Berdyugina, S. V., 2015. Center-to-limb polarization in continuum spectra of F, G, K stars, A&A, 575, A89.
- Kostogryz et al. (2016) Kostogryz, N. M., Milic, I., Berdyugina, S. V., & Hauschildt, P. H., 2016. Center-to-limb variation of intensity and polarization in continuum spectra of FGK stars for spherical atmospheres, A&A, 586, A87.
- Kostogryz et al. (2017) Kostogryz, N. M., Yakobchuk, T. M., Berdyugina, S. V., & Milic, I., 2017. Polarimetry of transiting planets: Differences between plane-parallel and spherical host star atmosphere models, A&A, 601, A6.
- Kovári et al. (2007) Kovári, Z., Bartus, J., Strassmeier, K. G., Vida, K., Švanda, M., & Oláh, K., 2007. Anti-solar differential rotation on the active K-giant Geminorum, A&A, 474(1), 165–168.
- Kowalski et al. (2013) Kowalski, A. F., Hawley, S. L., Wisniewski, J. P., Osten, R. A., Hilton, E. J., Holtzman, J. A., Schmidt, S. J., & Davenport, J. R. A., 2013. Time-resolved Properties and Global Trends in dMe Flares from Simultaneous Photometry and Spectra, ApJS, 207(1), 15.
- Kreidberg et al. (2014) Kreidberg, L., Bean, J. L., Désert, J.-M., Benneke, B., Deming, D., Stevenson, K. B., Seager, S., Berta-Thompson, Z., Seifahrt, A., & Homeier, D., 2014. Clouds in the atmosphere of the super-Earth exoplanet GJ1214b, Nature, 505(7481), 69–72.
- Krivova et al. (2003) Krivova, N. A., Solanki, S. K., Fligge, M., & Unruh, Y. C., 2003. Reconstruction of solar irradiance variations in cycle 23: Is solar surface magnetism the cause?, A&A, 399, L1–L4.
- Kron (1947) Kron, G. E., 1947. The Probable Detecting of Surface Spots on AR Lacertae B, PASP, 59(350), 261.
- Kulow et al. (2014) Kulow, J. R., France, K., Linsky, J., & Loyd, R. O. P., 2014. Ly Transit Spectroscopy and the Neutral Hydrogen Tail of the Hot Neptune GJ 436b, ApJ, 786(2), 132.
- Kurucz (1992a) Kurucz, R. L., 1992a. Atomic and Molecular Data for Opacity Calculations, Rev. Mexicana Astron. Astrofis., 23, 45.
- Kurucz (1992b) Kurucz, R. L., 1992b. “Finding” the “missing” solar ultraviolet opacity., Rev. Mexicana Astron. Astrofis., 23, 181–186.
- Kurucz (1992c) Kurucz, R. L., 1992c. Remaining Line Opacity Problems for the Solar Spectrum, Rev. Mexicana Astron. Astrofis., 23, 187.
- Kuzmychov et al. (2017) Kuzmychov, O., Berdyugina, S. V., & Harrington, D. M., 2017. First Spectropolarimetric Measurement of a Brown Dwarf Magnetic Field in Molecular Bands, ApJ, 847(1), 60.
- Lam et al. (2020) Lam, K. W. F., Korth, J., Masuda, K., Csizmadia, S., Eigmüller, P., Stefánsson, G. K., Endl, M., Albrecht, S., Robertson, P., Luque, R., Livingston, J. H., Hirano, T., Sobrino, R. A., Barragán, O., Cabrera, J., Carleo, I., Chaushev, A., Cochran, W. D., Dai, F., Leon, J. d., Deeg, H. J., Erikson, A., Esposito, M., Fridlund, M., Fukui, A., Gandolfi, D., Georgieva, I., Cuesta, L. G., Grziwa, S., Guenther, E. W., Hatzes, A. P., Hidalgo, D., Hjorth, M., Kabath, P., Knudstrup, E., Lund, M. N., Mahadevan, S., Mathur, S., Rodríguez, P. M., Murgas, F., Narita, N., Nespral, D., Niraula, P., Palle, E., Pätzold, M., Persson, C. M., Prieto-Arranz, J., Rauer, H., Redfield, S., Ribas, I., Skarka, M., Smith, A. M. S., Subjak, J., & Van Eylen, V., 2020. It Takes Two Planets in Resonance to Tango around K2-146, AJ, 159(3), 120.
- Lammer et al. (2003) Lammer, H., Selsis, F., Ribas, I., Guinan, E. F., Bauer, S. J., & Weiss, W. W., 2003. Atmospheric Loss of Exoplanets Resulting from Stellar X-Ray and Extreme-Ultraviolet Heating, ApJ, 598(2), L121–L124.
- Langhans et al. (2004) Langhans, K., Schmidt, W., & Rimmele, T., 2004. Diagnostic spectroscopy of G-band brightenings in the photosphere of the sun, A&A, 423, 1147–1157.
- Lanza et al. (1998) Lanza, A. F., Catalano, S., Cutispoto, G., Pagano, I., & Rodono, M., 1998. Long-term starspot evolution, activity cycle and orbital period variation of AR Lacertae, A&A, 332, 541–560.
- Law et al. (2014) Law, N. M., Morton, T., Baranec, C., Riddle, R., Ravichandran, G., Ziegler, C., Johnson, J. A., Tendulkar, S. P., Bui, K., Burse, M. P., Das, H. K., Dekany, R. G., Kulkarni, S., Punnadi, S., & Ramaprakash, A. N., 2014. Robotic Laser Adaptive Optics Imaging of 715 Kepler Exoplanet Candidates Using Robo-AO, ApJ, 791(1), 35.
- Le Bouquin et al. (2011) Le Bouquin, J. B., Berger, J. P., Lazareff, B., Zins, G., Haguenauer, P., Jocou, L., Kern, P., Millan-Gabet, R., Traub, W., Absil, O., Augereau, J. C., Benisty, M., Blind, N., Bonfils, X., Bourget, P., Delboulbe, A., Feautrier, P., Germain, M., Gitton, P., Gillier, D., Kiekebusch, M., Kluska, J., Knudstrup, J., Labeye, P., Lizon, J. L., Monin, J. L., Magnard, Y., Malbet, F., Maurel, D., Ménard, F., Micallef, M., Michaud, L., Montagnier, G., Morel, S., Moulin, T., Perraut, K., Popovic, D., Rabou, P., Rochat, S., Rojas, C., Roussel, F., Roux, A., Stadler, E., Stefl, S., Tatulli, E., & Ventura, N., 2011. PIONIER: a 4-telescope visitor instrument at VLTI, A&A, 535, A67.
- Leenaarts & Wedemeyer-Böhm (2006) Leenaarts, J. & Wedemeyer-Böhm, S., 2006. Time-dependent hydrogen ionisation in 3D simulations of the solar chromosphere. Methods and first results, A&A, 460(1), 301–307.
- Leenaarts et al. (2007) Leenaarts, J., Carlsson, M., Hansteen, V., & Rutten, R. J., 2007. Non-equilibrium hydrogen ionization in 2D simulations of the solar atmosphere, A&A, 473(2), 625–632.
- Leenaarts et al. (2012) Leenaarts, J., Carlsson, M., & Rouppe van der Voort, L., 2012. The Formation of the H Line in the Solar Chromosphere, ApJ, 749(2), 136.
- Lightkurve Collaboration et al. (2018) Lightkurve Collaboration, Cardoso, J. V. d. M., Hedges, C., Gully-Santiago, M., Saunders, N., Cody, A. M., Barclay, T., Hall, O., Sagear, S., Turtelboom, E., Zhang, J., Tzanidakis, A., Mighell, K., Coughlin, J., Bell, K., Berta-Thompson, Z., Williams, P., Dotson, J., & Barentsen, G., 2018. Lightkurve: Kepler and TESS time series analysis in Python, Astrophysics Source Code Library.
- Linsky (2017) Linsky, J. L., 2017. Stellar Model Chromospheres and Spectroscopic Diagnostics, ARA&A, 55(1), 159–211.
- Lites et al. (2008) Lites, B. W., Kubo, M., Socas-Navarro, H., Berger, T., Frank, Z., Shine, R., Tarbell, T., Title, A., Ichimoto, K., Katsukawa, Y., Tsuneta, S., Suematsu, Y., Shimizu, T., & Nagata, S., 2008. The Horizontal Magnetic Flux of the Quiet-Sun Internetwork as Observed with the Hinode Spectro-Polarimeter, ApJ, 672(2), 1237–1253.
- Livingston & Harvey (1971) Livingston, W. & Harvey, J., 1971. The Kitt Peak Magnetograph. Iv: 40-CHANNEL Probe and the Detection of Weak Photospheric Fields, in Solar Magnetic Fields, vol. 43, p. 51.
- Livingston et al. (2006) Livingston, W., Harvey, J. W., Malanushenko, O. V., & Webster, L., 2006. Sunspots with the Strongest Magnetic Fields, Sol. Phys., 239(1-2), 41–68.
- Llama & Shkolnik (2015) Llama, J. & Shkolnik, E. L., 2015. Transiting the Sun: the Impact of Stellar Activity on X-Ray and Ultraviolet Transits, ApJ, 802(1), 41.
- Llama & Shkolnik (2016) Llama, J. & Shkolnik, E. L., 2016. Transiting the Sun. II. The Impact of Stellar Activity on Ly Transits, ApJ, 817(1), 81.
- Ludwig et al. (2009) Ludwig, H. G., Caffau, E., Steffen, M., Freytag, B., Bonifacio, P., & Kučinskas, A., 2009. The CIFIST 3D model atmosphere grid., Mem. Soc. Astron. Italiana, 80, 711.
- Luger et al. (2017) Luger, R., Sestovic, M., Kruse, E., Grimm, S. L., Demory, B.-O., Agol, E., Bolmont, E., Fabrycky, D., Fernandes, C. S., Van Grootel, V., Burgasser, A., Gillon, M., Ingalls, J. G., Jehin, E., Raymond, S. N., Selsis, F., Triaud, A. H. M. J., Barclay, T., Barentsen, G., Howell, S. B., Delrez, L., de Wit, J., Foreman-Mackey, D., Holdsworth, D. L., Leconte, J., Lederer, S., Turbet, M., Almleaky, Y., Benkhaldoun, Z., Magain, P., Morris, B. M., Heng, K., & Queloz, D., 2017. A seven-planet resonant chain in TRAPPIST-1, Nature Astronomy, 1, 0129.
- Luger et al. (2021a) Luger, R., Foreman-Mackey, D., & Hedges, C., 2021a. Mapping Stellar Surfaces. II. An Interpretable Gaussian Process Model for Light Curves, AJ, 162(3), 124.
- Luger et al. (2021b) Luger, R., Foreman-Mackey, D., Hedges, C., & Hogg, D. W., 2021b. Mapping stellar surfaces I: Degeneracies in the rotational light curve problem, arXiv e-prints, p. arXiv:2102.00007.
- Lupu et al. (2014) Lupu, R. E., Zahnle, K., Marley, M. S., Schaefer, L., Fegley, B., Morley, C., Cahoy, K., Freedman, R., & Fortney, J. J., 2014. The Atmospheres of Earthlike Planets after Giant Impact Events, ApJ, 784, 27.
- MacDonald (2023) MacDonald, R. J., 2023. POSEIDON: A Multidimensional Atmospheric Retrieval Code for Exoplanet Spectra, The Journal of Open Source Software, 8, 4873.
- MacDonald & Madhusudhan (2017) MacDonald, R. J. & Madhusudhan, N., 2017. HD 209458b in new light: evidence of nitrogen chemistry, patchy clouds and sub-solar water, MNRAS, 469(2), 1979–1996.
- Maciejewski et al. (2016) Maciejewski, G., Dimitrov, D., Fernández, M., Sota, A., Nowak, G., Ohlert, J., Nikolov, G., Bukowiecki, Ł., Hinse, T. C., Pallé, E., Tingley, B., Kjurkchieva, D., Lee, J. W., & Lee, C. U., 2016. Departure from the constant-period ephemeris for the transiting exoplanet WASP-12, A&A, 588, L6.
- Maehara et al. (2015) Maehara, H., Shibayama, T., Notsu, Y., Notsu, S., Honda, S., Nogami, D., & Shibata, K., 2015. Statistical properties of superflares on solar-type stars based on 1-min cadence data, Earth, Planets, and Space, 67, 59.
- Magic et al. (2013) Magic, Z., Collet, R., Asplund, M., Trampedach, R., Hayek, W., Chiavassa, A., Stein, R. F., & Nordlund, Å., 2013. The Stagger-grid: A grid of 3D stellar atmosphere models. I. Methods and general properties, A&A, 557, A26.
- Magrini et al. (2022) Magrini, L., Danielski, C., Bossini, D., Rainer, M., Turrini, D., Benatti, S., Brucalassi, A., Tsantaki, M., Delgado Mena, E., Sanna, N., Biazzo, K., Campante, T. L., Van der Swaelmen, M., Sousa, S. G., Hełminiak, K. G., Neitzel, A. W., Adibekyan, V., Bruno, G., & Casali, G., 2022. Ariel stellar characterisation. I. Homogeneous stellar parameters of 187 FGK planet host stars: Description and validation of the method, A&A, 663, A161.
- Mallonn & Strassmeier (2016) Mallonn, M. & Strassmeier, K. G., 2016. Transmission spectroscopy of HAT-P-32b with the LBT: confirmation of clouds/hazes in the planetary atmosphere, A&A, 590, A100.
- Mallonn et al. (2018) Mallonn, M., Herrero, E., Juvan, I. G., von Essen, C., Rosich, A., Ribas, I., Granzer, T., Alexoudi, X., & Strassmeier, K. G., 2018. GJ 1214: Rotation period, starspots, and uncertainty on the optical slope of the transmission spectrum, A&A, 614, A35.
- Mancini et al. (2013) Mancini, L., Ciceri, S., Chen, G., Tregloan-Reed, J., Fortney, J. J., Southworth, J., Tan, T. G., Burgdorf, M., Calchi Novati, S., Dominik, M., Fang, X.-S., Finet, F., Gerner, T., Hardis, S., Hinse, T. C., Jørgensen, U. G., Liebig, C., Nikolov, N., Ricci, D., Schäfer, S., Schönebeck, F., Skottfelt, J., Wertz, O., Alsubai, K. A., Bozza, V., Browne, P., Dodds, P., Gu, S.-H., Harpsøe, K., Henning, T., Hundertmark, M., Jessen-Hansen, J., Kains, N., Kerins, E., Kjeldsen, H., Lund, M. N., Lundkvist, M., Madhusudhan, N., Mathiasen, M., Penny, M. T., Prof, S., Rahvar, S., Sahu, K., Scarpetta, G., Snodgrass, C., & Surdej, J., 2013. Physical properties, transmission and emission spectra of the WASP-19 planetary system from multi-colour photometry, MNRAS, 436, 2–18.
- Mancini et al. (2014a) Mancini, L., Southworth, J., Ciceri, S., Calchi Novati, S., Dominik, M., Henning, T., Jørgensen, U. G., Korhonen, H., Nikolov, N., Alsubai, K. A., Bozza, V., Bramich, D. M., D’Ago, G., Figuera Jaimes, R., Galianni, P., Gu, S.-H., Harpsøe, K., Hinse, T. C., Hundertmark, M., Juncher, D., Kains, N., Popovas, A., Rabus, M., Rahvar, S., Skottfelt, J., Snodgrass, C., Street, R., Surdej, J., Tsapras, Y., Vilela, C., Wang, X.-B., & Wertz, O., 2014a. Physical properties of the WASP-67 planetary system from multi-colour photometry, A&A, 568, A127.
- Mancini et al. (2014b) Mancini, L., Southworth, J., Ciceri, S., Tregloan-Reed, J., Crossfield, I., Nikolov, N., Bruni, I., Zambelli, R., & Henning, T., 2014b. Physical properties, star-spot activity, orbital obliquity and transmission spectrum of the Qatar-2 planetary system from multicolour photometry, MNRAS, 443, 2391–2409.
- Mancini et al. (2015) Mancini, L., Esposito, M., Covino, E., Raia, G., Southworth, J., Tregloan-Reed, J., Biazzo, K., Bonomo, A. S., Desidera, S., Lanza, A. F., Maciejewski, G., Poretti, E., Sozzetti, A., Borsa, F., Bruni, I., Ciceri, S., Claudi, R., Cosentino, R., Gratton, R., Martinez Fiorenzano, A. F., Lodato, G., Lorenzi, V., Marzari, F., Murabito, S., Affer, L., Bignamini, A., Bedin, L. R., Boccato, C., Damasso, M., Henning, T., Maggio, A., Micela, G., Molinari, E., Pagano, I., Piotto, G., Rainer, M., Scandariato, G., Smareglia, R., & Zanmar Sanchez, R., 2015. The GAPS Programme with HARPS-N at TNG. VIII. Observations of the Rossiter-McLaughlin effect and characterisation of the transiting planetary systems HAT-P-36 and WASP-11/HAT-P-10, A&A, 579, A136.
- Mancini et al. (2016) Mancini, L., Lillo-Box, J., Southworth, J., Borsato, L., Gandolfi, D., Ciceri, S., Barrado, D., Brahm, R., & Henning, T., 2016. Kepler-539: A young extrasolar system with two giant planets on wide orbits and in gravitational interaction, A&A, 590, A112.
- Mancini et al. (2017) Mancini, L., Southworth, J., Raia, G., Tregloan-Reed, J., Mollière, P., Bozza, V., Bretton, M., Bruni, I., Ciceri, S., D’Ago, G., Dominik, M., Hinse, T. C., Hundertmark, M., Jørgensen, U. G., Korhonen, H., Rabus, M., Rahvar, S., Starkey, D., Calchi Novati, S., Figuera Jaimes, R., Henning, T., Juncher, D., Haugbølle, T., Kains, N., Popovas, A., Schmidt, R. W., Skottfelt, J., Snodgrass, C., Surdej, J., & Wertz, O., 2017. Orbital alignment and star-spot properties in the WASP-52 planetary system, MNRAS, 465, 843–857.
- Mandal et al. (2021) Mandal, S., Krivova, N. A., Cameron, R., & Solanki, S. K., 2021. On the size distribution of spots within sunspot groups, A&A, 652, A9.
- Mann et al. (2015) Mann, A. W., Feiden, G. A., Gaidos, E., Boyajian, T., & von Braun, K., 2015. How to Constrain Your M Dwarf: Measuring Effective Temperature, Bolometric Luminosity, Mass, and Radius, ApJ, 804(1), 64.
- Mansfield et al. (2018) Mansfield, M., Bean, J. L., Oklopčić, A., Kreidberg, L., Désert, J.-M., Kempton, E. M. R., Line, M. R., Fortney, J. J., Henry, G. W., Mallonn, M., Stevenson, K. B., Dragomir, D., Allart, R., & Bourrier, V., 2018. Detection of Helium in the Atmosphere of the Exo-Neptune HAT-P-11b, ApJ, 868(2), L34.
- Marchenko et al. (2019) Marchenko, S. V., Woods, T. N., DeLand, M. T., Mauceri, S., Pilewskie, P., & Haberreiter, M., 2019. Improved Aura/OMI Solar Spectral Irradiances: Comparisons With Independent Data Sets and Model Predictions, Earth and Space Science, 6(12), 2379–2396.
- Marfil et al. (2021) Marfil, E., Tabernero, H. M., Montes, D., Caballero, J. A., Lázaro, F. J., González Hernández, J. I., Nagel, E., Passegger, V. M., Schweitzer, A., Ribas, I., Reiners, A., Quirrenbach, A., Amado, P. J., Cifuentes, C., Cortés-Contreras, M., Dreizler, S., Duque-Arribas, C., Galadí-Enríquez, D., Henning, T., Jeffers, S. V., Kaminski, A., Kürster, M., Lafarga, M., López-Gallifa, Á., Morales, J. C., Shan, Y., & Zechmeister, M., 2021. The CARMENES search for exoplanets around M dwarfs. Stellar atmospheric parameters of target stars with SteParSyn, A&A, 656, A162.
- Martinez et al. (2021) Martinez, A. O., Baron, F. R., Monnier, J. D., Roettenbacher, R. M., & Parks, J. R., 2021. Dynamical Surface Imaging of Andromedae, ApJ, 916(1), 60.
- Mathew et al. (2007) Mathew, S. K., Martínez Pillet, V., Solanki, S. K., & Krivova, N. A., 2007. Properties of sunspots in cycle 23. I. Dependence of brightness on sunspot size and cycle phase, A&A, 465(1), 291–304.
- Mathur et al. (2011) Mathur, S., Hekker, S., Trampedach, R., Ballot, J., Kallinger, T., Buzasi, D., García, R. A., Huber, D., Jiménez, A., Mosser, B., Bedding, T. R., Elsworth, Y., Régulo, C., Stello, D., Chaplin, W. J., De Ridder, J., Hale, S. J., Kinemuchi, K., Kjeldsen, H., Mullally, F., & Thompson, S. E., 2011. Granulation in Red Giants: Observations by the Kepler Mission and Three-dimensional Convection Simulations, ApJ, 741(2), 119.
- Matthes et al. (2017) Matthes, K., Funke, B., Andersson, M. E., Barnard, L., Beer, J., Charbonneau, P., Clilverd, M. A., Dudok de Wit, T., Haberreiter, M., Hendry, A., Jackman, C. H., Kretzschmar, M., Kruschke, T., Kunze, M., Langematz, U., Marsh, D. R., Maycock, A. C., Misios, S., Rodger, C. J., Scaife, A. A., Seppälä, A., Shangguan, M., Sinnhuber, M., Tourpali, K., Usoskin, I., van de Kamp, M., Verronen, P. T., & Versick, S., 2017. Solar forcing for CMIP6 (v3.2), Geoscientific Model Development, 10(6), 2247–2302.
- Maxted (2016) Maxted, P. F. L., 2016. ellc: A fast, flexible light curve model for detached eclipsing binary stars and transiting exoplanets, A&A, 591, A111.
- Maxted (2018) Maxted, P. F. L., 2018. Comparison of the power-2 limb-darkening law from the STAGGER-grid to Kepler light curves of transiting exoplanets, A&A, 616, A39.
- Maxted et al. (2015) Maxted, P. F. L., Serenelli, A. M., & Southworth, J., 2015. Comparison of gyrochronological and isochronal age estimates for transiting exoplanet host stars, A&A, 577, A90.
- Mayfield & Lawrence (1985) Mayfield, E. B. & Lawrence, J. K., 1985. The Correlation of Solar Flare Production with Magnetic Energy in Active Regions, Sol. Phys., 96(2), 293–305.
- Mayorga et al. (2021) Mayorga, L. C., Lustig-Yaeger, J., May, E. M., Sotzen, K. S., Gonzalez-Quiles, J., Kilpatrick, B. M., Martin, E. C., Mandt, K., Stevenson, K. B., & Izenberg, N. R., 2021. Transmission Spectroscopy of the Earth-Sun System to Inform the Search for Extrasolar Life, \psj, 2(4), 140.
- McCullough et al. (2014) McCullough, P. R., Crouzet, N., Deming, D., & Madhusudhan, N., 2014. Water Vapor in the Spectrum of the Extrasolar Planet HD 189733b. I. The Transit, ApJ, 791(1), 55.
- Mehltretter (1974) Mehltretter, J. P., 1974. Observations of Photospheric Faculae at the Center of the Solar Disk, Sol. Phys., 38(1), 43–57.
- Metchev et al. (2015) Metchev, S. A., Heinze, A., Apai, D., Flateau, D., Radigan, J., Burgasser, A., Marley, M. S., Artigau, É., Plavchan, P., & Goldman, B., 2015. Weather on Other Worlds. II. Survey Results: Spots are Ubiquitous on L and T Dwarfs, ApJ, 799(2), 154.
- Michel et al. (2008) Michel, E., Baglin, A., Auvergne, M., Catala, C., Samadi, R., Baudin, F., Appourchaux, T., Barban, C., Weiss, W. W., Berthomieu, G., Boumier, P., Dupret, M.-A., Garcia, R. A., Fridlund, M., Garrido, R., Goupil, M.-J., Kjeldsen, H., Lebreton, Y., Mosser, B., Grotsch-Noels, A., Janot-Pacheco, E., Provost, J., Roxburgh, I. W., Thoul, A., Toutain, T., Tiphène, D., Turck-Chieze, S., Vauclair, S. D., Vauclair, G. P., Aerts, C., Alecian, G., Ballot, J., Charpinet, S., Hubert, A.-M., Lignières, F., Mathias, P., Monteiro, M. J. P. F. G., Neiner, C., Poretti, E., Renan de Medeiros, J., Ribas, I., Rieutord, M. L., Roca Cortés, T., & Zwintz, K., 2008. CoRoT Measures Solar-Like Oscillations and Granulation in Stars Hotter Than the Sun, Science, 322(5901), 558.
- Milbourne et al. (2021) Milbourne, T. W., Phillips, D. F., Langellier, N., Mortier, A., Haywood, R. D., Saar, S. H., Cegla, H. M., Collier Cameron, A., Dumusque, X., Latham, D. W., Malavolta, L., Maldonado, J., Thompson, S., Vanderburg, A., Watson, C. A., Buchhave, L. A., Cecconi, M., Cosentino, R., Ghedina, A., Gonzalez, M., Lodi, M., López-Morales, M., Sozzetti, A., & Walsworth, R. L., 2021. Estimating Magnetic Filling Factors From Simultaneous Spectroscopy and Photometry: Disentangling Spots, Plage, and Network, arXiv e-prints, p. arXiv:2105.09113.
- Miles-Páez et al. (2017) Miles-Páez, P. A., Metchev, S. A., Heinze, A., & Apai, D., 2017. Weather on Other Worlds. IV. H Emission and Photometric Variability Are Not Correlated in L0-T8 Dwarfs, ApJ, 840(2), 83.
- Millar-Blanchaer et al. (2020) Millar-Blanchaer, M. A., Girard, J. H., Karalidi, T., Marley, M. S., van Holstein, R. G., Sengupta, S., Mawet, D., Kataria, T., Snik, F., de Boer, J., Jensen-Clem, R., Vigan, A., & Hinkley, S., 2020. Detection of Polarization due to Cloud Bands in the Nearby Luhman 16 Brown Dwarf Binary, ApJ, 894(1), 42.
- Mirtorabi et al. (2003) Mirtorabi, M. T., Wasatonic, R., & Guinan, E. F., 2003. Wing Near-Infrared, TiO-Band, and V-Band Photometry of Chromospherically Active Star Andromedae, AJ, 125(6), 3265–3273.
- Miyakawa et al. (2021) Miyakawa, K., Hirano, T., Fukui, A., Mann, A. W., Gaidos, E., & Sato, B., 2021. Wavelength Dependence of Activity-induced Photometric Variations for Young Cool Stars in Hyades, AJ, 162(3), 104.
- Mohler-Fischer et al. (2013) Mohler-Fischer, M., Mancini, L., Hartman, J. D., Bakos, G. Á., Penev, K., Bayliss, D., Jordán, A., Csubry, Z., Zhou, G., Rabus, M., Nikolov, N., Brahm, R., Espinoza, N., Buchhave, L. A., Béky, B., Suc, V., Csák, B., Henning, T., Wright, D. J., Tinney, C. G., Addison, B. C., Schmidt, B., Noyes, R. W., Papp, I., Lázár, J., Sári, P., & Conroy, P., 2013. HATS-2b: A transiting extrasolar planet orbiting a K-type star showing starspot activity, A&A, 558, A55.
- Monnier et al. (2018) Monnier, J. D., Ireland, M., Kraus, S., Alonso-Herrero, A., Bonsor, A., Baron, F., Bayo, A., Berger, J.-P., Boyajian, T., Chiavassa, A., Ciardi, D., Creech-Eakman, M., de Wit, W.-J., Defrère, D., Dong, R., Duchêne, G., Espaillat, C., Gallenne, A., Gandhi, P., Gonzalez, J.-F., Haniff, C., Hoenig, S., Ilee, J., Isella, A., Jensen, E., Juhasz, A., Kane, S., Kishimoto, M., Kley, W., Kral, Q., Kratter, K., Labadie, L., Lacour, S., Laughlin, G., Le Bouquin, J.-B., Michael, E., Meru, F., Millan-Gabet, R., Millour, F., Minardi, S., Morbidelli, A., Mordasini, C., Morlok, A., Mozurkewich, D., Nelson, R., Olofsson, J., Oudmaijer, R., Packham, C., Paladini, C., Panic, O., Petrov, R., Pope, B., Pott, J.-U., Quiroga-Nunez, L. H., Ramos Almeida, C., Raymond, S. N., Regaly, Z., Reynolds, M., Ridgway, S., Rinehart, S., Schreiber, M., Smith, M., Stassun, K., Surdej, J., ten Brummelaar, T., Tristram, K., Turner, N., Tuthill, P., van Belle, G., Vasisht, G., Wallace, A., Weigelt, G., Wishnow, E., Wittkowski, M., Wolf, S., Young, J., Zhao, M., Zhu, Z., & Zúñiga-Fernández, S., 2018. Planet formation imager: project update, in Optical and Infrared Interferometry and Imaging VI, vol. 10701 of Society of Photo-Optical Instrumentation Engineers (SPIE) Conference Series, p. 1070118.
- Montalto et al. (2014) Montalto, M., Boué, G., Oshagh, M., Boisse, I., Bruno, G., & Santos, N. C., 2014. Improvements on analytic modelling of stellar spots, MNRAS, 444, 1721–1728.
- Montet et al. (2017) Montet, B. T., Tovar, G., & Foreman-Mackey, D., 2017. Long-term Photometric Variability in Kepler Full-frame Images: Magnetic Cycles of Sun-like Stars, ApJ, 851(2), 116.
- Morin et al. (2008) Morin, J., Donati, J. F., Forveille, T., Delfosse, X., Dobler, W., Petit, P., Jardine, M. M., Collier Cameron, A., Albert, L., Manset, N., Dintrans, B., Chabrier, G., & Valenti, J. A., 2008. The stable magnetic field of the fully convective star V374 Peg, MNRAS, 384(1), 77–86.
- Morley et al. (2017) Morley, C. V., Kreidberg, L., Rustamkulov, Z., Robinson, T., & Fortney, J. J., 2017. Observing the Atmospheres of Known Temperate Earth-sized Planets with JWST, ApJ, 850(2), 121.
- Morris et al. (2017) Morris, B. M., Hebb, L., Davenport, J. R. A., Rohn, G., & Hawley, S. L., 2017. The Starspots of HAT-P-11: Evidence for a Solar-like Dynamo, ApJ, 846, 99.
- Morris et al. (2018a) Morris, B. M., Agol, E., Davenport, J. R. A., & Hawley, S. L., 2018a. Possible Bright Starspots on TRAPPIST-1, ApJ, 857(1), 39.
- Morris et al. (2018b) Morris, B. M., Agol, E., Hebb, L., & Hawley, S. L., 2018b. Robust Transiting Exoplanet Radii in the Presence of Starspots from Ingress and Egress Durations, AJ, 156(3), 91.
- Morris et al. (2018c) Morris, B. M., Agol, E., Hebb, L., Hawley, S. L., Gillon, M., Ducrot, E., Delrez, L., Ingalls, J., & Demory, B.-O., 2018c. Non-detection of Contamination by Stellar Activity in the Spitzer Transit Light Curves of TRAPPIST-1, ApJ, 863(2), L32.
- Morris et al. (2018d) Morris, B. M., Curtis, J. L., Douglas, S. T., Hawley, S. L., Agüeros, M. A., Bobra, M. G., & Agol, E., 2018d. Are Starspots and Plages Co-located on Active G and K Stars?, AJ, 156(5), 203.
- Morris et al. (2018e) Morris, B. M., Hawley, S. L., & Hebb, L., 2018e. Large Starspot Groups on HAT-P-11 in Activity Cycle 1, Research Notes of the American Astronomical Society, 2(1), 26.
- Morris et al. (2020) Morris, B. M., Bobra, M. G., Agol, E., Lee, Y. J., & Hawley, S. L., 2020. The stellar variability noise floor for transiting exoplanet photometry with PLATO, MNRAS, 493(4), 5489–5498.
- Mosser et al. (2012) Mosser, B., Elsworth, Y., Hekker, S., Huber, D., Kallinger, T., Mathur, S., Belkacem, K., Goupil, M. J., Samadi, R., Barban, C., Bedding, T. R., Chaplin, W. J., García, R. A., Stello, D., De Ridder, J., Middour, C. K., Morris, R. L., & Quintana, E. V., 2012. Characterization of the power excess of solar-like oscillations in red giants with Kepler, A&A, 537, A30.
- Močnik et al. (2016) Močnik, T., Clark, B. J. M., Anderson, D. R., Hellier, C., & Brown, D. J. A., 2016. Starspots on WASP-85, AJ, 151(6), 150.
- Močnik et al. (2017a) Močnik, T., Hellier, C., Anderson, D. R., Clark, B. J. M., & Southworth, J., 2017a. Starspots on WASP-107 and pulsations of WASP-118, MNRAS, 469(2), 1622–1629.
- Močnik et al. (2017b) Močnik, T., Southworth, J., & Hellier, C., 2017b. Recurring sets of recurring starspot occultations on exoplanet host Qatar-2, MNRAS, 471(1), 394–403.
- Müller et al. (2020) Müller, D., St. Cyr, O. C., Zouganelis, I., Gilbert, H. R., Marsden, R., Nieves-Chinchilla, T., Antonucci, E., Auchère, F., Berghmans, D., Horbury, T. S., Howard, R. A., Krucker, S., Maksimovic, M., Owen, C. J., Rochus, P., Rodriguez-Pacheco, J., Romoli, M., Solanki, S. K., Bruno, R., Carlsson, M., Fludra, A., Harra, L., Hassler, D. M., Livi, S., Louarn, P., Peter, H., Schühle, U., Teriaca, L., del Toro Iniesta, J. C., Wimmer-Schweingruber, R. F., Marsch, E., Velli, M., De Groof, A., Walsh, A., & Williams, D., 2020. The Solar Orbiter mission. Science overview, A&A, 642, A1.
- Murgas et al. (2019) Murgas, F., Chen, G., Pallé, E., Nortmann, L., & Nowak, G., 2019. The GTC exoplanet transit spectroscopy survey. X. Stellar spots versus Rayleigh scattering: the case of HAT-P-11b, A&A, 622, A172.
- Murray-Clay et al. (2009) Murray-Clay, R. A., Chiang, E. I., & Murray, N., 2009. Atmospheric Escape From Hot Jupiters, ApJ, 693(1), 23–42.
- Namekata et al. (2019) Namekata, K., Maehara, H., Notsu, Y., Toriumi, S., Hayakawa, H., Ikuta, K., Notsu, S., Honda, S., Nogami, D., & Shibata, K., 2019. Lifetimes and Emergence/Decay Rates of Star Spots on Solar-type Stars Estimated by Kepler Data in Comparison with Those of Sunspots, ApJ, 871(2), 187.
- Namekata et al. (2020) Namekata, K., Davenport, J. R. A., Morris, B. M., Hawley, S. L., Maehara, H., Notsu, Y., Toriumi, S., Ikuta, K., Notsu, S., Honda, S., Nogami, D., & Shibata, K., 2020. Temporal Evolution of Spatially Resolved Individual Star Spots on a Planet-hosting Solar-type Star: Kepler-17, ApJ, 891(2), 103.
- Narukage et al. (2016) Narukage, N., McKenzie, D. E., Ishikawa, R., Trujillo-Bueno, J., De Pontieu, B., Kubo, M., Ishikawa, S.-n., Kano, R., Suematsu, Y., Yoshida, M., Rachmeler, L. A., Kobayashi, K., Cirtain, J. W., Winebarger, A. R., Asensio Ramos, A., del Pino Aleman, T., Štępán, J., Belluzzi, L., Larruquert, J. I., Auchère, F., Leenaarts, J., & Carlsson, M. J. L., 2016. Chromospheric LAyer SpectroPolarimeter (CLASP2), in Space Telescopes and Instrumentation 2016: Ultraviolet to Gamma Ray, vol. 9905 of Society of Photo-Optical Instrumentation Engineers (SPIE) Conference Series, p. 990508.
- Nascimbeni et al. (2015) Nascimbeni, V., Mallonn, M., Scandariato, G., Pagano, I., Piotto, G., Micela, G., Messina, S., Leto, G., Strassmeier, K. G., Bisogni, S., & Speziali, R., 2015. Large Binocular Telescope view of the atmosphere of GJ1214b, A&A, 579, A113.
- Neckel & Labs (1994) Neckel, H. & Labs, D., 1994. Solar Limb Darkening 1986-1990 Lambda 303-NANOMETERS to 1099-NANOMETERS, Sol. Phys., 153(1-2), 91–114.
- Neff et al. (1995) Neff, J. E., O’Neal, D., & Saar, S. H., 1995. Absolute Measurements of Starspot Area and Temperature: II Pegasi in 1989 October, ApJ, 452, 879.
- Nèmec et al. (2022) Nèmec, N. E., Shapiro, A. I., Işık, E., Sowmya, K., Solanki, S. K., Krivova, N. A., Cameron, R. H., & Gizon, L., 2022. Faculae Cancel out on the Surfaces of Active Suns, ApJ, 934(2), L23.
- Netto & Valio (2020) Netto, Y. & Valio, A., 2020. Stellar magnetic activity and the butterfly diagram of Kepler-63, A&A, 635, A78.
- Neveu-VanMalle et al. (2016) Neveu-VanMalle, M., Queloz, D., Anderson, D. R., Brown, D. J. A., Collier Cameron, A., Delrez, L., Díaz, R. F., Gillon, M., Hellier, C., Jehin, E., Lister, T., Pepe, F., Rojo, P., Ségransan, D., Triaud, A. H. M. J., Turner, O. D., & Udry, S., 2016. Hot Jupiters with relatives: discovery of additional planets in orbit around WASP-41 and WASP-47, A&A, 586, A93.
- Newman et al. (2022) Newman, P. D., Plavchan, P., Burt, J. A., Teske, J., Mamajek, E. E., Leifer, . S., Gaudi, B. S., Blackwood, G., & Morgan, R., 2022. Simulations for Planning Next-Generation Exoplanet Radial Velocity Surveys, arXiv e-prints, p. arXiv:2204.13968.
- Newton et al. (2016) Newton, E. R., Irwin, J., Charbonneau, D., Berta-Thompson, Z. K., Dittmann, J. A., & West, A. A., 2016. The Rotation and Galactic Kinematics of Mid M Dwarfs in the Solar Neighborhood, ApJ, 821(2), 93.
- Newton et al. (2017) Newton, E. R., Irwin, J., Charbonneau, D., Berlind, P., Calkins, M. L., & Mink, J., 2017. The H Emission of Nearby M Dwarfs and its Relation to Stellar Rotation, ApJ, 834(1), 85.
- Newton et al. (2018) Newton, E. R., Mondrik, N., Irwin, J., Winters, J. G., & Charbonneau, D., 2018. New Rotation Period Measurements for M Dwarfs in the Southern Hemisphere: An Abundance of Slowly Rotating, Fully Convective Stars, AJ, 156(5), 217.
- Nichols-Fleming & Blackman (2020) Nichols-Fleming, F. & Blackman, E. G., 2020. Determination of the star-spot covering fraction as a function of stellar age from observational data, MNRAS, 491(2), 2706–2714.
- Nikolov et al. (2015) Nikolov, N., Sing, D. K., Burrows, A. S., Fortney, J. J., Henry, G. W., Pont, F., Ballester, G. E., Aigrain, S., Wilson, P. A., Huitson, C. M., Gibson, N. P., Désert, J. M., Lecavelier Des Etangs, A., Showman, A. P., Vidal-Madjar, A., Wakeford, H. R., & Zahnle, K., 2015. HST hot-Jupiter transmission spectral survey: haze in the atmosphere of WASP-6b, MNRAS, 447(1), 463–478.
- Nikolov et al. (2016) Nikolov, N., Sing, D. K., Gibson, N. P., Fortney, J. J., Evans, T. M., Barstow, J. K., Kataria, T., & Wilson, P. A., 2016. VLT FORS2 Comparative Transmission Spectroscopy: Detection of Na in the Atmosphere of WASP-39b from the Ground, ApJ, 832(2), 191.
- Nordgren et al. (1999) Nordgren, T. E., Germain, M. E., Benson, J. A., Mozurkewich, D., Sudol, J. J., Elias, N. M., I., Hajian, A. R., White, N. M., Hutter, D. J., Johnston, K. J., Gauss, F. S., Armstrong, J. T., Pauls, T. A., & Rickard, L. J., 1999. Stellar Angular Diameters of Late-Type Giants and Supergiants Measured with the Navy Prototype Optical Interferometer, AJ, 118(6), 3032–3038.
- Nordlund (1982) Nordlund, A., 1982. Numerical simulations of the solar granulation. I. Basic equations and methods., A&A, 107, 1–10.
- Nordlund (1984) Nordlund, A., 1984. Modelling of Small-Scale Dynamical Processes: Convection and Wave Generation (Keynote), in Small-Scale Dynamical Processes in Quiet Stellar Atmospheres, p. 181.
- Nordlund (1985) Nordlund, A., 1985. Solar Convection, Sol. Phys., 100, 209.
- Nordlund & Dravins (1990) Nordlund, A. & Dravins, D., 1990. Stellar granulation. III. Hydrodynamic model atmospheres., A&A, 228, 155–183.
- Nordlund et al. (2009) Nordlund, Å., Stein, R. F., & Asplund, M., 2009. Solar Surface Convection, Living Reviews in Solar Physics, 6(1), 2.
- Norris (2018) Norris, C. M., 2018. Spectral variability in cool main-sequence stars due to small-scale magnetic features, Ph.D. thesis, Imperial College London.
- Norris et al. (2017) Norris, C. M., Beeck, B., Unruh, Y. C., Solanki, S. K., Krivova, N. A., & Yeo, K. L., 2017. Spectral variability of photospheric radiation due to faculae. I. The Sun and Sun-like stars, A&A, 605, A45.
- Notsu et al. (2013) Notsu, Y., Shibayama, T., Maehara, H., Notsu, S., Nagao, T., Honda, S., Ishii, T. T., Nogami, D., & Shibata, K., 2013. Superflares on Solar-type Stars Observed with Kepler II. Photometric Variability of Superflare-generating Stars: A Signature of Stellar Rotation and Starspots, ApJ, 771(2), 127.
- Notsu et al. (2019) Notsu, Y., Maehara, H., Honda, S., Hawley, S. L., Davenport, J. R. A., Namekata, K., Notsu, S., Ikuta, K., Nogami, D., & Shibata, K., 2019. Do Kepler Superflare Stars Really Include Slowly Rotating Sun-like Stars?—Results Using APO 3.5 m Telescope Spectroscopic Observations and Gaia-DR2 Data, ApJ, 876(1), 58.
- Noyes et al. (1984) Noyes, R. W., Hartmann, L. W., Baliunas, S. L., Duncan, D. K., & Vaughan, A. H., 1984. Rotation, convection, and magnetic activity in lower main-sequence stars, ApJ, 279, 763–777.
- Nutzman & Charbonneau (2008) Nutzman, P. & Charbonneau, D., 2008. Design Considerations for a Ground-Based Transit Search for Habitable Planets Orbiting M Dwarfs, PASP, 120(865), 317.
- Okamoto et al. (2021) Okamoto, S., Notsu, Y., Maehara, H., Namekata, K., Honda, S., Ikuta, K., Nogami, D., & Shibata, K., 2021. Statistical Properties of Superflares on Solar-type Stars: Results Using All of the Kepler Primary Mission Data, ApJ, 906(2), 72.
- Okamoto & Sakurai (2018) Okamoto, T. J. & Sakurai, T., 2018. Super-strong Magnetic Field in Sunspots, ApJ, 852(1), L16.
- Oláh et al. (2009) Oláh, K., Kolláth, Z., Granzer, T., Strassmeier, K. G., Lanza, A. F., Järvinen, S., Korhonen, H., Baliunas, S. L., Soon, W., Messina, S., & Cutispoto, G., 2009. Multiple and changing cycles of active stars. II. Results, A&A, 501(2), 703–713.
- Omodei et al. (2018) Omodei, N., Pesce-Rollins, M., Longo, F., Allafort, A., & Krucker, S., 2018. Fermi-LAT Observations of the 2017 September 10 Solar Flare, ApJ, 865(1), L7.
- O’Neal et al. (1998a) O’Neal, D., Saar, S. H., & Neff, J. E., 1998a. Spectroscopic Evidence for Nonuniform Starspot Properties on II Pegasi, ApJ, 501(1), L73–L76.
- O’Neal et al. (1998b) O’Neal, D., Saar, S. M., & Neff, J. E., 1998b. Spectroscopic Evidence for Nonuniform Starspot Properties on II Pegasi, ApJ, 501, L73.
- Ortiz et al. (2002) Ortiz, A., Solanki, S. K., Domingo, V., Fligge, M., & Sanahuja, B., 2002. On the intensity contrast of solar photospheric faculae and network elements, A&A, 388, 1036–1047.
- Osborn & Bayliss (2020) Osborn, A. & Bayliss, D., 2020. Investigating the planet-metallicity correlation for hot Jupiters, MNRAS, 491(3), 4481–4487.
- Oshagh et al. (2013a) Oshagh, M., Boisse, I., Boué, G., Montalto, M., Santos, N. C., Bonfils, X., & Haghighipour, N., 2013a. SOAP-T: a tool to study the light curve and radial velocity of a system with a transiting planet and a rotating spotted star, A&A, 549, A35.
- Oshagh et al. (2013b) Oshagh, M., Santos, N. C., Boisse, I., Boué, G., Montalto, M., Dumusque, X., & Haghighipour, N., 2013b. Effect of stellar spots on high-precision transit light-curve, A&A, 556, A19.
- Oshagh et al. (2014) Oshagh, M., Santos, N. C., Ehrenreich, D., Haghighipour, N., Figueira, P., Santerne, A., & Montalto, M., 2014. Impact of occultations of stellar active regions on transmission spectra. Can occultation of a plage mimic the signature of a blue sky?, A&A, 568, A99.
- Oshagh et al. (2015) Oshagh, M., Santos, N. C., Figueira, P., Adibekyan, V. Z., Santerne, A., Barros, S. C. C., & Lima, J. J. G., 2015. Polar stellar-spots and grazing planetary transits. Possible explanation for the low number of discovered grazing planets, A&A, 583, L1.
- Oshagh et al. (2016) Oshagh, M., Dreizler, S., Santos, N. C., Figueira, P., & Reiners, A., 2016. Can stellar activity make a planet seem misaligned?, A&A, 593, A25.
- Oshagh et al. (2017) Oshagh, M., Santos, N. C., Figueira, P., Barros, S. C. C., Donati, J. F., Adibekyan, V., Faria, J. P., Watson, C. A., Cegla, H. M., Dumusque, X., Hébrard, E., Demangeon, O., Dreizler, S., Boisse, I., Deleuil, M., Bonfils, X., Pepe, F., & Udry, S., 2017. Understanding stellar activity-induced radial velocity jitter using simultaneous K2 photometry and HARPS RV measurements, A&A, 606, A107.
- Oshagh et al. (2018) Oshagh, M., Triaud, A. H. M. J., Burdanov, A., Figueira, P., Reiners, A., Santos, N. C., Faria, J., Boue, G., Díaz, R. F., Dreizler, S., Boldt, S., Delrez, L., Ducrot, E., Gillon, M., Guzman Mesa, A., Jehin, E., Khalafinejad, S., Kohl, S., Serrano, L., & Udry, S., 2018. Activity induced variation in spin-orbit angles as derived from Rossiter-McLaughlin measurements, A&A, 619, A150.
- Owen & Jackson (2012) Owen, J. E. & Jackson, A. P., 2012. Planetary evaporation by UV & X-ray radiation: basic hydrodynamics, MNRAS, 425(4), 2931–2947.
- Owen & Wu (2013) Owen, J. E. & Wu, Y., 2013. Kepler Planets: A Tale of Evaporation, ApJ, 775(2), 105.
- Owen & Wu (2017) Owen, J. E. & Wu, Y., 2017. The Evaporation Valley in the Kepler Planets, ApJ, 847(1), 29.
- Pallavicini et al. (1981) Pallavicini, R., Golub, L., Rosner, R., Vaiana, G. S., Ayres, T., & Linsky, J. L., 1981. Relations among stellar X-ray emission observed from Einstein, stellar rotation and bolometric luminosity., ApJ, 248, 279–290.
- Panja et al. (2020) Panja, M., Cameron, R., & Solanki, S. K., 2020. 3D Radiative MHD Simulations of Starspots, ApJ, 893(2), 113.
- Pannetier et al. (2020) Pannetier, C., Mourard, D., Berio, P., Cassaing, F., Allouche, F., Anugu, N., Bailet, C., ten Brummelaar, T., Dejonghe, J., Gies, D., Jocou, L., Kraus, S., Lacour, S., Lagarde, S., Le Bouquin, J. B., Lecron, D., Monnier, J., Nardetto, N., Patru, F., Perraut, K., Petrov, R., Rousseau, S., Stee, P., Sturmann, J., & Sturmann, L., 2020. Progress of the CHARA/SPICA project, in Society of Photo-Optical Instrumentation Engineers (SPIE) Conference Series, vol. 11446 of Society of Photo-Optical Instrumentation Engineers (SPIE) Conference Series, p. 114460T.
- Parker (1955) Parker, E. N., 1955. Hydromagnetic Dynamo Models., ApJ, 122, 293.
- Parks et al. (2021) Parks, J. R., White, R. J., Baron, F., Monnier, J. D., Kloppenborg, B., Henry, G. W., Schaefer, G., Che, X., Pedretti, E., Thureau, N., Zhao, M., ten Brummelaar, T., McAlister, H., Ridgway, S. T., Turner, N., Sturmann, J., & Sturmann, L., 2021. Interferometric Imaging of Andromedae: Evidence of Starspots and Rotation, ApJ, 913(1), 54.
- Passegger et al. (2018) Passegger, V. M., Reiners, A., Jeffers, S. V., Wende-von Berg, S., Schöfer, P., Caballero, J. A., Schweitzer, A., Amado, P. J., Béjar, V. J. S., Cortés-Contreras, M., Hatzes, A. P., Kürster, M., Montes, D., Pedraz, S., Quirrenbach, A., Ribas, I., & Seifert, W., 2018. The CARMENES search for exoplanets around M dwarfs. Photospheric parameters of target stars from high-resolution spectroscopy, A&A, 615, A6.
- Patra et al. (2020) Patra, K. C., Winn, J. N., Holman, M. J., Gillon, M., Burdanov, A., Jehin, E., Delrez, L., Pozuelos, F. J., Barkaoui, K., Benkhaldoun, Z., Narita, N., Fukui, A., Kusakabe, N., Kawauchi, K., Terada, Y., Bouma, L. G., Weinberg, N. N., & Broome, M., 2020. The Continuing Search for Evidence of Tidal Orbital Decay of Hot Jupiters, AJ, 159(4), 150.
- Peck & Rast (2015) Peck, C. L. & Rast, M. P., 2015. Photometric Trends in the Visible Solar Continuum and Their Sensitivity to the Center-to-Limb Profile, ApJ, 808(2), 192.
- Penza et al. (2004) Penza, V., Caccin, B., & Del Moro, D., 2004. The sensitivity of the C I 538.0 nm Fe I 537.9 nm and Ti II 538.1 nm lines to solar active regions, A&A, 427, 345–351.
- Pepper et al. (2007) Pepper, J., Pogge, R. W., DePoy, D. L., Marshall, J. L., Stanek, K. Z., Stutz, A. M., Poindexter, S., Siverd, R., O’Brien, T. P., Trueblood, M., & Trueblood, P., 2007. The Kilodegree Extremely Little Telescope (KELT): A Small Robotic Telescope for Large-Area Synoptic Surveys, PASP, 119(858), 923–935.
- Petrie et al. (2021) Petrie, G., Criscuoli, S., & Bertello, L., 2021. Solar Magnetism and Radiation, in Solar Physics and Solar Wind, vol. 1, p. 83.
- Petrovay & van Driel-Gesztelyi (1997) Petrovay, K. & van Driel-Gesztelyi, L., 1997. Making Sense of Sunspot Decay. I. Parabolic Decay Law and Gnevyshev-Waldmeier Relation, Sol. Phys., 176(2), 249–266.
- Pinhas et al. (2018) Pinhas, A., Rackham, B. V., Madhusudhan, N., & Apai, D., 2018. Retrieval of planetary and stellar properties in transmission spectroscopy with AURA, MNRAS, 480(4), 5314–5331.
- Piskunov et al. (1990) Piskunov, N. E., Tuominen, I., & Vilhu, O., 1990. Surface imaging of late-type stars., A&A, 230, 363–370.
- Pollacco et al. (2006) Pollacco, D. L., Skillen, I., Collier Cameron, A., Christian, D. J., Hellier, C., Irwin, J., Lister, T. A., Street, R. A., West, R. G., Anderson, D. R., Clarkson, W. I., Deeg, H., Enoch, B., Evans, A., Fitzsimmons, A., Haswell, C. A., Hodgkin, S., Horne, K., Kane, S. R., Keenan, F. P., Maxted, P. F. L., Norton, A. J., Osborne, J., Parley, N. R., Ryans, R. S. I., Smalley, B., Wheatley, P. J., & Wilson, D. M., 2006. The WASP Project and the SuperWASP Cameras, PASP, 118(848), 1407–1418.
- Polyansky et al. (1997) Polyansky, O. L., Zobov, N. F., Viti, S., Tennyson, J., Bernath, P. F., & Wallace, L., 1997. K-Band Spectrum of Water in Sunspots, ApJ, 489, L205.
- Pont et al. (2008) Pont, F., Knutson, H., Gilliland, R. L., Moutou, C., & Charbonneau, D., 2008. Detection of atmospheric haze on an extrasolar planet: the 0.55-1.05 m transmission spectrum of HD 189733b with the HubbleSpaceTelescope, MNRAS, 385(1), 109–118.
- Pont et al. (2011) Pont, F., Aigrain, S., & Zucker, S., 2011. Reassessing the radial-velocity evidence for planets around CoRoT-7, MNRAS, 411, 1953–1962.
- Pont et al. (2013) Pont, F., Sing, D. K., Gibson, N. P., Aigrain, S., Henry, G., & Husnoo, N., 2013. The prevalence of dust on the exoplanet HD 189733b from Hubble and Spitzer observations, MNRAS, 432(4), 2917–2944.
- Prša & Zwitter (2005) Prša, A. & Zwitter, T., 2005. A Computational Guide to Physics of Eclipsing Binaries. I. Demonstrations and Perspectives, ApJ, 628, 426–438.
- Prša et al. (2016) Prša, A., Conroy, K. E., Horvat, M., Pablo, H., Kochoska, A., Bloemen, S., Giammarco, J., Hambleton, K. M., & Degroote, P., 2016. Physics Of Eclipsing Binaries. II. Toward the Increased Model Fidelity, ApJS, 227, 29.
- Quintana et al. (2021) Quintana, E. V., Colón, K. D., Mosby, G., Schlieder, J. E., Supsinskas, P., Karburn, J., Dotson, J. L., Greene, T. P., Hedges, C., Apai, D., Barclay, T., Christiansen, J. L., Espinoza, N., Mullally, S. E., Gilbert, E. A., Hoffman, K., Kostov, V. B., Lewis, N. K., Foote, T. O., Mason, J., Youngblood, A., Morris, B. M., Newton, E. R., Pepper, J., Rackham, B. V., Rowe, J. F., & Stevenson, K., 2021. The Pandora SmallSat: Multiwavelength Characterization of Exoplanets and their Host Stars, arXiv e-prints, p. arXiv:2108.06438.
- Rackham et al. (2017) Rackham, B., Espinoza, N., Apai, D., López-Morales, M., Jordán, A., Osip, D. J., Lewis, N. K., Rodler, F., Fraine, J. D., Morley, C. V., & Fortney, J. J., 2017. ACCESS I: An Optical Transmission Spectrum of GJ 1214b Reveals a Heterogeneous Stellar Photosphere, ApJ, 834(2), 151.
- Rackham et al. (2018) Rackham, B. V., Apai, D., & Giampapa, M. S., 2018. The Transit Light Source Effect: False Spectral Features and Incorrect Densities for M-dwarf Transiting Planets, ApJ, 853(2), 122.
- Rackham et al. (2019) Rackham, B. V., Apai, D., & Giampapa, M. S., 2019. The Transit Light Source Effect. II. The Impact of Stellar Heterogeneity on Transmission Spectra of Planets Orbiting Broadly Sun-like Stars, AJ, 157(3), 96.
- Rackham et al. (2022) Rackham, B. V., Espinoza, N., Berdyugina, S. V., Korhonen, H., MacDonald, R. J., Montet, B. T., Morris, B. M., Oshagh, M., Shapiro, A. I., Unruh, Y. C., Quintana, E. V., Zellem, R. T., Apai, D., Barclay, T., Barstow, J. K., Bruno, G., Carone, L., Casewell, S. L., Cegla, H. M., Criscuoli, S., Fischer, C., Fournier, D., Giampapa, M. S., Giles, H., Iyer, A., Kopp, G., Kostogryz, N. M., Krivova, N., Mallonn, M., McGruder, C., Molaverdikhani, K., Newton, E. R., Panja, M., Peacock, S., Reardon, K., Roettenbacher, R. M., Scandariato, G., Solanki, S., Stassun, K. G., Steiner, O., Stevenson, K. B., Tregloan-Reed, J., Valio, A., Wedemeyer, S., Welbanks, L., Yu, J., Alam, M. K., Davenport, J. R. A., Deming, D., Dong, C., Ducrot, E., Fisher, C., Gilbert, E., Kostov, V., López-Morales, M., Line, M., Močnik, T., Mullally, S., Paudel, R. R., Ribas, I., & Valenti, J. A., 2022. Final Report for SAG 21: The Effect of Stellar Contamination on Space-based Transmission Spectroscopy, arXiv e-prints, p. arXiv:2201.09905.
- Radick et al. (1998) Radick, R. R., Lockwood, G. W., Skiff, B. A., & Baliunas, S. L., 1998. Patterns of Variation among Sun-like Stars, ApJS, 118(1), 239–258.
- Radigan et al. (2012) Radigan, J., Jayawardhana, R., Lafrenière, D., Artigau, É., Marley, M., & Saumon, D., 2012. Large-amplitude Variations of an L/T Transition Brown Dwarf: Multi-wavelength Observations of Patchy, High-contrast Cloud Features, ApJ, 750(2), 105.
- Radigan et al. (2014) Radigan, J., Lafrenière, D., Jayawardhana, R., & Artigau, E., 2014. Strong Brightness Variations Signal Cloudy-to-clear Transition of Brown Dwarfs, ApJ, 793(2), 75.
- Ragozzine & Wolf (2009) Ragozzine, D. & Wolf, A. S., 2009. Probing the Interiors of very Hot Jupiters Using Transit Light Curves, ApJ, 698, 1778–1794.
- Rajpaul et al. (2015) Rajpaul, V., Aigrain, S., Osborne, M. A., Reece, S., & Roberts, S., 2015. A Gaussian process framework for modelling stellar activity signals in radial velocity data, MNRAS, 452, 2269–2291.
- Rast et al. (1999) Rast, M. P., Fox, P. A., Lin, H., Lites, B. W., Meisner, R. W., & White, O. R., 1999. Bright rings around sunspots, Nature, 401(6754), 678–679.
- Rathcke et al. (2021) Rathcke, A. D., MacDonald, R. J., Barstow, J. K., Goyal, J. M., Lopez-Morales, M., Mendonça, J. M., Sanz-Forcada, J., Henry, G. W., Sing, D. K., Alam, M. K., Lewis, N. K., Chubb, K. L., Taylor, J., Nikolov, N., & Buchhave, L. A., 2021. HST PanCET Program: A Complete Near-UV to Infrared Transmission Spectrum for the Hot Jupiter WASP-79b, arXiv e-prints, p. arXiv:2104.10688.
- Rauer et al. (2014) Rauer, H., Catala, C., Aerts, C., Appourchaux, T., Benz, W., Brandeker, A., Christensen-Dalsgaard, J., Deleuil, M., Gizon, L., Goupil, M.-J., Güdel, M., Janot-Pacheco, E., Mas-Hesse, M., Pagano, I., Piotto, G., Pollacco, D., Santos, Ċ., Smith, A., Suárez, J.-C., Szabó, R., Udry, S., Adibekyan, V., Alibert, Y., Almenara, J.-M., Amaro-Seoane, P., Eiff, M. A.-v., Asplund, M., Antonello, E., Barnes, S., Baudin, F., Belkacem, K., Bergemann, M., Bihain, G., Birch, A. C., Bonfils, X., Boisse, I., Bonomo, A. S., Borsa, F., Brandão, I. M., Brocato, E., Brun, S., Burleigh, M., Burston, R., Cabrera, J., Cassisi, S., Chaplin, W., Charpinet, S., Chiappini, C., Church, R. P., Csizmadia, S., Cunha, M., Damasso, M., Davies, M. B., Deeg, H. J., Díaz, R. F., Dreizler, S., Dreyer, C., Eggenberger, P., Ehrenreich, D., Eigmüller, P., Erikson, A., Farmer, R., Feltzing, S., de Oliveira Fialho, F., Figueira, P., Forveille, T., Fridlund, M., García, R. A., Giommi, P., Giuffrida, G., Godolt, M., Gomes da Silva, J., Granzer, T., Grenfell, J. L., Grotsch-Noels, A., Günther, E., Haswell, C. A., Hatzes, A. P., Hébrard, G., Hekker, S., Helled, R., Heng, K., Jenkins, J. M., Johansen, A., Khodachenko, M. L., Kislyakova, K. G., Kley, W., Kolb, U., Krivova, N., Kupka, F., Lammer, H., Lanza, A. F., Lebreton, Y., Magrin, D., Marcos-Arenal, P., Marrese, P. M., Marques, J. P., Martins, J., Mathis, S., Mathur, S., Messina, S., Miglio, A., Montalban, J., Montalto, M., Monteiro, M. J. P. F. G., Moradi, H., Moravveji, E., Mordasini, C., Morel, T., Mortier, A., Nascimbeni, V., Nelson, R. P., Nielsen, M. B., Noack, L., Norton, A. J., Ofir, A., Oshagh, M., Ouazzani, R.-M., Pápics, P., Parro, V. C., Petit, P., Plez, B., Poretti, E., Quirrenbach, A., Ragazzoni, R., Raimondo, G., Rainer, M., Reese, D. R., Redmer, R., Reffert, S., Rojas-Ayala, B., Roxburgh, I. W., Salmon, S., Santerne, A., Schneider, J., Schou, J., Schuh, S., Schunker, H., Silva-Valio, A., Silvotti, R., Skillen, I., Snellen, I., Sohl, F., Sousa, S. G., Sozzetti, A., Stello, D., Strassmeier, K. G., Švanda, M., Szabó, G. M., Tkachenko, A., Valencia, D., Van Grootel, V., Vauclair, S. D., Ventura, P., Wagner, F. W., Walton, N. A., Weingrill, J., Werner, S. C., Wheatley, P. J., & Zwintz, K., 2014. The PLATO 2.0 mission, Experimental Astronomy, 38, 249–330.
- Redfield et al. (2008) Redfield, S., Endl, M., Cochran, W. D., & Koesterke, L., 2008. Sodium Absorption from the Exoplanetary Atmosphere of HD 189733b Detected in the Optical Transmission Spectrum, ApJ, 673(1), L87.
- Reiners (2012) Reiners, A., 2012. Observations of Cool-Star Magnetic Fields, Living Reviews in Solar Physics, 9(1), 1.
- Reinhold et al. (2013) Reinhold, T., Reiners, A., & Basri, G., 2013. Rotation and differential rotation of active Kepler stars, A&A, 560, A4.
- Reinhold et al. (2019) Reinhold, T., Bell, K. J., Kuszlewicz, J., Hekker, S., & Shapiro, A. I., 2019. Transition from spot to faculae domination-an alternate explanation for the dearth of intermediate kepler rotation periods, Astronomy & Astrophysics, 621, A21.
- Reinhold et al. (2021) Reinhold, T., Shapiro, A. I., Witzke, V., Nèmec, N.-E., Işık, E., & Solanki, S. K., 2021. Where Have All the Solar-like Stars Gone? Rotation Period Detectability at Various Inclinations and Metallicities, ApJ, 908(2), L21.
- Rempel (2012) Rempel, M., 2012. Numerical Sunspot Models: Robustness of Photospheric Velocity and Magnetic Field Structure, ApJ, 750(1), 62.
- Rempel (2020) Rempel, M., 2020. On the Contribution of Quiet-Sun Magnetism to Solar Irradiance Variations: Constraints on Quiet-Sun Variability and Grand-minimum Scenarios, ApJ, 894(2), 140.
- Rempel et al. (2009a) Rempel, M., Schüssler, M., Cameron, R. H., & Knölker, M., 2009a. Penumbral Structure and Outflows in Simulated Sunspots, Science, 325(5937), 171.
- Rempel et al. (2009b) Rempel, M., Schüssler, M., & Knölker, M., 2009b. Radiative Magnetohydrodynamic Simulation of Sunspot Structure, ApJ, 691, 640–649.
- Ribárik et al. (2003) Ribárik, G., Oláh, K., & Strassmeier, K. G., 2003. Time-series photometric spot modelling VI. A new computer code and its application to 23 years of photometry of the active giant IM Pegasi, Astronomische Nachrichten, 324(3), 202–214.
- Ricker et al. (2014) Ricker, G. R., Winn, J. N., Vanderspek, R., Latham, D. W., Bakos, G. Á., Bean, J. L., Berta-Thompson, Z. K., Brown, T. M., Buchhave, L., Butler, N. R., Butler, R. P., Chaplin, W. J., Charbonneau, D., Christensen-Dalsgaard, J., Clampin, M., Deming, D., Doty, J., De Lee, N., Dressing, C., Dunham, E. W., Endl, M., Fressin, F., Ge, J., Henning, T., Holman, M. J., Howard, A. W., Ida, S., Jenkins, J., Jernigan, G., Johnson, J. A., Kaltenegger, L., Kawai, N., Kjeldsen, H., Laughlin, G., Levine, A. M., Lin, D., Lissauer, J. J., MacQueen, P., Marcy, G., McCullough, P. R., Morton, T. D., Narita, N., Paegert, M., Palle, E., Pepe, F., Pepper, J., Quirrenbach, A., Rinehart, S. A., Sasselov, D., Sato, B., Seager, S., Sozzetti, A., Stassun, K. G., Sullivan, P., Szentgyorgyi, A., Torres, G., Udry, S., & Villasenor, J., 2014. Transiting Exoplanet Survey Satellite (TESS), in Space Telescopes and Instrumentation 2014: Optical, Infrared, and Millimeter Wave, vol. 9143 of Society of Photo-Optical Instrumentation Engineers (SPIE) Conference Series, p. 914320.
- Ricker et al. (2015) Ricker, G. R., Winn, J. N., Vanderspek, R., Latham, D. W., Bakos, G. Á., Bean, J. L., Berta-Thompson, Z. K., Brown, T. M., Buchhave, L., Butler, N. R., Butler, R. P., Chaplin, W. J., Charbonneau, D., Christensen-Dalsgaard, J., Clampin, M., Deming, D., Doty, J., De Lee, N., Dressing, C., Dunham, E. W., Endl, M., Fressin, F., Ge, J., Henning, T., Holman, M. J., Howard, A. W., Ida, S., Jenkins, J. M., Jernigan, G., Johnson, J. A., Kaltenegger, L., Kawai, N., Kjeldsen, H., Laughlin, G., Levine, A. M., Lin, D., Lissauer, J. J., MacQueen, P., Marcy, G., McCullough, P. R., Morton, T. D., Narita, N., Paegert, M., Palle, E., Pepe, F., Pepper, J., Quirrenbach, A., Rinehart, S. A., Sasselov, D., Sato, B., Seager, S., Sozzetti, A., Stassun, K. G., Sullivan, P., Szentgyorgyi, A., Torres, G., Udry, S., & Villasenor, J., 2015. Transiting Exoplanet Survey Satellite (TESS), Journal of Astronomical Telescopes, Instruments, and Systems, 1(1), 014003.
- Riethmüller et al. (2008) Riethmüller, T. L., Solanki, S. K., Zakharov, V., & Gandorfer, A., 2008. Brightness, distribution, and evolution of sunspot umbral dots, A&A, 492(1), 233–243.
- Rimmele et al. (2020) Rimmele, T. R., Warner, M., Keil, S. L., Goode, P. R., Knölker, M., Kuhn, J. R., Rosner, R. R., McMullin, J. P., Casini, R., Lin, H., Wöger, F., von der Lühe, O., Tritschler, A., Davey, A., de Wijn, A., Elmore, D. F., Fehlmann, A., Harrington, D. M., Jaeggli, S. A., Rast, M. P., Schad, T. A., Schmidt, W., Mathioudakis, M., Mickey, D. L., Anan, T., Beck, C., Marshall, H. K., Jeffers, P. F., Oschmann, J. M., Beard, A., Berst, D. C., Cowan, B. A., Craig, S. C., Cross, E., Cummings, B. K., Donnelly, C., de Vanssay, J.-B., Eigenbrot, A. D., Ferayorni, A., Foster, C., Galapon, C. A., Gedrites, C., Gonzales, K., Goodrich, B. D., Gregory, B. S., Guzman, S. S., Guzzo, S., Hegwer, S., Hubbard, R. P., Hubbard, J. R., Johansson, E. M., Johnson, L. C., Liang, C., Liang, M., McQuillen, I., Mayer, C., Newman, K., Onodera, B., Phelps, L., Puentes, M. M., Richards, C., Rimmele, L. M., Sekulic, P., Shimko, S. R., Simison, B. E., Smith, B., Starman, E., Sueoka, S. R., Summers, R. T., Szabo, A., Szabo, L., Wampler, S. B., Williams, T. R., & White, C., 2020. The Daniel K. Inouye Solar Telescope - Observatory Overview, Sol. Phys., 295(12), 172.
- Robertson et al. (2014) Robertson, P., Mahadevan, S., Endl, M., & Roy, A., 2014. Stellar activity masquerading as planets in the habitable zone of the M dwarf Gliese 581, Science, 345, 440–444.
- Robertson et al. (2015) Robertson, P., Roy, A., & Mahadevan, S., 2015. Stellar Activity Mimics a Habitable-zone Planet around Kapteyn’s Star, ApJ, 805(2), L22.
- Robertson et al. (2020) Robertson, P., Stefansson, G., Mahadevan, S., Endl, M., Cochran, W. D., Beard, C., Bender, C. F., Diddams, S. A., Duong, N., Ford, E. B., Fredrick, C., Halverson, S., Hearty, F., Holcomb, R., Juan, L., Kanodia, S., Lubin, J., Metcalf, A. J., Monson, A., Ninan, J. P., Palafoutas, J., Ramsey, L. W., Roy, A., Schwab, C., Terrien, R. C., & Wright, J. T., 2020. Persistent Starspot Signals on M Dwarfs: Multiwavelength Doppler Observations with the Habitable-zone Planet Finder and Keck/HIRES, ApJ, 897(2), 125.
- Roettenbacher & Kane (2017) Roettenbacher, R. M. & Kane, S. R., 2017. The Stellar Activity of TRAPPIST-1 and Consequences for the Planetary Atmospheres, ApJ, 851(2), 77.
- Roettenbacher & Vida (2018) Roettenbacher, R. M. & Vida, K., 2018. The Connection between Starspots and Flares on Main-sequence Kepler Stars, ApJ, 868(1), 3.
- Roettenbacher et al. (2013) Roettenbacher, R. M., Monnier, J. D., Harmon, R. O., Barclay, T., & Still, M., 2013. Imaging Starspot Evolution on Kepler Target KIC 5110407 Using Light-Curve Inversion, ApJ, 767(1), 60.
- Roettenbacher et al. (2016) Roettenbacher, R. M., Monnier, J. D., Korhonen, H., Aarnio, A. N., Baron, F., Che, X., Harmon, R. O., Kővári, Z., Kraus, S., Schaefer, G. H., Torres, G., Zhao, M., Ten Brummelaar, T. A., Sturmann, J., & Sturmann, L., 2016. No Sun-like dynamo on the active star Andromedae from starspot asymmetry, Nature, 533(7602), 217–220.
- Roettenbacher et al. (2017) Roettenbacher, R. M., Monnier, J. D., Korhonen, H., Harmon, R. O., Baron, F., Hackman, T., Henry, G. W., Schaefer, G. H., Strassmeier, K. G., Weber, M., & ten Brummelaar, T. A., 2017. Contemporaneous Imaging Comparisons of the Spotted Giant Geminorum Using Interferometric, Spectroscopic, and Photometric Data, ApJ, 849(2), 120.
- Roettenbacher et al. (2022) Roettenbacher, R. M., Cabot, S. H. C., Fischer, D. A., Monnier, J. D., Henry, G. W., Harmon, R. O., Korhonen, H., Brewer, J. M., Llama, J., Petersburg, R. R., Zhao, L. L., Kraus, S., Le Bouquin, J.-B., Anugu, N., Davies, C. L., Gardner, T., Lanthermann, C., Schaefer, G., Setterholm, B., Clark, C. A., Jorstad, S. G., Kuehn, K., & Levine, S., 2022. EXPRES. III. Revealing the Stellar Activity Radial Velocity Signature of Eridani with Photometry and Interferometry, AJ, 163(1), 19.
- Romano et al. (2012) Romano, P., Berrilli, F., Criscuoli, S., Del Moro, D., Ermolli, I., Giorgi, F., Viticchié, B., & Zuccarello, F., 2012. A Comparative Analysis of Photospheric Bright Points in an Active Region and in the Quiet Sun, Sol. Phys., 280(2), 407–416.
- Rosich et al. (2020) Rosich, A., Herrero, E., Mallonn, M., Ribas, I., Morales, J. C., Perger, M., Anglada-Escudé, G., & Granzer, T., 2020. Correcting for chromatic stellar activity effects in transits with multiband photometric monitoring: application to WASP-52, A&A, 641, A82.
- Rutten (2007) Rutten, R. J., 2007. Observing the Solar Chromosphere, in The Physics of Chromospheric Plasmas, vol. 368 of Astronomical Society of the Pacific Conference Series, p. 27.
- Salhab et al. (2018) Salhab, R. G., Steiner, O., Berdyugina, S. V., Freytag, B., Rajaguru, S. P., & Steffen, M., 2018. Simulation of the small-scale magnetism in main-sequence stellar atmospheres, A&A, 614, A78.
- Samadi et al. (2010a) Samadi, R., Ludwig, H. G., Belkacem, K., Goupil, M. J., Benomar, O., Mosser, B., Dupret, M. A., Baudin, F., Appourchaux, T., & Michel, E., 2010a. The CoRoT target HD 49933 . II. Comparison of theoretical mode amplitudes with observations, A&A, 509, A16.
- Samadi et al. (2010b) Samadi, R., Ludwig, H. G., Belkacem, K., Goupil, M. J., & Dupret, M. A., 2010b. The CoRoT target HD 49933 . I. Effect of the metal abundance on the mode excitation rates, A&A, 509, A15.
- Samadi et al. (2012) Samadi, R., Belkacem, K., Dupret, M. A., Ludwig, H. G., Baudin, F., Caffau, E., Goupil, M. J., & Barban, C., 2012. Amplitudes of solar-like oscillations in red giant stars. Evidence for non-adiabatic effects using CoRoT observations, A&A, 543, A120.
- Sánchez Cuberes et al. (2002) Sánchez Cuberes, M., Vázquez, M., Bonet, J. A., & Sobotka, M., 2002. Infrared Photometry of Solar Photospheric Structures. II. Center-to-Limb Variation of Active Regions, ApJ, 570(2), 886–899.
- Sánchez Cuberes et al. (2003) Sánchez Cuberes, M., Vázquez, M., Bonet, J. A., & Sobotka, M., 2003. Centre-to-limb variation of solar granulation in the infrared, A&A, 397, 1075–1081.
- Sanchis-Ojeda & Winn (2011) Sanchis-Ojeda, R. & Winn, J. N., 2011. Starspots, Spin-Orbit Misalignment, and Active Latitudes in the HAT-P-11 Exoplanetary System, ApJ, 743, 61.
- Sanchis-Ojeda et al. (2011) Sanchis-Ojeda, R., Winn, J. N., Holman, M. J., Carter, J. A., Osip, D. J., & Fuentes, C. I., 2011. Starspots and Spin-orbit Alignment in the WASP-4 Exoplanetary System, ApJ, 733, 127–+.
- Sanchis-Ojeda et al. (2012) Sanchis-Ojeda, R., Fabrycky, D. C., Winn, J. N., Barclay, T., Clarke, B. D., Ford, E. B., Fortney, J. J., Geary, J. C., Holman, M. J., Howard, A. W., Jenkins, J. M., Koch, D., Lissauer, J. J., Marcy, J. W., Mullaly, F., Ragozzine, D., Seader, S. E., Still, M., & Thompson, S. E., 2012. Alignment of the stellar spin with the orbits of a three-planet system., Nature, 487, 449–453.
- Sanchis-Ojeda et al. (2013) Sanchis-Ojeda, R., Winn, J. N., Marcy, G. W., Howard, A. W., Isaacson, H., Johnson, J. A., Torres, G., Albrecht, S., Campante, T. L., Chaplin, W. J., Davies, G. R., Lund, M. N., Carter, J. A., Dawson, R. I., Buchhave, L. A., Everett, M. E., Fischer, D. A., Geary, J. C., Gilliland, R. L., Horch, E. P., Howell, S. B., & Latham, D. W., 2013. Kepler-63b: A Giant Planet in a Polar Orbit around a Young Sun-like Star, ApJ, 775, 54.
- Santos et al. (2013) Santos, N. C., Sousa, S. G., Mortier, A., Neves, V., Adibekyan, V., Tsantaki, M., Delgado Mena, E., Bonfils, X., Israelian, G., Mayor, M., & Udry, S., 2013. SWEET-Cat: A catalogue of parameters for Stars With ExoplanETs. I. New atmospheric parameters and masses for 48 stars with planets, A&A, 556, A150.
- Sarkar et al. (2018) Sarkar, S., Argyriou, I., Vandenbussche, B., Papageorgiou, A., & Pascale, E., 2018. Stellar pulsation and granulation as noise sources in exoplanet transit spectroscopy in the ARIEL space mission, MNRAS, 481(3), 2871–2877.
- Sayeed et al. (2021) Sayeed, M., Huber, D., Wheeler, A., & Ness, M. K., 2021. Data-Driven Inference of Stellar Surface Gravities for Cool Stars from Photometric Light Curves, in American Astronomical Society Meeting Abstracts, vol. 53 of American Astronomical Society Meeting Abstracts, p. 339.17.
- Scandariato et al. (2017) Scandariato, G., Nascimbeni, V., Lanza, A. F., Pagano, I., Zanmar Sanchez, R., & Leto, G., 2017. TOSC: an algorithm for the tomography of spotted transit chords, A&A, 606, A134.
- Schad (2014) Schad, T. A., 2014. On the Collective Magnetic Field Strength and Vector Structure of Dark Umbral Cores Measured by the Hinode Spectropolarimeter, Sol. Phys., 289(5), 1477–1498.
- Schanche et al. (2022) Schanche, N., Pozuelos, F. J., Günther, M. N., Wells, R. D., Burgasser, A. J., Chinchilla, P., Delrez, L., Ducrot, E., Garcia, L. J., Gómez Maqueo Chew, Y., Jofré, E., Rackham, B. V., Sebastian, D., Stassun, K. G., Stern, D., Timmermans, M., Barkaoui, K., Belinski, A., Benkhaldoun, Z., Benz, W., Bieryla, A., Bouchy, F., Burdanov, A., Charbonneau, D., Christiansen, J. L., Collins, K. A., Demory, B. O., Dévora-Pajares, M., de Wit, J., Dragomir, D., Dransfield, G., Furlan, E., Ghachoui, M., Gillon, M., Gnilka, C., Gómez-Muñoz, M. A., Guerrero, N., Harris, M., Heng, K., Henze, C. E., Hesse, K., Howell, S. B., Jehin, E., Jenkins, J., Jensen, E. L. N., Kunimoto, M., Latham, D. W., Lester, K., McLeod, K. K., Mireles, I., Murray, C. A., Niraula, P., Pedersen, P. P., Queloz, D., Quintana, E. V., Ricker, G., Rudat, A., Sabin, L., Safonov, B., Schroffenegger, U., Scott, N., Seager, S., Strakhov, I., Triaud, A. H. M. J., Vanderspek, R., Vezie, M., & Winn, J., 2022. TOI-2257 b: A highly eccentric long-period sub-Neptune transiting a nearby M dwarf, A&A, 657, A45.
- Scharmer et al. (2003) Scharmer, G. B., Bjelksjo, K., Korhonen, T. K., Lindberg, B., & Petterson, B., 2003. The 1-meter Swedish solar telescope, in Innovative Telescopes and Instrumentation for Solar Astrophysics, vol. 4853 of Society of Photo-Optical Instrumentation Engineers (SPIE) Conference Series, pp. 341–350.
- Schmidt et al. (2014) Schmidt, S. J., Prieto, J. L., Stanek, K. Z., Shappee, B. J., Morrell, N., Bardalez Gagliuffi, D. C., Kochanek, C. S., Jencson, J., Holoien, T. W. S., Basu, U., Beacom, J. F., Szczygieł, D. M., Pojmanski, G., Brimacombe, J., Dubberley, M., Elphick, M., Foale, S., Hawkins, E., Mullins, D., Rosing, W., Ross, R., & Walker, Z., 2014. Characterizing a Dramatic V ~-9 Flare on an Ultracool Dwarf Found by the ASAS-SN Survey, ApJ, 781(2), L24.
- Schmidt et al. (2012) Schmidt, W., von der Lühe, O., Volkmer, R., Denker, C., Solanki, S. K., Balthasar, H., Bello Gonzalez, N., Berkefeld, T., Collados, M., Fischer, A., Halbgewachs, C., Heidecke, F., Hofmann, A., Kneer, F., Lagg, A., Nicklas, H., Popow, E., Puschmann, K. G., Schmidt, D., Sigwarth, M., Sobotka, M., Soltau, D., Staude, J., Strassmeier, K. G., & Waldmann , T. A., 2012. The 1.5 meter solar telescope GREGOR, Astronomische Nachrichten, 333(9), 796.
- Schofield et al. (2019) Schofield, M., Chaplin, W. J., Huber, D., Campante, T. L., Davies, G. R., Miglio, A., Ball, W. H., Appourchaux, T., Basu, S., Bedding, T. R., Christensen-Dalsgaard, J., Creevey, O., García, R. A., Handberg, R., Kawaler, S. D., Kjeldsen, H., Latham, D. W., Lund, M. N., Metcalfe, T. S., Ricker, G. R., Serenelli, A., Silva Aguirre, V., Stello, D., & Vanderspek, R., 2019. The Asteroseismic Target List for Solar-like Oscillators Observed in 2 minute Cadence with the Transiting Exoplanet Survey Satellite, ApJS, 241(1), 12.
- Schrijver et al. (2012) Schrijver, C. J., Beer, J., Baltensperger, U., Cliver, E. W., Güdel, M., Hudson, H. S., McCracken, K. G., Osten, R. A., Peter, T., Soderblom, D. R., Usoskin, I. G., & Wolff, E. W., 2012. Estimating the frequency of extremely energetic solar events, based on solar, stellar, lunar, and terrestrial records, Journal of Geophysical Research (Space Physics), 117(A8), A08103.
- Schüssler et al. (2003) Schüssler, M., Shelyag, S., Berdyugina, S., Vögler, A., & Solanki, S. K., 2003. Why Solar Magnetic Flux Concentrations Are Bright in Molecular Bands, ApJ, 597(2), L173–L176.
- Schutte et al. (2022) Schutte, M. C., Hebb, L., Lowry, S., Wisniewski, J., Hawley, S. L., Mahadevan, S., Morris, B. M., Robertson, P., Rohn, G., & Stefansson, G., 2022. Modeling Stellar Surface Features on a Subgiant Star with an M-dwarf Companion, AJ, 164(1), 14.
- Seager & Sasselov (2000) Seager, S. & Sasselov, D. D., 2000. Theoretical Transmission Spectra during Extrasolar Giant Planet Transits, ApJ, 537(2), 916–921.
- Sedaghati et al. (2015) Sedaghati, E., Boffin, H. M. J., Csizmadia, S., Gibson, N., Kabath, P., Mallonn, M., & Van den Ancker, M. E., 2015. Regaining the FORS: optical ground-based transmission spectroscopy of the exoplanet WASP-19b with VLT+FORS2, A&A, 576, L11.
- See et al. (2021) See, V., Roquette, J., Amard, L., & Matt, S. P., 2021. Photometric variability as a proxy for magnetic activity and its dependence on metallicity, The Astrophysical Journal, 912(2), 127.
- Semel (1989) Semel, M., 1989. Zeeman-Doppler imaging of active stars. I - Basic principles., A&A, 225, 456–466.
- Serrano et al. (2020) Serrano, L. M., Oshagh, M., Cegla, H. M., Barros, S. C. C., Santos, N. C., Faria, J. P., & Akinsanmi, B., 2020. Can we detect the stellar differential rotation of WASP-7 through the Rossiter-McLaughlin observations?, MNRAS, 493(4), 5928–5943.
- Shapiro et al. (2020) Shapiro, A., Amazo-Gómez, E., Krivova, N. A., & Solanki, S. K., 2020. Inflection point in the power spectrum of stellar brightness variations-i. the model, Astronomy & Astrophysics, 633, A32.
- Shapiro et al. (2011) Shapiro, A. I., Fluri, D. M., Berdyugina, S. V., Bianda, M., & Ramelli, R., 2011. NLTE modeling of Stokes vector center-to-limb variations in the CN violet system, A&A, 529, A139.
- Shapiro et al. (2014) Shapiro, A. I., Solanki, S. K., Krivova, N. A., Schmutz, W. K., Ball, W. T., Knaack, R., Rozanov, E. V., & Unruh, Y. C., 2014. Variability of Sun-like stars: reproducing observed photometric trends, A&A, 569, A38.
- Shapiro et al. (2016) Shapiro, A. I., Solanki, S. K., Krivova, N. A., Yeo, K. L., & Schmutz, W. K., 2016. Are solar brightness variations faculae- or spot-dominated?, A&A, 589, A46.
- Shapiro et al. (2017) Shapiro, A. I., Solanki, S. K., Krivova, N. A., Cameron, R. H., Yeo, K. L., & Schmutz, W. K., 2017. The nature of solar brightness variations, Nature Astronomy, 1, 612–616.
- Sheeley (1971) Sheeley, N. R., J., 1971. Using CN 3883 spectroheliograms to map weak photospheric magnetic fields, Sol. Phys., 20(1), 19–25.
- Shimizu (2009) Shimizu, T., 2009. HINODE: New Space-borne Observatory for Investigating the Sun, Transactions of Space Technology Japan, 7, Tm1–Tm6.
- Shulyak et al. (2019) Shulyak, D., Reiners, A., Nagel, E., Tal-Or, L., Caballero, J. A., Zechmeister, M., Béjar, V. J. S., Cortés-Contreras, M., Martin, E. L., Kaminski, A., Ribas, I., Quirrenbach, A., Amado, P. J., Anglada-Escudé, G., Bauer, F. F., Dreizler, S., Guenther, E. W., Henning, T., Jeffers, S. V., Kürster, M., Lafarga, M., Montes, D., Morales, J. C., & Pedraz, S., 2019. Magnetic fields in M dwarfs from the CARMENES survey, A&A, 626, A86.
- Silva (2003) Silva, A. V. R., 2003. Method for Spot Detection on Solar-like Stars, ApJ, 585(2), L147–L150.
- Silva-Valio et al. (2010) Silva-Valio, A., Lanza, A. F., Alonso, R., & Barge, P., 2010. Properties of starspots on CoRoT-2, A&A, 510, A25.
- Sing (2010) Sing, D. K., 2010. Stellar limb-darkening coefficients for CoRot and Kepler, A&A, 510, A21.
- Sing et al. (2009) Sing, D. K., Désert, J. M., Lecavelier Des Etangs, A., Ballester, G. E., Vidal-Madjar, A., Parmentier, V., Hebrard, G., & Henry, G. W., 2009. Transit spectrophotometry of the exoplanet HD 189733b. I. Searching for water but finding haze with HST NICMOS, A&A, 505(2), 891–899.
- Sing et al. (2011) Sing, D. K., Pont, F., Aigrain, S., Charbonneau, D., Désert, J. M., Gibson, N., Gilliland, R., Hayek, W., Henry, G., Knutson, H., Lecavelier Des Etangs, A., Mazeh, T., & Shporer, A., 2011. Hubble Space Telescope transmission spectroscopy of the exoplanet HD 189733b: high-altitude atmospheric haze in the optical and near-ultraviolet with STIS, MNRAS, 416(2), 1443–1455.
- Sing et al. (2015) Sing, D. K., Wakeford, H. R., Showman, A. P., Nikolov, N., Fortney, J. J., Burrows, A. S., Ballester, G. E., Deming, D., Aigrain, S., Désert, J. M., Gibson, N. P., Henry, G. W., Knutson, H., Lecavelier des Etangs, A., Pont, F., Vidal-Madjar, A., Williamson, M. W., & Wilson, P. A., 2015. HST hot-Jupiter transmission spectral survey: detection of potassium in WASP-31b along with a cloud deck and Rayleigh scattering, MNRAS, 446(3), 2428–2443.
- Sing et al. (2016) Sing, D. K., Fortney, J. J., Nikolov, N., Wakeford, H. R., Kataria, T., Evans, T. M., Aigrain, S., Ballester, G. E., Burrows, A. S., Deming, D., Désert, J.-M., Gibson, N. P., Henry, G. W., Huitson, C. M., Knutson, H. A., Lecavelier Des Etangs, A., Pont, F., Showman, A. P., Vidal-Madjar, A., Williamson, M. H., & Wilson, P. A., 2016. A continuum from clear to cloudy hot-Jupiter exoplanets without primordial water depletion, Nature, 529(7584), 59–62.
- Siu-Tapia et al. (2017) Siu-Tapia, A., Lagg, A., Solanki, S. K., van Noort, M., & Jurčák, J., 2017. Normal and counter Evershed flows in the photospheric penumbra of a sunspot. SPINOR 2D inversions of Hinode-SOT/SP observations, A&A, 607, A36.
- Siu-Tapia et al. (2019) Siu-Tapia, A., Lagg, A., van Noort, M., Rempel, M., & Solanki, S. K., 2019. Superstrong photospheric magnetic fields in sunspot penumbrae, A&A, 631, A99.
- Skaf et al. (2020) Skaf, N., Bieger, M. F., Edwards, B., Changeat, Q., Morvan, M., Kiefer, F., Blain, D., Zingales, T., Poveda, M., Al-Refaie, A., Baeyens, R., Gressier, A., Guilluy, G., Jaziri, A. Y., Modirrousta-Galian, D., Mugnai, L. V., Pluriel, W., Whiteford, N., Wright, S., Yip, K. H., Charnay, B., Leconte, J., Drossart, P., Tsiaras, A., Venot, O., Waldmann, I., & Beaulieu, J.-P., 2020. ARES. II. Characterizing the Hot Jupiters WASP-127 b, WASP-79 b, and WASP-62b with the Hubble Space Telescope, AJ, 160(3), 109.
- Skumanich (1972) Skumanich, A., 1972. Time Scales for Ca II Emission Decay, Rotational Braking, and Lithium Depletion, ApJ, 171, 565.
- Smalley et al. (2012) Smalley, B., Anderson, D. R., Collier-Cameron, A., Doyle, A. P., Fumel, A., Gillon, M., Hellier, C., Jehin, E., Lendl, M., Maxted, P. F. L., Pepe, F., Pollacco, D., Queloz, D., Ségransan, D., Smith, A. M. S., Southworth, J., Triaud, A. H. M. J., Udry, S., & West, R. G., 2012. WASP-78b and WASP-79b: two highly-bloated hot Jupiter-mass exoplanets orbiting F-type stars in Eridanus, A&A, 547, A61.
- Snellen et al. (2008) Snellen, I. A. G., Albrecht, S., de Mooij, E. J. W., & Le Poole, R. S., 2008. Ground-based detection of sodium in the transmission spectrum of exoplanet HD 209458b, A&A, 487(1), 357–362.
- Snellen et al. (2010) Snellen, I. A. G., de Kok, R. J., de Mooij, E. J. W., & Albrecht, S., 2010. The orbital motion, absolute mass and high-altitude winds of exoplanet HD209458b, Nature, 465(7301), 1049–1051.
- Sobotka & Hanslmeier (2005) Sobotka, M. & Hanslmeier, A., 2005. Photometry of umbral dots, A&A, 442(1), 323–329.
- Sobotka et al. (1997a) Sobotka, M., Brandt, P. N., & Simon, G. W., 1997a. Fine structure in sunspots. I. Sizes and lifetimes of umbral dots, A&A, 328, 682–688.
- Sobotka et al. (1997b) Sobotka, M., Brandt, P. N., & Simon, G. W., 1997b. Fine structure in sunspots. II. Intensity variations and proper motions of umbral dots, A&A, 328, 689–694.
- Solanki (1993) Solanki, S. K., 1993. Smallscale Solar Magnetic Fields - an Overview, Space Sci. Rev., 63(1-2), 1–188.
- Solanki (2003) Solanki, S. K., 2003. Sunspots: An overview, A&A Rev., 11, 153–286.
- Solanki & Unruh (2013) Solanki, S. K. & Unruh, Y. C., 2013. Solar irradiance variability, Astronomische Nachrichten, 334(1-2), 145.
- Solanki et al. (2006) Solanki, S. K., Inhester, B., & Schüssler, M., 2006. The solar magnetic field, Reports on Progress in Physics, 69(3), 563–668.
- Sotzen et al. (2020) Sotzen, K. S., Stevenson, K. B., Sing, D. K., Kilpatrick, B. M., Wakeford, H. R., Filippazzo, J. C., Lewis, N. K., Hörst, S. M., López-Morales, M., Henry, G. W., Buchhave, L. A., Ehrenreich, D., Fraine, J. D., García Muñoz, A., Jayaraman, R., Lavvas, P., Lecavelier des Etangs, A., Marley, M. S., Nikolov, N., Rathcke, A. D., & Sanz-Forcada, J., 2020. Transmission Spectroscopy of WASP-79b from 0.6 to 5.0 m, AJ, 159(1), 5.
- Sousa et al. (2021) Sousa, S. G., Adibekyan, V., Delgado-Mena, E., Santos, N. C., Rojas-Ayala, B., Soares, B. M. T. B., Legoinha, H., Ulmer-Moll, S., Camacho, J. D., Barros, S. C. C., Demangeon, O. D. S., Hoyer, S., Israelian, G., Mortier, A., Tsantaki, M., & Monteiro, M. A., 2021. SWEET-Cat 2.0: The Cat just got SWEETer. Higher quality spectra and precise parallaxes from Gaia eDR3, A&A, 656, A53.
- Southworth (2011) Southworth, J., 2011. Homogeneous studies of transiting extrasolar planets - IV. Thirty systems with space-based light curves, MNRAS, 417(3), 2166–2196.
- Southworth et al. (2009) Southworth, J., Hinse, T. C., Burgdorf, M. J., Dominik, M., Hornstrup, A., Jørgensen, U. G., Liebig, C., Ricci, D., & others., 2009. High-precision photometry by telescope defocussing - II. The transiting planetary system WASP-4, MNRAS, 399, 287–294.
- Southworth et al. (2016) Southworth, J., Tregloan-Reed, J., Andersen, M. I., Calchi Novati, S., Ciceri, S., Colque, J. P., D’Ago, G., Dominik, M., Evans, D. F., Gu, S.-H., Herrera-Cordova, A., Hinse, T. C., Jørgensen, U. G., Juncher, D., Kuffmeier, M., Mancini, L., Peixinho, N., Popovas, A., Rabus, M., Skottfelt, J., Tronsgaard, R., Unda-Sanzana, E., Wang, X.-B., Wertz, O., Alsubai, K. A., Andersen, J. M., Bozza, V., Bramich, D. M., Burgdorf, M., Damerdji, Y., Diehl, C., Elyiv, A., Figuera Jaimes, R., Haugbølle, T., Hundertmark, M., Kains, N., Kerins, E., Korhonen, H., Liebig, C., Mathiasen, M., Penny, M. T., Rahvar, S., Scarpetta, G., Schmidt, R. W., Snodgrass, C., Starkey, D., Surdej, J., Vilela, C., von Essen, C., & Wang, Y., 2016. High-precision photometry by telescope defocussing - VIII. WASP-22, WASP-41, WASP-42 and WASP-55, MNRAS, 457, 4205–4217.
- Spake et al. (2018) Spake, J. J., Sing, D. K., Evans, T. M., Oklopčić, , A., Bourrier, V., Kreidberg, L., Rackham, B. V., Irwin, J., Ehrenreich, D., Wyttenbach, A., Wakeford, H. R., Zhou, Y., Chubb, K. L., Nikolov, N., Goyal, J. M., Henry, G. W., Williamson, M. H., Blumenthal, S., Anderson, D. R., Hellier, C., Charbonneau, D., Udry, S., & Madhusudhan, N., 2018. Helium in the eroding atmosphere of an exoplanet, Nature, 557(7703), 68–70.
- Stassun et al. (2017) Stassun, K. G., Collins, K. A., & Gaudi, B. S., 2017. Accurate Empirical Radii and Masses of Planets and Their Host Stars with Gaia Parallaxes, AJ, 153(3), 136.
- Stassun et al. (2018) Stassun, K. G., Corsaro, E., Pepper, J. A., & Gaudi, B. S., 2018. Empirical Accurate Masses and Radii of Single Stars with TESS and Gaia, AJ, 155(1), 22.
- Stefansson et al. (2018) Stefansson, G., Mahadevan, S., Wisniewski, J., Li, Y., Hebb, L., Morris, B., Halverson, S., Monson, A., & Robertson, P., 2018. Extreme precision photometry from the ground with beam-shaping diffusers for K2, TESS, and beyond, in Ground-based and Airborne Instrumentation for Astronomy VII, vol. 10702 of Society of Photo-Optical Instrumentation Engineers (SPIE) Conference Series, p. 1070250.
- Steffen & Holweger (2002) Steffen, M. & Holweger, H., 2002. Line formation in convective stellar atmospheres. I. Granulation corrections for solar photospheric abundances, A&A, 387, 258–270.
- Stein (2012) Stein, R. F., 2012. Solar Surface Magneto-Convection, Living Reviews in Solar Physics, 9(1), 4.
- Stein & Nordlund (1998) Stein, R. F. & Nordlund, Å., 1998. Simulations of Solar Granulation. I. General Properties, ApJ, 499(2), 914–933.
- Steiner (2005) Steiner, O., 2005. Radiative properties of magnetic elements. II. Center to limb variation of the appearance of photospheric faculae, A&A, 430, 691–700.
- Steiner et al. (2014) Steiner, O., Salhab, R., Freytag, B., Rajaguru, P., Schaffenberger, W., & Steffen, M., 2014. Properties of small-scale magnetism of stellar atmospheres, PASJ, 66, S5.
- Stello et al. (2011) Stello, D., Huber, D., Kallinger, T., Basu, S., Mosser, B., Hekker, S., Mathur, S., García, R. A., Bedding, T. R., Kjeldsen, H., Gilliland, R. L., Verner, G. A., Chaplin, W. J., Benomar, O., Meibom, S., Grundahl, F., Elsworth, Y. P., Molenda-Żakowicz, J., Szabó, R., Christensen-Dalsgaard, J., Tenenbaum, P., Twicken, J. D., & Uddin, K., 2011. Amplitudes of Solar-like Oscillations: Constraints from Red Giants in Open Clusters Observed by Kepler, ApJ, 737(1), L10.
- Stello et al. (2013) Stello, D., Huber, D., Bedding, T. R., Benomar, O., Bildsten, L., Elsworth, Y. P., Gilliland, R. L., Mosser, B., Paxton, B., & White, T. R., 2013. Asteroseismic Classification of Stellar Populations among 13,000 Red Giants Observed by Kepler, ApJ, 765(2), L41.
- Stenflo (1982) Stenflo, J. O., 1982. The Hanle Effect and the Diagnostics of Turbulent Magnetic Fields in the Solar Atmosphere, Sol. Phys., 80(2), 209–226.
- Stenflo et al. (1998) Stenflo, J. O., Keller, C. U., & Gandorfer, A., 1998. Differential Hanle effect and the spatial variation of turbulent magnetic fields on the Sun, A&A, 329, 319–328.
- Stephenson (1990) Stephenson, F. R., 1990. Historical evidence concerning the sun: Interpretation of sunspot records during the telescopic and pretelescopic eras, Philosophical Transactions of the Royal Society of London. Series A, Mathematical and Physical Sciences, 330(1615), 499–512.
- Strassmeier (2009) Strassmeier, K. G., 2009. Starspots, A&A Rev., 17, 251–308.
- Strassmeier & Rice (1998) Strassmeier, K. G. & Rice, J. B., 1998. Doppler imaging of stellar surface structure. VI. HD 129333 = EK Draconis: a stellar analog of the active young Sun, A&A, 330, 685–695.
- Suetterlin (1998) Suetterlin, P., 1998. Properties of solar pores, A&A, 333, 305–312.
- Sulis et al. (2020) Sulis, S., Lendl, M., Hofmeister, S., Veronig, A., Fossati, L., Cubillos, P., & Van Grootel, V., 2020. Mitigating flicker noise in high-precision photometry. I. Characterization of the noise structure, impact on the inferred transit parameters, and predictions for CHEOPS observations, A&A, 636, A70.
- Sun et al. (2017) Sun, L., Gu, S., Wang, X., Collier Cameron, A., Cao, D., Wang, Y., Xiang, Y., Hui, H.-K., Kwok, C.-T., Yeung, B., Ng, E., & Grau Horta, F., 2017. Refined System Parameters and TTV Study of Transiting Exoplanetary System HAT-P-20, AJ, 153(1), 28.
- Tan & Showman (2021) Tan, X. & Showman, A. P., 2021. Atmospheric circulation of brown dwarfs and directly imaged exoplanets driven by cloud radiative feedback: effects of rotation, MNRAS, 502(1), 678–699.
- Tang et al. (2013) Tang, S., Sasselov, D., Grindlay, J., Los, E., & Servillat, M., 2013. 100-year DASCH Light Curves of Kepler Planet-Candidate Host Stars, PASP, 125(929), 793.
- ten Brummelaar et al. (2005) ten Brummelaar, T. A., McAlister, H. A., Ridgway, S. T., Bagnuolo, W. G., J., Turner, N. H., Sturmann, L., Sturmann, J., Berger, D. H., Ogden, C. E., Cadman, R., Hartkopf, W. I., Hopper, C. H., & Shure, M. A., 2005. First Results from the CHARA Array. II. A Description of the Instrument, ApJ, 628(1), 453–465.
- The LUVOIR Team (2019) The LUVOIR Team, 2019. The LUVOIR Mission Concept Study Final Report, arXiv e-prints, p. arXiv:1912.06219.
- Tinetti et al. (2007) Tinetti, G., Vidal-Madjar, A., Liang, M.-C., Beaulieu, J.-P., Yung, Y., Carey, S., Barber, R. J., Tennyson, J., Ribas, I., Allard, N., Ballester, G. E., Sing, D. K., & Selsis, F., 2007. Water vapour in the atmosphere of a transiting extrasolar planet, Nature, 448(7150), 169–171.
- Tinetti et al. (2018) Tinetti, G., Drossart, P., Eccleston, P., Hartogh, P., Heske, A., Leconte, J., Micela, G., Ollivier, M., Pilbratt, G., Puig, L., & et al., 2018. A chemical survey of exoplanets with ARIEL, Experimental Astronomy, 46, 135–209.
- Tinetti et al. (2021) Tinetti, G., Eccleston, P., Haswell, C., Lagage, P.-O., Leconte, J., Lüftinger, T., Micela, G., Min, M., Pilbratt, G., Puig, L., & et al., 2021. Ariel: Enabling planetary science across light-years, arXiv e-prints, p. arXiv:2104.04824.
- Toner & Gray (1988) Toner, C. G. & Gray, D. F., 1988. The Star Patch on the G8 Dwarf chi Bootis A, ApJ, 334, 1008.
- Toner et al. (1997) Toner, C. G., Jefferies, S. M., & Duvall, T. L., 1997. Restoration of Long-Exposure Full-Disk Solar Intensity Images, ApJ, 478(2), 817–827.
- Trampedach et al. (2013) Trampedach, R., Asplund, M., Collet, R., Nordlund, Å., & Stein, R. F., 2013. A Grid of Three-dimensional Stellar Atmosphere Models of Solar Metallicity. I. General Properties, Granulation, and Atmospheric Expansion, ApJ, 769(1), 18.
- Tregloan-Reed & Unda-Sanzana (2019) Tregloan-Reed, J. & Unda-Sanzana, E., 2019. Simulations of starspot anomalies within TESS exoplanetary transit light curves. I. Detection limits of starspot anomalies in TESS light curves, A&A, 630, A114.
- Tregloan-Reed & Unda-Sanzana (2021) Tregloan-Reed, J. & Unda-Sanzana, E., 2021. Simulations of starspot anomalies within TESS exoplanetary transit light curves – II, A&A, 649, A130.
- Tregloan-Reed et al. (2013) Tregloan-Reed, J., Southworth, J., & Tappert, C., 2013. Transits and starspots in the WASP-19 planetary system, MNRAS, 428, 3671–3679.
- Tregloan-Reed et al. (2015) Tregloan-Reed, J., Southworth, J., Burgdorf, M., Novati, S. C., Dominik, M., Finet, F., Jørgensen, U. G., Maier, G., Mancini, L., Prof, S., Ricci, D., Snodgrass, C., Bozza, V., Browne, P., Dodds, P., Gerner, T., Harpsøe, K., Hinse, T. C., Hundertmark, M., Kains, N., Kerins, E., Liebig, C., Penny, M. T., Rahvar, S., Sahu, K., Scarpetta, G., Schäfer, S., Schönebeck, F., Skottfelt, J., & Surdej, J., 2015. Transits and starspots in the WASP-6 planetary system, MNRAS, 450, 1760–1769.
- Tregloan-Reed et al. (2018) Tregloan-Reed, J., Southworth, J., Mancini, L., Mollière, P., Ciceri, S., Bruni, I., Ricci, D., Ayala-Loera, C., & Henning, T., 2018. Possible detection of a bimodal cloud distribution in the atmosphere of HAT-P-32 A b from multiband photometry, MNRAS, 474, 5485–5499.
- Tremblay et al. (2013) Tremblay, P.-E., Ludwig, H.-G., Freytag, B., Steffen, M., & Caffau, E., 2013. Granulation properties of giants, dwarfs, and white dwarfs from the CIFIST 3D model atmosphere grid, A&A, 557, A7.
- Tremblin et al. (2020) Tremblin, P., Phillips, M. W., Emery, A., Baraffe, I., Lew, B. W. P., Apai, D., Biller, B. A., & Bonnefoy, M., 2020. Rotational spectral modulation of cloudless atmospheres for L/T brown dwarfs and extrasolar giant planets, A&A, 643, A23.
- Trotta (2008) Trotta, R., 2008. Bayes in the sky: Bayesian inference and model selection in cosmology, Contemporary Physics, 49(2), 71–104.
- Trujillo Bueno et al. (2004) Trujillo Bueno, J., Shchukina, N., & Asensio Ramos, A., 2004. A substantial amount of hidden magnetic energy in the quiet Sun, Nature, 430(6997), 326–329.
- Tsuneta et al. (2008) Tsuneta, S., Ichimoto, K., Katsukawa, Y., Nagata, S., Otsubo, M., Shimizu, T., Suematsu, Y., Nakagiri, M., Noguchi, M., Tarbell, T., Title, A., Shine, R., Rosenberg, W., Hoffmann, C., Jurcevich, B., Kushner, G., Levay, M., Lites, B., Elmore, D., Matsushita, T., Kawaguchi, N., Saito, H., Mikami, I., Hill, L. D., & Owens, J. K., 2008. The Solar Optical Telescope for the Hinode Mission: An Overview, Sol. Phys., 249, 167–196.
- Turova (1984) Turova, I. P., 1984. On Umbral Flashes in Different Sunspot Groups, Sol. Phys., 91(1), 51–54.
- Unruh et al. (1999) Unruh, Y. C., Solanki, S. K., & Fligge, M., 1999. The spectral dependence of facular contrast and solar irradiance variations, A&A, 345, 635–642.
- Usoskin et al. (2021) Usoskin, I. G., Solanki, S. K., Krivova, N. A., Hofer, B., Kovaltsov, G. A., Wacker, L., Brehm, N., & Kromer, B., 2021. Solar cyclic activity over the last millennium reconstructed from annual 14C data, A&A, 649, A141.
- Valio et al. (2017) Valio, A., Estrela, R., Netto, Y., Bravo, J. P., & de Medeiros, J. R., 2017. Activity and Rotation of Kepler-17, ApJ, 835(2), 294.
- Valio et al. (2020) Valio, A., Spagiari, E., Marengoni, M., & Selhorst, C. L., 2020. Correlations of Sunspot Physical Characteristics during Solar Cycle 23, Sol. Phys., 295(9), 120.
- van Belle et al. (2020a) van Belle, G., Clark, J., Armstrong, J. T., Baines, E., Martinez, T., Restaino, S., Schmitt, H., Jorgensen, A., Mozurkewich, D., Pugh, T., Clark, W., Green, N., Jones, K., Kingsley, B., Kurtz, P., & Schilperoort, A., 2020a. The Navy Precision Optical Interferometer: two years of development towards large-aperture observations, in Society of Photo-Optical Instrumentation Engineers (SPIE) Conference Series, vol. 11446 of Society of Photo-Optical Instrumentation Engineers (SPIE) Conference Series, p. 1144608.
- van Belle et al. (2020b) van Belle, G. T., Hillsberry, D., Kloske, J., Kugler, J., Patané, S., Paul-Gin, N., Piness, J., Riley, D., Schomer, J., Snyder, M., & Tobiassen, T., 2020b. Optimast structurally connected interferometry enabled by in-space robotic manufacturing and assembly, in Society of Photo-Optical Instrumentation Engineers (SPIE) Conference Series, vol. 11446 of Society of Photo-Optical Instrumentation Engineers (SPIE) Conference Series, p. 114462K.
- van Noort et al. (2013) van Noort, M., Lagg, A., Tiwari, S. K., & Solanki, S. K., 2013. Peripheral downflows in sunspot penumbrae, A&A, 557, A24.
- van Saders et al. (2016) van Saders, J. L., Ceillier, T., Metcalfe, T. S., Silva Aguirre, V., Pinsonneault, M. H., García, R. A., Mathur, S., & Davies, G. R., 2016. Weakened magnetic braking as the origin of anomalously rapid rotation in old field stars, Nature, 529(7585), 181–184.
- Vaughan & Preston (1980) Vaughan, A. H. & Preston, G. W., 1980. A survey of chromospheric CA II H and K emission in field stars of the solar neighborhood., PASP, 92, 385–391.
- Vaughan & Zirin (1968) Vaughan, Arthur H., J. & Zirin, H., 1968. The Helium Line 10830 Å in Late-Type Stars, ApJ, 152, 123.
- Vernazza et al. (1981) Vernazza, J. E., Avrett, E. H., & Loeser, R., 1981. Structure of the solar chromosphere. III. Models of the EUV brightness components of the quiet sun., ApJS, 45, 635–725.
- Vida et al. (2007) Vida, K., Kovári, Z., Švanda, M., Oláh, K., Strassmeier, K. G., & Bartus, J., 2007. Anti-solar differential rotation and surface flow pattern on UZ Libræ, Astronomische Nachrichten, 328(10), 1078.
- Vida et al. (2016) Vida, K., Kriskovics, L., Oláh, K., Leitzinger, M., Odert, P., Kővári, Z., Korhonen, H., Greimel, R., Robb, R., Csák, B., & Kovács, J., 2016. Investigating magnetic activity in very stable stellar magnetic fields. Long-term photometric and spectroscopic study of the fully convective M4 dwarf V374 Pegasi, A&A, 590, A11.
- Vida et al. (2017) Vida, K., Kővári, Z., Pál, A., Oláh, K., & Kriskovics, L., 2017. Frequent Flaring in the TRAPPIST-1 System—Unsuited for Life?, ApJ, 841(2), 124.
- Vidal-Madjar et al. (2004) Vidal-Madjar, A., Désert, J. M., Lecavelier des Etangs, A., Hébrard, G., Ballester, G. E., Ehrenreich, D., Ferlet, R., McConnell, J. C., Mayor, M., & Parkinson, C. D., 2004. Detection of Oxygen and Carbon in the Hydrodynamically Escaping Atmosphere of the Extrasolar Planet HD 209458b, ApJ, 604(1), L69–L72.
- Vinyoles et al. (2017) Vinyoles, N., Serenelli, A. M., Villante, F. L., Basu, S., Bergström, J., Gonzalez-Garcia, M. C., Maltoni, M., Peña-Garay, C., & Song, N., 2017. A New Generation of Standard Solar Models, ApJ, 835(2), 202.
- Viticchié et al. (2010) Viticchié, B., Del Moro, D., Criscuoli, S., & Berrilli, F., 2010. Imaging Spectropolarimetry with IBIS. II. On the Fine Structure of G-band Bright Features, ApJ, 723(1), 787–796.
- Vögler et al. (2005) Vögler, A., Shelyag, S., Schüssler, M., Cattaneo, F., Emonet, T., & Linde, T., 2005. Simulations of magneto-convection in the solar photosphere. Equations, methods, and results of the MURaM code, A&A, 429, 335–351.
- Vogt (1979) Vogt, S. S., 1979. A spectroscopic and photometric study of the star spot on HD 224085., PASP, 91, 616.
- Vogt & Penrod (1983) Vogt, S. S. & Penrod, G. D., 1983. Doppler imaging of spotted stars : application to the RS Canum Venaticorum star HR 1099., PASP, 95, 565–576.
- Vogt et al. (1987) Vogt, S. S., Penrod, G. D., & Hatzes, A. P., 1987. Doppler Images of Rotating Stars Using Maximum Entropy Image Reconstruction, ApJ, 321, 496.
- Vogt et al. (1999) Vogt, S. S., Hatzes, A. P., Misch, A. A., & Kürster, M., 1999. Doppler Imagery of the Spotted RS Canum Venaticorum Star HR 1099 (V711 Tauri) from 1981 to 1992, ApJS, 121(2), 547–589.
- Vrard et al. (2018) Vrard, M., Kallinger, T., Mosser, B., Barban, C., Baudin, F., Belkacem, K., & Cunha, M. S., 2018. Amplitude and lifetime of radial modes in red giant star spectra observed by Kepler, A&A, 616, A94.
- Wakeford et al. (2019) Wakeford, H. R., Lewis, N. K., Fowler, J., Bruno, G., Wilson, T. J., Moran, S. E., Valenti, J., Batalha, N. E., Filippazzo, J., Bourrier, V., Hörst, S. M., Lederer, S. M., & de Wit, J., 2019. Disentangling the Planet from the Star in Late-Type M Dwarfs: A Case Study of TRAPPIST-1g, AJ, 157(1), 11.
- Waldmeier (1955) Waldmeier, M., 1955. Ergebnisse und Probleme der Sonnenforschung..
- Walton et al. (2003) Walton, S. R., Preminger, D. G., & Chapman, G. A., 2003. A Statistical Analysis of the Characteristics of Sunspots and Faculae, Sol. Phys., 213(2), 301–317.
- Watanabe (2014) Watanabe, H., 2014. Observations of umbral dots and their physical models, PASJ, 66, S1.
- Watson et al. (2006) Watson, C. L., Henden, A. A., & Price, A., 2006. The International Variable Star Index (VSX), Society for Astronomical Sciences Annual Symposium, 25, 47.
- Watson et al. (2014) Watson, F. T., Penn, M. J., & Livingston, W., 2014. A Multi-instrument Analysis of Sunspot Umbrae, ApJ, 787(1), 22.
- Wedemeyer et al. (2013) Wedemeyer, S., Ludwig, H. G., & Steiner, O., 2013. Three-dimensional magnetohydrodynamic simulations of M-dwarf chromospheres, Astronomische Nachrichten, 334(1-2), 137–140.
- Wedemeyer-Böhm & Rouppe van der Voort (2009) Wedemeyer-Böhm, S. & Rouppe van der Voort, L., 2009. On the continuum intensity distribution of the solar photosphere, A&A, 503(1), 225–239.
- Wells et al. (2021) Wells, R. D., Rackham, B. V., Schanche, N., Petrucci, R., Gómez Maqueo Chew, Y., Demory, B. O., Burgasser, A. J., Burn, R., Pozuelos, F. J., Günther, M. N., Sabin, L., Schroffenegger, U., Gómez-Muñoz, M. A., Stassun, K. G., Van Grootel, V., Howell, S. B., Sebastian, D., Triaud, A. H. M. J., Apai, D., Plauchu-Frayn, I., Guerrero, C. A., Guillén, P. F., Landa, A., Melgoza, G., Montalvo, F., Serrano, H., Riesgo, H., Barkaoui, K., Bixel, A., Burdanov, A., Chen, W. P., Chinchilla, P., Collins, K. A., Daylan, T., de Wit, J., Delrez, L., Dévora-Pajares, M., Dietrich, J., Dransfield, G., Ducrot, E., Fausnaugh, M., Furlan, E., Gabor, P., Gan, T., Garcia, L., Ghachoui, M., Giacalone, S., Gibbs, A. B., Gillon, M., Gnilka, C., Gore, R., Guerrero, N., Henning, T., Hesse, K., Jehin, E., Jenkins, J. M., Latham, D. W., Lester, K., McCormac, J., Murray, C. A., Niraula, P., Pedersen, P. P., Queloz, D., Ricker, G., Rodriguez, D. R., Schroeder, A., Schwarz, R. P., Scott, N., Seager, S., Theissen, C. A., Thompson, S., Timmermans, M., Twicken, J. D., & Winn, J. N., 2021. A large sub-Neptune transiting the thick-disk M4 V TOI-2406, A&A, 653, A97.
- Wende et al. (2009) Wende, S., Reiners, A., & Ludwig, H. G., 2009. 3D simulations of M star atmosphere velocities and their influence on molecular FeH lines, A&A, 508(3), 1429–1442.
- Wheatley et al. (2018) Wheatley, P. J., West, R. G., Goad, M. R., Jenkins, J. S., Pollacco, D. L., Queloz, D., Rauer, H., Udry, S., Watson, C. A., Chazelas, B., Eigmüller, P., Lambert, G., Genolet, L., McCormac, J., Walker, S., Armstrong, D. J., Bayliss, D., Bento, J., Bouchy, F., Burleigh, M. R., Cabrera, J., Casewell, S. L., Chaushev, A., Chote, P., Csizmadia, S., Erikson, A., Faedi, F., Foxell, E., Gänsicke, B. T., Gillen, E., Grange, A., Günther, M. N., Hodgkin, S. T., Jackman, J., Jordán, A., Louden, T., Metrailler, L., Moyano, M., Nielsen, L. D., Osborn, H. P., Poppenhaeger, K., Raddi, R., Raynard, L., Smith, A. M. S., Soto, M., & Titz-Weider, R., 2018. The Next Generation Transit Survey (NGTS), MNRAS, 475(4), 4476–4493.
- White et al. (2018) White, T. R., Huber, D., Mann, A. W., Casagrande, L., Grunblatt, S. K., Justesen, A. B., Silva Aguirre, V., Bedding, T. R., Ireland, M. J., Schaefer, G. H., & Tuthill, P. G., 2018. Interferometric diameters of five evolved intermediate-mass planet-hosting stars measured with PAVO at the CHARA Array, MNRAS, 477(4), 4403–4413.
- Wilson (1979) Wilson, R. E., 1979. Eccentric orbit generalization and simultaneous solution of binary star light and velocity curves, ApJ, 234, 1054–1066.
- Wilson (1990) Wilson, R. E., 1990. Accuracy and efficiency in the binary star reflection effect, ApJ, 356, 613–622.
- Wilson (2012) Wilson, R. E., 2012. Spotted Star Light Curves with Enhanced Precision, AJ, 144, 73.
- Wilson & Devinney (1971) Wilson, R. E. & Devinney, E. J., 1971. Realization of Accurate Close-Binary Light Curves: Application to MR Cygni, ApJ, 166, 605–+.
- Winn et al. (2010) Winn, J. N., Fabrycky, D., Albrecht, S., & Johnson, J. A., 2010. Hot Stars with Hot Jupiters Have High Obliquities, ApJ, 718, L145–L149.
- Witzke et al. (2018) Witzke, V., Shapiro, A. I., Solanki, S. K., Krivova, N. A., & Schmutz, W., 2018. From solar to stellar brightness variations. The effect of metallicity, A&A, 619, A146.
- Witzke et al. (2020) Witzke, V., Reinhold, T., Shapiro, A. I., Krivova, N. A., & Solanki, S. K., 2020. Effect of metallicity on the detectability of rotational periods in solar-like stars, A&A, 634, L9.
- Witzke et al. (2022) Witzke, V., Shapiro, A. I., Kostogryz, N. M., Cameron, R., Rackham, B. V., Seager, S., Solanki, S. K., & Unruh, Y. C., 2022. Can 1D Radiative-equilibrium Models of Faculae Be Used for Calculating Contamination of Transmission Spectra?, ApJ, 941(2), L35.
- Witzke et al. (2023) Witzke, V., Duehnen, H. B., Shapiro, A. I., Przybylski, D., Bhatia, T. S., Cameron, R., & Solanki, S. K., 2023. Small-scale dynamo in cool stars. II. The effect of metallicity, A&A, 669, A157.
- Wöhl (1971) Wöhl, H., 1971. On Molecules in Sunspots, Sol. Phys., 16(2), 362–372.
- Wöhl et al. (1970) Wöhl, H., Wittmann, A., & Schröter, E. H., 1970. A complete photoelectric sunspot spectrum: An atlas from 3900 8000 Å, Sol. Phys., 13(1), 104–117.
- Wootten & Thompson (2009) Wootten, A. & Thompson, A. R., 2009. The Atacama Large Millimeter/Submillimeter Array, IEEE Proceedings, 97(8), 1463–1471.
- Wright et al. (2018) Wright, N. J., Newton, E. R., Williams, P. K. G., Drake, J. J., & Yadav, R. K., 2018. The stellar rotation-activity relationship in fully convective M dwarfs, MNRAS, 479(2), 2351–2360.
- Yadav & Mathew (2018) Yadav, R. & Mathew, S. K., 2018. Physical Properties of Umbral Dots Observed in Sunspots: A Hinode Observation, Sol. Phys., 293(4), 54.
- Yadav et al. (2015) Yadav, R. K., Christensen, U. R., Morin, J., Gastine, T., Reiners, A., Poppenhaeger, K., & Wolk, S. J., 2015. Explaining the Coexistence of Large-scale and Small-scale Magnetic Fields in Fully Convective Stars, ApJ, 813(2), L31.
- Yeo et al. (2013) Yeo, K. L., Solanki, S. K., & Krivova, N. A., 2013. Intensity contrast of solar network and faculae, A&A, 550, A95.
- Yeo et al. (2014a) Yeo, K. L., Feller, A., Solanki, S. K., Couvidat, S., Danilovic, S., & Krivova, N. A., 2014a. Point spread function of SDO/HMI and the effects of stray light correction on the apparent properties of solar surface phenomena, A&A, 561, A22.
- Yeo et al. (2014b) Yeo, K. L., Krivova, N. A., Solanki, S. K., & Glassmeier, K. H., 2014b. Reconstruction of total and spectral solar irradiance from 1974 to 2013 based on KPVT, SoHO/MDI, and SDO/HMI observations, A&A, 570, A85.
- Yeo et al. (2020) Yeo, K. L., Solanki, S. K., & Krivova, N. A., 2020. How faculae and network relate to sunspots, and the implications for solar and stellar brightness variations, Astronomy & Astrophysics, 639, A139.
- Yeo et al. (2020) Yeo, K. L., Solanki, S. K., Krivova, N. A., Rempel, M., Anusha, L. S., Shapiro, A. I., Tagirov, R. V., & Witzke, V., 2020. The Dimmest State of the Sun, Geophys. Res. Lett., 47(19), e90243.
- Yu et al. (2018) Yu, J., Huber, D., Bedding, T. R., Stello, D., Hon, M., Murphy, S. J., & Khanna, S., 2018. Asteroseismology of 16,000 Kepler Red Giants: Global Oscillation Parameters, Masses, and Radii, ApJS, 236(2), 42.
- Zakharov et al. (2005) Zakharov, V., Gandorfer, A., Solanki, S. K., & Löfdahl, M., 2005. A comparative study of the contrast of solar magnetic elements in CN and CH, A&A, 437(3), L43–L46.
- Zaleski et al. (2019) Zaleski, S. M., Valio, A., Marsden, S. C., & Carter, B. D., 2019. Differential rotation of Kepler-71 via transit photometry mapping of faculae and starspots, MNRAS, 484(1), 618–630.
- Zaleski et al. (2020) Zaleski, S. M., Valio, A., Carter, B. D., & Marsden, S. C., 2020. Activity and differential rotation of the early M dwarf Kepler-45 from transit mapping, MNRAS, 492(4), 5141–5151.
- Zellem et al. (2010) Zellem, R., Guinan, E. F., Messina, S., Lanza, A. F., Wasatonic, R., & McCook, G. P., 2010. Multiband Photometry of the Chromospherically Active & Spotted Binary System IM Peg—the Guide Star for the Gravity Probe B Mission, PASP, 122(892), 670.
- Zellem et al. (2017) Zellem, R. T., Swain, M. R., Roudier, G., Shkolnik, E. L., Creech-Eakman, M. J., Ciardi, D. R., Line, M. R., Iyer, A. R., Bryden, G., Llama, J., & Fahy, K. A., 2017. Forecasting the Impact of Stellar Activity on Transiting Exoplanet Spectra, ApJ, 844(1), 27.
- Zellem et al. (2019) Zellem, R. T., Swain, M. R., Cowan, N. B., Bryden, G., Komacek, T. D., Colavita, M., Ardila, D., Roudier, G. M., Fortney, J. J., Bean, J., Line, M. R., Griffith, C. A., Shkolnik, E. L., Kreidberg, L., Moses, J. I., Showman, A. P., Stevenson, K. B., Wong, A., Chapman, J. W., Ciardi, D. R., Howard, A. W., Kataria, T., Kempton, E. M. R., Latham, D., Mahadevan, S., Meléndez, J., & Parmentier, V., 2019. Constraining Exoplanet Metallicities and Aerosols with the Contribution to ARIEL Spectroscopy of Exoplanets (CASE), PASP, 131(1003), 094401.
- Zellem et al. (2020) Zellem, R. T., Pearson, K. A., Blaser, E., Fowler, M., Ciardi, D. R., Biferno, A., Massey, B., Marchis, F., Baer, R., Ball, C., Chasin, M., Conley, M., Dixon, S., Fletcher, E., Hernandez, S., Nair, S., Perian, Q., Sienkiewicz, F., Tock, K., Vijayakumar, V., Swain, M. R., Roudier, G. M., Bryden, G., Conti, D. M., Hill, D. H., Hergenrother, C. W., Dussault, M., Kane, S. R., Fitzgerald, M., Boyce, P., Peticolas, L., Gee, W., Cominsky, L., Zimmerman-Brachman, R., Smith, D., Creech-Eakman, M. J., Engelke, J., Iturralde, A., Dragomir, D., Jovanovic, N., Lawton, B., Arbouch, E., Kuchner, M., & Malvache, A., 2020. Utilizing Small Telescopes Operated by Citizen Scientists for Transiting Exoplanet Follow-up, PASP, 132(1011), 054401.
- Zhang et al. (2019) Zhang, M., Chachan, Y., Kempton, E. M. R., & Knutson, H. A., 2019. Forward Modeling and Retrievals with PLATON, a Fast Open-source Tool, PASP, 131(997), 034501.
- Zhang & Showman (2014) Zhang, X. & Showman, A. P., 2014. Atmospheric Circulation of Brown Dwarfs: Jets, Vortices, and Time Variability, ApJ, 788(1), L6.
- Zhang et al. (2018) Zhang, Z., Zhou, Y., Rackham, B. V., & Apai, D., 2018. The Near-infrared Transmission Spectra of TRAPPIST-1 Planets b, c, d, e, f, and g and Stellar Contamination in Multi-epoch Transit Spectra, AJ, 156(4), 178.
- Ziegler et al. (2017) Ziegler, C., Law, N. M., Morton, T., Baranec, C., Riddle, R., Atkinson, D., Baker, A., Roberts, S., & Ciardi, D. R., 2017. Robo-AO Kepler Planetary Candidate Survey. III. Adaptive Optics Imaging of 1629 Kepler Exoplanet Candidate Host Stars, AJ, 153(2), 66.
- Ziegler et al. (2020) Ziegler, C., Tokovinin, A., Briceño, C., Mang, J., Law, N., & Mann, A. W., 2020. SOAR TESS Survey. I. Sculpting of TESS Planetary Systems by Stellar Companions, AJ, 159(1), 19.
Appendix A Acronyms Used
For convenience, Table 5 lists the acronyms and abbreviations used in this review.
| Acronym or Abbreviation | Definition |
|---|---|
| 3D | Three-dimensional |
| ALMA | Atacama Large Millimeter/submillimeter Array |
| ASAS-SN | All Sky Automated Survey for SuperNovae |
| BFI | Broadband Filter Imager |
| CASE | Contribution to Ariel Spectroscopy of Exoplanets |
| CHARA | Center for High Angular Resolution Astronomy |
| CLASP | Chromospheric Lyman-Alpha Spectro-Polarimeter |
| CO5BOLD | COnservative COde for the COmputation of COmpressible COnvection in a BOx of L Dimensions, L=2,3 |
| CoRoT | Convection, Rotation, and planetary Transits |
| CLV | center-to-limb variation |
| DASCH | Digital Access to a Sky Century @ Harvard |
| DKIST | Daniel K. Inouye Solar Telescope |
| DI | Doppler imaging |
| EUV | extreme ultraviolet |
| ExoFOP | Exoplanet Follow-up Observing Program |
| ExoPAG | Exoplanet Exploration Program Analysis Group |
| GOES | Geostationary Operational Environmental Satellites |
| HabEx | Habitable Exoplanet Observatory |
| HARPS-N | High Accuracy Radial velocity Planet Searcher for the Northern hemisphere |
| HD | hydrodynamic |
| HST | Hubble Space Telescope |
| IRIS | Interface Region Imaging Spectrograph |
| ISS | International Space Station |
| JWST | James Webb Space Telescope |
| KELT | Kilodegree Extremely Little Telescope |
| Kepler | Kepler Space Telescope |
| LTE | local thermodynamic equilibrium |
| LUVOIR | Large UV/Optical/IR Surveyor |
| MCMC | Markov chain Monte Carlo |
| MHD | magnetohydrodynamic |
| MHS | millionths of the hemisphere of the Sun |
| MIRC-X | Michigan InfraRed Combiner-eXeter |
| MURaM | Max-Planck-Institute for Aeronomy/ University of Chicago Radiation Magneto-hydrodynamics code |
| NASA | National Aeronautics and Space Administration |
| NIR | near infrared |
| NPOI | Navy Precision Optical Interferometer |
| NSF | National Science Foundation |
| OMI | Ozone Monitoring Experiment |
| PCH | photospheric and chromospheric heterogeneities |
| PIONIER | Precision Integrated Optics Near Infrared ExpeRiment |
| ppm | parts per million |
| ppt | parts per thousand |
| PLATO | PLAnetary Transit and Oscillations |
| PSPT | Precision Solar Photometric Telescope |
| RMS | root mean square |
| RV | radial velocity |
| SAG21 | Study Analysis Group 21 |
| SATIRE | Spectral And Total Irradiance REconstruction |
| SDO | Solar Dynamics Observatory |
| SED | spectral energy distribution |
| SOHO | Solar and Heliospheric Observatory |
| SOLIS | Synoptic Long-term Investigations of the Sun |
| SORCE | Solar Radiation and Climate Experiment |
| SOT | Solar Optical Telescope |
| SPICA | Stellar Parameters and Images with a Cophased Array |
| Spitzer | Spitzer Space Telescope |
| SST | Swedish Solar Tower |
| SUIT | Solar Ultraviolet Imaging Telescope |
| SUVI | Solar Ultraviolet Imager |
| TESS | Transiting Exoplanet Survey Satellite |
| TOI | TESS Object of Interest |
| TIM | Total Irradiance Monitor |
| TLSE | transit light source effect |
Acronyms and abbreviations used in this review. Acronym or Abbreviation Definition TSI total solar irradiance UV ultraviolet VIRGO Variability of solar IRradiance and Gravity Oscillations VISION Visible Imaging System for Interferometric Observations VLTI Very Large Telescope Interferometer WASP Wide Angle Search for Planets ZDI Zeeman–Doppler imaging