Briefings in Bioinformatics \DOIDOI HERE \accessAdvance Access Publication Date: Day Month Year \appnotesProblem Solving Protocol
Liu et al.
[]Corresponding author: Bin Liu, E-mail:liubin@cqupt.edu.cn
0Year 0Year 0Year
Multiple Similarity Drug-Target Interaction Prediction with Random Walks and Matrix Factorization
Abstract
The discovery of drug-target interactions (DTIs) is a very promising area of research with great potential. The accurate identification of reliable interactions among drugs and proteins via computational methods, which typically leverage heterogeneous information retrieved from diverse data sources, can boost the development of effective pharmaceuticals. Although random walk and matrix factorization techniques are widely used in DTI prediction, they have several limitations. Random walk-based embedding generation is usually conducted in an unsupervised manner, while the linear similarity combination in matrix factorization distorts individual insights offered by different views. To tackle these issues, we take a multi-layered network approach to handle diverse drug and target similarities, and propose a novel optimization framework, called Multiple similarity DeepWalk-based Matrix Factorization (MDMF), for DTI prediction. The framework unifies embedding generation and interaction prediction, learning vector representations of drugs and targets that not only retain higher-order proximity across all hyper-layers and layer-specific local invariance, but also approximate the interactions with their inner product. Furthermore, we develop an ensemble method (MDMF2A) that integrates two instantiations of the MDMF model, optimizing the area under the precision-recall curve (AUPR) and the area under the receiver operating characteristic curve (AUC) respectively. The empirical study on real-world DTI datasets shows that our method achieves statistically significant improvement over current state-of-the-art approaches in four different settings. Moreover, the validation of highly ranked non-interacting pairs also demonstrates the potential of MDMF2A to discover novel DTIs.
keywords:
drug-target interaction prediction, random walks, matrix factorization, multiple similarity, multiplex heterogeneous network1 Introduction
The main objective of the drug discovery process is to identify drug-target interactions (DTIs) among numerous candidates. Although in vitro experimental testing can verify DTIs, it suffers from extremely high time and monetary costs. Computational (in silico) methods employ machine learning techniques Bagherian2021MachinePaper , such as matrix factorization (MF) Ezzat2017Drug-targetFactorization , kernel-based models Ding2020IdentificationFusion , graph/network embedding An2021AInteractions , and deep learning Xuan2021IntegratingPrediction , to efficiently infer a small amount of candidate drugs. This vastly shrinks the search scope and reduces the workload of experiment-based verification, thereby accelerating the drug discovery process significantly.
In the past, the chemical structure of drugs and the protein sequence of targets were the main source of information for inferring candidate DTIs Liu2021Drug-targetRecovery ; Liu2016NeighborhoodPrediction ; Pliakos2021PredictingPartitioning . Recently, with the advancements in clinical medical technology, abundant drug and target-related biological data from multifaceted sources are exploited to boost the accuracy of DTI prediction. Some MF and kernel-based methods utilize multiple types of drug and target similarities derived from heterogeneous information by integrating them into a single drug and target similarity Zheng2013CollaborativeInteractions ; Ding2020IdentificationFusion ; liu2021optimizing ; Olayan2018DDR:Approaches , but in doing so discard the distinctive information possessed by each similarity view.
In contrast, network-based approaches consider the diverse drug and target data as a (multiplex) heterogeneous DTI network that describes multiple aspects of drug and target relations, and learn topology-preserving representations of drugs and targets to facilitate DTI prediction. With deep neural networks showing consistently superior performance in the latest years in a plethora of different learning tasks, their adoption in the DTI prediction field, especially inferring new DTIs by mining DTI networks, is understandably rising Wan2019NeoDTI:Interactions ; Xuan2021IntegratingPrediction ; chen2022SupDTI ; chen2022DCFME . Although deep learning models achieve improved performance, they require larger amounts of data and are computationally intensive Bagherian2021MachinePaper . In addition, most deep learning models, are sensitive to noise dai_adversarial_2018 . This is very important in DTI prediction, since there are many undiscovered interactions in the bipartite network of drugs and targets Liu2021Drug-targetRecovery ; Pliakos2020Drug-targetReconstruction ; Ezzat2017Drug-targetFactorization .
Apart from deep learning, another type of network-based model widely used in DTI prediction computes graph embeddings based on random walks Luo2017AInformation ; An2021AInteractions . Although these methods can model high-order node proximity efficiently, they typically perform embedding generation and interaction prediction as two independent tasks. Hence, their embeddings are learned in an unsupervised manner, failing to preserve the topology information from the interaction network.
Random walk embedding methods are essentially factorizing a matrix capturing node co-occurrences within random walk sequences generated from the graph qiu2018network —allowing to unify embedding generation and interaction prediction under a common MF framework. Nevertheless, the MF method proposed in qiu2018network that approximates DeepWalk Perozzi2014DeepWalk:Representations can only handle single-layer networks. Thus, it is unable to fully exploit the topology information of multiple drug and target layers present in multiplex heterogeneous DTI networks. Furthermore, the area under the precision-recall curve (AUPR) and the area under the receiver operating characteristic curve (AUC) are two important evaluation metrics in DTI prediction, but no network-based approach directly optimizes them.
To address the issues mentioned above, we propose the formulation of a DeepWalk-based MF model, called Multiple similarity DeepWalk-based Matrix Factorization (MDMF), which incorporates multiplex heterogeneous DTI network embedding generation and DTI prediction within a unified optimization framework. It learns vector representations of drugs and targets that not only capture the multilayer network topology via factorizing the hyper-layer DeepWalk matrix with information from diverse data sources, but also preserve the layer-specific local invariance with the graph Laplacian for each drug and target similarity view. In addition, the DeepWalk matrix contains richer interaction information, exploiting high-order node proximity and implicitly recovering the possible missing interactions. Based on this formulation, we instantiate two models that leverage surrogate losses to optimize two essential evaluation measures in DTI prediction, namely AUPR and AUC. In addition, we integrate the two models to consider the maximization of both metrics. Experimental results on DTI datasets under various prediction settings show that the proposed method outperforms state-of-the-art approaches and can discover new reliable DTIs.
2 Preliminaries
2.1 Problem Formulation
Given a drug set and a target set , the relation between drugs (targets) can be assessed in various aspects, which are represented by a set of similarity matrices (), where () and () is the number of relation types for drugs (targets). In addition, let the binary matrix indicate the interactions between drugs in and targets in , where denotes that and interact with each other, and otherwise. A DTI dataset for and consists of , and .
Let (,) be a test drug-target pair, be a set of -dimensional vectors storing the similarities between and , and be a set of -dimensional vectors storing the similarities between and . A DTI prediction model predicts a real-valued score indicating the confidence of the affinity between and . In addition, (), which does not belong to the training set, is considered as the new drug (target). There are four prediction settings according to whether the drug and target involved in the test pair are training entities Pahikkala2015TowardPredictions :
-
•
S1: predict the interaction between and ;
-
•
S2: predict the interaction between and ;
-
•
S3: predict the interaction between and ;
-
•
S4: predict the interaction between and .
2.2 Matrix Factorization for DTI Prediction
In DTI prediction, MF methods typically learn two vectorized representations of drugs and targets that approximate the interaction matrix by minimizing the following objective:
| (1) |
where is the predicted interaction matrix, is either the identity function for standard MF Ezzat2017Drug-targetFactorization or the element-wise logistic function for Logistic MF Liu2016NeighborhoodPrediction , and , are -dimensional drug and target latent features (embeddings), respectively. The objective in Eq. (1) includes two parts: is the loss function to evaluate the inconsistency between the predicted and ground truth interaction matrix, and concerns the regularization of the learned embeddings.
Given a test drug-target pair (), its prediction with a specific instantiation of is computed based on the embeddings of () and ():
| (2) |
2.3 DeepWalk Embeddings as Matrix Factorization
DeepWalk Perozzi2014DeepWalk:Representations is a network embedding approach, which generates a number of random walks over a graph to capture proximity among nodes. Qiu et al. qiu2018network proved that the DeepWalk model could be interpreted as a matrix factorization task when the length of random walk approaches infinity. In particular, they introduced NetMF, a model that approximates DeepWalk to learn embeddings of a network containing nodes by factorizing the DeepWalk matrix defined as:
| (3) |
where is the adjacency matrix of , , is a diagonal matrix with row sum of , is the window size of the random walk controlling the number of context nodes, plays the same role as the number of negative samples in DeepWalk, while the function guarantees that all elements in being non-negative. Considering the symmetry of for undirected networks, the factorization of the DeepWalk matrix could be expressed as , where represents the -dimensional network embeddings.
3 Materials and Methods
3.1 Datasets
Two types of DTI datasets, constructed based on online biological and pharmaceutical databases, are used in this study. Their characteristics are shown in Table 1.
| Dataset | Sparsity | |||||
|---|---|---|---|---|---|---|
| NR | 54 | 26 | 166 | 0.118 | 4 | 4 |
| GPCR | 223 | 95 | 1096 | 0.052 | ||
| IC | 210 | 204 | 2331 | 0.054 | ||
| E | 445 | 664 | 4256 | 0.014 | ||
| Luo | 708 | 1512 | 1923 | 0.002 | 4 | 3 |
The first one is a collection of four golden standard datasets constructed by Yamanishi et al. Yamanishi2008PredictionSpaces , each one corresponding to a target protein family, namely Nuclear Receptors (NR), Ion Channel (IC), G-protein coupled receptors (GPCR), and Enzyme (E). Because the interactions in these datasets were discovered 14 years ago, we updated them by adding newly discovered interactions between drugs and targets in these datasets recorded in the last version of KEGG Kanehisa2017KEGG:Drugs , DrugBank Wishart2018DrugBank2018 , and ChEMBL Mendez2019ChEMBL:Data databases. Details on new DTIs collection can be found in Supplementary Section A1. Four types of drug similarities, including SIMCOMP Hattori2003DevelopmentPathways built upon chemical structures, AERS-freq, AERS-bit Takarabe2012DrugApproach and SIDER Kuhn2016TheEffects derived from drug side effects, as well as four types of target similarities, namely gene ontology (GO) term based semantic similarity, Normalized Smith–Waterman (SW), spectrum kernel with 3-mers length (SPEC-k3), and 4-mers length (SPEC-k4) based amino acid sequence similarities, obtained from Nascimento2016APrediction are utilized to describe diverse drug and target relations, since they possess higher local interaction consistency liu2021optimizing .
The second one provided by Luo et al. Luo2017AInformation (denoted as Luo), was built in 2017, includes DTIs and drug-drug interactions (DDI) obtained from DrugBank 3.0 Wishart2018DrugBank2018 , as well as drug side effect (SE) associations, protein–protein interactions (PPI) and disease-related associations extracted from SIDER Kuhn2016TheEffects , HPRD KeshavaPrasad2009HumanUpdate , and Comparative Toxicogenomics Database Davis2013The2013 , respectively. Based on diverse drug and target interaction/association profiles, three drug similarities derived from DDI, SE, and drug-disease associations as well as two target similarities derived from PPI and target-disease associations are computed. The Jaccard similarity coefficient is employed to assess the similarity of drugs, SEs or diseases (proteins or diseases) associated/interacted with two drugs (targets). In addition, drug similarity based on chemical structure and target similarity based on genome sequence are also computed. Therefore, four drug similarities and three target similarities are used for this dataset.
3.2 Multiple Similarity DeepWalk-based Matrix Factorization
A DTI dataset, associated with multiple drug and target similarities, can be viewed as a multiplex heterogeneous network . This can be done by treating drugs and targets as two types of vertices, and by considering non-zero similarities and interactions as edges connecting two homogeneous and heterogeneous entities respectively, where the weight of each edge equals the corresponding similarity or interaction value. In a DTI dataset, the interaction matrix is typically more sparse than similarity matrices, causing that similarity derived edges linking two drugs (targets) markedly outnumber more crucial bipartite interaction edges. To balance the distribution of different types of edges and stress relations of more similar entities in the DTI network, we replace each original dense similarity matrix with the sparse adjacency matrix of its corresponding -nearest neighbors (-NNs) graph. Specifically, given a similarity matrix , its sparsified matrix is defined as:
| (4) |
where is the set of the -NNs of based on similarity .
Formally, consists of three parts: (i) , which is a multiplex drug subnetwork containing layers, with being the adjacency matrix of the -th drug layer; (ii) , which is a multiplex target subnetwork including layers with denoting the adjacency matrix of the -th target layer; (iii) , which is a bipartite interaction subnetwork connecting drug and target nodes in each layer. Figure 1a depicts an example DTI network.
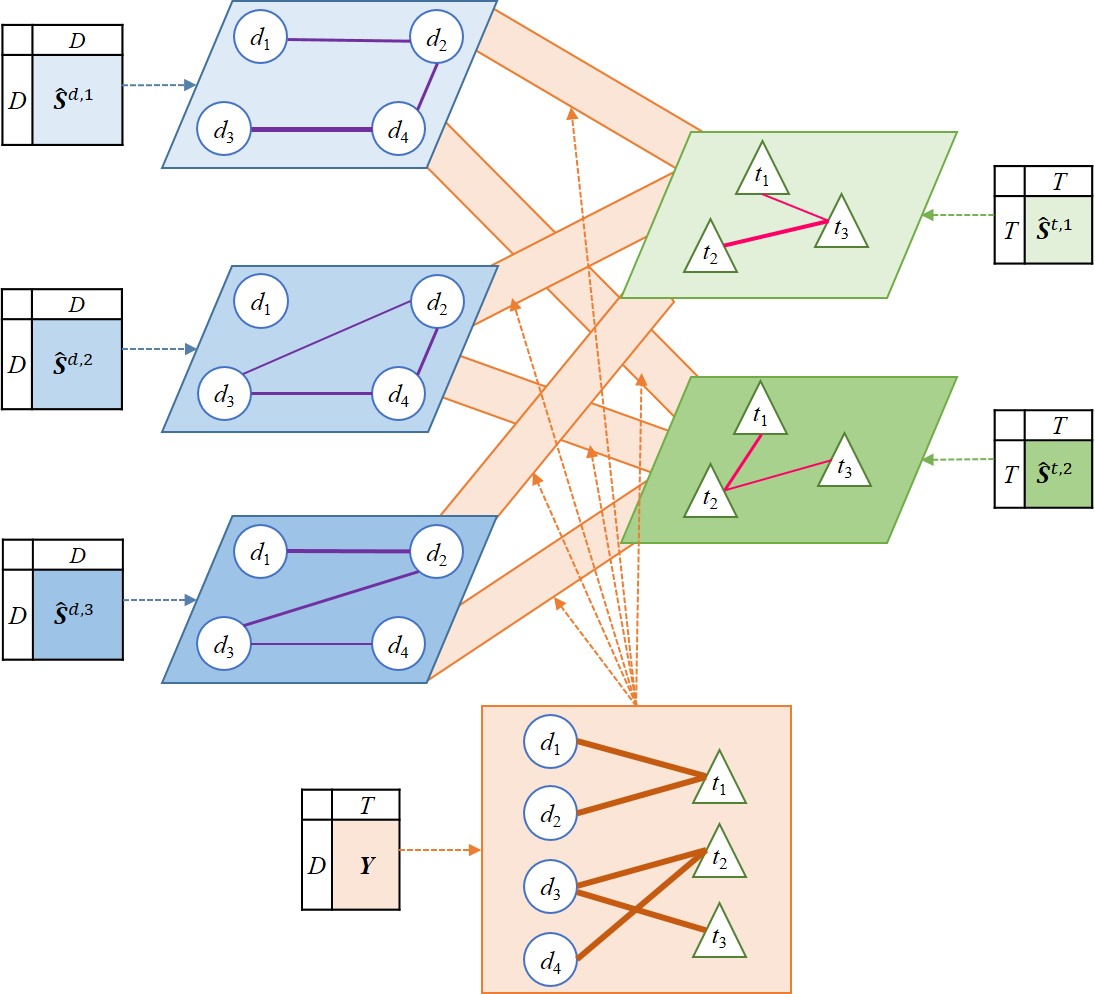
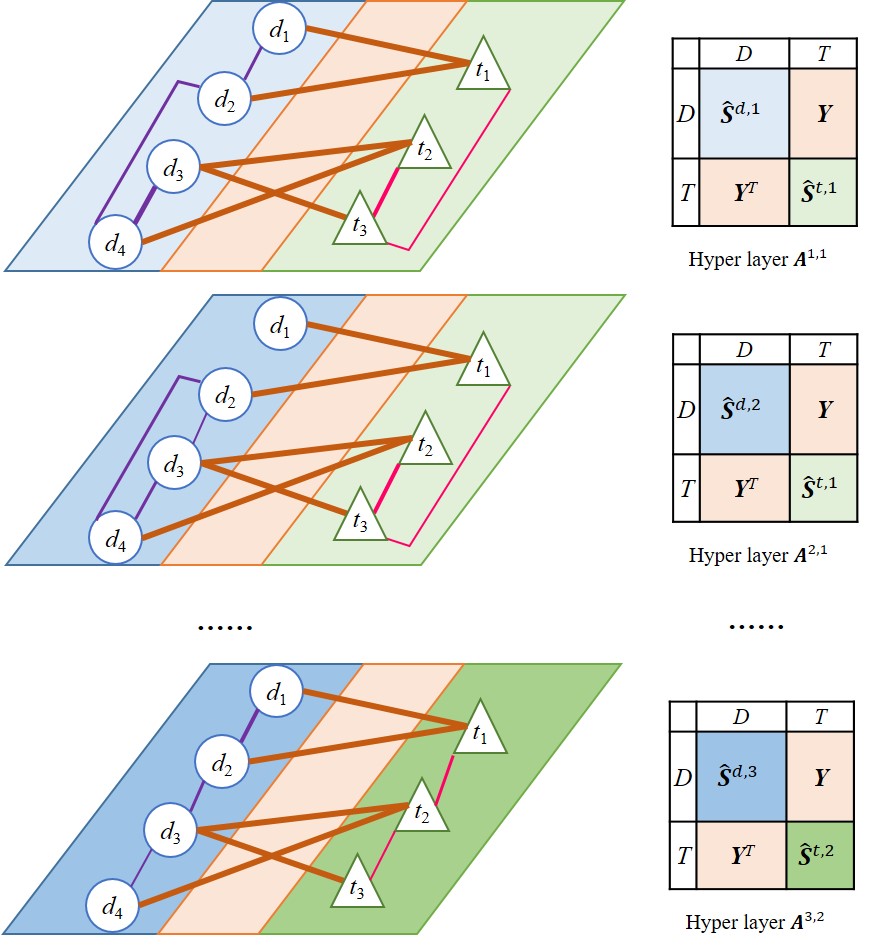
The DeepWalk matrix cannot be directly calculated for the complex DTI network that includes two multiplex and a bipartite subnetwork. To facilitate its computation, we consider each combination of a drug and a target layer along with the interaction subnetwork as a hyper-layer, and reformulate the DTI network as a multiplex network containing hyper-layers. The hyper-layer incorporating the -th drug layer and -th target layer, is defined by the adjacency matrix , upon which could be expressed as a set of hyper-layers . Figure 1b illustrates the multiple hyper-layer network corresponding to the original DTI network in Figure 1a.
Based on the above reformulation, we compute a DeepWalk matrix for each using Eq. (3), which reflects node co-occurrences in truncated random walks and captures richer proximity among nodes than the original hyper-layer—especially the proximity between unlinked nodes. In particular, if a pair of unlinked drug and target in has a certain level of proximity (none zero value) in , the corresponding relation represented by the DeepWalk matrix could be interpreted as the recovery of their missing interaction, which supplements the incomplete interaction information and reduces the noise in the original dataset. See an example in Supplementary Section A2.1.
In order to mine multiple DeepWalk matrices effectively, we define a unified DeepWalk matrix for the whole DTI network by aggregating every :
| (5) |
where and are weights of -th drug and -th target layers respectively with and . In Eq. (5), the importance of each hyper-layer is determined by multiplying the weights of its involved drug and target layers. This work employs the local interaction consistency (LIC)-based similarity weight, which assesses the proportion of proximate drugs (targets) having the same interactions, and has been found more effective than other similarity weights for DTI prediction liu2021optimizing . More details on LIC weights can be found in Supplementary Section A2.2.
Let be the vertical concatenation of drug and target embeddings. We encourage to approximate , which enables the learned embeddings to capture the topology information characterized by the holistic DeepWalk matrix. Hence, we derive the DeepWalk regularization term that diminishes the discrepancy between and :
| (6) |
Considering that the adjacency matrix includes four blocks, and could be divided into four blocks accordingly:
| (7) |
Thus, can be expressed as the sum of norms of these blocks:
| (8) | ||||
However, aggregating all per-layer DeepWalk matrices to the holistic one inevitably leads to substantial loss of layer-specific topology information. To address this limitation, we employ graph regularization for each sparsified drug (target) layer to preserve per layer drug (target) proximity in the embedding space, i.e., similar drugs (targets) in each layer are likely to have similar latent features. To distinguish the utility of each layer, each graph regularization is multiplied by the LIC-based weight of its corresponding layer, which emphasizes the proximity of more reliable similarities. Furthermore, Tikhonov regularization is added to prevent latent features from overfitting the training set.
By replacing in Eq. (1) with the above regularization terms, we arrive to the objective of MDMF:
| (9) | ||||
where and are graph Laplacian matrices of and respectively, , , , and are regularization coefficients. Eq. (9) can be solved by updating and alternatively Liu2016NeighborhoodPrediction ; Ezzat2017Drug-targetFactorization , using an optimization algorithm, e.g., gradient descent (GD) or AdaGrad Duchi2011AdaptiveOptimization . The details for the optimization procedure of MDMF are provided in Supplementary Section A2.3.
3.3 Optimizing the Area Under the Curve with MDMF
3.3.1 Area Under the Curve Loss Functions
AUPR and AUC are two widely used area under the curve metrics in DTI prediction. Modeling differentiable surrogate losses that optimize these two metrics can lead to improvements in predicting performance liu2021optimizing . Therefore, we instantiate the loss function in Eq. (9) with AUPR and AUC losses, and derive two DeepWalk-based MF models, namely MDMFAUPR and MDMFAUC, that optimize the AUPR and AUC metrics, respectively.
Given and its predictions , which are sorted in descending order according to their predicted scores, AUPR without the interpolation to estimate the curve is computed as:
| (10) |
where Prec is the precision of the first predictions, InRe is the incremental recall from rank -1 to . In addition, histogram binning Revaud2019LearningLoss , which assigns predictions into ordered bins, is employed to simulate the non-differentiable and non-smooth sorting operation used to rank predictions, deriving differential precision and incremental recall as:
| (11) |
| (12) |
where is the soft assignment function which returns the membership degree of each prediction to the -th bin, i.e., , where is the center of the -th bin, and is the bin width. Considering that maximizing AUPR is equivalent to minimizing , we obtain the differential AUPR loss according to Eq. (10)-(12):
| (13) |
The objective of MDMFAUPR is given by using to replace in Eq. (9).
AUC, which assesses the proportion of correctly ordered tuples, where the interacting drug-target pairs have higher prediction than the non-interacting ones, is defined as:
| (14) |
where predictions with , and is the Cartesian product of and . To maximize AUC, we need to minimize the proportion of wrongly ordered tuples, where the prediction of the interacting pair is lower than the non-interacting one. In order to make the AUC loss to be optimized easily, the discontinuous indicator function is substituted by a convex approximate function, i.e., , and the derived convex AUC loss is:
| (15) |
where . With the substitution of with in Eq. (9), we obtain the objective of MDMFAUC.
More details for optimizing the AUPR and AUC losses can be found in Supplementary Section A2.4.
3.3.2 Inferring Embeddings of New Entities
When a new drug (target) arrives, MDMFAUPR and MDMFAUC infer its embeddings using its neighbors in the training set. Given a new drug, we first compute its similarities with all training drugs in based on its chemical structure, side effects, etc. Then, we linearly integrate the different types of similarity with LIC-based weights to obtain the fused similarity vector:
| (16) |
where is an unseen entity with denoting a new drug and indicating a novel target, and is the fused similarity vector of . Based on , we retrieve the -NNs of from the training set, denoted as , and estimate the embeddings of as follows:
| (17) |
where is the similarity between and , () is the rank of () among (), e.g., if is the second nearest training drug of , and is the decay coefficient shrinking the weight of further neighbors, which is an important parameter to control the embedding aggregation. In addition, we employ a pseudo embedding based selection strategy liu2021optimizing to choose the optimal values from a set of candidate for prediction settings involving new drugs or/and new targets, i.e., S2, S3, and S4, respectively. In MDMFAUPR, the value leading to the best AUPR result is used, while the optimal in MDMFAUC is the one achieving the best AUC result.
3.3.3 MDMF2A: Combining AUPR and AUC
It is known that both AUPR and AUC play a vital role in DTI prediction. However, MDMFAUPR and MDMFAUC only optimize one measure but ignore the other. To overcome this limitation, we propose an ensemble approach, called DWFM2A, which integrates the two MF models by aggregating their predicted scores. Given a test pair , along with its predicted scores and obtained from MDMFAUPR and MDMFAUC respectively, the final prediction output by MDMF2A is defined as:
| (18) |
where is the trade-off coefficient for the two MF base models, and converts and into the same scale, i.e., . The flowchart of MDMF2A is shown in Figure 2.
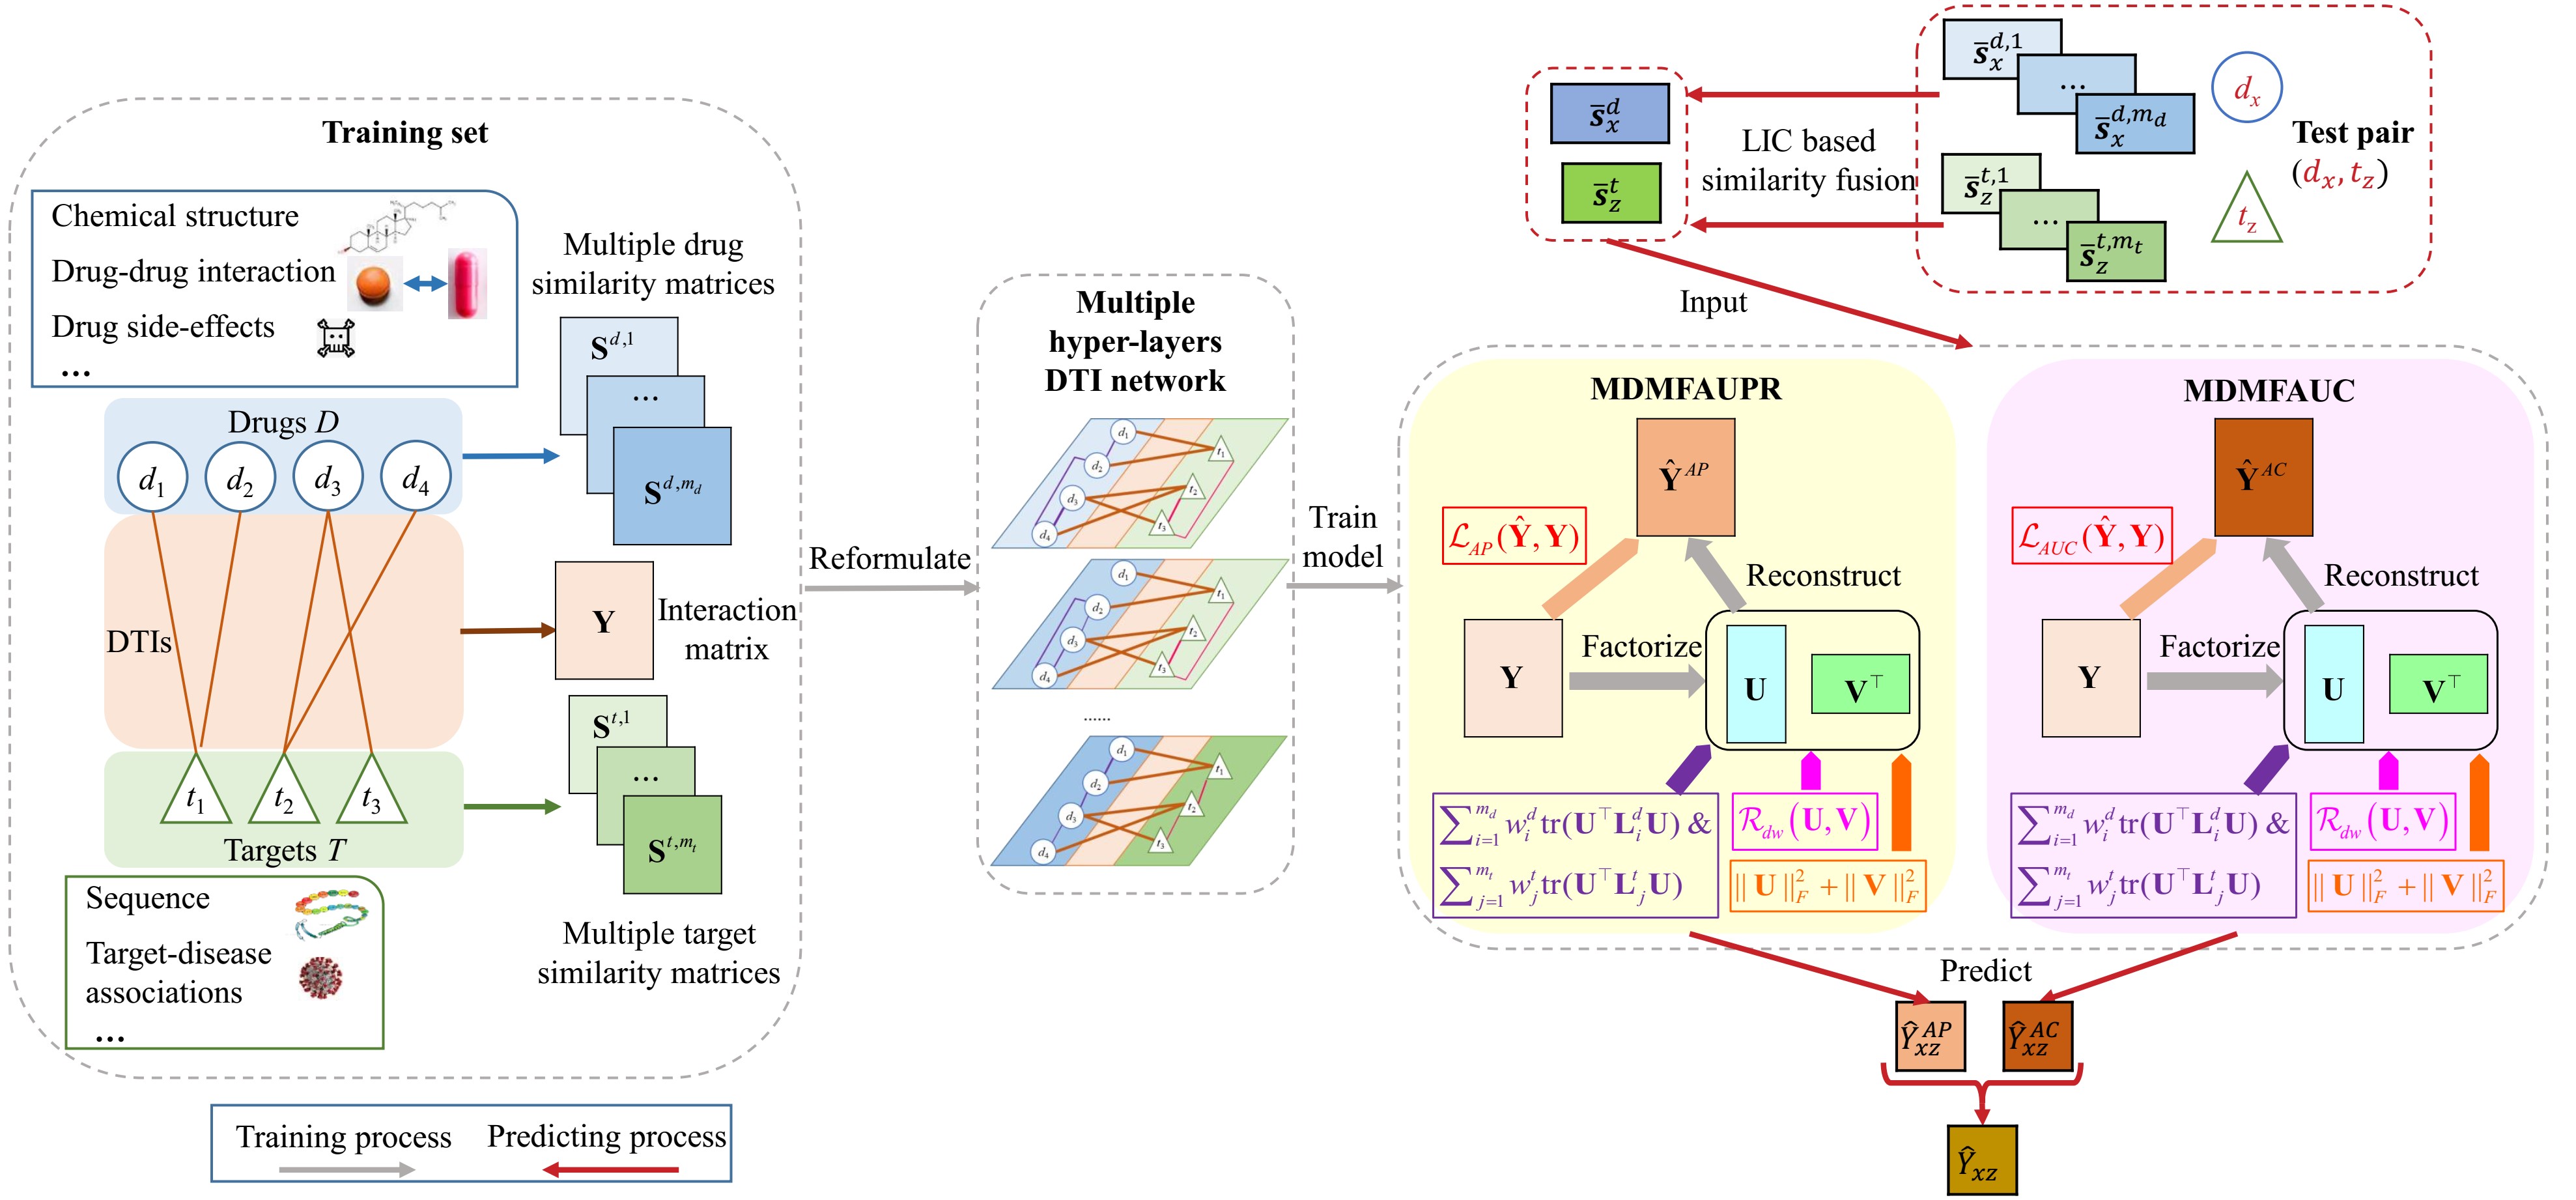
The computational complexity analysis of the proposed methods can be found in Supplementary Section A2.5.
4 Experimental Evaluation and Discussion
4.1 Experimental Setup
| Setting | Dataset | WkNNIR | MSCMF | NRMFL | GRGMF | MF2A | DRLSM | DTINet | NEDTP | NetMF | Multi2Vec | MDMF2A |
| S1 | NR | - | 0.628(6) | 0.64(5) | 0.658(3) | 0.673(2) | 0.642(4) | 0.508(8) | 0.546(7) | 0.455(9) | 0.43(10) | 0.675(1) |
| GPCR | - | 0.844(4.5) | 0.86(3) | 0.844(4.5) | 0.87(2) | 0.835(6) | 0.597(10) | 0.798(8) | 0.831(7) | 0.747(9) | 0.874(1) | |
| IC | - | 0.936(3) | 0.934(4) | 0.913(7) | 0.943(2) | 0.914(6) | 0.693(10) | 0.906(8) | 0.929(5) | 0.867(9) | 0.946(1) | |
| E | - | 0.818(6) | 0.843(3) | 0.832(4) | 0.858(2) | 0.811(7) | 0.305(10) | 0.78(8) | 0.831(5) | 0.736(9) | 0.859(1) | |
| Luo | - | 0.599(6) | 0.603(5) | 0.636(3) | 0.653(2) | 0.598(7) | 0.216(9) | 0.08(10) | 0.615(4) | 0.451(8) | 0.679(1) | |
| - | 5.1 | 4 | 4.3 | 2 | 6 | 9.4 | 8.2 | 6 | 9 | 1 | ||
| S2 | NR | 0.562(5) | 0.531(7) | 0.547(6) | 0.564(4) | 0.578(2) | 0.57(3) | 0.339(10) | 0.486(8) | 0.34(9) | 0.338(11) | 0.602(1) |
| GPCR | 0.54(4) | 0.472(7) | 0.508(6) | 0.542(3) | 0.551(2) | 0.532(5) | 0.449(9) | 0.451(8) | 0.356(10) | 0.254(11) | 0.561(1) | |
| IC | 0.491(4) | 0.379(8.5) | 0.479(5) | 0.493(3) | 0.495(2) | 0.466(6) | 0.365(10) | 0.407(7) | 0.379(8.5) | 0.16(11) | 0.502(1) | |
| E | 0.405(4) | 0.288(8) | 0.389(5) | 0.415(3) | 0.422(2) | 0.376(6) | 0.173(10) | 0.33(7) | 0.269(9) | 0.141(11) | 0.428(1) | |
| Luo | 0.485(2) | 0.371(8) | 0.458(6) | 0.462(5) | 0.472(4) | 0.502(1) | 0.187(9) | 0.077(11) | 0.376(7) | 0.079(10) | 0.48(3) | |
| 3.8 | 7.7 | 5.6 | 3.6 | 2.4 | 4.2 | 9.6 | 8.2 | 8.7 | 10.8 | 1.4 | ||
| S3 | NR | 0.56(3) | 0.505(7) | 0.519(6) | 0.545(5) | 0.588(1) | 0.546(4) | 0.431(8) | 0.375(9) | 0.359(10) | 0.335(11) | 0.582(2) |
| GPCR | 0.774(3) | 0.69(7) | 0.729(6) | 0.755(5) | 0.787(2) | 0.757(4) | 0.546(10) | 0.684(8) | 0.638(9) | 0.327(11) | 0.788(1) | |
| IC | 0.861(3) | 0.827(7) | 0.838(6) | 0.851(5) | 0.863(2) | 0.855(4) | 0.599(10) | 0.8(8) | 0.791(9) | 0.4(11) | 0.865(1) | |
| E | 0.728(3) | 0.623(8) | 0.711(6) | 0.715(4) | 0.731(2) | 0.712(5) | 0.313(10) | 0.615(9) | 0.656(7) | 0.257(11) | 0.738(1) | |
| Luo | 0.243(5) | 0.08(8) | 0.204(7) | 0.234(6) | 0.292(3) | 0.248(4) | 0.061(9) | 0.046(10) | 0.294(2) | 0.027(11) | 0.299(1) | |
| 3.4 | 7.4 | 6.2 | 5 | 2 | 4.2 | 9.4 | 8.8 | 7.4 | 11 | 1.2 | ||
| S4 | NR | 0.309(1) | 0.273(6) | 0.278(5) | 0.308(2) | 0.289(3) | 0.236(8) | 0.249(7) | 0.16(9) | 0.146(11) | 0.149(10) | 0.286(4) |
| GPCR | 0.393(3) | 0.323(6) | 0.331(5) | 0.368(4) | 0.407(1.5) | 0.077(10) | 0.306(7) | 0.29(8) | 0.159(9) | 0.074(11) | 0.407(1.5) | |
| IC | 0.339(4) | 0.194(9) | 0.327(5) | 0.347(3) | 0.352(2) | 0.086(10) | 0.264(6) | 0.251(7) | 0.196(8) | 0.067(11) | 0.356(1) | |
| E | 0.228(3) | 0.074(9) | 0.221(5) | 0.224(4) | 0.235(2) | 0.063(10) | 0.1(7) | 0.112(6) | 0.09(8) | 0.017(11) | 0.239(1) | |
| Luo | 0.132(3) | 0.018(10) | 0.096(6) | 0.106(5) | 0.175(2) | 0.061(7) | 0.035(8) | 0.03(9) | 0.127(4) | 0.002(11) | 0.182(1) | |
| 2.8 | 8 | 5.2 | 3.6 | 2.1 | 9 | 7 | 7.8 | 8 | 10.8 | 1.7 | ||
| 3.33* | 7.05* | 5.25* | 4.13* | 2.13* | 5.85* | 8.85* | 8.25* | 7.53* | 10.4* | 1.33 | ||
Following Pahikkala2015TowardPredictions , four types of cross validation (CV) are conducted to examine the methods in four prediction settings, respectively. In S1, the 10-fold CV on pairs is used, where one fold of pairs is removed for testing. In S2 (S3), the 10-fold CV on drugs (targets) is applied, where one drug (target) fold along with its corresponding rows (columns) in is separated for testing. The 33-fold block-wise CV, which splits a drug fold and target fold along with the interactions between them for testing, using the interactions between the remaining drugs and targets for training, is applied to S4. AUPR and AUC defined in Eq. (10) and (14) are used as evaluation measures.
To evaluate the performance of MDMF2A in all prediction settings, we have compared it to seven DTI prediction models (WkNNIR Liu2021Drug-targetRecovery , NRLMF Liu2016NeighborhoodPrediction , MSCMF Zheng2013CollaborativeInteractions , GRGMF Zhang2020ANetworks , MF2A liu2021optimizing , DRLSM Ding2020IdentificationFusion , DTINet Luo2017AInformation , NEDTP An2021AInteractions ) and two network embedding approaches applicable to any domain (NetMF qiu2018network and Multi2Vec Teng2021AEmbedding ). WkNNIR cannot perform predictions in S1, as it is specifically designed to predict interactions involving new drugs or/and targets (S2, S3, S4) Liu2021Drug-targetRecovery . Furthermore, the proposed MDMF2A is also compared to four deep learning-based methods, namely NeoDTI Wan2019NeoDTI:Interactions , DTIP Xuan2021IntegratingPrediction , DCFME chen2022DCFME , and SupDTI chen2022SupDTI . These deep learning competitors can only be applied to the Luo dataset in S1, because they formulate the DTI dataset as a heterogeneous network consisting of four types of nodes (drugs, targets, drug-side effects, and diseases) and learn embeddings for all types of nodes. The illustration of all baseline methods can be found in Supplementary Section A3.
The parameters of all baseline methods are set based on the suggestions in the respective articles. For MDMF2A, the trade-off ensemble weight is chosen from . For the two base models of MDMF2A, i.e., MDMFAUPR and MDMFAUC, the number of neighbors is set to , the window size of the random walk to , the number of negative samples to , the learning rate to , candidate decay coefficient set ={0.1, 0.2, , 1.0}, the embedding dimension is chosen from {50, 100}, , and are chosen from {, , , , }, and . The number of bins in MDMFAUPR is chosen from {11, 16, 21, 26, 31} for small and medium datasets (NR, GPCR, and IC), while it is set to 21 for larger datasets (E and Luo). Similar to Zheng2013CollaborativeInteractions ; Liu2016NeighborhoodPrediction ; Ding2020IdentificationFusion , we obtain the best hyperparameters of our model via grid search, and the detailed settings are listed in Supplementary Table A2.
4.2 Results and Discussion
Tables 2 and 3 list the results of MDMF2A and its nine competitors on five datasets under four prediction settings. The numbers in the last row denote the average rank across all prediction settings, and “*” indicates that the advantage of DAMF2A over the competitor is statistically significant according to a Wilcoxon signed-rank test with Bergman-Hommel’s correction Benavoli2016 at 5% level on the results of all prediction settings.
| Setting | Dataset | WkNNIR | MSCMF | NRMFL | GRGMF | MF2A | DRLSM | DTINet | NEDTP | NetMF | Multi2Vec | MDMF2A |
| S1 | NR | - | 0.882(4.5) | 0.882(4.5) | 0.891(2) | 0.884(3) | 0.879(6) | 0.797(9) | 0.846(7) | 0.818(8) | 0.788(10) | 0.892(1) |
| GPCR | - | 0.962(6) | 0.972(4) | 0.978(2) | 0.978(2) | 0.971(5) | 0.916(10) | 0.953(8) | 0.96(7) | 0.93(9) | 0.978(2) | |
| IC | - | 0.982(6) | 0.989(2) | 0.988(4) | 0.989(2) | 0.981(7.5) | 0.938(10) | 0.981(7.5) | 0.985(5) | 0.97(9) | 0.989(2) | |
| E | - | 0.961(8) | 0.981(4) | 0.982(3) | 0.983(2) | 0.964(7) | 0.839(10) | 0.97(5) | 0.966(6) | 0.944(9) | 0.984(1) | |
| Luo | - | 0.922(7) | 0.951(3) | 0.947(4) | 0.966(2) | 0.941(5) | 0.894(9) | 0.929(6) | 0.917(8) | 0.861(10) | 0.97(1) | |
| - | 6.3 | 3.5 | 3 | 2.2 | 6.1 | 9.6 | 6.7 | 6.8 | 9.4 | 1.4 | ||
| S2 | NR | 0.825(5.5) | 0.802(7) | 0.826(4) | 0.825(5.5) | 0.833(2) | 0.831(3) | 0.666(11) | 0.786(8) | 0.739(9) | 0.727(10) | 0.837(1) |
| GPCR | 0.914(4) | 0.882(7) | 0.913(5) | 0.924(2.5) | 0.924(2.5) | 0.867(8) | 0.858(9) | 0.885(6) | 0.852(10) | 0.811(11) | 0.925(1) | |
| IC | 0.826(4) | 0.783(9) | 0.825(5) | 0.833(1) | 0.828(2) | 0.796(7) | 0.766(10) | 0.794(8) | 0.803(6) | 0.715(11) | 0.827(3) | |
| E | 0.877(4) | 0.835(7) | 0.858(5) | 0.891(3) | 0.892(2) | 0.799(9) | 0.78(10) | 0.837(6) | 0.811(8) | 0.732(11) | 0.895(1) | |
| Luo | 0.904(5) | 0.897(7) | 0.917(3) | 0.899(6) | 0.927(2) | 0.864(9) | 0.873(8) | 0.907(4) | 0.861(10) | 0.776(11) | 0.937(1) | |
| 4.5 | 7.4 | 4.4 | 3.6 | 2.1 | 7.2 | 9.6 | 6.4 | 8.6 | 10.8 | 1.4 | ||
| S3 | NR | 0.82(3) | 0.786(7) | 0.825(2) | 0.845(1) | 0.819(4) | 0.798(6) | 0.756(8) | 0.726(9) | 0.712(10) | 0.703(11) | 0.805(5) |
| GPCR | 0.952(4) | 0.902(9) | 0.946(5) | 0.965(1) | 0.96(3) | 0.917(7) | 0.879(10) | 0.918(6) | 0.909(8) | 0.798(11) | 0.961(2) | |
| IC | 0.958(5) | 0.941(7) | 0.96(4) | 0.965(3) | 0.967(1) | 0.942(6) | 0.907(10) | 0.939(8) | 0.938(9) | 0.866(11) | 0.966(2) | |
| E | 0.935(5) | 0.881(9) | 0.936(4) | 0.943(3) | 0.944(2) | 0.883(8) | 0.841(10) | 0.918(6) | 0.911(7) | 0.815(11) | 0.948(1) | |
| Luo | 0.835(5) | 0.826(9) | 0.828(8) | 0.84(4) | 0.901(2) | 0.801(10) | 0.829(7) | 0.86(3) | 0.831(6) | 0.633(11) | 0.902(1) | |
| 4.4 | 8.2 | 4.6 | 2.4 | 2.4 | 7.4 | 9 | 6.4 | 8 | 11 | 2.2 | ||
| S4 | NR | 0.637(5) | 0.597(6) | 0.656(3) | 0.677(1) | 0.649(4) | 0.592(7) | 0.562(8) | 0.548(9) | 0.531(10) | 0.524(11) | 0.661(2) |
| GPCR | 0.871(4) | 0.798(8) | 0.866(5) | 0.89(1) | 0.886(3) | 0.405(11) | 0.803(7) | 0.816(6) | 0.721(9) | 0.581(10) | 0.887(2) | |
| IC | 0.774(5) | 0.658(9) | 0.775(4) | 0.782(2) | 0.776(3) | 0.498(11) | 0.706(6) | 0.702(7) | 0.683(8) | 0.555(10) | 0.783(1) | |
| E | 0.819(3) | 0.695(8) | 0.799(5) | 0.815(4) | 0.821(2) | 0.453(11) | 0.757(6) | 0.744(7) | 0.69(9) | 0.541(10) | 0.827(1) | |
| Luo | 0.819(4) | 0.752(7) | 0.804(5) | 0.745(8) | 0.848(2) | 0.438(11) | 0.787(6) | 0.822(3) | 0.732(9) | 0.513(10) | 0.85(1) | |
| 4.2 | 7.6 | 4.4 | 3.2 | 2.8 | 10.2 | 6.6 | 6.4 | 9 | 10.2 | 1.4 | ||
| 4.37* | 7.38* | 4.23* | 3.05 | 2.38* | 7.73* | 8.7* | 6.48* | 8.1* | 10.35* | 1.6 | ||
The proposed MDMF2A is the best performing model in most cases for both metrics, achieving the highest average rank in all prediction settings and statistically significantly outperforming all competitors, except for GRGMF in AUC. This demonstrates the effectiveness of our model to sufficiently exploit the topology information embedded in the multiplex heterogeneous DTI network and optimize the two area under the curve metrics. MF2A is the runner-up. Its inferiority to MDMF2A is mainly attributed to the ignorance of high-order proximity captured by random walks and the view-specific information loss caused by aggregating multi-type similarities. GRGMF, WkNNIR, NRMLF, DRLSM, and MSCMF come next. They are outperformed by the proposed MDMF2A, because they fail to capture the unique information provided by each view. The two graph embedding based DTI prediction models are usually inferior to other DTI prediction approaches, because they generate embedding in an unsupervised manner without exploiting the interacting information. Specifically, NEDTP using the class imbalance resilient GBDT as the predicting classifier outperforms DTINet which employs simple linear projection to estimate DTIs. Regarding the two general multiplex network embedding methods, NetMF is better than Multi2Vec, because the latter requires dichotomizing the edge weights, which wipes out the different influence of the connected nodes in the similarity subnetwork. In addition, averaging all per-layer embeddings does not distinguish the importance of each hyper-layer, unlike the holistic DeepWalk Matrix used in NetMF, which contributes to the inferiority of Multi2Vec to NetMF as well.
There are some cases where MDMF2A does not achieve the best performance. Some baseline models, such as WkNNIR, NRLMF, GRGMF and MF2A, are better than MDMF2A on NR datasets, implying that the random walk based embedding generation may not yield enough benefit in the case of small-sized datasets. Besides, concerning the Luo dataset under S2, MDMF2A is outperformed by WKNNIR and DRLSM, which incorporate the neighborhood interaction recovery procedure, in terms of AUPR. In the Luo dataset, the neighbor drugs are more likely to share the same interactions, leading to the effectiveness of neighborhood-based interaction estimation for new drugs. Nevertheless, the AUC results of the two baselines are 3.7% and 8.4% lower than DWFM2A, respectively. Also, MF2A is slightly better than MDMF2A on the IC dataset in terms of AUC under S2 and S3, but the gap of results between them is tiny, e.g., 0.001. Finally, GRGMF achieves better AUC results than MDMF2A on the GPCR dataset under S3 and S4 as well as the IC dataset under S2, mainly because GRGMF learns neighbour information adaptively. But it is worse than MDMF2A in terms of AUPR, which is more informative when evaluating a model under extremely imbalanced class distribution (sparse interaction).
The advantage of MDMF2A is also observed in the comparison with deep learning based DTI prediction models on the Luo dataset. As shown in Table 4, MDMF2A outperforms all competitors in terms of AUPR, achieving 14% improvements over the best-performing competitor (DCFME). In terms of AUC, MDMF2A is only 1.1% lower than DTIP, and 5.3%, 3.6% and 3.9% higher than NeoDTI, DCFME and, SupDTI. Although DTIP emphasizes the AUC performance and slightly outperforms MDMF2A, it suffers a significant decline in the AUPR results. Compared to deep learning competitors, MDMF2A takes full advantage of the information shared by high-order neighbors and explicitly optimizes AUPR and AUC that are more effective than the conventional entropy and focal losses to identifying the less frequent interacting pairs, resulting in better performance.
| Metric | NeoDTI | DTIP | DCFME | SupDTI | MDMF2A |
|---|---|---|---|---|---|
| AUPR | 0.573(4) | 0.399(5) | 0.596(2) | 0.585(3) | 0.679(1) |
| AUC | 0.921(5) | 0.981(1) | 0.936(3) | 0.933(4) | 0.97(2) |
To comprehensively investigate the proposed MDMF2A, we conduct an ablation study to demonstrate the effectiveness of its ensemble framework and all regularization terms and analyze the sensitivity of three important parameters, i.e., , and . Please see more details in Supplementary Sections A5-A6.
4.3 Discovery of Novel DTIs
We examine the capability of MDMF2A to find novel DTIs not recorded in the Luo dataset. We do not consider updated golden standard datasets, since they have included all recently validated DTIs collected from up-to-date databases. We split all non-interacting pairs into 10 folds, and obtain predictions of each fold by training an MDMF2A model with all interacting pairs and the other nine folds of non-interacting ones. All non-interacting pairs are ranked based on their predicting scores, and the top ten pairs are selected as newly discovered DTIs, which are shown in Table 5. To further verify the reliability of these new interaction candidates, we search their supportive evidence from DrugBank (DB) Wishart2018DrugBank2018 and DrugCentral (DC) Avram2021DrugCentralRepositioning . As we can see, 8/10 new interactions (in bold) are confirmed, demonstrating the success of MDMF2A in trustworthy new DTI discovery.
| Drug ID | Drug name | Target ID | Target name | Rank | Database | ||
|---|---|---|---|---|---|---|---|
| DB00829 | Diazepam | P48169 | GABRA4 | 1 | DB | ||
| DB01215 | Estazolam | P48169 | GABRA4 | 2 | DB | ||
| DB00580 | Valdecoxib | P23219 | PTGS1 | 3 | - | ||
| DB01367 | Rasagiline | P21397 | MAOA | 4 | DC | ||
| DB00333 | Methadone | P41145 | OPRK1 | 5 | DC | ||
| DB00363 | Clozapine | P21918 | DRD5 | 6 | DC | ||
| DB06216 | Asenapine | P21918 | DRD5 | 7 | DB | ||
| DB06800 |
|
P41143 | OPRD1 | 8 | DC | ||
| DB00802 | Alfentanil | P41145 | OPRK1 | 9 | - | ||
| DB00482 | Celecoxib | P23219 | PTGS1 | 10 | DC |
5 Conclusion
This paper proposed MDMF2A, a random walk and matrix factorization based model, to predict DTIs by effectively mining topology information from the multiplex heterogeneous network involving diverse drug and target similarities. It integrates two base predictors that leverage our designed objective function, encouraging the learned embeddings to preserve holistic network and layer-specific topology structures. The two base models utilize the convex AUPR and AUC losses in their objectives, enabling MDMF2A to simultaneously optimize two crucial metrics in the DTI prediction task. We have conducted extensive experiments on five DTI datasets under various prediction settings. The results affirmed the superiority of the proposed MDMF2A to other competing DTI prediction methods. Furthermore, the practical ability of MDMF2A to discover novel DTIs was supported by the evidence from online biological databases.
In the future, we plan to extend our model to handle attributed DTI networks, including both topological and feature information for drugs and targets.
Key Points: • Incorporating multiple hyper-layers based DeepWalk matrix decomposition and layer-specific graph Laplacian to learn robust node representations that preserve both global and view-specific topology. • MDMF integrates multiplex heterogeneous network representation learning and DTI prediction into a unified optimization framework, learning latent features in a supervised manner and implicitly recoveries possible missing interactions. • MDMF2A, the instantiation of MDMF, optimizes both AUPR and AUC metrics. • Our method statistically significantly outperforms state-of-the-art methods under various prediction settings and can discover new reliable DTIs.
Data and Code availability
The source code and data are available could be found at https://github.com/intelligence-csd-auth-gr/DTI_MDMF2A
Funding
This work was supported by the China Scholarship Council (CSC) [201708500095]; and the French National Research Agency (ANR) under the JCJC project GraphIA [ANR-20-CE23-0009-01].
6 Biography
Bin Liu is a lecturer at Key Laboratory of Data Engineering and Visual Computing, Chongqing University of Posts and Telecommunications and received his PhD Degree in computer science from Aristotle University of Thessaloniki. His research interests include multi-label learning and bioinformatics.
Dimitrios Papadopoulos is a PhD student at the School of Informatics, Aristotle University of Thessaloniki. His research interests include supervised machine learning, graph mining, and drug discovery.
Fragkiskos D. Malliaros is an Assistant Professor at Paris-Saclay University, CentraleSupélec and associate researcher at Inria Saclay. His research interests include graph mining, machine learning, and graph-based information extraction.
Grigorios Tsoumakas is an Associate Professor at the Aristotle University of Thessaloniki. His research interests include machine learning (ensembles, multi-target prediction) and natural language processing (semantic indexing, keyphrase extraction, summarization)
Apostolos N. Papadopoulos is Associate Professor at the School of Informatics, Aristotle University of Thessaloniki. His research interests include data management, data mining and big data analytics.
References
- [1] Maryam Bagherian, Elyas Sabeti, Kai Wang, Maureen A. Sartor, Zaneta Nikolovska-Coleska, and Kayvan Najarian. Machine learning approaches and databases for prediction of drug-target interaction: A survey paper. Brief. Bioinformatics, 22(1):247–269, 2021.
- [2] Ali Ezzat, Peilin Zhao, Min Wu, Xiao Li Li, and Chee Keong Kwoh. Drug-target interaction prediction with graph regularized matrix factorization. IEEE/ACM Trans. Comput. Biol. Bioinform., 14(3):646–656, 2017.
- [3] Yijie Ding, Jijun Tang, and Fei Guo. Identification of drug–target interactions via dual laplacian regularized least squares with multiple kernel fusion. Knowl. Based. Syst., 204:106254, 2020.
- [4] Qi An and Liang Yu. A heterogeneous network embedding framework for predicting similarity-based drug-target interactions. Brief. Bioinformatics, 22(6):1–10, 2021.
- [5] Ping Xuan, Yu Zhang, Hui Cui, Tiangang Zhang, Maozu Guo, and Toshiya Nakaguchi. Integrating multi-scale neighbouring topologies and cross-modal similarities for drug–protein interaction prediction. Brief. Bioinformatics, 22(5):bbab119, 2021.
- [6] Bin Liu, Konstantinos Pliakos, Celine Vens, and Grigorios Tsoumakas. Drug-target interaction prediction via an ensemble of weighted nearest neighbors with interaction recovery. Appl. Intell., 52(4):3705–3727, 2022.
- [7] Yong Liu, Min Wu, Chunyan Miao, Peilin Zhao, and Xiao Li Li. Neighborhood regularized logistic matrix factorization for drug-target interaction prediction. PLoS Comput. Biol., 12(2):e1004760, 2016.
- [8] Konstantinos Pliakos, Celine Vens, and Grigorios Tsoumakas. Predicting drug-target interactions with multi-label classification and label partitioning. IEEE/ACM Trans. Comput. Biol. Bioinform., 18(4):1596–1607, 2021.
- [9] Xiaodong Zheng, Hao Ding, Hiroshi Mamitsuka, and Shanfeng Zhu. Collaborative matrix factorization with multiple similarities for predicting drug-Target interactions. In Proc. ACM SIGKDD Int. Conf. Knowl. Discov. Data Min., pages 1025–1033, 2013.
- [10] Bin Liu and Grigorios Tsoumakas. Optimizing Area Under the Curve Measures via Matrix Factorization for Predicting Drug-Target Interaction with Multiple Similarities. arXiv, 2021.
- [11] Rawan S. Olayan, Haitham Ashoor, and Vladimir B. Bajic. DDR: Efficient computational method to predict drug-Target interactions using graph mining and machine learning approaches. Bioinformatics, 7(34):1164–1173, 2018.
- [12] Fangping Wan, Lixiang Hong, An Xiao, Tao Jiang, and Jianyang Zeng. NeoDTI: Neural integration of neighbor information from a heterogeneous network for discovering new drug-target interactions. Bioinformatics, 35(1):104–111, 2019.
- [13] Jiatao Chen, Liang Zhang, Ke Cheng, Bo Jin, Xinjiang Lu, and Chao Che. Predicting drug-target interaction via self-supervised learning. IEEE/ACM Trans. Comput. Biol. Bioinform., 2022.
- [14] Ruolan Chen, Feng Xia, Bing Hu, Shuting Jin, and Xiangrong Liu. Drug-target interactions prediction via deep collaborative filtering with multiembeddings. Brief. Bioinformatics, 2022.
- [15] Hanjun Dai, Hui Li, Tian Tian, Xin Huang, Lin Wang, Jun Zhu, and Le Song. Adversarial attack on graph structured data. In Proc. Int. Conf. on Mach. Learn., pages 1115–1124, 2018.
- [16] Konstantinos Pliakos and Celine Vens. Drug-target interaction prediction with tree-ensemble learning and output space reconstruction. BMC Bioinform., 21(1):1–11, 2020.
- [17] Yunan Luo, Xinbin Zhao, Jingtian Zhou, Jinglin Yang, Yanqing Zhang, Wenhua Kuang, Jian Peng, Ligong Chen, and Jianyang Zeng. A network integration approach for drug-target interaction prediction and computational drug repositioning from heterogeneous information. Nat. Commun., 8(1):1–13, 2017.
- [18] Jiezhong Qiu, Yuxiao Dong, Hao Ma, Jian Li, Kuansan Wang, and Jie Tang. Network embedding as matrix factorization: Unifying deepwalk, line, pte, and node2vec. In Proc. ACM Int. Conf. Web Search Data Min., pages 459–467, 2018.
- [19] Bryan Perozzi, Rami Al-Rfou, and Steven Skiena. DeepWalk: Online learning of social representations. In Proc. ACM SIGKDD Int. Conf. Knowl. Discov. Data Min., pages 701–710, 2014.
- [20] Tapio Pahikkala, Antti Airola, Sami Pietilä, Sushil Shakyawar, Agnieszka Szwajda, Jing Tang, and Tero Aittokallio. Toward more realistic drug-target interaction predictions. Brief. Bioinformatics, 16(2):325–337, 2015.
- [21] Yoshihiro Yamanishi, Michihiro Araki, Alex Gutteridge, Wataru Honda, and Minoru Kanehisa. Prediction of drug-target interaction networks from the integration of chemical and genomic spaces. Bioinformatics, 24(13):i232–i240, 2008.
- [22] Minoru Kanehisa, Miho Furumichi, Mao Tanabe, Yoko Sato, and Kanae Morishima. KEGG: New perspectives on genomes, pathways, diseases and drugs. Nucleic Acids Res., 45(D1):D353–D361, 2017.
- [23] David S. Wishart, Yannick D. Feunang, An C. Guo, Elvis J. Lo, Ana Marcu, Jason R. Grant, Tanvir Sajed, Daniel Johnson, Carin Li, Zinat Sayeeda, Nazanin Assempour, Ithayavani Iynkkaran, Yifeng Liu, Adam MacIejewski, Nicola Gale, Alex Wilson, Lucy Chin, Ryan Cummings, DIana Le, Allison Pon, Craig Knox, and Michael Wilson. DrugBank 5.0: A major update to the DrugBank database for 2018. Nucleic Acids Res., 46(D1):D1074–D1082, 2018.
- [24] David Mendez, Anna Gaulton, A. Patrícia Bento, Jon Chambers, Marleen De Veij, Eloy Félix, María Paula Magariños, Juan F. Mosquera, Prudence Mutowo, Michał Nowotka, María Gordillo-Marañón, Fiona Hunter, Laura Junco, Grace Mugumbate, Milagros Rodriguez-Lopez, Francis Atkinson, Nicolas Bosc, Chris J. Radoux, Aldo Segura-Cabrera, Anne Hersey, and Andrew R. Leach. ChEMBL: Towards direct deposition of bioassay data. Nucleic Acids Res., 47(D1):D930–D940, 2019.
- [25] Masahiro Hattori, Yasushi Okuno, Susumu Goto, and Minoru Kanehisa. Development of a chemical structure comparison method for integrated analysis of chemical and genomic information in the metabolic pathways. J. Am. Chem. Soc., 125(39):11853–11865, 2003.
- [26] Masataka Takarabe, Masaaki Kotera, Yosuke Nishimura, Susumu Goto, and Yoshihiro Yamanishi. Drug target prediction using adverse event report systems: a pharmacogenomic approach. Bioinformatics, 28(18):i611–i618, 2012.
- [27] Michael Kuhn, Ivica Letunic, Lars Juhl Jensen, and Peer Bork. The SIDER database of drugs and side effects. Nucleic Acids Res., 44(D1):D1075–D1079, 2016.
- [28] André C.A. Nascimento, Ricardo B.C. Prudêncio, and Ivan G. Costa. A multiple kernel learning algorithm for drug-target interaction prediction. BMC Bioinform., 17(1):1–16, 2016.
- [29] T. S. Keshava Prasad, Renu Goel, Kumaran Kandasamy, Shivakumar Keerthikumar, Sameer Kumar, Suresh Mathivanan, Deepthi Telikicherla, Rajesh Raju, Beema Shafreen, Abhilash Venugopal, Lavanya Balakrishnan, Arivusudar Marimuthu, Sutopa Banerjee, Devi S. Somanathan, Aimy Sebastian, Sandhya Rani, Somak Ray, C. J. Harrys Kishore, Sashi Kanth, Mukhtar Ahmed, Manoj K. Kashyap, Riaz Mohmood, Y. I. Ramachandra, V. Krishna, B. Abdul Rahiman, Sujatha Mohan, Prathibha Ranganathan, Subhashri Ramabadran, Raghothama Chaerkady, and Akhilesh Pandey. Human protein reference database-2009 update. Nucleic Acids Res., 37(suppl_1):D767–D772, 2009.
- [30] Allan Peter Davis, Cynthia Grondin Murphy, Robin Johnson, Jean M. Lay, Kelley Lennon-Hopkins, Cynthia Saraceni-Richards, Daniela Sciaky, Benjamin L. King, Michael C. Rosenstein, Thomas C. Wiegers, and Carolyn J. Mattingly. The comparative toxicogenomics database: Update 2013. Nucleic Acids Res., 41(D1):D1104–D1114, 2013.
- [31] John Duchi, Elad Hazan, and Yoram Singer. Adaptive subgradient methods for online learning and stochastic optimization. J. Mach. Learn. Res., 12:2121–2159, 2011.
- [32] Jerome Revaud, Jon Almazan, Rafael Rezende, and Cesar De Souza. Learning with average precision: Training image retrieval with a listwise loss. In Proc. IEEE Int. Conf. Comput. Vis., pages 5106–5115, 2019.
- [33] Zi Chao Zhang, Xiao Fei Zhang, Min Wu, Le Ou-Yang, Xing Ming Zhao, and Xiao Li Li. A graph regularized generalized matrix factorization model for predicting links in biomedical bipartite networks. Bioinformatics, 36(11):3474–3481, 2020.
- [34] Xiangyi Teng, Jing Liu, and Liqiang Li. A synchronous feature learning method for multiplex network embedding. Inf. Sci., 574:176–191, 2021.
- [35] Alessio Benavoli, Giorgio Corani, and Francesca Mangili. Should we Really Use Post-Hoc Tests Based on Mean-Ranks? J. Mach. Learn. Res., 17(1):1–10, 2016.
- [36] Sorin Avram, Cristian G. Bologa, Jayme Holmes, Giovanni Bocci, Thomas B. Wilson, Dac Trung Nguyen, Ramona Curpan, Liliana Halip, Alina Bora, Jeremy J. Yang, Jeffrey Knockel, Suman Sirimulla, Oleg Ursu, and Tudor I. Oprea. DrugCentral 2021 supports drug discovery and repositioning. Nucleic Acids Res., 49(D1):D1160–D1169, 2021.