Pattern selection and restricted vortex dynamics by spatial periodic forcing in rapidly rotating Rayleigh-Bénard convection
Abstract
Pattern forming with externally imposed symmetry is ubiquitous in nature but lightly studied. We present experimental studies of pattern formation and selection by spatial periodic forcing in rapidly rotating convection. We observe symmetric convection patterns in form of regular vortex lattice near the instability onset, when the periodicity of the external forcing is set close to the intrinsic vortex spacing. We show that the new patterns arise as a dynamical process of imperfect bifurcation which can be well described by a Ginzburg-Landau-like model. With increasing buoyancy strength the effect of external forcing weakens, and the convective vortices evolve from a stationary state to exhibit restricted and finally stochastic motions.
Pattern formatting phenomena are omnipresent in a wide variety of physical, chemical, and biological systems Cross and Hohenberg (1993); Gollub and Langer (1999); Zaikin and Zhabotinskii (1970); Field and Burger (1985); Murray (1989). Nonequilibrium spatiotemporal patterns often arise through symmetry-breaking bifurcations when an initially uniform system is driven internally away from thermodynamic equilibrium. Many natural systems are, however, often constrained with nonuniform boundaries having broken symmetry that may modify the pattern formatting process and influence the intrinsic flow organization. Examples include atmospheric convection rolls forming over mesoscale topography Tian and Parker (2003), formation of Taylor columns over seamounts that determine the overlying pattern of ice-cover in high-latitude oceans Martin and Drucker (1997). Exploring the interaction between externally imposed symmetries and intrinsic symmetries preferred by the system may shed new light onto the complexity in pattern formatting process, and enable us to induce, control or eliminate patterns using external forcing in various systems Kelly and Pal (1978); Lowe et al. (1983); Coullet (1986); Dolnik et al. (2001); Ismagilov et al. (2001); McCoy (2007); Seiden et al. (2008).
The fundamental physics of pattern formation have been studied over the past few decades in carefully controlled experimental systems, such as in rotating Rayleigh-Bénard convection (RBC) Cross and Hohenberg (1993); Zhong et al. (1991); Bajaj et al. (1998), i. e., a fluid layer heated from below and rotated about a vertical axis with angular velocity . When the temperature difference exceeds the onset (), convection pattern appears first as straight rolls under slow rotations Kuppers and Lortz (1969); Hu et al. (1997); Bajaj et al. (2002), which becomes unstable to the Kuppers-Lortz instability when increases Hu et al. (1998); Sánchez-Álvarez et al. (2005). Square (or hexagonal) patterns may form when the dimensionless rotation rate, ( is the kinematic viscosity), reaches the order of 100 Bajaj et al. (1998). With further increase in , the flow pattern becomes disordered Bajaj et al. (2002). It is observed that under large rotation rates () the flow field near onset is characterized by columnar vortices that exhibit Brownian-type random motion Noto et al. (2019); Chong et al. (2020); Ding et al. (2021). Clearly in rapidly rotating convection the spatiotemporal periodicity of the flow pattern is lost even close to onset. Previous studies have shown that when flow patterns are modulated by a spatially periodic perturbation, a commensurate state often arises in which the structural periodicity of the flow rationally accommodates to that of the perturbation, as a result of competition between the imposed and intrinsic patterns Lowe et al. (1983); Ismagilov et al. (2001); Seiden et al. (2008). It raises naturally the intriguing question whether flow patterns with spatial periodicity and symmetry can be restored in rapidly rotating convection when external forcing is applied.
In this Letter we report experimental observation of orderly flow patterns forming under the control of externally imposed topographic forcing in rapidly rotating convection. We use a convection apparatus that was designed for high-resolution flow structure measurements in rotating RBC Chong et al. (2020); Ding et al. (2021); Shi et al. (2020). We use a cylindrical cell that had a diameter mm and a height mm, yielding an aspect ratio . The bottom plate of the sample, made of oxygen-free copper, is finely machined to construct an array of thin cylinders extending out from the plate surface. These raised cylinders are periodically spaced to form a square- or hexagon-patterned surface. Flow patterns at a fluid depth of are measured using the technique of particle image velocimetry (see Supplemental Material SM for detailed experimental methods). The experiment is conducted with a constant Prandtl number Pr and in the range Ra of the Rayleigh number . Here is the gravitational acceleration, , are respectively the isobaric thermal expansion coefficient, thermal diffusivity of the fluid. Rotating angular velocity of rad/s are used thus . The reduced Rayleigh number, , spans the range . Here is the onset of convection Ons . The Froude number, , covers the range .
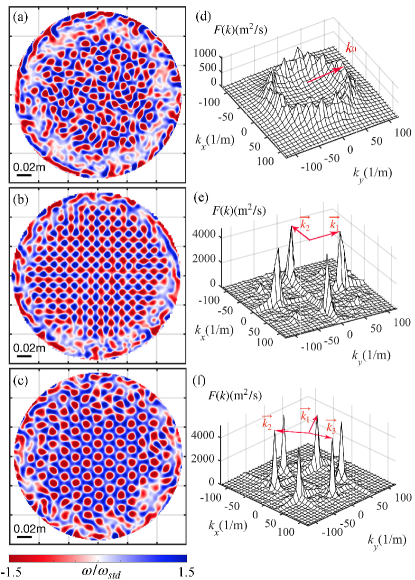
Figure 1 presents the flow patterns at the measured fluid height with and . When a flat bottom plate is used (i. e., the reference cell without external forcing), the flow fields of the vertical vorticity are characterized by columnar vortices, which exhibit stochastic horizontal motions as reported in previous studies Noto et al. (2019); Chong et al. (2020); Ding et al. (2021). Despite their random motion, the vortices maintain approximately a constant distance mm with their neighboring vortices (Fig. 1a). In the spatial Fourier spectrum of vorticity field calculated in central region (Fig. 1d), a crater-like structure with a radius is apparent in the spectrum , indicating that the vortices are distributed with random orientations but with a preferred spacing. When periodic topographic structures are constructed on the bottom plate, they modulate both the local temperature and the shearing interaction of the fluid with the solid surface, leading to new convection patterns. Figures 1b and 1c show the vorticity fields when the bottom surface is textured with a square and a hexagonal array of cylinders, respectively, with their spacing chosen close to the intrinsic wavelength of the vorticity field . Since the fluid overlying the raised cylinders is relatively hotter, upwelling vortices (i.e., cyclones when observed in the lower half fluid layer Not ) tend to form above the cylinders, forming a 1:1 commensurate structure with respect to the bottom texture. The downwelling vortices (anticyclones), however, appear in between the raised cylinders. In the square-patterned cell (Fig. 1b), both the cyclones and anticyclones constitute a regular square lattice. The flow pattern induced by a hexagonal array of cylinders (Fig. 1c), however, consists of a hexagonal lattice of anticyclones with a cyclone located at the hexagon center. Such patterns are stationary and persist during the experiment. Figures 1e and 1f present the Fourier spectra of the vorticity fields in the central region of Figs. 1b and 1c, respectively. In these spectra we see clear peaks located precisely at the wave vectors of the periodically imposed textures. These peaks of are all very sharp and their amplitudes are approximately equal, suggesting that regular patterns with prescribed periodicity and symmetry are developed. Near the sidewall region ( mm) where the imposed texture is absent, the flow field is time-varying and the vortex dynamics therein is largely influenced by the retrogradely traveling boundary zonal flow de Wit et al. (2020); Zhang et al. (2020).
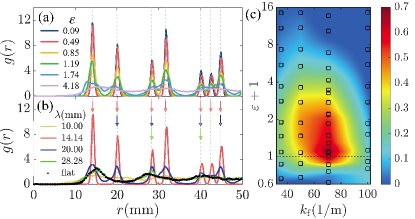
The observed spatial pattern can be quantified by the radial distribution function of the vortices, which is defined as the ratio of the actual number of cyclones lying within an annulus region of and , to the expected number for uniform vortex distribution Chong et al. (2020). Figure 2a shows for cyclonic distribution for various in the square-patterned cell with mm. Near onset () multiple sharp peaks appear in , which locate at distances that match with the main and subharmonic wavelengths of the forced square pattern at the bottom plate, fulfilling the condition: , and . With increasing , the peak amplitudes in decrease while the peak widths increase, signifying a less regular flow pattern. The multiple-peak structure is eventually flattened and becomes close to a uniform distribution for , where we see the vortices exhibit apparent horizontal motions. We examine as well the role of the periodicity of external forcing on the convection pattern. Figure 2b presents results of near onset () for various cylinder spacing mm. We see multiple peaks still appear at the main and subharmonic wavelengths . For mm, the first peak is found near which is associated with the intrinsic wavelength of the flow field. When is far apart from , the maxima of become less dominant and approaches the result of the reference cell.
The degree of matching between the flow pattern and the bottom texture can be evaluated through the cross-correlation coefficient of the vorticity field and the bottom texture, defined as , where , , and (or ) for the flat (or raised) area, representing the bottom surface profile. denotes a spatial average. Figure 2c summarizes the results of in the square-patterned cell for varying and wave vector of the external forcing. In this phase diagram, we see that has a single maximum () occurring at (), which implies the optimal conditions for pattern selection. In the vicinity of , the spatial distribution of the vortices severely conforms to the bottom texture. The coefficient decreases if the control parameters deviate from . The decreasing of with increasing is slowest when a near-resonant external forcing is chosen. The convection pattern and the imposed texture becomes essentially uncorrelated (with ) when are set apart from . Interestingly, when , remains well above zero for , suggesting that under external forcing convection sets in with finite amplitude in the subcritical regime.
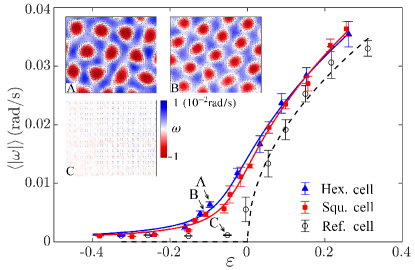
We measure the time-averaged vorticity modulus in an area of mm2 at the center of the cell, while slowly scanning in the range . Results of for the reference cell and two forced cells are shown in Fig. 3. Overall, these data suggest two distinct types of bifurcations when increases and crosses zero. The reference cell data reveal a sharp transition from a non-convection state with for , to a convection state in which increases rapidly for . For both forced cells, however, remains positive for and grows relatively slowly with increasing , suggesting a smooth transition. The three inset panels present the vorticity fields captured in the three cells with approximately the same subcriticality (). They demonstrate that while the fluid is still quiescent in the reference cell, apparent square (hexagonal) lattice of convective vortices have formed in the forced cells.
In an effort to understand the -dependence of near onset, we propose a phenomenological Ginzburg-Landau-like model for the convection amplitude of rotating RBC Scheel (2007); Scheel et al. (2010) in the presence of external periodic forcing Kelly and Pal (1978); Coullet (1986); McCoy (2007); Seiden et al. (2008)
| (1) |
Here is the nonlinear coupling coefficient between the Fourier modes and of the flow pattern and is the number of dominant modes. is an imperfection coefficient. represents the strength of the external forcing. The integer denotes the degree of resonance and we consider here resonant forcing ( and ). is a spatial gradient coefficient. In view of the symmetry of the flow patterns shown in Figs. 1b and 1c, we set for any two coupling modes as constants and . We consider a stationary solution for the near-onset flow regime. Through summation of all modes Eq. (1) is reduced to an amplitude equation: , with . The offset represents a shift of since strictly Cross (1980), and since the local temperature gradient increases slightly over the bottom texture McCoy (2007); Seiden et al. (2008). The amplitude , is related to the observed mean vorticity modulus through a scale factor , SM . We show in Fig. 3 the theoretical predictions for the reference cell (), and for the two forced cells that fulfills a cubic equation. Both the experimental data and the theoretical curve show clearly the signature of a forward bifurcation near when the external forcing is absent. Meanwhile the pronounced rounding of the transition in the two forced cells indicates an imperfect bifurcation. The parameter values obtained from fitting the bifurcation data can be interpreted as well by the model SM . The agreement between the experimental and theoretical results suggest that the physics of external modulation near onset of rotating convection can be well described by the present Ginzburg-Landau-like model.
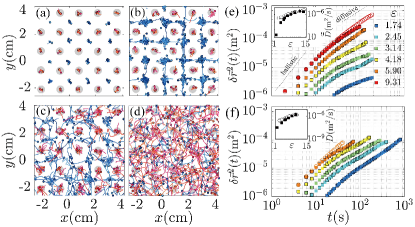
The convection pattern becomes time-dependent and the vortices are meandering horizontally when is far above the onset. To explore the impact of the bottom texture on the flow field far from onset, we examine here the motions of the vortices with varying buoyancy strength. Figures 4a-4d show the trajectories of the vortices, overlying a gray texture that represents a square array of cylinders on the bottom surface. Near onset (), the motion of cyclones is severely restricted within the fluid domain over the raised cylinders. Meanwhile anticyclones appear at their stable positions, i.e., the middle points of every four adjacent cylinders, so as to maintain the largest distance from its nearest cyclones (Fig. 4a). With increased buoyancy forcing (), while the cyclones are still confined above the raised cylinders, the anticyclones may move in between the stable positions, with their chaotic trajectories forming a web-shape domain of anticyclonic motion (Fig. 4b). A further increase in () releases the constraint of vortex motion as shown in Fig. 4c. When a sufficiently large buoyancy forcing () is applied, the trajectories of both cyclones and anticyclones cover nearly the full fluid domain as the effect of external forcing diminishes (Fig. 4d), and we find that the stochastic vortex motion Chong et al. (2020); Ding et al. (2021) recovers.
To characterize the statistical behavior of the vortices, we compute their mean-square displacements, , using the trajectories obtained above. Figures 4e and 4f show the results for cyclones and anticyclones, respectively. With strong buoyancy forcing the data curves of for cyclones in the forced cell resemble that of the reference cell (Fig. 4e), which reveal that the vortex motion undergoes a transition from ballistic to diffusive motion as time increases Chong et al. (2020). When decreases of the forced cell decreases progressively, signifying that the restriction effect of the cyclonic motion due to the external forcing becomes significant. A similar -dependence of is found in the anticyclonic data (Fig. 4f), although at low a less reduction of occurs, and one observes a relatively larger domain of anticyclonic motion (Fig. 4a-4c). We determine the diffusion coefficient of vortex motion, using the Green-Kubo formula Green (1954); Kubo (1957); Morriss and Evans (2007); Hansen and McDonald (2013): , with being the velocity of vortex motion. Results for the forced cell are compared with the reference cell in the insets. We see that with large () data for the two cells overlap. With decreasing , decreases more rapidly in the forced cell. When , of anticyclonic (cyclonic) motion in the forced cell becomes one (two) order in magnitudes less than that in the reference cell. Further decrease in leads to a stationary vortex distribution in the forced cell as shown in Fig. 1c.
The flow pattern in rapidly rotating convection is characterized by columnar vortices that undergo stochastic horizontal motion. We have shown that when a periodically topographic structure is introduced on the heated surface, the vortex motion can be strictly controlled to form stationary convection patterns with prescribed symmetries. We demonstrate that the new patterns arise through a dynamical process of imperfect bifurcation with the effects of external forcing well described by a Ginzburg-Landau-like model. In rapidly rotating convection it is predicted that heat and mass are transported mainly by the columnar vortices Veronis (1959); Julien et al. (1999); King and Aurnou (2012). Our experimental findings of a wide parameter regime to manipulate these vortices through topological forcing may thus enable new experimental approaches to examine and exploit local heat and fluid transports in rotating flows. The richness of patterns and vortex dynamics in modulated rotating convection observed in this study may stimulate further theoretical and numerical investigations, and will contribute to understanding of pattern formation in non-equilibrium systems constrained by nonuniform boundary conditions.
This work is supported by the Fundamental Research Funds for the Central Universities, and the National Science Foundation of China under Grant Nos. 92152105 and 11772235.
References
- Cross and Hohenberg (1993) M. C. Cross and P. C. Hohenberg, Rev. Mod. Phys. 65, 851 (1993).
- Gollub and Langer (1999) J. P. Gollub and J. S. Langer, Rev. Mod. Phys. 71, 396 (1999).
- Zaikin and Zhabotinskii (1970) A. N. Zaikin and A. M. Zhabotinskii, Nature 223, 535 (1970).
- Field and Burger (1985) R. J. Field and M. Burger, Oscillations and Traveling waves in Chemical Systems (Wiley, New York, 1985).
- Murray (1989) J. D. Murray, Mathematical Biology (Springer-Verlag, Berlin, 1989).
- Tian and Parker (2003) W. Tian and D. J. Parker, Mon. Weather Rev. 131, 222 (2003).
- Martin and Drucker (1997) S. Martin and R. Drucker, J. Geophys. Res. Oceans. 102, 10473 (1997).
- Kelly and Pal (1978) R. E. Kelly and D. Pal, J. Fluid Mech. 86, 433 (1978).
- Lowe et al. (1983) M. Lowe, J. P. Gollub, and T. C. Lubensky, Phys. Rev. Letts. 51, 786 (1983).
- Coullet (1986) P. Coullet, Phys. Rev. Letts. 56, 724 (1986).
- Dolnik et al. (2001) M. Dolnik, I. Berenstein, A. M. Zhabotinsky, and I. R. Epstein, Phys. Rev. Letts. 87, 238301 (2001).
- Ismagilov et al. (2001) R. F. Ismagilov, D. Rosmarin, D. H. Gracias, A. D. Stroock, and G. M. Whitesides, Appl. Phys. Lett. 79, 439 (2001).
- McCoy (2007) J. H. McCoy, Ph.D. thesis, Cornell University (2007).
- Seiden et al. (2008) G. Seiden, S. Weiss, J. H. McCoy, W. Pesch, and E. Bodenschatz, Phys. Rev. Letts. 101, 214503 (2008).
- Zhong et al. (1991) F. Zhong, R. Ecke, and V. Steinberg, Phys. Rev. Letts. 67, 2473 (1991).
- Bajaj et al. (1998) K. M. S. Bajaj, J. Liu, B. Naberhuis, and G. Ahlers, Phys. Rev. Letts. 81, 806 (1998).
- Kuppers and Lortz (1969) G. Kuppers and D. Lortz, J. Fluid Mech. 35, 609 (1969).
- Hu et al. (1997) Y. Hu, R. E. Ecke, and G. Ahlers, Phys. Rev. E 5, 6928 (1997).
- Bajaj et al. (2002) K. M. S. Bajaj, G. Ahlers, and W. Pesch, Phys. Rev. E 65, 056309 (2002).
- Hu et al. (1998) Y. Hu, W. Pesch, G. Ahlers, and R. E. Ecke, Phys. Rev. E 58, 5821 (1998).
- Sánchez-Álvarez et al. (2005) J. J. Sánchez-Álvarez, E. Serre, E. Crespo del Arco, and F. H. Busse, Phys. Rev. E 72, 036307 (2005).
- Noto et al. (2019) D. Noto, Y. Tasaka, T. Yanagisawa, and Y. Murai, J. Fluid Mech. 871, 401 (2019).
- Chong et al. (2020) K. L. Chong, J.-Q. Shi, S.-S. Ding, G.-Y. Ding, H.-Y. Lu, J.-Q. Zhong, and K.-Q. Xia, Sci. Adv. 6, eaaz1110 (2020).
- Ding et al. (2021) S.-S. Ding, K. L. Chong, J.-Q. Shi, G.-Y. Ding, H.-Y. Lu, K.-Q. Xia, and J.-Q. Zhong, Nat. Commun. 12, 5585 (2021).
- Shi et al. (2020) J.-Q. Shi, H.-Y. Lu, S.-S. Ding, and J.-Q. Zhong, Phys. Rev. Fluids 5, 011501(R) (2020).
- (26) See Supplemental Material at (…) for movies, methods of the experiment, theoretical model and data analysis.
- (27) The onset of rotating thermal convection is with the Ekman number and the coefficient . See P. P. Niiler and F. E. Bisshopp, J. Fluid Mech. 22, 753 (1965).
- (28) The upwelling vortices rotate in the same direction as the system (cyclones) in the lower half fluid layer, and in the opposite direction (anticyclones) in the upper half, and vice versa for downwelling vortices. See, e. g., S. Sakai, J. Fluid Mech. 333, 85 (1997); E. M. King and J. M. Aurnou, Phys. Rev. E 85, 016313 (2012).
- de Wit et al. (2020) X. M. de Wit, A. J. Aguirre Guzmán, M. Madonia, J. S. Cheng, H. J. H. Clercx, and R. P. J. Kunnen, Phys. Rev. Fluids 5, 023502 (2020).
- Zhang et al. (2020) X. Zhang, D. P. M. van Gils, S. Horn, M. Wedi, L. Zwirner, G. Ahlers, R. E. Ecke, S. Weiss, E. Bodenschatz, and O. Shishkina, Phys. Rev. Lett. 124, 084505 (2020).
- Scheel (2007) J. D. Scheel, Phys. Fluids 19, 104105 (2007).
- Scheel et al. (2010) J. D. Scheel, P. L. Mutyaba, and T. Kimmel, J. Fluid Mech. 659, 24 (2010).
- Cross (1980) M. C. Cross, Phys. Fluids 23, 1727 (1980).
- Green (1954) M. S. Green, J. Chem. Phys. 22, 398 (1954).
- Kubo (1957) R. Kubo, J. Phys. Soc. Jpn. 12, 570 (1957).
- Morriss and Evans (2007) G. P. Morriss and D. J. Evans, Statistical Mechanics of Nonequilbrium Liquids (ANU Press, Canberra, 2007).
- Hansen and McDonald (2013) J.-P. Hansen and I. R. McDonald, Theory of Simple Liquids: With Applications to Soft Matter (Academic Press, Cambridge, 2013).
- Veronis (1959) G. Veronis, J. Fluid Mech. 5, 401 (1959).
- Julien et al. (1999) K. Julien, S. Legg, J. Mcwilliams, and J. Werne, J. Fluid Mech. 391, 151 (1999).
- King and Aurnou (2012) E. M. King and J. M. Aurnou, Phys. Rev. E 85, 016313 (2012).