Further Evidence for the Minifilament-Eruption Scenario for Solar Polar Coronal Jets
Abstract
We examine a sampling of 23 polar-coronal-hole jets. We first identified the jets in soft X-ray (SXR) images from the X-ray telescope (XRT) on the Hinode spacecraft, over 2014-2016. During this period, frequently the polar holes were small or largely obscured by foreground coronal haze, often making jets difficult to see. We selected 23 jets among those adequately visible during this period, and examined them further using Solar Dynamics Observatory (SDO) Atmospheric Imaging Assembly (AIA) 171, 193, 211, and 304 Å images. In SXRs we track the lateral drift of the jet spire relative to the jet base’s jet bright point (JBP). In 22 of 23 jets the spire either moves away from (18 cases) or is stationary relative to (4 cases) the JBP. The one exception where the spire moved toward the JBP may be a consequence of line-of-sight projection effects at the limb. From the AIA images, we clearly identify an erupting minifilament in 20 of the 23 jets, while the remainder are consistent with such an eruption having taken place. We also confirm that some jets can trigger onset of nearby “sympathetic” jets, likely because eruption of the minifilament field of the first jet removes magnetic constraints on the base-field region of the second jet. The propensity for spire drift away from the JBP, the identification of the erupting minifilament in the majority of jets, and the magnetic-field topological changes that lead to sympathetic jets, all support or are consistent with the minifilament-eruption model for jets.
1 Introduction
Solar coronal X-ray jets are features rooted low in the solar atmosphere that extend into the corona. They have been observed primarily at soft X-ray (SXR) and extreme ultraviolet (EUV) wavelengths, with the first detailed studies in SXRs from the Soft X-ray telescope (SXT) on the Yohkoh satellite (Shibata et al., 1992; Shimojo et al., 1996). Subsequently, they have been observed with various instruments, including extensively in SXRs with the X-ray Telescope (XRT) on Hinode, and in EUV with the with SECCHI on the STEREO spacecraft and with the Atmospheric Imaging Assembly (AIA) on the Solar Dynamics Observatory (SDO) satellite, and they have been seen in images from white light coronagraphs on STEREO and SOHO (see, e.g., Raouafi et al., 2016). The jets have spires that grow to be long and narrow; in polar coronal holes they reach lengths of 50,000 km with widths of 8000 km over lifetimes of 10-min (Savcheva et al., 2007). Their base regions can become many times brighter than the spires, particularly when observed in SXRs. Often the base brightening is asymmetric with respect to the spire, being much brighter on one side of the spire than the other (Shibata et al., 1992); we refer to the brightest location in the jet base as the jet bright point (JBP; Sterling et al., 2015). Coronal jets appear in all regions of the Sun. While Yohkoh primarily observed jets at the periphery of active regions, XRT revealed that they are also prevalent in polar coronal holes (Cirtain et al., 2007; Savcheva et al., 2007). They are also visible in quiet Sun and on-disk coronal holes (e.g., McGlasson et al., 2019). A number of investigations have studied the on-disk source region of coronal jets, including the magnetic field properties at the base of the jets (e.g., Shimojo et al., 1998; Huang et al., 2012; Shen et al., 2012, 2017; Young & Muglach, 2014a; Adams et al., 2014; Panesar et al., 2016; Muglach, 2021). See Shimojo & Shibata (2000), Raouafi et al. (2016), Hinode Review Team et al. (2019), and Shen (2021) for summaries and reviews of coronal jets.
Based on the early Yohkoh observations, it was suggested that jets result when closed bipolar magnetic field emerges through the photosphere and into the corona, and undergo magnetic reconnection with an ambient approximately vertical background coronal field (Shibata et al., 1992). Numerical simulations based on this idea reproduce many of the characteristics of jets (e.g. Yokoyama & Shibata, 1995; Moreno-Insertis et al., 2008; Nishizuka et al., 2008). In this scenario, a bipole emerging into a unipolar vertical background field will form a current sheet at an interface between the majority-polarity background field and the minority-polarity leg of the emerging magnetic arch. Reconnection at that current sheet, it was argued, would produce both the JBP and the jet spire.
Following the earliest jet observations, Moore et al. (2010) and Moore et al. (2013) proposed a dichotomy of jets based on their morphology, primarily when viewed in SXRs. These observations reveal that the spires of some X-ray jets remain thin and “pencil-like” during their entire lifetime, much narrower than the base of the jet. These were named “standard jets,” because they seemed to follow the basic evolution of the proposed emerging-flux model, as originally introduced by Shibata et al. (1992).
Moore et al. (2010) also however identified a category of jets that evolve much more explosively and with broad curtain-like spires. They proposed that these jets resulted when the field in the core of the emerging (or emerged) bipole is strongly sheared and twisted relative to its potential-field form, and is triggered to undergo an eruption that blows out the bipole’s entire magnetic arch (hence, “blowout eruption”). They proposed that the blowout eruption is triggered either from inside, at the magnetic neutral line in the core of, or from outside of the bipole, by the onset of JBP-making reconnection of the bipole’s magnetic arch with ambient far-reaching field. Either way, the blowout eruption results in a much broader eruption that encompasses the width of the entire jet-base region, or even broader than the base. They called events in this category “blowout jets,” due to their blowout-explosion nature. Often the exploding bipole would carry cool filament-like material outward as it explodes, explaining the prevalence of cool EUV-emitting (seen in, e.g., 304 Å He ii images) spires they observed in these blowout jets. There have been several numerical simulations that reproduce properties of blowout jets based on the emerging-flux picture (e.g. Moreno-Insertis & Galsgaard, 2013; Fang et al., 2014; Cheung et al., 2015).
Thus, up until that point, both the standard jets and blowout jets were explained in terms of the emerging-flux (or recently emerged flux) scenario. We will discuss the emerging-flux model for making jets further in §2.
Several studies however indicated that, instead, jets are small-scale versions of solar eruptions (e.g. Nisticò et al., 2009; Raouafi et al., 2010; Hong et al., 2014), with some showing clearly small-scale filament eruptions making a jet (Shen et al., 2012). Also, some studies found flux cancelation leading to their observed jets (e.g. Shen et al., 2012; Innes & Teriaca, 2013; Hong et al., 2014; Young & Muglach, 2014a, b; Muglach, 2021). Many of these studies utilized high-resolution, high-cadence EUV jet observations from the Solar Dynamic Observatory’s (SDO) Atmospheric Imaging Assembly (AIA), although, even before SDO’s 2010 launch, there were indications that jets are made by small-scale flare/CME-type eruptions (e.g. Nisticò et al., 2009; Raouafi et al., 2010).
Based on the study of one on-disk jet (Adams et al., 2014), and then of 20 polar-limb jets (Sterling et al., 2015), Sterling et al. (2015) suggested that most or all coronal jets might be due to minifilament eruptions, where the JBP is a miniature version of the flare arcade that accompanies large-scale filament eruptions, and they presented a schematic for how the minifilament eruptions produce the jets (cf. Fig. 2 below). They explained standard jets (i.e., thin-X-ray-spire jets) as occurring when the erupting minifilament is largely confined to the base region of the jet; that is, it is analogous to a scaled-down version of a flare-making confined eruption (e.g. Moore et al., 2001; Ji et al., 2003; Sterling et al., 2011), so that little or none of any confined cool (mini)filament material leaks out. Blowout jets would occur when the eruption is strong enough for much of the erupting minifilament to escape the base region completely. Numerical simulations by Wyper et al. (2017) and Wyper et al. (2018) successfully modeled the basic scenario for the minifilament-eruption model for coronal jets.
In this paper, we follow up on previous studies of observations of multiple coronal jets near the polar limb (Nisticò et al., 2009; Moore et al., 2010, 2013; Sterling et al., 2015), by presenting new observations of polar coronal jets using XRT (SXR) and AIA (EUV) images. We focus on the lateral drift of the jet spire relative to the JBP (§4.2), which, as we show below (§2), can provide insight into the jet-formation mechanism; erupting-minifilament visibility (§4.3); and the evident sympathetic nature of some jetting events (§4.4).
2 Jet Models and Jet-Spire Drift
Movies of coronal jets constructed from XRT images reveal that the jet spires frequently have transverse drift motions. Shibata et al. (1992) first reported “translational” motions of jets, although detailed analysis would have been difficult with the comparatively low-cadence Yohkoh/SXT data that they used. With XRT, Savcheva et al. (2007) found transverse drift velocities of 0—35 km s-1; Savcheva et al. (2009) found an average of 10 km s-1 for the drift velocities, and further found that in most jets the spire drifted away from the JBP. We present our analysis of spire drift in §4.2. In the present section, we consider what spire drift would be expected based on jet-production pictures (idealized to 2D). As described above, both the emerging-flux and the minifilament-eruption models for coronal jets can provide seemingly plausible explanations for both standard and blowout jets; the question is: how are jets actually made on the Sun? Here, we consider the expected spire drift for four cases: (1) standard jets in the emerging-flux model, (2) blowout jets in the emerging-flux model, (3) standard jets in the minifilament-eruption model, and (4) blowout jets in the minifilament-eruption model.
2.1 Spire Drift in the Emerging-Flux Model
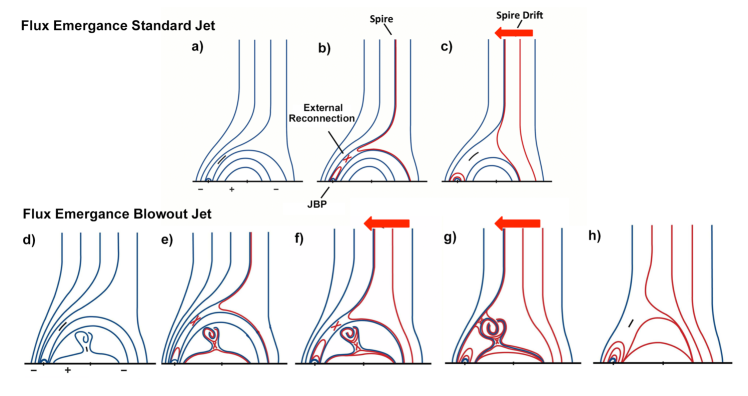
Figure 1 shows jet formation and the spire drift under the assumption that the spire is directly made by reconnection of emerging or emerged closed magnetic field. Panels 1(a)—1(c) show the jet spire evolution in a standard jet. Panel 1(a) gives the basic setup for the emerging-flux model. This picture assumes an ambient background negative-polarity vertical field, representative of a coronal hole with negative-polarity open field. For this case, and all the remaining cases, essentially the same geometry could hold in quiet Sun; the same geometry can hold even for some active-region areas, but where the nearly vertical field might be a far-reaching coronal loop instead of open. In Figure 1(a), the emerging field forms a current sheet at its interface with the ambient field, represented by the black dash. From the continued emergence (panel 1(b)), external reconnection (reconnection of the outside of the emerging bipole) ensues, producing a small loop (a small arcade in 3D) on the left side. This reconnection also reconnects ambient open field from the left side to the right side of the emerging magnetic arch. The reconnected open and closed fields are drawn in red. Further reconnection (panel 1(c)) grows the small closed arcade on the left side, and more reconnected open field that snaps to stand straight up (from magnetic tension) adjacent to the previous reconnected open field; this newly reconnected open field stands closer to the loop/arcade than does the first. Shibata et al. (1992) interpreted the small loop/arcade on the left side as the JBP observed in SXRs. Thus, under these assumptions, the spire drift with time should be toward the JBP for standard jets according to the emerging-flux model.
Figures 1(d)—1(h) show a blowout jet based on the emerging flux model. Here, it is supposed that the jet forms when emerging field, or emerged field, explodes into overlying and surrounding ambient coronal field; this is a variation of the Shibata et al. (1992) idea introduced by Moore et al. (2010) and elaborated upon by Moore et al. (2013). Moore et al. (2010) assumed that in this case the emerging/emerged bipole contains sufficient free energy to power an explosion of the emerging/emerged bipole. Panel 1(a) shows the emerging/emerged field as containing free energy because of twist in the core field, and this free energy is set to be released given the appropriate circumstances. Initially reconnection occurs in panel 1(e) at the external current sheet, as in the standard-jet case in panel 1(b). This reconnection is either started by or triggers the explosion of the emerging/emerged bipole (panel 1(e)—1(g)). The exploding field drives continued external reconnection at the exterior current sheet, and also drives internal reconnection, which is reconnection among the legs of the exploding bipole field (represented by the lower red X in panels 1(e) and 1(f)). This driven internal reconnection, along with the external reconnection, results in a bright base region, where the brightened region is substantially broader than that from the external reconnection alone. Also, the expansion of the exploding bipole results in a broadened spire as it blows out. Here, the early spire movement is identical to the case of the standard jet in panels 1(a)—1(c), with the spire marching toward the JBP. With the continuation of the explosion of the base bipole, the stacking up of the field lines progressively closer to the JBP continues. Hence, just as in the emerging-flux-model standard-jet case, the spire drifts toward the JBP for blowout jets in the emerging-flux model.
Therefore, in the emerging flux (or emerged flux) jet-producing scenario, we would expect to see the bright spire drift toward the JBP with time. This result is true for both the so-called standard jet and the so-called blowout jet cases of the emerging-flux scenario for jet production.
2.2 Spire Drift in the Minifilament-Eruption Model
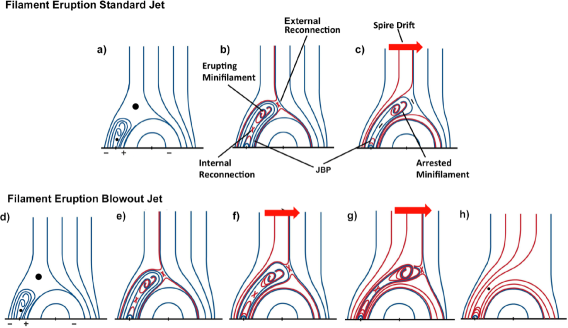
Figure 2 shows jet formation and the spire drift under the assumption that the jet is made by a minifilament eruption. Panels 2(a)—2(c) show the spire evolution in the case where a standard jet forms. Panel 2(a) shows the situation prior to the start of jet formation, where a minority polarity (positive in this case) flux element resides in a background majority-polarity (negative) open field region, such as a coronal hole. This minority polarity might be one end of an emerged bipole or it may have coalesced from smaller minority-polarity flux elements (Panesar et al., 2018a), or the minority polarity may have migrated into the majority-polarity region as a consequence of photospheric surface flows (e.g. Adams et al., 2014). As it migrates, it will reconnect with surrounding negative field, forming an anemone-shaped field (Shibata et al., 2007). Panel 2(a) shows a cross-section of that anemone field, where one lobe is more compact due to photospheric converging flows, and has sheared magnetic stress build up in it via some process (e.g., photospheric shearing flows). Field in the compact side is highly sheared or even twisted into a flux rope. Often it contains cool material, forming the minifilament (Sterling et al., 2015). At the time of Panel 2(a), based on our more recent studies (Panesar et al., 2020), we believe that there is no substantial current sheet yet present between the minifilament lobe and the open ambient coronal field. So, instead of a dash for a current sheet, here we represent the location where a magnetic null exists by a dot between the closed-field lobe and the open field. There is also a dot at a second null point (the lower dot), this one interior to the bipole between its legs.
Panel 2(b) shows the minifilament field erupting, and at this time current sheets form and reconnections occur at the locations of the dots in panel 2(a): internal reconnection occurring among the extended legs of the erupting minifilament field at the location of the lower dot in panel 2(a), and external reconnection occurring between the outside of the erupting minifilament-enveloping field and the encountered ambient field at the location of the upper dot in panel 2(a). Sterling et al. (2015) argue that the lower reconnection product of the internal reconnection is responsible for the JBP; it is analogous to the flare arcade formed below an erupting large-scale filament. The second (upper) product of the internal reconnection is closed twisted field added to the erupting minifilament flux-rope field (this would be a new helical field line in 3D). The external reconnection also has two reconnection products. One is a new closed field line extending over the neighboring larger lobe (in this 2D representation) of the anemone region. The second (upper) product of the external reconnection is reconnected open field; the initial reconnected open field stands (in the corona) close to the location of the JBP. As the minifilament continues to erupt outward, it moves deeper into the corona in a direction away from the JBP, and new open field lines stand (in the corona) progressively farther from the JBP. In the case of the standard jet, the minifilament flux rope does not progress far into the corona on the far side of the large lobe, and therefore only a narrow spire forms. Because in this case the minifilament flux rope does not have enough energy to blowout the enveloping magnetic arcade, it becomes arrested (confined) in the base of the jet; in this case part of the minifilament may fall back to the solar surface and a little of it might leak out into the narrow open spire field. While the minifilament eruption continues, the spire continues to grow, and drifts away from the JBP in this standard-jet case in the minifilament-eruption model.
Panels 2(d)—2(h) show a blowout jet in the minifilament eruption model. In this case, the jet starts (2(d)—2(f)) as in the standard-jet case (panels 2(a)—2(c)), but now the erupting lobe’s minifilament flux rope contains enough energy to expand and to escape explosively (blow out) from the base region (2(f)), eventually making a wide splay of field over the base region (2(h)), consistent with the morphology of blowout jets. As it becomes larger, the jet spire continues to drift away from the JBP location. Thus here too, the drift of the spire is away from the JBP in the blowout-jet case in the minifilament-eruption model.
Therefore, in the minifilament-eruption jet-producing scenario, we would expect to see the spire generally drift away from the JBP, for both the standard- and blowout-jet cases. This prediction is in contrast to the flux-emergence scenario, which predicts the spire drifts toward the JBP during the jet’s growth. In 3D, the spire drift could appear differently from the simplified 2D depiction of Figures 1 and 2; for example, if the spire’s drift is directly toward or directly away from the observer, then drift away from the JBP would not be apparent. Usually though, we expect that a polar-coronal-hole-jet spire that is truly moving away from the JBP to appear to be drifting away from the JBP, at least when observed inside the limb, from the perspective of Hinode or SDO.
3 Instrumentation and Data
We will examine jet spire drift and other jet properties in the following sections, using data from Hinode/XRT and SDO/AIA. XRT takes images of the Sun with broad-band SXR filters and a pixel size of (Golub et al., 2007). Although it is capable of taking full-disk images, for this project we restricted our data sets to those with field of view (FOV) smaller than the entire disk and centered on one or the other of the two polar coronal hole regions. AIA observes the full solar disk continuously with seven EUV filters with pixel size of (Lemen et al., 2012). Because the preferred XRT time periods were limited to when it was observing polar regions, we first selected data based on availability of appropriate XRT data, and then obtained AIA data for matching time periods.
We examined data between 2014 August and 2016 August, and searched for time periods when XRT was specifically observing either of the two polar regions. Almost always this was during the time periods when Hinode Operations Plan (HOP) number 81 was run. This HOP has run once a month on the two polar holes nearly every month since 2008, about two years after Hinode’s 2006 launch, and continues through the time of this writing. During these runs, XRT observes the polar regions roughly continuously for typically six to eight hours. There were breaks in the continuity for short periods due to other pre-planned observations, and for some periods where Hinode experienced spacecraft night (Kosugi et al., 2007).
Our selected time period of 2014-2016 coincided with a phase of the solar cycle when often the coronal holes were small and/or often obscured by quiet Sun corona in the foreground. These effects combine to make it relatively difficult to observe coronal jets, for example compared to the periods analyzed by Savcheva et al. (2007), and Moore et al. (2013) and Sterling et al. (2015), when the coronal holes were generally less obscured. We made an initial selection of 130 candidate jets from over 278 hours of examined data. Only a small percentage of these jets, however, were quite well observed. We selected from this set 23 jets for the closer analysis presented in this study. Our only criterion was that the jets be well observed in XRT. While we cannot prove that no bias was involved in our selection, we expect that our selection is typical of coronal X-ray jets; this is because, based on our visual inspection, our 23 selected jets appear typical of other well-observed jets that we have seen, including those analyzed in Sterling et al. (2015). Table 1 presents these jets, along with some of their observed properties. Among the remaining 107 jets, the majority were difficult to examine due to very faint spires, and/or due the the small (compact) size of the jet. In the case of the faint spires, often this was likely a consequence of the haze of the foreground corona that obscured the subtle spire movements that would be more obvious when the coronal holes are more directly visible. In the case of the compact sizes, it was just hard to resolve the structure of the brightening region. In the majority of cases it would not be feasible to analyze those jets via the methods we employ here. Most of our 23 selected jets were bright enough and prominent enough to show through the coronal haze. A few of the events, such as events 12, 15, and 16, occur in coronal holes that are less obscured by coronal haze. A more comprehensive study of jets might be attempted specifically focusing on periods of less-obscured coronal hole visibility.
Our observations are with the Al/poly XRT filter, which is a relatively “thin” filter in that it is sensitive to SXR emissions from as low as about 1 MK, which is relatively cool for coronal plasmas, and it is also sensitive to all hotter temperatures (Narukage et al., 2011). This temperature sensitivity is ideal for observing jets in polar coronal holes since most of them consist of plasmas in the 1–2 MK range (Pucci et al., 2013; Paraschiv et al., 2015). The FOV was , at cadence of 60 s.
For all of the XRT observing periods, we obtained coincident AIA data with the same (or somewhat wider) FOVs. For this project we examined 12-s cadence AIA EUV images at 304, 171, 193, and 211 Å, which have a peak response to plasmas of temperatures , , , and K, respectively. We selected these channels, and did not include the “hotter-response” channels of 131, 335, and 94 Å, because Sterling et al. (2015) found polar coronal hole jets to be best visible in these cooler channels. In general, the AIA channels can detect mixtures of hotter- (1 MK) and cooler- ( MK) temperature coronal plasmas due to their broad temperature responses (Lemen et al., 2012). In contrast, emissions appearing bright in XRT images unambiguously come from locations of high (1 MK) temperatures, as it has negligible sensitivity to cooler temperatures. For this reason, where there is ambiguity, XRT images are more appropriate than AIA images for identifying the JBP in most circumstances. Given a set of XRT-observed jets with clearly discernible spires, Moore et al. (2010) and Moore et al. (2013) showed that only some (roughly 50%) jets have clear spires in 304 Å EUV images, while others of the set have little or no EUV 304 Å spire. A similar detailed comparison of spire visibility between SXR jets and other AIA wavelengths has not been carried out, but our experience indicates that the appearance of jets can vary markedly in different wavelengths and from jet to jet. Consequently, a study of AIA-observed spire drift would require separate extensive investigations, and therefore this study focuses on the spire drift in the XRT images only.
4 Observations
4.1 Sample Events
From the 23 jets listed in Table 1, we first show two of these jets in detail, one being a standard jet and the other being a blowout jet.
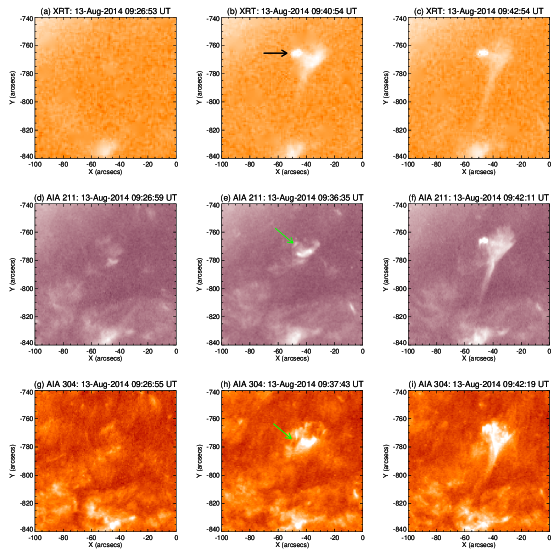
Figure 3 shows the standard jet, labeled number 1 in Table 1. Figures 3(a)—3(c) show the jet in SXRs from XRT, Figures 3(d)—3(f) show it in EUV from the AIA 211 Å channel, and Figures 3(g)—3(i) show it in EUV from the AIA 304 Å channel. Since the features are subtle, for these figures (and corresponding videos), we increase the signal strength relative to the noise by performing a running sum over two consecutive images, with the cadence remaining 60 s for the XRT videos. For the AIA videos, we present every other image, so that the cadence is 24 s, which is fully adequate to show the features while reducing the overall length of the video to a more manageable duration. In Figure 3(a), the jet has not started and shows no signal in the XRT image. At the same times, there is only a slight brightening in 211 Å (Fig. 3(d)) and 304 Å (Fig. 3(g)). By the time of Figure 3(b), the spire is starting to extend outward from the base region. A strong brightening, the JBP, appears on the east side of the base. The spire is narrow in width compared to the width of the base region (where the base includes the JBP, and the bright loop situated immediately west of the JBP; the spire emanates from that west-side bright loop). In Figure 3(c), the spire has extended in length, while retaining its narrow width; this persistent narrow width through the life of the X-ray jet’s spire is characteristic of a “standard jet,” as defined in Moore et al. (2010). In 3(c) however, the spire has drifted westward compared to its location in 3(b); this can be seen by observing the location of the tip of the spire in the two frames relative to the bright feature at the bottom edge in the middle of the panels 3(b) and 3(c). This drifting motion is more apparent in video movie_fig3 that accompanies Figure 3. This series shows clearly the spire drifting away from the JBP with time, as is expected in the minifilament-eruption model.
A minifilament that is starting to erupt is apparent in the AIA 211 Å (Fig. 3(e)) and 304 Å (Fig. 3(h)) panels (green arrows). The images in these panels are a few minutes earlier than that in panel 3(b) immediately above them, in order to show the spire clearly in Figure 3(b) and the erupting minifilament in Figures 3(e) and 3(h). In AIA 211 Å, the video movie_fig3 shows the spire development and drift, in addition to the erupting minifilament. In AIA 304 Å, the video movie_fig3 shows copious cool erupting-minifilament material flowing out from the base region.
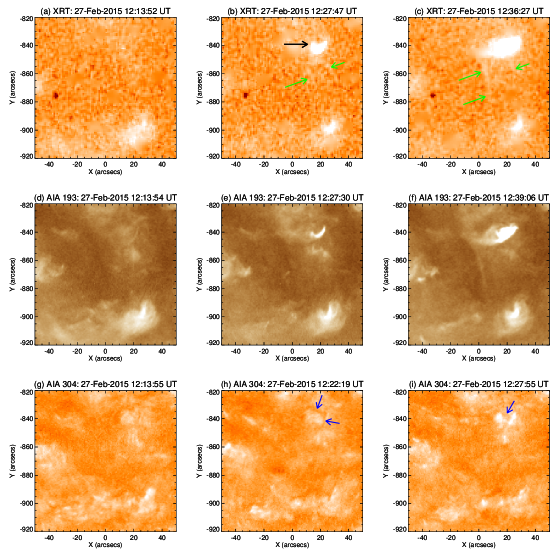
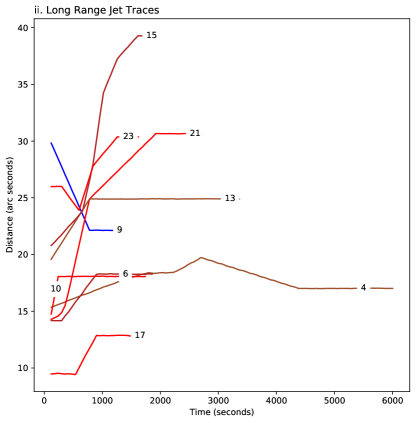
Figure 4 shows an example of a blowout jet, this time with images from XRT, and from the AIA 193 Å and 304 Å channels (each summed over two consecutive images). This jet is labeled number 2 in Table 1. Again in the early-time images (Figs. 4(a,d,g)), there is little or no indication of an impending jet. By the time of Figure 4(b), a strong JBP is apparent, and the jet spire is faint but visibly starting (green arrows). By the time of Figure 4(c), the base brightening has expanded beyond the JBP so that the entire base now is bright, and the spire has expanded to be about as wide as the base. These characteristics describe blowout jets. As indicated by the green arrows in Figures 4(b) and 4(c), the drift of the spire is largely away from the JBP (black arrow in Fig. 4(b)), which again is consistent with the minifilament-eruption model. These motions are more clear in the video movie_fig4, which accompanies Figure 4. Images from the AIA 193 Å channel (Figs. 4(e and f), and video movie_fig4) show corresponding brightenings and spire drift.
In this case, the erupting minifilament is comparatively faint and diffuse, but it is visible in the 193 Å movie, and perhaps more clear in the AIA 304 Å images (dark arrows in Figs. 4(h and i)) and video (movie_fig4).
4.2 Spire drift
As argued in §2.2, the direction of drift of the spire relative to the JBP should reflect the mechanism that produces the jet: the spire should drift toward the JBP in the emerging-flux model, and it should drift away from the JBP in the minifilament-eruption model. For the two events of Table 1 examined in §4.1, we saw that the spire moved away from the JBP with time. Here we examine the spire movement for all 23 events of Table 1.
We do this by tracking the spire motion relative to the JBP, with assistance of a semi-automated tracking algorithm in Mathematica. We manually selected the JBP and spire to begin tracking. We examined the tracking for each timestep, and made manual adjustments to the automatically selected new spire and JBP locations when necessary (which was frequently the case).
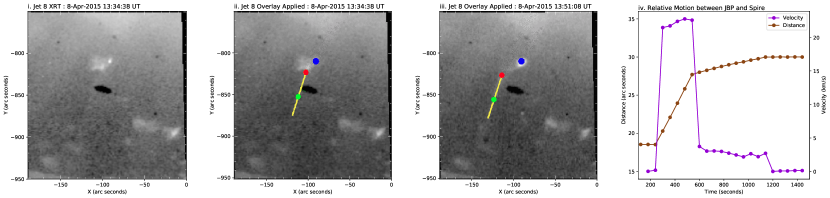
For each jet, we track the spire drift relative to the JBP with this procedure (presented in outline here; see Appendix A for further details): We centered a small blue disk on the JBP, and two small coloured disks on the spire: a red one at the base of the spire and a green one along the body of the spire, with a yellow line segment through them that approximately traces the spire.
Figure 5 shows an example with jet number 8. The middle panels show the blue disk on the JBP, red and green disks on the spire, and the yellow line approximately tracing the spire. Our routine then automatically places these markers on the evolved jet in the subsequent frame (which we visually confirmed for each frame). We logged the locations of all the markers, giving us a data base of the spire drift with time during the jet. Figure 5’s right-most panel shows a plot of the results, with the brown line showing the distance of the jet-spire base (red disk) from the JBP (blue disk) as a function of time. When we initially start tracking, the separation is about . There is a rapid drift of the spire away from the JBP from about t=300 s to 600 s, and then the spire drifts much less at later times. Again the movement is away from the JBP.
Figure 6 shows examples for four more jets, numbers 6, 19, 23, and 9 of Table 1. The first three cases again show movement of the spire away from the JBP, as in the case of Figure 5 and the two jets of §4.1. The result for Jet 9 (Fig. 6(xiii—xvi)) however is different; Figure 6(xvi) shows that in this case the spire moves toward the JBP (decreasing offset distance with time). We also see though from Figures 6(xiii—xv) that this jet is located at the solar limb; in fact, the bottom-most part of the jet base and the JBP appears to be partially obscured by the limb. Thus, there is additional uncertainty in the drift of Jet 9 in Figures 6(xiii—xvi).
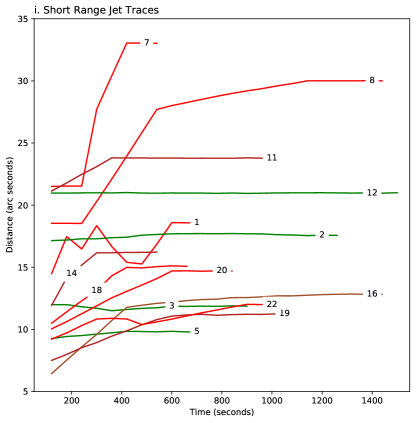
Figure 7 shows the trajectories of the spires relative to the JBPs for the 23 jets of Table 1. We have split the results into two plots for ease of display, where the jets that we followed for less than 1500 s are in Figure 7(i), and the longer-lived jets in Figure 7(ii). Red, brown, and purple lines all show cases where the spire drift was away from the JBP; we use these three close-but-slightly different colours for this so the eye can track which trajectory is which even when they overlap. Green tracks show jets for which there was little or no detectable movement of the spire relative to the JBP, and blue shows any that drift toward the JBP. This shows that Jet 9 is the only jet in our set that drifts toward the JBP. All of the other jets of the plots either drifted away from the JBP with time (18 jets), or were essentially stationary (mean velocity 1 km s-1; the four jets marked by the green trajectories) with time.
Although we cannot confirm this here, we suspect that the motion we detect for Jet 9 is a consequence of our viewing perspective – which places it at or just beyond the solar limb – rather than of the spire actually moving toward the JBP. We believe this projection effect to be a plausible explanation since we have observed that spire motions of on-disk jets can have two components: one component with motion directed away from the JBP, and a second component that is normal to that first component. So if we are observing the over-the-limb jet approximately along the direction of the first component (that is, the component of the spire’s motion is directed roughly toward or away from Earth), then the second component could make the spire appear to move toward the JBP in some cases, or away from the JBP in other cases.
Omitting the one negative-drift jet, among the 22 remaining zero or positive-drift jets, we find the jet drift speeds (projected against the plane of the sky) to span 0—40 km s-1, with four jets that are stationary (which we take to be km s-1), and the remaining ones to have an average drift speed of 8 km s-1. These results are consistent with the the above-quoted Savcheva et al. (2007) and Savcheva et al. (2009) values of 0—35 km s-1 for the range and average speed of 10 km s-1.
4.3 Erupting minifilaments
We inspected the 23 jets of Table 1 for indications of erupting minifilaments. Jets 1 and 2, discussed in §4.1, are representative examples that have erupting minifilaments visible in AIA images. Table 1 indicates whether an erupting minifilament was detected, through visual inspection, near the start of our jets. As the notes in Table 1 indicate however, when erupting minifilaments were observed, they sometimes were better seen in some AIA channels than in others. For example, we find the erupting minifilament for jet 2 to be more apparent in the 171 Å and 193 Å channels than in 304 Å, while the erupting minifilaments for jets 6 and 7 are better seen in 304 Å than in other channels. Sterling et al. (2015) also found erupting minifilaments to be better seen in 304 Å than in 171 Å, 193 Å, or 211 Å for three of their 25 jets (see the “minifilament measurement details” section of Sterling et al., 2015). Therefore it is necessary to check multiple AIA channels before concluding definitively that an erupting minifilament may not accompany a given jet, at least in the case of polar coronal hole jets.
For at least 20 of 23 of our jets, or 87%, we could identify an attendant erupting minifilament. For two cases, cases 9 and 13, we could not identify an erupting minifilament. It was also difficult to see an erupting minifilament in case 16; although we still suspect that an erupting minifilament was present, it is at best very faint and harder to detect than in the other cases. In both of the two cases 9 and 13 with no unambiguous erupting minifilament, the jets were at, and perhaps partially beyond, the limb; thus these jets may have resulted from erupting minifilaments that were obscured by the limb.
Our observed correspondence between jets and erupting minifilaments is similar to that of McGlasson et al. (2019), who found evidence for erupting minifilaments during the early formation time of jets in over 90% of the 60 on-disk jets that they examined. Kumar et al. (2019) report evidence for erupting minifilaments in 67% of a set of 27 equatorial coronal hole jets that they examined, while they note that the remaining 33% showed mini-flare arcades and other eruption signatures. While still a majority, their percentage of jets with erupting minifilaments is substantially smaller than our reported values of in excess of 90%. It is unclear, however, whether the Kumar et al. (2019) investigators would have reported as jets with erupting minifilaments some of the cases where we detect relatively small erupting minifilaments (e.g. jets 7, 10, 12), or some of our cases where we find erupting minifilaments to be relatively indistinct or invisible in some of the AIA channels (e.g., jet 16). Nonetheless, our work here, along with other of our works (e.g. Sterling et al., 2015; Panesar et al., 2016, 2018b; McGlasson et al., 2019), Kumar et al. (2019), and some earlier works (e.g., Raouafi et al., 2010), all examined multiple events and find evidence for miniature-flare/CME-type eruptive activity as the cause of nearly all of coronal hole and/or quiet Sun jets observed in those studies.
4.4 Sympathetic Jets
Sympathetic flares are defined as: “solar flares in different active regions that apparently occur as the common result of the activation of a coronal connection between the regions” (see, e.g., Moon et al., 2002). There had long been suspicion that such sympathetic flare pairs exist, but proving the case statistically has been a challenge (e.g. Pearce & Harrison, 1990; Biesecker & Thompson, 2000). Recent observations, however, with high-resolution and high-cadence full-Sun observations in the EUV shows that there are many solar eruptions/flares in different active regions that are physically (causally) connected (Schrijver & Title, 2011).
We define “sympathetic jets” in a fashion similar to the above, as jets that occur in different jet-base regions, apparently as the result of a magnetic connection between the regions. Thus, sympathetic jets are when a subsequent jet occurs at a different location due to an apparent magnetic connection to an earlier jet; we expect that such jets will occur in quick succession. With the spectral coverage of XRT alone, it can be difficult to determine whether two jets in close succession are sympathetic. As with the case for sympathetic flares however, upon further investigation with the AIA data, a causational relationship is sometimes clear. We found that in our set of jets (Table 1), at least three jets may be part of a sympathetic pair of events: 3, 11, and 15. Jets 3 and 11 each refer to only one of the two jets of the pair, as we initially selected only the most obvious of the two in the X-ray images for closer study. The AIA data however reinforces that each of these two jets may have a separate-base nearby sympathetic counterpart. For Jet 15, we initially took both of the sympathetic jets of the pair to be part of the same single XRT jet. But upon examination in AIA images and movies we saw that this event appears to consist of a connected pair of jets closely spaced in time but closely offset in base location. For at least events 3 and 11, we observe no firm evidence for a physical connection between the seeming jet pairs. Event 15 however does seem to consist of two jets from a two-part extended eruption of a long minifilament.
We show the jet(s) of event 15 in Figure 8, in XRT images and in AIA 193 Å and 304 Å images. Panels 8(a), 8(d), and 8(g) show the situation prior to the jets. Panels 8(b) and 8(e) show the first jet, and 8(f) shows the minifilament for that first jet just starting to erupt. Panels 8(c) and 8(f) show the second jet, which is displaced by some to the west of the first jet’s base location, and 8(i) shows the minifilament that makes that jet just starting to erupt. Videos in the left, center, and right panels of movie_fig8 respectively show the evolution in XRT, AIA 193 Å, and AIA 304 Å.
From the 193 Å video, a microfilament clearly erupts from the first jet’s location between 13:21 and 13:28 UT on 2016 March 17. Flows from that first-eruption location connect to a second minifilament, which lifts off and erupts between 13:47 and 13:52 UT, resulting in the second jet.
Recently, Tang et al. (2021) report a sympathetic jet pair, consisting of standard-jet and a blowout-jet, where the standard jet apparently triggered onset of the blowout jet. Chen et al. (2017) reported similar “complex” jet pairs, whereby a jet occurring on one magnetic neutral line set off a jet on a neighboring neutral line. Also, Kumar et al. (2019) report that two of the 27 equatorial coronal hole jets they examined were sympathetic with eruptions of (mini)filaments from neighboring bright points. Moreover, the magnetic connectivity that we suggest facilitates the sympathetic jets observed here, is consistent with the suggestion of Pucci et al. (2012) that similar magnetic connectivity might explain the sympathetic activity that they observed among polar jets and multiple X-ray bright points.
5 Summary and Conclusions
From the 23 coronal jets selected from XRT SXR images and examined here, the vast majority (22 of 23) showed a spire that drifted away from the JBP with time (18 cases) or was virtually stationary (four cases). There was only one of the 23 jets where we found the spire to move toward the JBP with time, and it was positioned at the solar limb, or maybe even slightly beyond the limb. Based on the discussions in §2, we conclude that the spire drifts support the minifilament-eruption model for solar jets, where a minifilament eruption makes the jet and where the magnetic field beneath the erupting minifilament undergoes internal reconnection to produce the (mini)flare-like JBP at or near the minifilament-eruption-onset location (Sterling et al., 2015).
For the one over-the-limb jet with the spire moving toward the JBP, we have argued that it is possible that the spire was actually moving away from the JBP with time, but with a large component of that movement along the line-of-sight of our observations, and an orthogonal component making the spire appear to move toward the JBP from our viewing perspective. Nonetheless, with this data set alone, we are not able to rule out that this lone case obeys the emerging-flux model, or some other mechanism, instead.
Savcheva et al. (2009) studied the motions of polar coronal hole jets using XRT data, and report that about 75%—80% of the time the spires drift away from the JBP. They do not note whether any in their sample might have been over the limb. Also, however, they could not detect spire motions for about one-half of their sample of over 400 jets, mostly because they were not able to measure motions in their smaller jets. Because we report a much lower percentage of stationary spires (four out of 23), it could be that our detection level of 1 km s-1 of our 23 selected jets was more sensitive than the method that they utilized. Given these considerations, we regard our results for the spire movement compared to the JBP to be reasonably in agreement with the Savcheva et al. (2009) findings.
We identify minifilaments that erupt at the time of jet onset in 87% of the 23 jets of Table 1. This measurement is also consistent with recent studies of jets (e.g., Panesar et al., 2016, 2018b; McGlasson et al., 2019; Kumar et al., 2019). Thus, this provides further support for the minifilament-eruption scenario for producing at least a large majority of coronal hole and quiet Sun coronal jets. There is also evidence that many active region jets also operate via the same processes, although often in a more complex magnetic environment (Sterling et al., 2016, 2017).
Our study identifies at least three jets that trigger other jets in nearby, but separate, low-atmospheric base regions. These sympathetic jet pairs are closely analogous to typical sympathetic flares. We have not considered in detail whether it is most appropriate to regard these events as truly “sympathetic,” which implies that they occur in photospheric magnetic regions that are largely isolated from each other, or instead whether “double eruptions” occurring along different portions of the same neutral line or on closely adjacent neutral lines, might be a better description. In the latter case, situations such as those where multiple eruptions occur in close succession from the same active region might be a closer analogy (e.g., Török et al., 2011; Sterling & Moore, 2004). The sympathetic pair of events reported by Tang et al. (2021) appear to be such true sympathetic jets, occurring in magnetically separate locations. From our inspection of the data presented here, we are left with the impression that such bone fide sympathetic jets — and also such sympathetic jets occurring over substantially larger spatial scales than our three examples here — are very common in the polar regions, but it would be a challenge to confirm this statistically.
TKB, ACS, and SLS wish to thank Eric Priest in supporting this collaboration, and TKB thanks Akshay Rao for supporting this investigation. TKB, ACS, and SLS wish to acknowledge support from the MSFC Hinode Project, and TKB acknowledges additional financial support through the University of St. Andrews. ACS and RLM were supported by funding from the Heliophysics Division of NASA’s Science Mission Directorate through the Heliophysics Guest Investigator (HGI) Program. AMA acknowledges support from the Research Experience for Undergraduates opportunity funded by NSF Grant No. AGS-1460767. Hinode is a Japanese mission developed and launched by ISAS/JAXA, collaborating with NAOJ as a domestic partner, NASA and STFC (UK) as international partners. Scientific operation of the Hinode mission is conducted by the Hinode science team organized at ISAS/JAXA. This team mainly consists of scientists from institutes in the partner countries. Support for the post-launch operation is provided by JAXA and NAOJ (Japan), STFC (U.K.), NASA, ESA, and NSC (Norway).
Appendix A Semi-Automatised Tracking Algorithm
Our semi-automatised tracking algorithm tracks a jet spire’s lateral offset from the JBP in XRT images. The user inputs the location of the JBP and spire at a specific time, typically near the maximal brightness of the jet. In a blowout jet in which the spire has multiple strands at its maximum brightness in XRT images, we input the location of the spire’s brightest strand. (The only exception to this was event 16, for which the two sides of the spire were about the same intensity; in that case we opted to track the poleward side of the spire, but selecting the side opposite the pole would have produced similar results, because motion of the edges of the spire are approximately symmetric with respect to the JBP for that jet.) The algorithm binarises the XRT imagery, defining regions by a global intensity threshold. This image is then passed through a filter deleting small components, typically on the order of 3-5 pixels. The resulting image typically results in a approximately circular region corresponding to the jet bright point and a thin rectangular section defining the jet spire. The algorithm tracks the circular region corresponding to the JBP and the thin rectangular region corresponding to the jet spire. It does so by monitoring the set of pixels surrounding the spire and JBP at one time step, and looks for connected sets of pixels that undergo an intensity increase in the new time step. These typically form well defined shapes, which assists in the feature identification for the subsequent steps. The algorithm monitors the base of the spire, and the centroid of the JBP defined by its bounding radius, for times before and after the specific time initially chosen by the user. The algorithm then places coloured markers, as in figures 5 and 6, for user evaluation. Due to fluctuations in the imagery, and the weak contrast, particularly at the end and beginning of the jet event, user input is needed in most cases to maintain acceptable accuracy in the trace. The algorithm potentially may be improved using machine learning, where we may begin to be able to identify images directly without the binarisation process and small-component filter treatment.
References
- Adams et al. (2014) Adams, M., Sterling, A. C., Moore, R. L., & Gary, G. A. 2014, Astrophysical Journal, 783, 11, doi: 10.1088/0004-637X/783/1/11
- Biesecker & Thompson (2000) Biesecker, D. A., & Thompson, B. J. 2000, J. Sol.-Terr. Phys., 62, 1449, doi: 10.1016/S1364-6826(00)00085-7
- Chen et al. (2017) Chen, J., Su, J., Deng, Y., & Priest, E. R. 2017, Astrophysical Journal, 840, 54, doi: 10.3847/1538-4357/aa6c59
- Cheung et al. (2015) Cheung, M. C. M., De Pontieu, B., Tarbell, T. D., et al. 2015, ApJ, 801, 83, doi: 10.1088/0004-637X/801/2/83
- Cirtain et al. (2007) Cirtain, J. W., Golub, L., Lundquist, L., et al. 2007, Science, 318, 1580, doi: 10.1126/science.1147050
- Fang et al. (2014) Fang, F., Fan, Y., & McIntosh, S. W. 2014, Astrophysical Journal, 789, 19, doi: 10.1088/2041-8205/789/1/L19
- Golub et al. (2007) Golub, L., Deluca, E., Austin, G., et al. 2007, Sol. Phys., 243, 63, doi: 10.1007/s11207-007-0182-1
- Hinode Review Team et al. (2019) Hinode Review Team, Khalid, A.-J., Patrick, A., et al. 2019, Publications of the Astronomical Society of Japan, 71, id.R1, doi: 10.1093/pasj/psz084
- Hong et al. (2014) Hong, J., Jiang, Y., Yang, J., et al. 2014, Astrophysical Journal, 796, 73, doi: 10.1088/0004-637X/796/2/73
- Huang et al. (2012) Huang, Z., Madjarska, M. S., Doyle, J. G., & Lamb, D. A. 2012, Astronomy and Astrophysics, 548, 62, doi: 10.1051/0004-6361/201220079
- Innes & Teriaca (2013) Innes, D., & Teriaca, L. 2013, Solar Physics, 282, 453, doi: 10.1007/s11207-012-0199-y
- Ji et al. (2003) Ji, H., Wang, H., Schmahl, E. J., Moon, Y.-j., & Jiang, Y. 2003, Astrophysical Journal, 595L, 135, doi: 10.1086/378178
- Kosugi et al. (2007) Kosugi, T., Matsuzaki, K., Sakao, T., et al. 2007, Solar Physics, 243, 3, doi: 10.1007/s11207-007-9014-6
- Kumar et al. (2019) Kumar, P., Karpen, J. T., Antiochos, S. K., et al. 2019, ApJ, 873, 93, doi: 10.3847/1538-4357/ab04af
- Lemen et al. (2012) Lemen, J. R., Title, A. M., Akin, D. J., et al. 2012, Sol. Phys., 275, 17, doi: 10.1007/s11207-011-9776-8
- McGlasson et al. (2019) McGlasson, R. A., Panesar, N. K., Sterling, A. C., & Moore, R. L. 2019, ApJ, 882, 16, doi: 10.3847/1538-4357/ab2fe3
- Moon et al. (2002) Moon, Y.-J., Choe, G. S., Park, Y. D., et al. 2002, Astrophysical Journal, 574, 434
- Moore et al. (2010) Moore, R. L., Cirtain, J. W., Sterling, A. C., & Falconer, D. A. 2010, ApJ, 720, 757. http://stacks.iop.org/0004-637X/720/i=1/a=757
- Moore et al. (2015) Moore, R. L., Sterling, A. C., & Falconer, D. A. 2015, Joint American Astronomical Society/American Geophysical Union Triennial Earth-Sun Summit, meeting #1, id.407.02
- Moore et al. (2013) Moore, R. L., Sterling, A. C., Falconer, D. A., & Robe, D. 2013, Astrophysical Journal, 769, 134, doi: 10.1088/0004-637X/769/2/134
- Moore et al. (2001) Moore, R. L., Sterling, A. C., Hudson, H. S., & Lemen, J. R. 2001, Astrophysical Journal, 552, 833, doi: 10.1086/320559
- Moreno-Insertis & Galsgaard (2013) Moreno-Insertis, F., & Galsgaard, K. 2013, Astrophysical Journal, 771, 20, doi: 10.1088/0004-637X/771/1/20
- Moreno-Insertis et al. (2008) Moreno-Insertis, F., Galsgaard, K., & Ugarte-Urra, I. 2008, Astrophysical Journal Letters, 673, L211, doi: 10.1086/527560
- Muglach (2021) Muglach, K. 2021, ApJ, 909, 133, doi: 10.3847/1538-4357/abd5ad
- Narukage et al. (2011) Narukage, N., Sakao, T., Kano, R., et al. 2011, Solar Physics, 269, 169, doi: 10.1007/s11207-010-9685-2
- Nishizuka et al. (2008) Nishizuka, N., Shimizu, M., Nakamura, T., et al. 2008, Astrophysical Journal, 683, 83, doi: 10.1086/591445
- Nisticò et al. (2009) Nisticò, G., Bothmer, V., Patsourakos, S., & Zimbardo, G. 2009, Characteristics of EUV Coronal Jets Observed with STEREO/SECCHI, Solar Physics, 259, 87, doi: 10.1007/s11207-009-9424-8
- Panesar et al. (2020) Panesar, N. K., Moore, R. L., & Sterling, A. C. 2020, ApJ, 894, 104, doi: 10.3847/1538-4357/ab88ce
- Panesar et al. (2018a) Panesar, N. K., Sterling, A. C., & Moore, R. L. 2018a, Astrophysical Journal, 853, 189, doi: 10.3847/1538-4357/aaa3e9
- Panesar et al. (2016) Panesar, N. K., Sterling, A. C., Moore, R. L., & Chakrapani, P. 2016, Astrophysical Journal, 832L, 7, doi: 10.3847/2041-8205/832/1/L7
- Panesar et al. (2018b) Panesar, N. K., Sterling, A. C., Moore, R. L., et al. 2018b, Astrophysical Journal, 868L, 27, doi: 10.3847/2041-8213/aaef37
- Paraschiv et al. (2015) Paraschiv, A. R., Bemporad, A., & Sterling, A. C. 2015, Astronomy and Astrophysics, 579, 96, doi: 10.1051/0004-6361/201525671
- Pearce & Harrison (1990) Pearce, G., & Harrison, R. A. 1990, Astronomy and Astrophysics, 228, 513
- Pucci et al. (2012) Pucci, S., Poletto, G., Sterling, A. C., & Romoli, M. 2012, ApJ, 745, L31, doi: 10.1088/2041-8205/745/2/L31
- Pucci et al. (2013) —. 2013, ApJ, 776, 16. http://stacks.iop.org/0004-637X/776/i=1/a=16
- Raouafi et al. (2010) Raouafi, N.-E., Georgoulis, M. K., Rust, D. M., & Bernasconi, P. N. 2010, Astrophysical Journal, 718, 981, doi: 10.1088/0004-637X/718/2/981
- Raouafi et al. (2016) Raouafi, N. E., Patsourakos, S., Pariat, E., et al. 2016, Space Science Reviews, 201, 1, doi: 10.1007/s11214-016-0260-5
- Savcheva et al. (2009) Savcheva, A., Cirtain, J. W., DeLuca, E. E., & Golub, L. 2009, Astrophysical Journal, 702, L32, doi: 10.1088/0004-637X/702/1/L32
- Savcheva et al. (2007) Savcheva, A., Cirtain, J., DeLuca, E. E., et al. 2007, Publications of the Astronomical Society of Japan, 59, S771, doi: 10.1093/pasj/59.sp3.S771
- Schrijver & Title (2011) Schrijver, C. J., & Title, A. M. 2011, Journal of Geophysical Research, 116, A04108, doi: 10.1029/2010JA016224
- Shen (2021) Shen, Y. 2021, Proceedings of the Royal Society of London Series A, 477, 217, doi: 10.1098/rspa.2020.0217
- Shen et al. (2012) Shen, Y., Liu, Y., Su, J., & Deng, Y. 2012, Astrophysical Journal, 745, 164, doi: 10.1088/0004-637X/745/2/164
- Shen et al. (2017) Shen, Y., Liu, Y. D., Su, J., Qu, Z., & Tian, Z. 2017, Astrophysical Journal, 851, 67, doi: 10.3847/1538-4357/aa9a48
- Shibata et al. (1992) Shibata, K., Ishido, Y., Acton, L. W., Strong, K. T.and Hirayama, T., & Uchida, Y. 1992, PASJ, 2, 173
- Shibata et al. (2007) Shibata, K., Nakamura, T., Matsumoto, T., et al. 2007, Science, 318, 1591, doi: 10.1126/science.1146708
- Shimojo et al. (1996) Shimojo, M., Hashimoto, S., Shibata, K., et al. 1996, Publications of the Astronomical Society of Japan, 48, 123, doi: 10.1093/pasj/48.1.123
- Shimojo & Shibata (2000) Shimojo, M., & Shibata, K. 2000, Astrophysical Journal, 542, 1100, doi: 10.1086/317024
- Shimojo et al. (1998) Shimojo, M., Shibata, K., & Harvey, K. L. 1998, Solar Physics, 178, 379, doi: 10.1023/A:1005091905214
- Sterling & Moore (2004) Sterling, A. C., & Moore, R. L. 2004, Astrophysical Journal, 613, 1221, doi: 2004ApJ…613.1221S
- Sterling et al. (2015) Sterling, A. C., Moore, R. L., Falconer, D. A., & Adams, M. 2015, Nature, 523, 437. http://dx.doi.org/10.1038/nature14556
- Sterling et al. (2016) Sterling, A. C., Moore, R. L., Falconer, D. A., et al. 2016, Astrophysical Journal, 821, 100, doi: 10.3847/0004-637X/821/2/100
- Sterling et al. (2017) Sterling, A. C., Moore, R. L., Falconer, D. A., Panesar, N. K., & Martinez, F. 2017, Astrophysical Journal, 844, 28, doi: 10.3847/1538-4357/aa7945
- Sterling et al. (2011) Sterling, A. C., Moore, R. L., & Freeland, S. L. 2011, Astrophysical Journal, 731L, 3, doi: 10.1088/2041-8205/731/1/L3
- Tang et al. (2021) Tang, Z., Shen, Y., Zhou, X., et al. 2021, ApJ, 912, L15, doi: 10.3847/2041-8213/abf73a
- Török et al. (2011) Török, T., Panasenco, O., Titov, V. S., et al. 2011, Astrophysical Journal Letters, 793, 63, doi: 10.1088/2041-8205/739/2/L63
- Wyper et al. (2017) Wyper, P. F., Antiochos, S. K., & DeVore, C. R. 2017, Nature, 544, 452, doi: 10.1038/nature22050
- Wyper et al. (2018) Wyper, P. F., DeVore, C. R., & Antiochos, S. K. 2018, Astrophysical Journal, 852, 98, doi: 10.3847/1538-4357/aa9ffc
- Yokoyama & Shibata (1995) Yokoyama, T., & Shibata, K. 1995, Nature, 375, 42, doi: 10.1038/375042a0
- Young & Muglach (2014a) Young, P. R., & Muglach, K. 2014a, Solar Physics, 289, 3313, doi: 10.1007/s11207-014-0484-z
- Young & Muglach (2014b) —. 2014b, Publications of the Astronomical Society of Japan, 66, 12, doi: 10.1093/pasj/psu088
| XRT Event | DateaaDetermined from XRT images, for a time when the jet is well developed. | TimeaaDetermined from XRT images, for a time when the jet is well developed. | CoordinatesaaDetermined from XRT images, for a time when the jet is well developed. | Erupting Minifilament (EMF) Visibility |
|---|---|---|---|---|
| 1 | 2014 August 13 | 09:41 | (-40, -760) | Clear EMF in all channels. |
| 2 | 2015 February 27 | 12:37 | (10, -840) | EMF, best in 171 and 193 Å. |
| 3 | 2015 March 14 | 13:18 | (-110, -780) | Clear EMF in all channels, probably confined; rolling motion. |
| 4 | 2015 March 14 | 14:15 | (-10, -860) | EMF, best in 193 Å; probably confined at low height. |
| 5 | 2015 March 17 | 13:30 | (-170, -760) | Clear EMF in all channels. |
| 6 | 2015 March 19 | 12:51 | (-160, -820) | EMF in all channels, best in 304 Å. |
| 7 | 2015 March 23 | 17:27 | (180, -870) | Small EMF, best in 304 Å. |
| 8 | 2015 April 8 | 13:50 | (-100, -810) | EMF in all channels. |
| 9 | 2015 June 5 | 13:06 | (180, -870) | No unambiguous EMF detected. |
| 10 | 2016 January 7 | 02:25 | (-60, -970) | Small EMF, maybe best in 211 Å. |
| 11 | 2016 January 7 | 05:04 | (-130, -820) | Clear EMF, likely confined. |
| 12 | 2016 March 8 | 12:22 | (140, -930) | Small EMF, maybe best in 171 and 193 Å. |
| 13 | 2016 March 8 | 15:15 | (20, -970) | No EMF visible (perhaps over the limb). |
| 14 | 2016 March 14 | 16:06 | (30, -830) | Clear EMF, best in 171 and 304 Å; maybe confined. |
| 15 | 2016 March 17 | 13:53 | (80, -880) | EMF, clear in all channels. |
| 16 | 2016 March 17 | 16:06 | (50, -890) | Suspected EMF, faintly visible in 211 Å only (over 15:45—15:55 UT). |
| 17 | 2016 March 23 | 14:09 | (70, -920) | EMF; small size in some channels, larger in 304 Å. |
| 18 | 2016 March 23 | 14:33 | (-30, -950) | EMF, probably best in 211 Å. |
| 19 | 2016 March 23 | 15:19 | (70, -920) | EMF, probably confined. Clear in all except 304 Å. |
| 20 | 2016 April 01 | 10:30 | (-130, -930) | EMF; smallish, visible in all channels, maybe confined. |
| 21 | 2016 April 01 | 11:02 | (-170, -830) | EMF in all channels, probably partially confined to low height. |
| 22 | 2016 April 01 | 11:36 | (-170, -890) | EMF, faintly visible in all channels. |
| 23 | 2016 April 01 | 11:55 | (-170, -830) | EMF, clear in all channels. Partially confined.bbEMF is initially confined, but cool minifilament material may leak into spire near the end of the jet. This jet is nearly homologous with 21, but the minifilamement eruption originates from a slightly different location. |

Animation Captions
Caption for Video “movie_fig3.mp4.” XRT and AIA movies of Jet 1 of Table 1, a standard jet. The left-panel animation corresponds to Figures 3a, 3b, and 3c, showing a Hinode/XRT Al/poly movie of the jet. This video is constructed by performing a running sum of every two consecutive images. This XRT video is presented as a full-cadence (60 s) running-sum movie. The center-panel animation corresponds to Figures 3d, 3e, and 3f showing the jet observed by the SDO AIA 211 Å channel, and the right-panel animation corresponds to Figures 3g, 3h, and 3i, showing the jet observed by the SDO AIA 304 Å channel. These AIA videos are also constructed by performing a running sum of every two consecutive images. For these two AIA movies, however, we show every-other frame of the running sum, resulting in a cadence of 24 s, which is still adequate to show details of the jet evolution. The movies cover 2014 August 13 over approximately 09:27—09:58 UT, and the three panels are approximately in sync (the exact times are given at the top of each panel). The entire movie runs in 6 s.
Caption for Video “movie_fig4.mp4.” XRT and AIA movies of Jet 2 of Table 1, a blowout jet. The left-panel animation corresponds to Figures 4a, 4b, and 4c, showing a Hinode/XRT Al/poly movie of the jet. This video is constructed by performing a running sum of every two consecutive images. This XRT is presented as a full-cadence (60 s) running-sum movie. The center-panel animation corresponds to Figures 4d, 4e, and 4f showing the jet observed by the SDO AIA 193 Å channel, and the right-panel animation corresponds to Figures 4g, 4h, and 4i, showing the jet observed by the SDO AIA 304 Å channel. These AIA videos are also constructed by performing a running sum of every two consecutive images. For these two AIA movies, however, we show every-other frame of the running sum, resulting in a cadence of 24 s, which is still adequate to show details of the jet evolution. We use a non-standard colour table for the AIA 304 Å animation, as we found our selected colours to show the erupting minifilaments more clearly for these cases than when rendered with the standard colour table. The movies cover 2015 February 27 over approximately 12:14—13:13 UT, and the three panels are approximately in sync (the exact times are given at the top of each panel). The entire movie runs in 6 s.
Caption for Video “movie_fig8.mp4.” XRT and AIA movies of Jet 15 of Table 1, which, although listed as one jet in the table, actually consisted of a series of two jets closely linked in space and time (sympathetic jets). The left-panel animation corresponds to Figures 8a, 8b, and 8c, showing a Hinode/XRT Al/poly movie. This video is constructed by performing a running sum of every two consecutive images. This XRT is presented as a full-cadence (60 s) running-sum movie. The center-panel animation corresponds to Figures 8d, 8e, and 8f showing the jet observed by the SDO AIA 193 Å channel, and the right-panel animation corresponds to Figures 8g, 8h, and 8i, showing the jet observed by the SDO AIA 304 Å channel. These AIA videos are also constructed by performing a running sum of every two consecutive images. For these two AIA movies, however, we show every-other frame of the running sum, resulting in a cadence of 24 s, which is still adequate to show details of the jet evolution. We use a non-standard colour table for the AIA 304 Å animation, as we found our selected colours to show the erupting minifilaments more clearly for these cases than when rendered with the standard colour table. The movies cover 2016 March 17, over approximately 12:50—14:25 UT, and the three panels are approximately in sync (the exact times are given at the top of each panel). The entire movie runs in 9 s.