Estimate of the carbon footprint of astronomical research infrastructures
Abstract
The carbon footprint of astronomical research is an increasingly topical issue with first estimates of research institute and national community footprints having recently been published. As these assessments have typically excluded the contribution of astronomical research infrastructures, we complement these studies by providing an estimate of the contribution of astronomical space missions and ground-based observatories using greenhouse gas emission factors that relates cost and payload mass to carbon footprint. We find that worldwide active astronomical research infrastructures currently have a carbon footprint of 20.33.3 MtCO2 equivalent (CO2e) and an annual emission of 1,169249 ktCO2e yr-1 corresponding to a footprint of 36.614.0 tCO2e per year per astronomer. Compared with contributions from other aspects of astronomy research activity, our results suggest that research infrastructures make the single largest contribution to the carbon footprint of an astronomer. We discuss the limitations and uncertainties of our method and explore measures that can bring greenhouse gas emissions from astronomical research infrastructures towards a sustainable level.
1.5
Institut de Recherche en Astrophysique et Planétologie, Université de Toulouse, CNRS, CNES, UPS, 9 avenue Colonel Roche, 31028 Toulouse, Cedex 4, France
The Sixth Assessment Report of the Intergovernmental Panel on Climate Change (IPCC) Working Group I could not be more explicit: “It is unequivocal that human influence has warmed the atmosphere, ocean and land […] Global warming of 1.5∘C and 2∘C will be exceeded during the 21st century unless deep reductions in CO2 and other greenhouse gas emissions occur in the coming decades.”[1]. As stated by António Guterres, United Nations Secretary-General, the IPCC Sixth Assessment Report is a “code red for humanity”[2].
Taking up this code-red alert, there is growing recognition in the astrophysics community that it must assume its share of the global effort to reduce greenhouse gases (GHGs)[3, 4, 5, 6]. Much recent attention has focused on the reduction of academic flying[7, 8, 9, 10, 11] and, to a lesser extent, on the use of supercomputers[6, 12]. Quantifying the GHG emissions due to the construction and operation of space observatories, planetary probes and ground-based observatories has so far attracted less attention. With the decades-long lifetime of research infrastructures, decisions that are made now will lock in GHG emissions of the astrophysics community for the next decades, potentially compromising the goal to reach net-zero emissions by the middle of this century. Assessments of the environmental footprint of existing and future astronomical facilities are therefore urgently needed.
To address this gap, we have developed a method that provides a first-order estimate of the carbon footprint of astronomical research infrastructures (see ‘Carbon footprint estimation’ in Methods). We estimate the carbon footprint of each facility using the standard method of multiplying activity data with emission factors. Detailed activity data (for example, MWh of electricity consumed for construction of a satellite or tonnes of concrete poured for the foundation of a telescope) are generally not publicly available for astronomical research infrastructures, so we use aggregated activity data based on cost and mass for our analysis. Specifically, we use the full mission cost and payload launch mass for space missions and the construction and operating costs for ground-based observatories (Supplementary Tables 1 and 2).
Using cost data to estimate a project’s carbon footprint is referred to as economic input–output (EIO) analysis. This approach is known to have large uncertainties due to the aggregation of activities, products and monetary flows that may vary considerably from one facility or field of activity to another. An alternative life-cycle assessment (LCA) methodology is recommended by key space industry actors (for example, ref. 13) as the optimal method to assess and reduce the carbon footprint of space missions, but it is difficult to implement in practice (especially for comparative or discipline-wide assessments) due to the confidential nature of the required input activity data[14]. At present, an EIO analysis is thus the only feasible way to assess the combined carbon footprint of the world’s space- and ground-based astronomical research infrastructures. We adopt throughout this study an uncertainty of 80% for the carbon footprint estimate of individual facilities, as recommended by the French Agency for Ecological Transition (ADEME) for an EIO analysis[15].
Detailed carbon footprint assessments do exist for a handful of facilities, and we use these assessments to derive dedicated emission factors for our analysis. We emphasize that our results in this paper are order-of-magnitude estimates that may differ by a factor of a few from the true carbon footprint of any given facility. We propagate uncertainties throughout our analysis and the aggregated results and their associated uncertainties are robust. We note that our total and per-astronomer estimates are likely to be conservative, since we simply excluded any activity data that we could not locate, and our estimate for the number of astronomers in the world is probably an upper limit (see ‘The number of astronomers in the world’ in Methods). The average carbon footprint of astronomical research infrastructures per astronomer is thus likely to be larger than our estimate, or towards the upper bound of our quoted uncertainty interval.
Our work was conducted in the context of the carbon footprint assessment of our institute, the Institut de Recherche en Astrophysique et Planétologie (IRAP) for the year 2019 and hence we adopt 2019 as the reference year for our study. Specifically, all cost data have been corrected for inflation and are expressed in 2019 economic conditions. We based our work on a list of 46 space missions and 39 ground-based observatories from which data were used to produce peer-reviewed journal articles authored or co-authored by IRAP scientists in 2019. Extrapolating the results for this list to all active astronomical research infrastructures in the world yields an estimate for the worldwide carbon footprint of astronomical facilities.
Results
To estimate emission factors for astronomical research infrastructures, we made a comprehensive search for published carbon footprint assessment reports. As detailed in ‘Emission factors’ in Methods, these reports are currently very scarce. We found two case studies for life-cycle carbon footprints of space missions, which covered the entire mission including the launcher and a few years of operations[16]. From these studies, we infer mean emission factors of 140 tCO2 equivalent (CO2e) per million € (M€) of mission cost and 50 tCO2e kg-1 of payload launch mass. Emission factors of ground-based observatories were derived using existing carbon footprint assessments for the construction of two facilities and the operations of three facilities. We find a mean emission factor of 240 tCO2e M€-1 for construction and of 250 tCO2e M€-1 for operations. The emission factors are summarized in Table 1. The lower monetary emission factor for space missions compared with ground-based observatories can be attributed to the low production rates, long development cycles and specialized materials and processes of the space sector[17].
| Activity | Emission factor |
|---|---|
| Space missions (per payload launch mass) | 50 tCO2e kg-1 |
| Space missions (per mission full cost) | 140 tCO2e M€-1 |
| Ground-based observatory construction | 240 tCO2e M€-1 |
| Ground-based operations | 250 tCO2e M€-1 |
Table 2 summarizes order-of-magnitude estimates for the carbon life-cycle footprints of space missions based on payload launch mass and mission cost (see ‘Carbon footprint estimation’ and ‘Emission factors’ in Methods and Supplementary Tables 1 and 2). The cost-based estimates are on average about 20% larger than the mass-based estimates, probably because mission complexity and mission extensions are not taken into account by the latter. Examples include the Hubble Space Telescope (HST), which had five Space Shuttle servicing missions that are included in the cost-based estimate but not in the mass-based estimate, and the Mars rover Curiosity, for which the mission complexity is not properly reflected in the mass-based estimate.
| Mission | Years | Papers | Authors | Mass-based | Cost-based | ||||||||
|---|---|---|---|---|---|---|---|---|---|---|---|---|---|
| total since launch | Footprint | Annual | Carbon intensity | Footprint | Annual | Carbon intensity | |||||||
| (tCO2e) | (tCO2e yr-1) | (tCO2e per | (tCO2e per | (tCO2e) | (tCO2e yr-1) | (tCO2e per | (tCO2e per | ||||||
| paper) | author) | paper) | author) | ||||||||||
| HST | 30 | 52,497 | 42,315 | 555,500 | 18,517 | 11 | 13 | 1,125,197 | 37,507 | 21 | 27 | ||
| Chandra | 21 | 17,714 | 23,942 | 293,000 | 13,952 | 17 | 12 | 575,955 | 27,426 | 33 | 24 | ||
| Cassini | 22 | 4,691 | 9,328 | 291,000 | 13,227 | 62 | 31 | 392,902 | 17,859 | 84 | 42 | ||
| Cluster | 20 | 2,433 | 2,959 | 240,000 | 12,000 | 99 | 81 | 132,207 | 6,610 | 54 | 45 | ||
| Fermi | 12 | 8,619 | 19,675 | 215,150 | 17,929 | 25 | 11 | 120,881 | 10,073 | 14 | 6 | ||
| INTEGRAL | 18 | 2,808 | 10,640 | 200,000 | 11,111 | 71 | 19 | 58,720 | 3,262 | 21 | 6 | ||
| Curiosity | 7 | 1,360 | 4,393 | 194,650 | 19,465 | 143 | 44 | 362,595 | 36,259 | 267 | 83 | ||
| XMM | 21 | 18,859 | 23,773 | 190,000 | 9,048 | 10 | 8 | 155,845 | 7,421 | 8 | 7 | ||
| Juno | 8 | 521 | 1,832 | 181,250 | 18,125 | 348 | 99 | 151,547 | 15,155 | 291 | 83 | ||
| Herschel | 11 | 5,046 | 11,092 | 170,000 | 15,455 | 34 | 15 | 161,238 | 14,658 | 32 | 15 | ||
| RXTE | 24 | 7,473 | 11,601 | 160,000 | 6,667 | 21 | 14 | 50,438 | 2,102 | 7 | 4 | ||
| SDO | 10 | 4,189 | 4,946 | 155,000 | 15,500 | 37 | 31 | 121,164 | 12,116 | 29 | 24 | ||
| Rosetta | 16 | 1,665 | 4,337 | 145,000 | 9,063 | 87 | 33 | 239,316 | 14,957 | 144 | 55 | ||
| Galileo | 30 | 2,432 | 4,594 | 128,000 | 4,267 | 53 | 28 | 178,503 | 5,950 | 73 | 39 | ||
| MAVEN | 6 | 672 | 2,023 | 122,700 | 12,270 | 183 | 61 | 89,270 | 8,927 | 133 | 44 | ||
| ROSAT | 30 | 19,765 | 23,154 | 121,050 | 4,035 | 6 | 5 | 88,844 | 2,961 | 4 | 4 | ||
| MRO | 14 | 1,927 | 4,261 | 109,000 | 7,786 | 57 | 26 | 129,850 | 9,275 | 67 | 30 | ||
| Gaia | 7 | 2,550 | 10,565 | 101,700 | 10,170 | 40 | 10 | 145,114 | 14,511 | 57 | 14 | ||
| Planck | 11 | 5,515 | 13,388 | 95,000 | 8,636 | 17 | 7 | 108,486 | 9,862 | 20 | 8 | ||
| SoHO | 25 | 12,218 | 12,955 | 92,500 | 3,700 | 8 | 7 | 205,617 | 8,225 | 17 | 16 | ||
| Suzaku | 15 | 3,869 | 9,525 | 85,300 | 5,687 | 22 | 9 | ||||||
| AstroSat | 5 | 313 | 5,406 | 75,750 | 7,575 | 242 | 14 | 3,751 | 375 | 12 | 1 | ||
| MMS | 5 | 769 | 1,623 | 68,000 | 6,800 | 88 | 42 | 147,501 | 14,750 | 192 | 91 | ||
| Venus Express | 15 | 1,221 | 3,394 | 63,500 | 4,233 | 52 | 19 | 41,945 | 2,796 | 34 | 12 | ||
| Wind | 26 | 3,877 | 8,254 | 62,500 | 2,404 | 16 | 8 | ||||||
| STEREO | 14 | 3,731 | 6,768 | 61,900 | 4,421 | 17 | 9 | 86,021 | 6,144 | 23 | 13 | ||
| Mars Express | 17 | 2,969 | 6,118 | 61,150 | 3,597 | 21 | 10 | 52,332 | 3,078 | 18 | 9 | ||
| Dawn | 12 | 791 | 2,175 | 60,885 | 5,074 | 77 | 28 | 61,409 | 5,117 | 78 | 28 | ||
| Hipparcos | 31 | 4,743 | 8,373 | 57,000 | 1,839 | 12 | 7 | 130,664 | 4,215 | 28 | 16 | ||
| Kepler | 11 | 4,306 | 9,606 | 52,620 | 4,784 | 12 | 5 | 89,037 | 8,094 | 21 | 9 | ||
| Geotail | 28 | 3,288 | 3,996 | 50,450 | 1,802 | 15 | 13 | ||||||
| Akari | 14 | 2,037 | 6,993 | 47,600 | 3,400 | 23 | 7 | 14,878 | 1,063 | 7 | 2 | ||
| Spitzer | 17 | 9,050 | 15,940 | 47,500 | 2,794 | 5 | 3 | 166,333 | 9,784 | 18 | 10 | ||
| Swift | 16 | 7,397 | 17,307 | 42,150 | 2,634 | 6 | 2 | 39,030 | 2,439 | 5 | 2 | ||
| ACE | 23 | 4,147 | 7,560 | 37,600 | 1,635 | 9 | 5 | ||||||
| InSight | 1 | 58 | 447 | 34,700 | 3,470 | 598 | 78 | 99,922 | 9,992 | 1723 | 224 | ||
| PSP | 2 | 287 | 1,075 | 34,250 | 3,425 | 119 | 32 | 183,456 | 18,346 | 639 | 171 | ||
| WISE | 11 | 6,990 | 18,877 | 33,050 | 3,005 | 5 | 2 | 46,855 | 4,260 | 7 | 2 | ||
| TIMED | 18 | 2,205 | 3,593 | 33,000 | 1,833 | 15 | 9 | 36,196 | 2,011 | 16 | 10 | ||
| Double Star | 16 | 166 | 540 | 28,000 | 1,750 | 169 | 52 | ||||||
| IMP-8 | 47 | 2,485 | 3,835 | 20,500 | 436 | 8 | 5 | ||||||
| NICER | 3 | 338 | 2,657 | 18,600 | 1,860 | 55 | 7 | 7,374 | 737 | 22 | 3 | ||
| NuSTAR | 8 | 2,227 | 9,559 | 18,000 | 1,800 | 8 | 2 | 21,799 | 2,180 | 10 | 2 | ||
| TESS | 2 | 978 | 4,557 | 16,250 | 1,625 | 17 | 4 | 38,478 | 3,848 | 39 | 8 | ||
| GALEX | 17 | 5,452 | 13,790 | 14,000 | 824 | 3 | 1 | 16,780 | 987 | 3 | 1 | ||
| DEMETER | 16 | 422 | 1,014 | 6,500 | 406 | 15 | 6 | 2,907 | 182 | 7 | 3 | ||
For some missions, the mass-based estimates are larger. In some cases, this can be explained by lower mission complexity, but it may also be due to underestimates of the true costs. For example, the International Gamma-Ray Astrophysics Laboratory (INTEGRAL) makes use of the same satellite bus as the X-ray Multi-Mirror mission (XMM-Newton), which led to important cost savings. On the other hand, the quoted cost estimate for INTEGRAL only covers the mission cost to the European Space Agency (ESA), excluding the payload cost and the launcher cost, the latter having been provided by Russia in exchange for observing time. The Cluster mission consists of four identical spacecrafts and shares the same launcher for all four satellites, which also results in a relatively low cost-to-mass ratio. We also note that cost estimates for the Astronomy Satellite (AstroSat) and Akari appear to be substantially underestimated.
We consider that using both mass-based and cost-based estimates gives a good indication of the typical uncertainty that is inherent to our approach. ESA advises against using EIO analyses due to their large inherent uncertainties[13], yet our analysis suggests that as long as the uncertainties are properly considered, an EIO analysis for space missions yields results that are comparable with an analysis based on payload mass. Summing the carbon footprint estimates for the 40 space missions that have both mass-based and cost-based estimates yields 4.60.8 MtCO2e for the mass-based and 5.91.2 MtCO2e for the cost-based estimates, where errors reflect the adopted uncertainty of 80% in the carbon footprint of each individual space mission (uncertainties for individual facilities are added in quadrature through the paper by taking the square root of the sum of uncertainty squares). Summing the mass-based estimates for all 46 space missions increases the total carbon footprint by 6% to 4.90.8 MtCO2e. Assuming that the same increase would apply to the remaining 6 space missions for which we did not find any cost estimates would lead to a cost-based estimate of 6.21.3 MtCO2e. Table 2 also lists the annual footprints of the facilities, computed by dividing the life-cycle footprints by the lifetime of the mission, defined as the time since launch or ten years, whichever is longer (see ‘Annual footprint’ in Methods). The total annual footprint of the missions in Table 2 is 31047 ktCO2e yr-1 for the mass-based and 36664 ktCO2e yr-1 for the cost-based estimates.
| Observatory | Lifetime (yr) | Papers | Authors | Footprint | Carbon intensity | |||||
|---|---|---|---|---|---|---|---|---|---|---|
| Construction | Operation | Lifetime | Annual | |||||||
| (tCO2e) | (tCO2e yr-1) | (tCO2e) | (tCO2e yr-1) | (tCO2e per | (tCO2e per | |||||
| paper) | author) | |||||||||
| VLT (Paranal) | 21 | 17,235 | 26,442 | 332,280 | 9,875 | 539,655 | 25,698 | 31 | 20 | |
| ALMA | 9 | 7,460 | 18,610 | 299,576 | 26,196 | 535,340 | 56,154 | 72 | 29 | |
| SOFIA | 9 | 662 | 3,586 | 263,544 | 22,375 | 464,919 | 48,729 | 702 | 130 | |
| AAT | 46 | 4,297 | 10,848 | 29,728 | 3,824 | 205,610 | 4,470 | 48 | 19 | |
| VLA | 40 | 26,918 | 28,206 | 82,817 | 2,400 | 178,826 | 4,471 | 7 | 6 | |
| VLBA | 27 | 4,995 | 12,427 | 31,608 | 3,874 | 136,194 | 5,044 | 27 | 11 | |
| IRAM | 30 | 6,744 | 12,095 | 12,240 | 3,750 | 124,740 | 4,158 | 18 | 10 | |
| Gemini-South | 20 | 1,735 | 9,949 | 32,280 | 3,250 | 97,280 | 4,864 | 56 | 10 | |
| CFHT | 41 | 8,400 | 16,228 | 20,414 | 1,575 | 84,989 | 2,073 | 10 | 5 | |
| ESO 3.6m (La Silla) | 43 | 3,774 | 8,515 | 23,815 | 1,298 | 79,608 | 1,851 | 21 | 9 | |
| GBT | 19 | 2,554 | 9,905 | 28,812 | 2,436 | 75,088 | 3,952 | 29 | 8 | |
| LOFAR | 8 | 2,205 | 10,304 | 48,000 | 2,291 | 66,326 | 7,091 | 30 | 6 | |
| JCMT | 33 | 4,726 | 9,145 | 9,192 | 1,364 | 54,194 | 1,642 | 11 | 6 | |
| ATCA | 32 | 4,108 | 12,537 | 22,863 | 873 | 50,787 | 1,587 | 12 | 4 | |
| H.E.S.S. | 17 | 4,577 | 12,889 | 11,848 | 2,193 | 49,126 | 2,890 | 11 | 4 | |
| MeerKAT | 2 | 335 | 2,750 | 30,624 | 3,190 | 37,004 | 6,252 | 110 | 13 | |
| GTC | 11 | 1,059 | 6,445 | 29,880 | 29,880 | 2,716 | 28 | 5 | ||
| NRO | 38 | 1,776 | 3,739 | 12,233 | 378 | 26,609 | 700 | 15 | 7 | |
| LMT | 6 | 213 | 1,912 | 18,504 | 786 | 23,221 | 2,637 | 109 | 12 | |
| MLSO | 55 | 385 | 932 | 306 | 16,817 | 306 | 44 | 18 | ||
| APEX | 15 | 2,244 | 8,097 | 4,800 | 675 | 14,925 | 995 | 7 | 2 | |
| SMA | 17 | 1,585 | 5,312 | 14,354 | 14,354 | 844 | 9 | 3 | ||
| EHT | 11 | 606 | 2,079 | 12,580 | - | 12,580 | 1,144 | 21 | 6 | |
| Noto Radio Observatory | 32 | 108 | 1,490 | 378 | 12,096 | 378 | 112 | 8 | ||
| 2m TBL | 40 | 435 | 1,392 | 1,435 | 250 | 11,435 | 286 | 26 | 8 | |
| 2.16m (Xinglong Station) | 46 | 235 | 651 | 1,750 | 182 | 10,137 | 220 | 43 | 16 | |
| 1.93m OHP | 62 | 394 | 2,056 | 1,309 | 136 | 9,763 | 157 | 25 | 5 | |
| KMTNet | 5 | 169 | 4,191 | 4,193 | 437 | 6,377 | 856 | 38 | 2 | |
| THEMIS | 21 | 142 | 307 | 275 | 5,775 | 275 | 41 | 19 | ||
| 2.4m LiJiang (YAO) | 12 | 149 | 688 | 2,297 | 239 | 5,168 | 431 | 35 | 8 | |
| 2m HCT | 19 | 276 | 1,259 | 1,454 | 151 | 4,331 | 228 | 16 | 3 | |
| 1.5m Tillinghast (FLWO) | 51 | 652 | 2,514 | 683 | 71 | 4,312 | 85 | 7 | 2 | |
| 1.5m (OAN-SPM) | 50 | 253 | 1,258 | 683 | 71 | 4,241 | 85 | 17 | 3 | |
| 1.8m (BOAO) | 24 | 262 | 892 | 1,093 | 114 | 3,827 | 159 | 15 | 4 | |
| 1m (Pic-du-Midi) | 57 | 29 | 345 | 240 | 25 | 1,665 | 29 | 57 | 5 | |
| 1.3m Warsaw (OGLE) | 23 | 4,210 | 9,470 | 472 | 49 | 1,604 | 70 | 0.4 | 0.2 | |
| C2PU | 6 | 31 | 1,982 | 480 | 50 | 780 | 98 | 25 | 0.4 | |
| TAROT | 22 | 206 | 5,602 | 216 | 23 | 711 | 32 | 3 | 0.1 | |
| 1m NOWT | 7 | 17 | 118 | 240 | 25 | 415 | 49 | 24 | 4 | |
Order-of-magnitude estimates for the carbon life-cycle footprints of ground-based observatories are summarized in Table 3. After a few decades, the operations footprint dominates the life-cycle footprint. The life-cycle carbon footprint of the ground-based observatories listed in Table 3 is estimated to be 3.00.8 MtCO2e, with a total footprint for construction of 1.40.4 MtCO2e (46%) and for operations of 1.60.4 MtCO2e (54%). The total annual carbon footprint amounts to 19464 ktCO2e yr-1 for the ground-based observatories in Table 3.
To put the results in perspective, we compute the carbon intensity of each infrastructure, defined as the lifetime footprint divided by either the number of peer-reviewed papers or the number of unique authors (see ‘Carbon intensity’ in Methods). The meaning of these quantities is that they relate the total carbon footprint of a given infrastructure to the scientific productivity of the community and to the size of the community that makes use of it. Specifically, the latter provides a measure of how the infrastructure footprint is shared among the user community.

The results of this computation are shown in Tables 2 and 3 and further illustrated in Fig. 1, which shows the carbon intensities as function of a facility’s lifetime. While there is an overall envelope of decreasing carbon intensities with time, not all facilities start with a large carbon intensity and some facilities still have an important carbon intensity decades after their launch or start of operations. Since the distribution of carbon intensities among the facilities is obviously heavily skewed, we use the median instead of the mean to estimate a typical value for the facilities. For space missions we find a median carbon intensity of 22 tCO2e per paper for both the mass-based and cost-based estimates. Ground-based observatories have a comparable median carbon intensity of 24 tCO2e per paper. When normalized by author, space missions have a median carbon intensity of 10 tCO2e per author for the mass-based and 13 tCO2e per author for the cost-based estimates, while ground-based observatories have a median value of 6 tCO2e per author. This suggests that, on average, more authors are involved in publications citing ground-based observatories compared with publications citing space missions.
To estimate the share of the carbon footprint that should be attributed to an astronomer at our institute, we multiply the annual carbon footprint of each facility with the fraction of unique authors of peer-reviewed papers published in 2019 that are affiliated to IRAP (alternative attribution methods are explored in the Supplementary Information). This results in a carbon footprint of 2.50.5 ktCO2e (mass-based) and 2.80.6 ktCO2e (cost-based) for the space missions and 1.30.5 ktCO2e for the ground-based observatories, totalling 4.00.7 ktCO2e for IRAP in 2019, where the uncertainty includes the difference between the mass- and cost-based estimates. For each of the 144 IRAP astronomers with a PhD degree this corresponds to a footprint of 27.44.8 tCO2e, while for each of the 263 persons working at IRAP in 2019 (that is, including students and all technical and administrative staff) the footprint is 15.02.6 tCO2e. The research infrastructures listed in Tables 2 and 3 are however only a subset of all infrastructures that exist worldwide, hence formally these estimates are lower limits. Correcting for the incompleteness of our subset suggests a footprint of about 36 tCO2e per IRAP astronomer in 2019 (Supplementary Information).
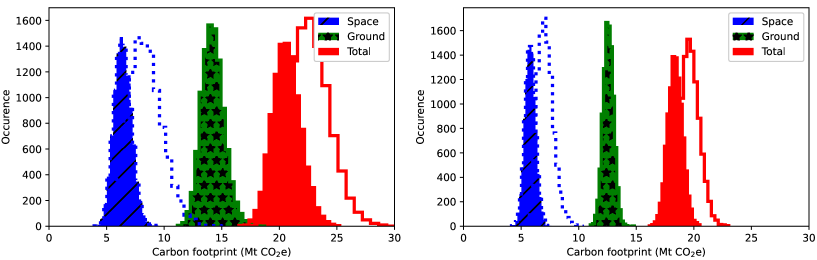
Based on the results of Tables 2 and 3 and using an estimate for the total number of astronomical research infrastructures that were active in 2019 in the world, we estimate their global carbon footprint using a bootstrap method (see ‘The worldwide footprint of astronomical facilities’ in Methods). While this method assumes that the research infrastructures considered in this paper are representative of all astronomical facilities that exist worldwide, we reduce the bias introduced by the specific selection by dividing all research infrastructures into broad categories that reflect scientific topic or observatory type. The results of this exercise are summarized in Table 4 and the carbon footprint distributions that were obtained by the bootstrapping are shown in Fig. 2.
| Category | Research Infrastructures | Carbon footprint of selected | Carbon footprint of all | |||||
|---|---|---|---|---|---|---|---|---|
| research infrastructures | research infrastructures | |||||||
| Selected | Worldwide | Life cycle | Annual | Life cycle | Annual | |||
| (ktCO2e) | (ktCO2e yr-1) | (ktCO2e) | (ktCO2e yr-1) | |||||
| Space missions (mass-based) | ||||||||
| Solar | 3 | 3 | 282147 | 2313 | 282166 | 2316 | ||
| Plasma | 7 | 13 | 553219 | 3112 | 1,029375 | 5820 | ||
| Planetary | 6 | 21 | 703256 | 6525 | 2,461546 | 22654 | ||
| Astro | 12 | 18 | 1,759586 | 9928 | 2,636955 | 14943 | ||
| Sum | 3,298692 | 21778 | 6,4091,174 | 45574 | ||||
| Space missions (cost-based) | ||||||||
| Solar | 3 | 3 | 510241 | 3919 | 510247 | 3920 | ||
| Plasma | 4 | 13 | 402175 | 3014 | 1,306352 | 9630 | ||
| Planetary | 6 | 21 | 886351 | 8334 | 3,100798 | 28980 | ||
| Astro | 12 | 18 | 2,3391,033 | 11441 | 3,5261,816 | 17268 | ||
| Sum | 4,1371,131 | 26558 | 8,4422,030 | 596111 | ||||
| Ground-based observatories | ||||||||
| OIR (m) | 9 | 37 | 1,037478 | 4221 | 4,263665 | 17127 | ||
| OIR (others) | 19 | 1000 | 6517 | 31 | 3,409163 | 1476 | ||
| Radio | 6 | 74 | 20681 | 104 | 2,540345 | 12718 | ||
| Radio Arrays | 9 | 27 | 1,156481 | 8746 | 3,4651,140 | 260115 | ||
| Others | 4 | 4 | 537374 | 5239 | 538499 | 5253 | ||
| Sum | 3,001779 | 19464 | 14,2141,461 | 757131 | ||||
We find that the world’s fleet of astronomical space missions has a total carbon footprint of 7.42.2 MtCO2e and an annual footprint of 525184 ktCO2e yr-1, where the uncertainties include the difference between the mass-based and cost-based estimates. We note that roughly half of the existing space missions are covered by Table 2, with a coverage of 100% for solar missions, between 50%–60% for plasma or astrophysics missions and 30% for planetary missions. Due to the strong representation of IRAP in many recent space missions, we thus consider that our extrapolation to the full inventory of active space missions worldwide is robust. We estimate the total carbon footprint of all ground-based astronomical observatories as 14.21.5 MtCO2e and their annual footprint to be 757131 ktCO2e yr-1. While the total footprint for ground-based observatories is about twice as large as that for space missions, their annual footprint is only about 44% larger, owing to, on average, longer lifetimes for ground-based observatories compared with space missions.
Summing both contributions yields a total carbon footprint of all active astronomical research infrastructures in 2019 of 21.63.2 MtCO2e and an annual footprint of 1,283232 ktCO2e yr-1, where uncertainties reflect statistical variations introduced by the bootstrap method, the 80% uncertainty in the emission factors for individual facilities and the difference between mass-based and cost-based estimates. By dividing the annual carbon footprint by an assumed world population of 30,000 astronomers with a PhD degree (see ‘The number of astronomers in the world’ in Methods), we obtain an annual footprint of 42.87.7 tCO2e yr-1 per astronomer. Assuming that astronomical institutes worldwide have similar staffing profiles as IRAP, which is roughly one student, technical or administrative personnel per astronomer with a PhD degree, the annual footprint per person working in astronomy in any capacity is roughly half this value.
We reiterate that these are order-of-magnitude estimates, obtained under the assumption that the facilities in Tables 2 and 3 are representative of all astronomical research infrastructures that exist worldwide. Using a modified procedure that avoids resampling of research infrastructures that have no equivalent in the world, such as the HST or the Atacama Large Millimeter/submillimeter Array (ALMA), results in a reduced total carbon footprint of 19.12.3 MtCO2e and annual carbon footprints of 1,054138 ktCO2e yr-1 and 35.14.6 tCO2e yr-1 per astronomer. Sampling of unique research infrastructures may hence overestimate the annual carbon footprint by about 20%. Averaging the original and the modified bootstrap results and including their difference in the uncertainty yields a total carbon footprint of astronomical research infrastructures of 20.33.3 MtCO2e and an annual carbon footprint of 1,169249 ktCO2e yr-1 and 39.08.3 tCO2e yr-1 per astronomer.
The two methods we applied to derive the average carbon footprint of research infrastructures per astronomer holding a PhD, either based on more restrictive criteria for IRAP or based on an extrapolation to all active infrastructures for an average astronomer, lead to the same order-of-magnitude estimate. The range of values spanned by both estimates is 36.614.0 tCO2e yr-1, where the uncertainty mainly reflects the differences that are plausibly explained by the method of estimation. While the IRAP result of 27.44.8 tCO2e yr-1 may miss the attribution of the carbon footprint of some infrastructures that were not considered in this paper, the global extrapolation of 42.87.7 tCO2e yr-1 using the original bootstrap method may overestimate the footprint due to the large footprints of a few facilities that are unique in the world.
Comparing our result of 36.614.0 tCO2e yr-1 per astronomer for research infrastructures with estimates for other sources of GHG emissions due to astronomy research activity reveals that astronomical research infrastructures dominate the carbon footprint of an average astronomer. For example, excluding research infrastructures, capital goods and the purchase of goods and services, ref. 12 estimated the average carbon footprint of an astronomer at the Max Planck Institut for Astronomy in Heidelberg to be 18.1 tCO2e yr-1, dominated by 8.5 tCO2e yr-1 from flights, 5.2 tCO2e yr-1 from electricity use and 3.0 tCO2e yr-1 from heating. For the average Australian astronomer (including PhD students), ref. 6 estimated a footprint of 37 tCO2e yr-1, comprised of 22 tCO2e yr-1 for supercomputing, 6 tCO2e yr-1 from flights, 4 tCO2e yr-1 for powering the office buildings and 5 tCO2e yr-1 for powering ground-based observatories in Australia. All of these individual contributions are below our estimate for the contribution of astronomical research infrastructures. While we cannot exclude that items such as the amortization of buildings and equipment or the purchase of goods and services that have generally not been quantified in carbon footprint assessments of astronomy institutes so far may yet represent a notable contribution in some cases, we know that their contribution at IRAP is substantially inferior to that of astronomical research infrastructures. We thus conclude that among the contributions that have so far been considered in the literature, space missions and ground-based observatories are the single most important contribution to the carbon footprint of an average astronomer.
Discussion
It is clear from our analysis that the environmental sustainability of astronomical research infrastructures cannot be neglected if our community is seriously committed to reducing its overall carbon footprint. According to ref. 18, the Earth’s land and oceans provide a carbon sink of about 16 GtCO2 yr-1 (corrected for emissions from land-use change), corresponding to a per-capita carbon sink of 2 tCO2 yr-1. To reach net-zero GHG emissions, the per-capita emissions need to be reduced to that level. How the burden of emission reductions should be shared across humanity is a political question, for which consensus needs to be established collectively. Here we take a common global per-capita target, that is, the same emission target for all humans regardless of their nationality or country of residence, as a reasonable basis for initiating discussion. This would imply that an astronomer’s footprint (including all their work-related activities, as well as their activities outside of work and lifestyle) must be reduced within the next decades to 2 tCO2 yr-1. In this scenario, emissions of research infrastructures would need to be divided by at least a factor of 20. In the interests of equity, policymakers may instead adopt nation- or region-specific emission targets. For example, to reach net-zero GHG emissions in France, Italy or Spain, consumption-based emissions would need to be reduced by about a factor of five and one could apply the same reduction factor to astronomers based in those countries. Australia, Canada and the United States currently have larger per-capita emissions and in those countries the reduction factors to reach net-zero GHG emissions would be closer to ten. A further proposition under consideration (for example, ref. 19) is that reduction factors should be based on national responsibility for climate breakdown. In this scenario, many countries in the global north would be required to close their research infrastructures, while countries in the global south would retain more capacity to develop new infrastructures. Whatever strategy for reduction factors is ultimately adopted, however, our results indicate that the required reductions will not be minor changes at the margin. Instead, they will fundamentally change how we do astronomy in the future. Astronomy is, of course, not the only scientific domain that heavily relies on research infrastructures and it is likely that similar conclusions will be reached in other research fields.
A necessary first step is that every existing and planned facility should conduct a comprehensive environmental life-cycle assessment and make the results public. The International Astronomical Union (IAU) could, for example, hold a register of all environmental life-cycle assessments, which would constitute a comprehensive database of knowledge for further studies. Funding agencies and space agencies have a critical role in ensuring that such analyses are conducted and published for each facility that they support. For example, based on our emission factors, the James Webb Space Telescope would have a carbon footprint between 310 ktCO2e (mass-based) and 1,223 ktCO2e (cost-based) and for the Square Kilometre Array we estimate the construction footprint to be 312 ktCO2e and the annual operations footprint to be 18 ktCO2e yr-1. These figures are comparable with the largest footprint estimates in our study. It is urgent that we consolidate these estimates and implement effective measures to reduce the parts of their carbon footprint over which we still have control.
For existing infrastructures, the analysis should be used to prepare an action plan for how to reduce the footprint over the coming years. The footprint reductions should be monitored and regularly checked against the action plans and the plans should be adapted if needed. One could mimic the scheme of nationally determined contributions that was agreed upon in the 21st Conference of the Parties Paris Agreement and hold a register of all action plans and achievements at IAU that is publicly accessible. While compliance with carbon footprint reductions cannot be enforced on observing facilities, publishing the action plans and achievements would at least guarantee a transparent and open discussion in the community.
For planned infrastructures, the environmental life-cycle assessments should inform the decision about implementation. Abandoning future projects on the basis of their unacceptably high carbon footprint should be an option, but we emphasize that informed decisions of this nature require robust estimates. Having a centralized inventory of environmental life-cycle assessments of all existing infrastructures would allow the community to determine whether there is a margin in the sustainable carbon budget for new infrastructures. In particular, funding agencies and space agencies should include carbon budget limits in their roadmaps for future research infrastructures, assuring their compliance with the boundaries of our planet.
It is questionable whether the required reduction of the carbon footprint of research infrastructures can be reached within the next few decades using the measures described above, in particular if new infrastructures continue to be proposed and developed at the current pace. A possible solution that is often mentioned in the context of carbon footprint reductions is offsetting, yet effective offsetting requires substantial investments that are commensurable with the cost of building an astronomical research infrastructure (Supplementary Information). For existing facilities, the focus must obviously be put on their decarbonization, and if this is not sufficient then we must face the question of which infrastructures should be kept open and which should be shut down.
For planned new facilities, we must recognize that infrastructure investments that are made today lock in their carbon footprint over decades and that replacing fossil fuel for hardware, propellant and electricity production, transport and space launches with renewable energies requires time and investment and probably new technologies that do not yet exist. Global warming is a rate problem: it is the amount of CO2 we emit each year that is too high relative to the environment’s capacity to absorb and to recycle, producing excess atmospheric CO2 concentrations that heat our planet. Spreading the roughly 35 GtCO2 that humanity emits every year[18] over a longer period (for example, 3 years) would bring the per-capita footprint down to about 2 tCO2 yr-1. Making the annual footprint of astronomical research infrastructures of 1,169 ktCO2e yr-1 compliant with 60 ktCO2e yr-1, which is the equal-share target for 30,000 astronomers, implies spreading the annual footprint over about 20 years.
We therefore believe that reducing the pace at which we build new astronomical research infrastructures is the only measure that can make our field sustainable in the short run. This does not mean that we must stop developing new observatories or space missions, but we must do so at a (considerably) slower rate. Once the economy is substantially decarbonized, the rate of construction of new research infrastructures could be increased, considering their potential impact on climate change as well as other detrimental effects on the environment, including biodiversity loss, mineral extraction and use of water resources. The good news is that there is no imperative in science that fixes the rate by which new research infrastructures need to be constructed. Today, the rate is determined by our imagination and, ultimately, by money. Tomorrow, it must be determined by sustainability.
Reducing the pace has many side benefits, some of which have already been recognized earlier by the Slow Science movement[20]: more comprehensive exploitation of data, more time for in-depth science, less publication pressure and more money available to move the already existing infrastructures towards sustainability. The solution is in our hands, the only question is whether the astronomical community will choose to recognize and make use of it.
0.1 Carbon footprint estimation
To estimate the carbon footprint of astronomical research infrastructures, we follow the method developed by the French Agency for Ecological Transition (ADEME; https://www.bilans-ges.ademe.fr/en/accueil) and the French Association Bilan Carbone (ABC; https://www.associationbilancarbone.fr). This method includes the definition of boundaries for the exercise, the collection and analysis of the relevant data and the proposal of an action plan for the reduction of the carbon footprint.
In this method, the carbon footprint of a research infrastructure is defined as an aggregate of all GHG emissions that are generated within the defined boundaries. To enable aggregation of the different gases that cause global warming, GHG emissions are converted into amounts of carbon dioxide equivalents, denoted CO2e, which take into account the different warming potentials and lifetimes of the various GHGs emitted into the atmosphere. Specifically, the carbon footprint is computed using
| (1) |
where are called activity data (for example, MWh of electricity consumed, tonnes of concrete poured or M€ of money spent), are called emission factors (for example, tCO2e emitted per MWh consumed, tCO2e emitted per tonne of concrete poured or tCO2e emitted per M€ of money spent) and the sum is taken over all relevant activities that have been identified within the defined boundaries.
Since activity data for space missions or ground-based observatories are scarce, we will primarily use an EIO analysis, which in our case amounts to using the cost of a space mission, or the cost for construction and operations of a ground-based observatory, as the relevant activity data. For space missions, we cross-check our analysis by adopting a second approach, which uses the satellite payload launch (or wet) mass as activity data. This means that for space missions equation (1) simplifies to
| (2) |
where is either mission cost or payload launch mass and the corresponding emission factor, while for ground-based observatories we use
| (3) |
where is the construction cost, the annual operating cost, the lifetime in years and and are the emission factors for construction and annual operations, respectively. For many activities, emission factors can, for example, be found in ref. 15, yet such databases do not contain specific emission factors for ‘tCO2e per kg of payload mass’ or ‘tCO2e per M€ of operating costs’. We therefore estimate dedicated emission factors based on published carbon footprint assessments for astronomical research infrastructures for our analysis (see ‘Emission factors’).
We aim for using activity data and emission factors that cover scopes 1–3 of a carbon footprint assessment, where scope 1 refers to direct emissions from sources owned or controlled by a research infrastructure (that is, any owned or controlled activities that release emissions straight into the atmosphere, such as a gas or diesel generator owned by an observatory), scope 2 refers to indirect emissions from the consumption of purchased electricity, heat, steam or cooling (for example, emissions related to purchased electricity needed for observatory operations) and scope 3 refers to indirect emissions from other activities not directly controlled by the research infrastructure (for example, emissions related to the construction phase of a facility and employee travel). We approach this goal by using emission factors that are based on scope 1–3 analyses, yet we recognized that in some cases the activity data used do not fully cover all scopes and consequently our carbon footprint assessment presents therefore only a lower limit to a full scope 1–3 analysis.
We furthermore aim for a full LCA, covering phase A (feasibility), phase B (preliminary definition), phase C (detailed definition), phase D (qualification and production), phase E (utilization) and phase F (disposal) for space missions and design and definition, construction, operations and dismantling for ground-based observatories. Yet the feasibility and disposal phases are generally excluded from the activity data, which also do not cover the long-term conservation of the acquired data after the end of a space mission. We also note that for space missions, information on mission extension was not always available and consequently the carbon footprint assessment may be limited to the initial mission definition, which often covers only the first few years of operations. For ground-based observatories the footprint is after a few decades dominated by the operations footprint, however the full operational lifetime of an observatory, and hence its life-cycle footprint, is not known in advance. We therefore decided to limit the operations part of our carbon footprint assessment to the end of our reference year 2019.
As this work was conducted in the context of our institute’s effort to estimate its carbon footprint, we considered all space missions and ground-based observatories that were used to produce peer-reviewed journal articles authored or co-authored by IRAP scientists in 2019. To achieve this, we scrutinized the titles and abstracts of all publications signed by authors that were affiliated to IRAP in 2019 using the Astrophysics Data System (ADS) and collected a list of all research infrastructures from which data were used to produce the papers. In a few cases where the usage of research infrastructures was not obvious from the title or abstract of the paper, we also scrutinized the full text of the publication. In total, we identified 46 space missions and 39 ground-based observatories that were used by IRAP scientists to produce peer-reviewed journal articles published in 2019.
0.2 Emission factors
Space missions
There exist no publicly available data on the life-cycle carbon footprint of planned or existing space missions, despite the work that has been done in this field for more than a decade or so (for example, by ESA in the context of the Clean Space initiative)[22]. ESA maintains a comprehensive LCA database yet declined to share it with us for our work. But even if ESA had provided its database, without detailed activity data the database would have been of very limited use for our work.
Nevertheless, ESA has published relative contributions of the life-cycle breakdown for some launchers and space missions, which allows us to perform consistency checks and order-of-magnitude estimates. For example, for the Sentinel-3B mission, an Earth observation satellite of the EU Copernicus programme, ref. 23 found that 44% of the carbon footprint is attributable to launcher-related activities, 25% to the operations phase and 19% to the definition, qualification and production of the spacecraft, referred to as phase C+D. In their life-cycle assessment of the Astra-1N and the MetOP-A missions, ref. 24 also find that the launch campaign dominates the carbon footprint (59–64%), followed by phase C+D (27–28%), manufacturing, assembly, integration and test (7–10%) and operations (1–2%). Overall, it is estimated that between 50% to 70% of the carbon footprint of a space mission is related to the launcher production, launch campaign and launch event, depending on the launcher’s dry mass[25].
In our work, we will use an estimate for the life-cycle carbon footprint of a space mission that is based on a space-specific life-cycle sustainability assessment (LCSA) framework developed by ref. 16 during his PhD thesis and that he carefully cross-checked with the ESA tools and database. He applied his framework for two case studies: the MÌOS mission, a small satellite mission to the Moon that aimed to collect data on the micrometeorite and radiation environment and detect the presence of water/ice on the lunar south pole in view of a future Moon base, and the NEACORE mission, a set of six nanosatellites for the exploration of asteroids by collision and flyby reconnaissance.
In the ref. 16 case study, the MÌOS mission is launched with Ariane 5 ECA together with 3 other missions, hence only 25% of the carbon footprint of the launch segment is attributed to the MÌOS mission. The payload has a wet mass of 286 kg and the assumed mission duration is 2 years. Reference 16 estimated the total carbon footprint of the mission to be 11,200 tCO2e and a cost of €165 million after applying an inflation correction to convert to 2019 economic conditions, resulting in a monetary emission factor of 68 tCO2e M€-1 and a per payload wet-mass emission factor of 39 tCO2e kg-1.
The NEACORE mission is launched with a dedicated PSLV-CA rocket. The 6 nanosatellites have a total wet mass of 143 kg and the assumed mission duration is 4 years and 8 months. Reference 16 estimated the total carbon footprint of the mission to be 8,780 tCO2e and a cost of €41 million when converted to 2019 economic conditions, resulting in a monetary emission factor of 214 tCO2e M€-1 and a per payload wet-mass emission factor of 61 tCO2e kg-1.
Taking the mean value of the results from ref. 16 leads to emission factors of 140 tCO2e M€-1 and 50 tCO2e kg-1, which are the values that we adopt for our study. We note that the MÌOS and NEACORE estimates differ by less than 53% from these mean values, which is well within the 80% uncertainty that we adopt for individual facilities in our study.
Ground-based observatories
For ground-based observatories, we use monetary emission factors that we estimate separately for construction and operations since the related activities may have different carbon footprint breakdowns. For example, construction often needs important quantities of concrete and steel, with a very high carbon footprint of 1,700–1,800 tCO2e M€-1, while operations typically consume a lot of electricity, which, for example, in Chile has a typical carbon footprint of 2,500 tCO2e M€-1 (ref. 15). We did not apply a similar separation in our analysis of space missions, since their operations footprint is estimated to be small compared with their construction footprint[23, 24].
Construction
Reference 26 has estimated the carbon footprint of the Giant Radio Array for Neutrino Detection (GRAND), an experiment that aims to detect ultra-high-energy neutrinos with an array of radio antennas. The ref. 26 carbon footprint estimate for GRAND includes travel, digital technologies and the hardware equipment. For the 3 stages of the project, lasting 25 years in total, the authors obtained a total carbon footprint of 147,220 tCO2e. The footprint is dominated by the production of stainless steel for the antennas, data storage and data transfer. Excluding the footprint of digital technologies (as it is mostly related to operations and not construction), results in a construction footprint of 81,239 tCO2e. A construction cost estimate of 200 M€ for the GRAND project has been quoted by ref. 27, excluding the cost of rent and salaries. Using that cost estimate results in a formal monetary emission factor of 406 tCO2e M€-1 for GRAND construction, which is a plausible order-of-magnitude estimate that is in close agreement with the monetary emission factor for electrical and information technology equipment (400 tCO2e M€-1)[15].
For the European Extremely Large Telescope (E-ELT), a 39.3-m-diameter optical and near-infrared telescope that is currently under construction in Chile, the European Southern Observatory estimates the construction carbon footprint to be 63.7 ktCO2e, covering different quantities of material as well as the energy needed for some parts of the work (for example, blasting, road construction and so on) (ESO, personal communication). Using the E-ELT construction cost of 945 M€, quoted in the E-ELT construction proposal[28] (converted to 2019 economic conditions), results in a monetary emission factor of 67 tCO2e M€-1, which is considerably smaller than the GRAND estimate and considerably lower than any sector-based estimate in ref. 15.
Since the E-ELT estimate does not cover all construction activities, the derived emission factor presents what is clearly a lower limit, while with a cost estimate that does not comprise the full project cost, the GRAND estimate presents what is clearly an upper limit to the emission factor. In the absence of more reliable information for the construction-related footprint for ground-based observatories, we take the mean value of 240 tCO2e M€-1 of the GRAND and E-ELT estimates and note that the individual estimates are within our adopted uncertainty of 80% of this mean value.
Operations
According to ESO (personal communication), the carbon footprint of the Paranal and the La Silla observatories in 2018 were 8.6 ktCO2e yr-1 and 2.3 ktCO2e yr-1, respectively. Both footprints are dominated by energy use (71% for Paranal, 92% for La Silla), followed by commuting (11% for Paranal, 5% for La Silla) and capital goods (15% for Paranal, 2% for La Silla). Some of the purchases for Paranal and La Silla are accounted for in the carbon footprint estimated by ESO (personal communication) for the Vitacura site and following the recommendation by R. Arsenault (personal communication) we added 30% of the purchase footprint of the Vitacura site to both the Paranal and La Silla footprints, resulting in 9.4 ktCO2e yr-1 for Paranal and 2.8 ktCO2e yr-1 for La Silla.
The annual operations budget of the Paranal observatory in 2011 has been quoted as 16.9 M€ (18.6 M€ in 2019 economic conditions) plus 174 full-time equivalents (a measurement of workforce employed as equivalent to full-time employees)[29]. Assuming 120 k€ per full-time equivalent (2019 economic conditions; ref. 30), one can estimate the annual operations budget of Paranal in 2019 to be 39.5 M€, which results in a monetary emission factor of 238 tCO2e M€-1 for Paranal operations. For La Silla, ref. 31 has quoted an operations budget of 5.9 M€ in 2004 (7.9 M€ in 2019 economic conditions), resulting in a monetary emission factor of 354 tCO2e M€-1 for La Silla operations.
For the Canada–France–Hawaii Telescope (CFHT), ref. 32 has estimated the 2019 GHG emission of CFHT operations, including travel, the CFHT-owned vehicle fleet and on-site energy consumption. The total carbon footprint for these items amounts to 749 tCO2e, dominated by power generation (63%) and transportation (31%). For an operations budget of 6.3 M€ for the same year[33], this results in a monetary emission factor of 119 tCO2e M€-1 for CFHT operations, considerably below the estimate for Paranal and La Silla. The authors note that flight-related emissions may be underestimated in their study and alternative estimators for flight-related emissions[11] indeed have yielded an estimate that is higher by a factor of two. Doubling the contribution of flights in the original calculation by ref. 32 would result in a total footprint of 923 tCO2e and a monetary emission factor of 148 tCO2e M€-1 for CFHT operations. Additional emission sources such as the purchase of materials or food for employees that were not considered by ref. 32 would further increase this factor.
Based on these 3 estimates, we adopt an average monetary emission factor of 250 tCO2e M€-1 for observatory operations in our analysis, which is the rounded mean value of the Paranal, La Silla and CFHT estimates. All specific estimates above are well within our adopted 80% uncertainty of this average. We note that the exact value of this factor is strongly dependent on the carbon intensity of the means of electricity production that is used to power the observatory. The same applies to computing and data storage, as well as ground support for space missions. More dedicated life-cycle assessments of specific research infrastructures are needed here to better understand the importance of these contributions to the total carbon footprint.
Adopted emission factors
The emission factors that we use throughout this study are summarized in Table 1. For comparison, typical monetary emission factors in France range from 110 tCO2e M€-1 for insurance and banking, over 400 tCO2e M€-1 for electrical and optical information technology and office equipment, 700 tCO2e M€-1 for machinery equipment, up to 1,700 tCO2e M€-1 for metals and 1,800 tCO2e M€-1 for mineral products[15]. The relatively low monetary emission factor for space missions is related to the fact that space missions are much less material intensive compared with ground-based observatories after normalizing by cost. For example, the liftoff mass of a €1 billion space mission launched with Ariane 5 ECA is about 790 tonnes[34], while the E-ELT (which has a similar cost) has a mass of about 60,000 tonnes[35]. The space sector is in fact unique, and is characterized by low production rates, long development cycles and specialized materials and processes[17].
We also note that the emission factor for ground-based observatory construction is based on rather recent estimates, while some of the observatories that we consider were constructed several decades ago, at a time when the carbon intensity of construction was probably larger. Our construction footprint estimates for the corresponding observatories are therefore likely to be lower limits.
We stress that the values of the emission factors that we adopt remain rather uncertain, given the scarcity of publicly available information relating to life-cycle assessments for astronomical research infrastructures. Reference 15 has quoted a typical uncertainty of 80% for monetary emission factors, which corresponds to the typical scatter of the scarce data about the adopted emission factors in Table 1. This uncertainty clearly dominates the uncertainties of our results. We note, however, that our monetary emission factors are already on the low side of the sector-based estimates in ref. 15, hence it seems unlikely that our adopted values are notably overestimated. The true emission factors and the resulting carbon footprint could easily be larger. More work is needed in this area, and we urge the agencies responsible for existing and future infrastructures for astronomy research, as well their public and industry partners, to contribute actively to consolidating carbon footprint estimates.
0.3 Annual footprint
To compute the annual carbon footprint of a research infrastructure, we need to devise a method of how to distribute the life-cycle footprint of space missions or the construction footprint of ground-based observatories over the years. For that purpose, we define as the annual carbon footprint the total carbon footprint divided by the number of years over which the greenhouse gases were emitted. The accounting is started with the launch for a space mission or with start of operations for ground-based observatories. For space missions, we divide the lifetime carbon footprint by the lifetime of the mission. For missions that were launched recently, we assume a lifetime of 10 years. In other words, we assume a minimum operations period of 10 years for all infrastructures, avoiding attributing an artificially large annual GHG emission to missions that were launched recently. For ground-based observatories, we divide the construction footprint by the lifetime of the observatory and add the annual operations footprint. For observatories that were built after 2009, we assume a lifetime of at least 10 years, otherwise we take the number of years since first light as the lifetime.
0.4 The user community of astronomical research infrastructures
To put the carbon footprint results in perspective, we estimated for each research infrastructure the total number of peer-reviewed papers that either analyse data from a given infrastructure or that refer to analysed data from the infrastructure or to the infrastructure itself. We obtained the number of such publications from ADS, using a full-text search over the period from launch until our reference year of 2019. We constructed a dedicated query string for each infrastructure with the aim to cover as many infrastructure-related publications as possible while keeping the false positives at a minimum (the script that we used for this work, including the definition of our query strings, can be accessed at https://doi.org/10.5281/zenodo.5835840). We checked the latter by visually investigating a sample of 100 results for each query. We used the same ADS query to assess the number of unique authors that signed at least one of the peer-reviewed papers. While the number of papers can be considered as a measure of the infrastructure impact, the number of unique authors can be considered as a measure of the size of the community that is using the infrastructure.
0.5 Carbon intensity
Using the above estimates of the user community we can then compute the carbon intensity of a facility, which we define as the lifetime carbon footprint divided by either the number of peer-reviewed papers or the number of unique authors. The meaning of these quantities is that they relate the total carbon footprint of a given infrastructure to the scientific productivity of the community and to the size of the community that makes use of it. The units of the carbon intensity should, however, not lead to the conclusion that writing a paper will actually have the quoted carbon footprint or adding one more author will increase the carbon footprint. While writing a paper has some carbon footprint, we do not estimate its value here as it is not in the scope of this paper and it will be small compared with the per-paper footprint of research infrastructures[36]. What we estimate is the share of the carbon footprint of a given infrastructure among the scientific community, and writing one more paper or adding one more author will actually reduce the carbon intensity as it will increase the denominator in the equations. This means that the carbon intensity is a dynamic quantity that will evolve with time (Fig. 1).
0.6 The worldwide footprint of astronomical facilities
The research infrastructures that we selected for this study obviously represent only a subset of all astronomical research infrastructures that exist worldwide and reflect the specific research activities of the scientists at IRAP. We can, however, extrapolate the results to all astronomical research infrastructures to estimate their total carbon footprint globally. For this exercise, we limit ourselves to the research infrastructures that were active in 2019, disregarding the space missions in Table 2 that had stopped operating. We divide all research infrastructures into broad categories that reflect scientific topic (for example, solar, plasma or astro) or observatory type to reduce the bias introduced by the specific selection of infrastructures in Tables 2 and 3. We note that we split optical-near-infrared (OIR) telescopes into facilities with diameter of 3 m or larger and those with smaller diameters since they differ substantially in carbon footprint and in total number. While the total number of telescopes with mirrors of at least 3 m diameter is easy to determine, we only have an approximation for the number of smaller telescopes. For example, ref. 37 provides a directory of about 1,000 professional astronomical observatories and telescopes, while the IAU Minor Planet Center lists 2,297 observatory codes[38]. We therefore make our estimate by assuming that there exist at least 1,000 professional OIR telescopes worldwide with diameters smaller than 3 m. Due to their vastly different footprints, we also separate single-dish radio telescopes from multiple-dish or antennae arrays. Finally, we also list all other instruments, including the Stratospheric Observatory for Infrared Astronomy (SOFIA), but do not extrapolate this number due to the heterogeneity of the infrastructures in this category.
For each of the categories, we determined the number of active research infrastructures in our list and compared them with the total number of research infrastructures that were active worldwide in 2019. The full list of facilities that we considered is provided in Supplementary Data 1. We then did a bootstrap sampling by randomly selecting times an infrastructure from the list of active infrastructures in a given category, where is the total number of research infrastructures that exist worldwide in a given category. We note that a given infrastructure in our list can be sampled several times in this process. Summing the carbon footprints for the sampled infrastructures then provides an estimate for the total carbon footprint of all infrastructures that exist worldwide. We repeated the random sampling 10,000 times and computed the mean and standard deviations of all estimates to assess the carbon footprint of all infrastructures and the uncertainty that arises from the random sampling procedure. The resulting distribution of carbon footprints is shown in the left panel of Fig. 2.
We reiterate that the results obtained by this method are order-of-magnitude estimates, obtained under the assumption that the research infrastructures in Tables 2 and 3 are representative for all astronomical research infrastructures that exist worldwide. To estimate the sensitivity of our result to this assumption, we repeated the bootstrap procedure by excluding the infrastructure with the largest carbon footprint in each category from the sampling, adding its footprint directly to the result. This avoids sampling infrastructures that are unique in terms of carbon footprint and for which no equivalent exists worldwide, such as, for example, the HST or the ALMA observatory, multiple times. This reduces the carbon footprint estimates and their sampling spread, as illustrated in the right panel of Fig. 2.
0.7 The number of astronomers in the world
To estimate how much research infrastructures contribute to the annual carbon footprint of an average astronomer, we need to estimate the number of professional astronomers worldwide. The IAU lists 12,165 members at the beginning of August 2021[39], yet not every astronomer is a member of the IAU. Reference 40 studied the fraction of astronomers with PhD degrees who joined IAU for 12 countries (including astronomers, astrophysicists, physicists who study cosmology, high energy astrophysics or astroparticle physics), finding that on average 51% of all astronomers with PhD degrees are members of the IAU. This would imply that there are 24,000 astronomers with PhD degrees worldwide. The country where the fewest astronomers joined the IAU is the United States, with only 40% of astronomers being members of IAU. Applying this fraction would imply that there are 30,000 astronomers with PhD degrees worldwide, which probably is an upper limit. We apply this number in our work to make sure that we do not overestimate the per-astronomer footprint of astronomical research infrastructures.
Data Availability
All data used for this work are available for download at https://doi.org/10.5281/zenodo.5835840.
Code Availability
All code used for this work is available for download at https://doi.org/10.5281/zenodo.5835840.
Received: 8 October 2021; Accepted: 21 January 2022; Published online: 21 March 2022
References
- [1] IPCC, 2021: Summary for Policymakers. Climate Change 2021: The Physical Science Basis. Contribution of Working Group I to the Sixth Assessment Report of the Intergovernmental Panel on Climate Change [Masson-Delmotte, V., P. Zhai, A. Pirani, S. L. Connors, C. Péan, S. Berger, N. Caud, Y. Chen, L. Goldfarb, M. I. Gomis, M. Huang, K. Leitzell, E. Lonnoy, J. B. R. Matthews, T. K. Maycock, T. Waterfield, O. Yelekçi, R. Yu and B. Zhou (eds.)]. Cambridge University Press. In Press. (2021).
- [2] Guterres, A. Guterres: The IPCC Report is a code red for humanity. United Nations (2021). https://unric.org/en/guterres-the-ipcc-report-is-a-code-red-for-humanity (2021).
- [3] Marshall, P. J., Bennert, N., Rykoff, E. S., Shen, K. J., Steinfadt, J. D. R. et al. Low-Energy Astrophysics. Astro2010: The Astronomy and Astrophysics Decadal Survey, Position Papers, arXiv:0903.3384 no. 35 (2009).
- [4] Matzner, C. D., Cowan, N. B., Doyon, R., Hénault-Brunet, V., Lafrenière, D., et al. Astronomy in a Low-Carbon Future. Canadian Long Range Plan for Astronomy and Astrophysics White Papers, LRP2020 (2019); https://www.zenodo.org/record/3758549#.YRJLHS0itHQ.
- [5] Williamson, K., Rector, T. A., & Lowenthal, J. Embedding Climate Change Engagement in Astronomy Education and Research. BAAS 51, 49 (2019).
- [6] Stevens, A. R. H., Bellstedt, S., Elahi, P. J., & Murphy, M. T. The imperative to reduce carbon emissions in astronomy. Nat. Astron. 4, 843–851 (2020).
- [7] Le Quéré, C., Capstick, S., Corner, A., Cutting, D., Johnson, M. et al. Towards a culture of low-carbon research for the 21st Century. Tyndall Working Paper 161 (2015).
- [8] Rosen, J. A greener culture. Nature 546, 565–567 (2017).
- [9] Hamant, O., Saunders, T., & Viasnoff, V. Celebrate sustainable travel at conferences. Nature 573, 451–452 (2019).
- [10] Burtscher, L., Barret, D., Borkar, A. P., Grinberg, V., Jahnke, K. et al. The carbon footprint of large astronomy meetings. Nat. Astron. 4, 823–825 (2020).
- [11] Barret, D. Estimating, monitoring and minimizing the travel footprint associated with the development of the Athena X-ray Integral Field Unit. Exp. Astron. 49, 183–216 (2020).
- [12] Jahnke, K., Fendt, C., Fouesneau, M., Georgiev, I., Herbst, T., et al. An astronomical institute’s perspective on meeting the challenges of the climate crisis. Nat. Astron. 4, 812–815 (2020).
- [13] Space system Life Cycle Assessment (LCA) guidelines. ESSB-HB-U-005 1 (2016) https://www.bilans-ges.ademe.fr/fr/basecarbone/donnees-consulter/choix-categorie.
- [14] Maury, T., Loubet, P., Serrano, S. M., Gallice, A. & Sonnemann, G. Application of environmental life cycle assessment (LCA) within the space sector: A state of the art. Acta Astronautica 170, 122–135 (2020).
- [15] Breitenstein, A. Base Carbone. ADEME (2021) https://www.bilans-ges.ademe.fr/fr/basecarbone/donnees-consulter/choix-categorie.
- [16] Wilson, A. R. Advanced Methods of Life Cycle Assessment for Space Systems. PhD thesis, University of Strathclyde, Glasgow (2019).
- [17] Geerken, T., Vercalsteren, A., & Boonen, K. User experience of the ESA LCA handbook and database. 3rd Clean Space Industry days, ESTEC, Nordwijk, The Netherlands (2018) https://indico.esa.int/event/234/contributions/4023/attachments/3020/3643/CSID_2018_User_experience_of_the_ESA_LCA_Handbook_and_database_Theo_Geerken.pdf.
- [18] Friedlingstein, P., O’Sullivan, M., Jones, M. W., Andrew, R. M., Hauck, J., et al. Global Carbon Budget 2020. Earth Syst. Sci. Data 12, 3269–3340 (2020).
- [19] Hickel, J. Quantifying national responsibility for climate breakdown: an equality-based attribution approach for carbon dioxide emissions in excess of the planetary boundary. Lancet Planet Health 4, e399 (2020).
- [20] Alleva, L. Taking time to savour the rewards of slow science. Nature 443, 271 (2006).
- [21] Hunter, J. D. Matplotlib: a 2-D graphics environment. Comput. Sci. Eng. 9, 90–95 (2007).
- [22] Austin, J., Huesing, J., Soares, T., & Innocenti, L. Developing a standardises methodology for space-specific Life Cycle Assessment. Challenges in European Aerospace, 5th CEAS Air & Space Conference (2015).
- [23] Chanoine, A. Environmental impacts of launchers and space missions. Clean Space industrial Days, October 25th 2017, ESTEC (2017).
- [24] De Santis, M., Urbano, G., Blengini, G. A., Zah, R., Gmuender, S., & Ciroth, A. Environmental impact assessment of space sector: LCA results and applied methodolog. Proceedings of the 4th CEAS conference in Linköping, T. Melin, P. Krus, E. Vinterhav, & K. Övrebö (eds), Linköping University Electronic Press, 364–373 (2013).
- [25] Maury, T. Consideration of space debris in the life cycle assessment framework. PhD thesis, University of Bordeaux (2019).
- [26] Aujoux, C., Kotera, K., & Blanchard, O. Estimating the carbon footprint of the GRAND project, a multi-decade astrophysics experiment. Astropart. Phys. 131, 102587 (2021).
- [27] GRAND FAQ. CNRS https://grand.cnrs.fr/grand/faq/, (2021).
- [28] The E-ELT Construction Proposal (ESO, 2012).
- [29] FAQ VLT/Paranal. ESO https://www.eso.org/public/about-eso/faq/faq-vlt-paranal (2021).
- [30] Chardonnet, C., Diaz, I., Lemaître, M., & Pinon, L. Synthèse de l’enquête sur les coûts complets et ressources des infrastructures de recherche de la feuille de route nationale 2016. DGRI/SPFCO/B4 (2016) https://cache.media.enseignementsup-recherche.gouv.fr/file/Infrastructures_de_recherche/76/7/2016_synthese_enquete_1146767.pdf.
- [31] Lodewijk, W., Europe’s Quest for The Universe. EDP Sciences ISBN-10 2868838138 (2006).
- [32] Flagey, N., Thronas, K., Petric, A. O., Withington, K., & Seidel, M. J. Estimating carbon emissions at CFHT: a first step toward a more sustainable observatory. J. of Astron. Tel., Inst., and Sys. 7, id. 017001 (2021).
- [33] Simons, D. 2019 CFHT annual report. (2019) https://www.cfht.hawaii.edu/AnnualReports/AR2019.pdf.
- [34] Ariane 5 ECA. ESA https://www.esa.int/Enabling_Support/Space_Transportation/Launch_vehicles/Ariane_5_ECA (2021).
- [35] E-ELT Telescope Overview. ESO https://elt.eso.org/telescope (2021).
- [36] Song, G. Carbon footprint of a scientific publication: A case study at Dalian University of Technology, China. Eco. Indic. 66, 275–282 (2015).
- [37] 2021 Global Observatory Directory. (2021) https://www.go-astronomy.com/observatories.htm, accessed 11 August 2021.
- [38] Payne, M. List Of Observatory Codes. Minor Planet Center. (2021) https://www.minorplanetcenter.net/iau/lists/ObsCodesF.html, accessed 11 August 2021.
- [39] Espinosa, J. M. R. Geographical and Gender Distribution of Individual and Junior Members. International Astronomical Union (2021) https://www.iau.org/administration/membership/individual/distribution/, accessed 4 August 2021.
- [40] Ahn, S.-H. Economic Power, Population, and Size of Astronomical Community. JKAS 52, 159–172 (2019).
- [41] Cangi, E., Gibson, J., & Luebbers, M. Mission costs: Past, Present, Future. Humans to Moon and Mars Seminar (2019) https://lasp.colorado.edu/home/mop/files/2019/11/Mission-costs.pdf.
- [42] Q&A Chandra mission: How much did Chandra cost? (2021) https://chandra.harvard.edu/resources/faq/chandra/chandra-8.html, accessed 4 August 2021.
- [43] Dreyer, C. The Planetary Exploration Budget Dataset - Missions Overview (2002) https://www.planetary.org/space-policy/planetary-exploration-budget-dataset, accessed 5 August 2021.
- [44] Credland, J. The Cluster Mission - ESA’s Space Fleet to the Magnetosphere. ESA Bulletin Nr. 84. (1995).
- [45] Hertz, P. Astrophysics Large Scale Missions. (2016) https://sites.nationalacademies.org/cs/groups/ssbsite/documents/webpage/ssb_175761.pdf.
- [46] Parmer, A., & Winkler, C. INTEGRAL factsheet. ESA Media Relations (2011) https://www.esa.int/esaSC/SEM9P5374OD_0_spk.html.
- [47] XMM-Newton factsheet. (2021) https://www.esa.int/Science_Exploration/Space_Science/XMM-Newton_factsheet, accessed 4 August 2021.
- [48] Pilbratt, G., & Riedinger, J. Herschel fact sheet. ESA Media Relations Office (2010) https://www.esa.int/esaSC/SEMJ3WSMTWE_0_spk.html.
- [49] Bradt, H. Reflections on the Rossi X-ray timing explorer. (2013) https://space.mit.edu/wp-content/uploads/2019/06/RXTE-Memoir4.pdf.
- [50] Solar Dynamics Observatory. (2021) https://fr.wikipedia.org/wiki/Observatoire_de_la_dynamique_solaire, accessed 14 September 2021.
- [51] Jansen, F., Taylor, M., & Accomazzo, A. ESA Media Relations Office (2014) https://www.esa.int/Science_Exploration/Space_Science/Rosetta/Rosetta_Media_factsheet.
- [52] ROSAT. (2021) https://de.wikipedia.org/wiki/ROSAT, accessed 14 September 2021.
- [53] Frequently Asked Questions about Gaia. (2021) https://www.esa.int/Science_Exploration/Space_Science/Gaia/Frequently_Asked_Questions_about_Gaia, accessed 14 September 2021.
- [54] Texier, D., & Tauber, J. Planck fact sheet. ESA Media Relations Office (2012) https://www.esa.int/esaSC/SEM9WJ0XDYD_0_spk.html, accessed 14 September 2021.
- [55] Fleck, B. SoHO fact sheet. (2003) https://www.nasa.gov/pdf/156578main_SOHO_Fact_Sheet.pdf, accessed 14 September 2021.
- [56] Assessments of Selected Large-Scale Projects. GAO-12-207SP (2012) https://www.gao.gov/assets/gao-12-207sp.pdf.
- [57] Jayaraman, K. S. India places astronomy observatory in space. Nature India (2015) https://www.natureasia.com/en/nindia/article/10.1038/nindia.2015.131.
- [58] Kucera, T. STEREO frequently asked questions. (2021) https://stereo.gsfc.nasa.gov/classroom/faq.shtml#COSTS, accessed 14 September 2021.
- [59] Williams, D. R. Venus Express. NSSDCA/COSPAR ID: 2005-045A (2021) https://nssdc.gsfc.nasa.gov/nmc/spacecraft/display.action?id=2005-045A, accessed 5 August 2021.
- [60] Martin, P., Witasse, O., Denis, M., & Martin, P. Mars Express fact sheet. ESA Media Relations Office (2013) https://www.esa.int/esaSC/SEMTV8374OD_0_spk.html, accessed 14 September 2021.
- [61] Perryman, M. A. C. The Hipparcos and Tycho Catalogues. ESA, SP-1200 (1997).
- [62] Kepler: NASA’s First Mission Capable of Finding Earth-Size Planets. NASA Press-kit (2009) https://www.nasa.gov/pdf/314125main_Kepler_presskit_2-19_smfile.pdf.
- [63] AKARI. (2021) https://nl.wikipedia.org/wiki/AKARI, accessed 14 September 2021.
- [64] Spitzer Space Telescope Quick Facts. (2020) https://www.jpl.nasa.gov/news/press_kits/spitzer/quick-facts/, accessed 5 August 2021.
- [65] Luhmann, J. Principal-Investigator-Led Missions in the Space Sciences. ISBN 0-309-10070-4 (2006).
- [66] Leone D. WISE Telescope To Be Resurrected for Three-year Asteroid Hunt. Space News August 23 (2013) https://spacenews.com/36913wise-telescope-to-be-resurrected-for-three-year-asteroid-hunt/.
- [67] Explorer Programm. (2021) https://explorers.gsfc.nasa.gov/missions.html, accessed 5 August 2021.
- [68] NuSTAR press kit. (2012) https://www.jpl.nasa.gov/news/press_kits/NuSTARpresskit.pdf, accessed 14 September 2021.
- [69] Wall, M. NASA’s TESS Planet-Hunting Space Telescope Completes Its Primary Mission. Scientific American August 12 (2020). https://www.scientificamerican.com/article/nasa-rsquo-s-tess-planet-hunting-space-telescope-completes-its-primary-mission/.
- [70] Buisson, F. The DEMETER Program: A Pathfinder to a High Performance Micro Satellite Line. 17th Annual AIAA/USU Conference on Small Satellites (2003) https://digitalcommons.usu.edu/smallsat/2003/All2003/.
- [71] Humphries, C. M., Reddish, V. C., & Walshaw, D. J. Cost scaling laws and their origin: Design strategy for an optical array telescope. Proceedings of the IAU Colluquium No. 79: “Very Large Telescopes, their Instrumentation and Programs”, Garching, April 9–12, 1984 379 (1984).
- [72] Liu, J., Soria, R., Wu, X.-F., Wo, H., & Shang, Z. The SiTian Project. Annals of the Brazilian Academy of Sciences 93 1 (2021)
- [73] Goodrich, R., Dickinson, M., Bernstein, R., Dumas, C., & McCarthy, P. Observatory Operating Costs and Their Relation to Capital Costs. BAAS 51 225 (2019).
- [74] Akiyama, K., Alberdi, A., Alef, W., Asada, K., Azulay, R., et al. First M87 Event Horizon Telescope Results. II. Array and Instrumentation ApJ 875 L2 (2019).
- [75] Abdalla, H., Adam, R., Aharonian, F., Ait Benkhali, F., Angüner, E.O. et al. Constraints on the emission region of 3C 279 during strong flares in 2015 and 2015 through VHE gamma-ray observations with H.E.S.S. A&A 627, A159 (2019).
- [76] Van Belle, G. T., Meinel, A. B., & Meinel, M. P. The scaling relationship between telescope cost and aperture size for very large telescopes. Proc. SPIE 5489, 563 (2004).
- [77] FAQ VLT/Paranal. (2021) https://www.eso.org/public/about-eso/faq/faq-vlt-paranal/, accessed 4 August 2021.
- [78] ALMA factsheet (2021) https://www.almaobservatory.org/en/factsheet/, accessed 4 August 2021.
- [79] Mountain, M., & Cohen, A. US astronomers face hard decisions. Nature 560, 427 (2018).
- [80] Brief history of AAT. (2021) https://aat.anu.edu.au/about-us/a-brief-history, accessed 4 August 2021.
- [81] Colless, M. Annual Report of the Anglo-Australian Observatory, 1 July 2009 – 30 June 2021. (2009) https://aat.anu.edu.au/about-us/annual-reports.
- [82] NSF Fiscal Year 2019 Budget Request for the National Optical Astronomy Observatory (NOAO). (2019) https://www.nsf.gov/about/budget/fy2019/pdf/40s_fy2019.pdf
- [83] Very Long Baseline Array. (2021) https://en.wikipedia.org/wiki/Very_Long_Baseline_Array, accessed 4 August 2021.
- [84] Une étape majeure pour la construction du radiotélescope NOEMA. (2021) https://www.iram-institute.org/EN/news/2018/163.html, accessed 4 August 2021.
- [85] Pety, J., Lagache, G., Gerin, M., Demyk, K., Elbaz, D., et al. IRAM-France Day summary note. (2019) https://iram-france.sciencesconf.org/data/pages/iram_france_summary.pdf, accessed 4 August 2021.
- [86] 2019 CFHT Annual Report. (2019) https://www.cfht.hawaii.edu/en/about/AnnualReports.php.
- [87] Lodewijk, W., Europe’s Quest for The Universe. EDP Sciences ISBN-10 2868838138 (2006)
- [88] Green Bank Facts. (2021) https://greenbankobservatory.org/about/green-bank-facts/, accessed 4 August 2021.
- [89] Advancing Astronomy in the Coming Decade: Opportunities and Challenges. Report of the National Science Foundation Division of Astronomical Sciences Portfolio Review Committee. (2012) https://www.nsf.gov/mps/ast/portfolioreview/reports/ast_portfolio_review_report.pdf
- [90] LOFAR-UK statement on STFC Science Programme Prioritisation 2010-2015. https://lofar-uk.org/images/lofar-uk-stfc-response.pdf.
- [91] LOFAR: opening a window on the low frequency radio Universe. (2005) https://lesia.obspm.fr/plasma/LOFAR2006/LOFAR_ESFRI_24nov05.pdf.
- [92] Hill, R. A Personal Retrospective. JCMT Newsletter 36 (2015). https://www.eaobservatory.org//JCMT/publications/newsletter/jcmt-n36.pdf.
- [93] Davis, G. The James Clerk Maxwell Telescope Prospectus. (2021) https://stfc.ukri.org/files/jcmtprospectuspdf/, accessed 8 August 2021.
- [94] Building the Australia Telescope Compact Array. (2021) https://www.atnf.csiro.au/outreach/about/history/building-atca/index.html, accessed 4 August 2021.
- [95] Bock, D. ATNF Operations. (2015) https://www.atnf.csiro.au/management/atuc/presentation/jun2015_Bock_ATNF_Ops.pdf.
- [96] Maseko, L. Meeting Summary of National Assembly Science and Technology committee. (2017) https://pmg.org.za/committee-meeting/24534/, accessed 4 August 2021.
- [97] Leverington, D. Observatories and Telescopes of Modern Times: Ground-Based Optical and Radio Astronomy Facilities since 1945. Cambridge: Cambridge University Press. doi:10.1017/9781139051507 (2016)
- [98] Schloerb, P., Aretxaga, I., Chavez, M., Gutermuth, R., Heyer, M., et al. A Decade of US Community Access to the Large Millimeter Telescope Alfonso Serrano. BAAS 51, 148 (2019).
- [99] McIntosh, S., Tomczyk, S., Gibson, S. E., Burkepile, J., de Wijn, A., et al. Investigating Coronal Magnetism with COSMO: Science on the Critical Path To Understanding The Weather of Stars and Stellarspheres. BAAS 51, 165 (2019).
- [100] Olofsson, H. Strategic Plan 2012-2016: Onsala Space Observatory. The Swedish National Facility for Radio Astronomy. (2012)
- [101] Masson, C. Submillimeter Array Technical Memorandum #29. Harvard, Smithsonian Center for Astrophysics (1990).
- [102] Borenstein, S. First black hole picture: Event Horizon Telescope project reveals historic image. ABC7News April 11 (2019) https://abc7news.com/black-hole-picture-photo-of/5241612/.
- [103] Wijers, R. et al. Radio Astronomy in Europe: Up to, and beyond, 2025. Final report of the European Radio Telescope Review Committee (ERTRC) (2015) https://www.radionet-org.eu/radionet/wp-content/uploads/sites/15/2017/03/150713-ASTRONET-ERTRC-Report-Final.pdf.
- [104] Cabanac, R. Telescope Bernard Lyot: operation, instrumentation, perspectives. SF2A-2016: Proceedings of the Annual meeting of the French Society of Astronomy and Astrophysics, eds. Reylé, C., Richard, J., Cambrésy, L., Deleuil, M., and Pécontal, E., Tresse, L., & Vauglin, I., 237 (2016).
- [105] Bayer, P., & Aklin, Michaël The European Union Emissions Trading System reduced CO2 emissions despite low prices. Proc. Natl Acad. Sci. USA 117 16, 8804 (2020).
- [106] Lehne, J., Moro, E., Nguyen, P.-V., Pellerin-Carlin, T. The EU ETS: From cornerstone to catalyst. E3G, Jaques Delors Institut (2021) https://institutdelors.eu/wp-content/uploads/2021/04/JDI-E3G-paper_innovation-in-the-ETS_final.pdf.
- [107] Daily Carbon Prices. (2021) https://ember-climate.org/data/carbon-price-viewer/, accessed 13 September 2021.
- [108] Offset a desired amount of CO2. (2021) https://www.atmosfair.de/en/offset/fix/, accessed 13 September 2021.
- [109] Reforestation”, Agriculture and Food Development Authority. (2021) https://www.teagasc.ie/crops/forestry/advice/establishment/reforestation/, accessed 13 September 2021.
Acronyms used throughout this paper represent: Hubble Space Telescope (HST), International Gamma-Ray Astrophysics Laboratory (INTEGRAL), X-ray Multi-Mirror mission (XMM), Rossi X-ray Timing Explorer (RXTE), Solar Dynamics Observatory (SDO), Mars Atmosphere and Volatile Evolution mission (MAVEN), Röntgensatellit (ROSAT), Mars Reconnaissance Orbiter (MRO), Solar and Heliospheric Observatory (SoHO), Astronomy Satellite (AstroSat), Magnetospheric Multiscale mission (MMS), Solar Terrestrial Relations Observatory (STEREO), Advanced Composition Explorer (ACE), Interior Exploration using Seismic Investigations, Geodesy and Heat Transport probe (InSight), Parker Solar Probe (PSP), Wide-field Infrared Survey Explorer (WISE), Thermosphere, Ionosphere, Mesosphere Energetics and Dynamics mission (TIMED), Interplanetary Monitoring Platform 8 (IMP-8), Neutron star Interior Composition Explorer (NICER), Nuclear Spectroscopic Telescope Array (NuSTAR), Transiting Exoplanet Survey Satellite (TESS), Galaxy Evolution Explorer (GALEX), Detection of Electromagnetic Emissions Transmitted from Earthquake Regions satellite (DEMETER), Very Large Telescope array (VLT), Atacama Large Millimeter/submillimeter Array (ALMA), Stratospheric Observatory for Infrared Astronomy (SOFIA), Anglo-Australian Telescope (AAT), Very Large Array (VLA), Very Long Baseline Array (VLBA), Institut de radioastronomie millimétrique (IRAM), Canada France Hawaii Telescope (CFHT), European Southern Observatory (ESO), Green Bank Telescope (GBT), Low-Frequency Array (LOFAR), James Clerk Maxwell Telescope (JCMT), Australia Telescope Compact Array (ATCA), High Energy Stereoscopic System (H.E.S.S.), More of Karoo Array Telescope (MeerKAT), Gran Telescopio Canarias (GTC), Nobeyama Radio Observatory (NRO), Large Millimeter Telescope (LMT), Mauna Loa Solar Observatory (MLSO), Atacama Pathfinder Experiment (APEX), Submillimeter Array (SMA), Event Horizon Telescope (EHT), Telescope Bernard Lyot (TBL), Observatoire de Haute-Provence (OHP), Korea Microlensing Telescope Network (KMTNet), Télescope Héliographique pour l’Etude du Magnétisme et des Instabilités Solaires (THEMIS), Yunnan Astronomical Observatory (YAO), Himalayan Chandra Telescope (HCT), Fred Lawrence Whipple Observatory (FLWO), National Astronomical Observatory San Pedro Mártir (OAN-SPM), Bohyunsan Optical Astronomy Observatory (BOAO), Optical Gravitational Lensing Experiment (OGLE), Centre Pédagogique Planète Univers (C2PU), Télescope à Action Rapide pour les Objets Transitoires (TAROT), and Nanshan One meter Wide-field Telescope (NOWT).
We thank R. Arsenault for the insights that he provided on the carbon footprint estimates of ESO infrastructures and sites. We furthermore thank M. de Naurois, C. Duran, Z. Fan, C.-U. Lee, A. Klotz, K. Kotera, K. Tatematsu and S. O’Toole for having provided data that were useful for this research. In addition we thank N. Flagey, L. Pagani, G. Song, M. Smith-Spanier and A. Ross Wilson for useful discussions and K. Lockhart and S. Blanco-Cuaresma for their help with ADS. This research has made use of NASA’s Astrophysics Data System Bibliographic Services. In addition, this work has made use of the Python 2D plotting library matplotlib[21].
J.K. gathered the activity data, made the estimates of the emission factors, estimated the carbon footprints and drafted the paper. All authors defined the analysis method and the IRAP carbon footprint attribution method, elaborated the discussion section and reviewed the manuscript.
Correspondence should be addressed to J.K. (jurgen.knodlseder@irap.omp.eu).
The authors declare no competing interests.
Nature Astronomy thanks Andrew Wilson, Robin Arsenault and Lewis Ball for their contribution to the peer review of this work.
Activity data
0.8 Space missions
We gathered full mission cost and payload launch mass estimates for all selected missions from the internet. The results of this exercise are summarised in Supplementary Table 1. Payload launch mass estimates are straightforward to find on the Wikipedia pages of the corresponding space mission, from which we also gathered the launch and mission end dates. Reliable full mission cost estimates are significantly more difficult to compile, as mission-related documentation is voluminous, and press articles rarely include cost breakdowns. Our mass-based estimates are therefore more homogenous, but they do not account for the complexity of a space mission that also drives its final cost and eventually the carbon footprint. Likewise, they do not reflect differences in mission duration that may lead to differences in carbon footprints for the operations phase. In general, the full mission cost includes the cost of in-kind contributions to the satellite payload, yet there may be exceptions where these costs are not included. We did not explicitly account for the additional costs of mission extensions. We found that for some cases mission extensions were included in the quoted costs, in particular for all of NASA’s planetary missions where annual budgets are provided by [43]. In other cases, the extensions were not included, and in a few cases, the construction cost value quotes we found were suspiciously low.
| Mission | Payload launch mass | Mission cost | Reference |
|---|---|---|---|
| (kg) | (M€) | ||
| HST | 11,110 | 8,037 | [41] |
| Chandra | 5,860 | 4,114 | [42] |
| Cassini | 5,820 | 2,806 | [43] |
| Cluster | 4,800 | 944 | [44] |
| Fermi | 4,303 | 863 | [45] |
| INTEGRAL | 4,000 | 419 | [46] |
| Curiosity | 3,893 | 2,590 | [43] |
| XMM | 3,800 | 1,113 | [47] |
| Juno | 3,625 | 1,082 | [43] |
| Herschel | 3,400 | 1,152 | [48] |
| RXTE | 3,200 | 360 | [49] |
| SDO | 3,100 | 865 | [50] |
| Rosetta | 2,900 | 1,709 | [51] |
| Galileo | 2,560 | 1,275 | [43] |
| MAVEN | 2,454 | 638 | [43] |
| ROSAT | 2,421 | 635 | [52] |
| MRO | 2,180 | 928 | [43] |
| GAIA | 2,034 | 1,037 | [53] |
| Planck | 1,900 | 775 | [54] |
| SoHO | 1,850 | 1,469 | [55] |
| Suzaku | 1,706 | ||
| AstroSat | 1,515 | 27 | [57] |
| MMS | 1,360 | 1,054 | [56] |
| Venus Express | 1,270 | 300 | [59] |
| WIND | 1,250 | ||
| STEREO | 1,238 | 614 | [58] |
| Mars Express | 1,223 | 374 | [60] |
| Dawn | 1,218 | 439 | [43] |
| Hipparcos | 1,140 | 933 | [61] |
| Kepler | 1,052 | 636 | [62] |
| GEOTAIL | 1,009 | ||
| Akari | 952 | 106 | [63] |
| Spitzer | 950 | 1,188 | [64] |
| SWIFT | 843 | 279 | [65] |
| ACE | 752 | ||
| InSight | 694 | 714 | [43] |
| PSP | 685 | 1,310 | [41] |
| WISE | 661 | 335 | [66] |
| TIMED | 660 | 259 | [65] |
| Double Star | 560 | ||
| IMP-8 | 410 | ||
| NICER | 372 | 53 | [67] |
| NuSTAR | 360 | 156 | [68] |
| TESS | 325 | 275 | [69] |
| GALEX | 280 | 120 | [65] |
| DEMETER | 130 | 21 | [70] |
0.9 Ground-based observatories
| Observatory | Cost | |||
|---|---|---|---|---|
| Construction | Operations | |||
| (M€) | Reference | (M€ yr-1) | Reference | |
| VLT (Paranal) | 1,384 | [76] | 40 | [77] |
| ALMA | 1,248 | [78] | 105 | [79] |
| SOFIA | 1,098 | [56] | 90 | [56] |
| AAT | 124 | [80] | 15 | [81] |
| VLA | 345 | [73] | 10 | [82] |
| VLBA | 132 | [83] | 15 | [83] |
| IRAM | 51 | [84] | 15 | [85] |
| Gemini-South | 135 | [73] | 13 | [73] |
| CFHT | 85 | [76] | 6.3 | [86] |
| ESO 3.6m (La Silla) | 99 | [87] | 5.2 | [87] |
| GBT | 120 | [88] | 10 | [89] |
| LOFAR | 200 | [90] | 9.2 | [91] |
| JCMT | 38 | [92] | 5.5 | [93] |
| ATCA | 95 | [94] | 3.5 | [95] |
| H.E.S.S. | 49 | (1) | 8.8 | [30] |
| MeerKAT | 128 | [96] | 13 | [96] |
| GTC | 125 | [76] | ||
| NRO | 51 | (1) | 1.5 | (1) |
| LMT | 77 | [97] | 3.1 | [98] |
| MLSO | 1.2 | [99] | ||
| APEX | 20 | (1) | 2.7 | [100] |
| SMA | 60 | [101] | ||
| EHT | 52 | [102] | - | - |
| Noto Radio Observatory | 1.5 | [103] | ||
| 2m TBL | 6.0 | (2) | 1.0 | [104] |
| 2.16m (Xinglong Station) | 7.3 | (2) | 0.7 | (3) |
| 1.93m OHP | 5.5 | (2) | 0.5 | (3) |
| KMTNet | 17 | (1) | 1.7 | (1) |
| THEMIS | 1.1 | (1) | ||
| 2.4m LiJiang (YAO) | 9.6 | (2) | 1.0 | (3) |
| 2m HCT (IAO) | 6.1 | (2) | 0.6 | (3) |
| 1.5m Tillinghast (FLWO) | 2.8 | (2) | 0.3 | (3) |
| 1.5m (OAN-SPM) | 2.8 | (2) | 0.3 | (3) |
| 1.8m (BOAO) | 4.6 | (2) | 0.5 | (3) |
| 1m (Pic-du-Midi) | 1.0 | (2) | 0.1 | (3) |
| 1.3m Warsaw (OGLE) | 2.0 | (2) | 0.2 | (3) |
| C2PU | 2.0 | (2) | 0.2 | (3) |
| TAROT | 0.9 | (1) | 0.1 | (3) |
| 1m NOWT | 1.0 | (2) | 0.1 | (3) |
(1) private communication, (2) derived using Eq. (4), (3) assuming 10% of construction cost as annual operation costs.
Estimating the carbon footprint for ground-based observatories is more difficult than for space missions, since many ground-based observatories build up gradually, being complemented over the years with new telescopes or receiving upgrades for cameras, spectrographs, receivers, correlators and other instrumentation. All these evolutions are difficult to reconstruct a posteriori, hence we take the approach to gather as much information as possible, but without the requirement to be complete, leaving out information when it is not available, so that our estimate is formally only a lower limit to the true carbon footprint of ground-based observatories. The results are summarised in Supplementary Table 2.
In our list, there are a number of 1–2 metre class telescopes that are used by IRAP’s stellar astrophysics group and for which reliable cost information is in general not available. Several authors have however pointed out that construction cost scales with aperture size , and for telescopes of modest size [71] suggest that
| (4) |
when converted to 2019 economic conditions, where is in units of metres. Modern 1-metre class projects still satisfy this scaling law (e.g. [72]), hence we adopt it for construction cost estimation for 1–2 metre class telescopes if no cost information could be found. In the absence of information on operating costs, we furthermore assume 10% of construction cost as annual operating costs, inferred from [73] for telescopes with 1–10 M€ construction cost.
We assembled construction costs and operation costs of observatories from public documents or via private inquiry. All cost values were corrected for inflation and converted to 2019 economic conditions. For IRAM, we could not obtain construction costs for the initial installation, so we take the construction cost of the NOEMA upgrade as a lower limit to the total construction cost. We included the SOFIA airborne observatory in our list of ground-based observatories, since its lifecycle is closer to that of a ground-based observatory than a space mission. For the Event Horizon Telescope (EHT), which is a very long baseline interferometry array of existing millimeter and submillimeter wavelength facilities that span the globe [74], we do not count the carbon footprint of the individual facilities, but the footprint related to the cost of combining the facilities into an Earth-wide VLBI project. For H.E.S.S., the operating costs are full costs extrapolated from the values provided by [30] for France and assuming a French contribution of 28% to the project, estimated from the fraction of French authors on the paper [75].
Contribution to the carbon footprint of IRAP
To assess the carbon footprint of astronomical research infrastructures that can be attributed to an individual research institute we select our own institute IRAP as a case study. As a first method of attribution, we use the number of peer-reviewed scientific publications that have authors affiliated to IRAP. This is the method used to assess the scientific productivity of our institute in official evaluations. For this estimate, we used the same ADS queries that we used for the determination of the number of papers for a given research infrastructure, but now we restricted the query to publications that included IRAP among the affiliations, to papers written in 2019, and to the facilities considered in this work. Multiplying the results with the carbon intensity per paper for each space mission and ground-based observatory and summing up the results gives a footprint of 204 ktCO2e (mass-based) to 245 ktCO2e (cost-based) for the space missions and 135 ktCO2e for the ground-based observatories, totalling to 357 ktCO2e for IRAP.
We note, however, that research infrastructures that started operating only recently have a relatively large carbon intensity due to the short period over which the construction footprint is distributed, leading to an artificially inflated carbon footprint attribution. We therefore use an alternative attribution method where we multiply the annual carbon footprint of an infrastructure with the fraction of peer-reviewed papers in 2019 that have authors affiliated to IRAP. This results in a footprint of 122 ktCO2e (mass-based and cost-based) for the space missions and 83 ktCO2e for the ground-based observatories, totalling to 203 ktCO2e for IRAP in 2019. Attributing this footprint equally to the 144 astronomers with PhD degree that worked at IRAP in 2019 results in 13923 tCO2e per astronomer. If we instead divide the annual research infrastructure carbon footprint equally by the total number of staff that worked at IRAP in 2019 (263 people), we obtain 7612 tCO2e per IRAP staff member.
We want to point out that this attribution method does not provide IRAP’s share of the total carbon footprint of research infrastructures among all existing astronomical institutes in the world. Since scientific articles are often signed by authors from multiple institutes, each of these institutes will get the same attribution, implying that the sum of all attributions will exceed the total carbon footprint of all research infrastructures. The share can however be estimated by replacing the number of peer-reviewed papers by the number of unique authors, i.e. multiply the annual carbon footprint of an infrastructure with the fraction of unique authors of peer-reviewed papers in 2019 that are affiliated to IRAP. This results in a carbon footprint of 2.50.5 ktCO2e (mass-based) and 2.80.6 ktCO2e (cost-based) for the space missions, and 1.30.5 ktCO2e for the ground-based observatories, totalling to 4.00.7 ktCO2e for IRAP in 2019. For each of the IRAP astronomers with PhD degree this corresponds to a footprint of 27.44.8 tCO2e, for each person working at IRAP in 2019, the footprint is 15.02.6 tCO2e. We note that also in this share some double-counting may occur since an individual may be affiliated to multiple institutes. But for a given individual, the computation of the share should be accurate.
We point out that this result only covers the research infrastructures considered in this paper. We assembled the list of infrastructures in our sample by scrutinising the titles and abstracts of the 2019 papers affiliated to IRAP, potentially missing infrastructures that were only mentioned in the body text of the papers. Our ADS queries, however, scan the full text of the papers, and hence would lead to a larger contribution to the IRAP footprint if more research infrastructures were covered. To test this hypothesis, we also estimate the IRAP 2019 contribution for all active space missions in 2019, based on the payload mass, and for all active optical-near-infrared (OIR) telescopes with at least 3 metres of diameter. The full list of facilities that we considered is provided in the Supplementary Data file that is available for download at https://doi.org/10.5281/zenodo.5835840. In both cases, the extension of the list of infrastructures led to an increase of about 30% in the attributed carbon footprint. If the same holds for other active infrastructures not included in this paper, the footprint of each IRAP astronomer with PhD degree would increase to about 36 tCO2e.
Is offsetting a solution?
A possible solution that is often mentioned in the context of carbon footprint reductions is offsetting. Briefly, offsetting is a process where someone else is paid to reduce his/her carbon footprint in place of yours. Offsetting is already implemented in the European Union Emission Trading Scheme (EU ETS) but so far its impact on reducing the EU GHG emissions is at most modest [105, 106]. At the time of writing the paper (September 2021), the EU ETS carbon price was at 61 € per tonne of CO2 [107], which expressed in allowed CO2 emissions per amount of money spent corresponds to 16,400 tCO2e M€-1. Individual offsetting projects have prices of the same order of magnitude, for example atmosfair, a popular scheme in Germany, uses 23 € per tonne of CO2 at the time of writing the paper [108], corresponding to an allowance of 43,500 tCO2e M€-1. In other words, the allowance to emit CO2 is about two orders of magnitude larger than the actual emissions for a given amount of money (see the emission factors in Table 1). Therefore the economic incentive to reduce CO2 emissions by offsetting is basically zero.
Is it possible to take a given amount of CO2 out of the atmosphere for 100 times less money than was spent for emitting it? As an example, we consider reforestation, which is a popular target of offsetting plans. Reforestation of one hectare of forest costs about 3 k€ [109]. Depending on the prior use of the land, transforming agricultural land to forest brings an additional carbon sequestration of 1.6 tCO2e per hectare and year, replacing a meadow by a forest brings an additional sequestration of 370 kgCO2e per hectare and year [15]. In general, using agricultural land for reforestation should be avoided as the land is needed for food production, creating in particular strong ethical issues when offsetting plans are implemented in the Global South. Instead, we consider the sequestration potential of forests replacing meadows. Absorbing for example the ALMA operations footprint of 26 ktCO2e yr-1 would require planting 70,000 hectares of forest, which would correspond to an investment of 210 M€. Additionally absorbing its construction footprint of 300 ktCO2e over a decade (the time scale suggested by the IPCC [1] to reach net zero GHG emissions) needs an additional 81,000 hectares of forest, corresponding to an investment of 240 M€, resulting in a total investment of 450 M€ for offsetting ALMA’s GHG emissions. This is about half of ALMA’s construction costs, and requires reforestation of an area that is about the size of Monaco. The true price for offsetting is therefore significant, commensurable with the cost to build an astronomical research infrastructure, and it requires the availability of large areas of land that are not yet used otherwise. Real offsetting (i.e. the kind of offsetting we just described) might be a viable temporal solution if other GHG reduction schemes cannot be implemented, but we emphasise it requires considerable investment, which would need to factored into project costs as early as possible.