\ul
Negative Associations in Word Embeddings Predict anti-Black Bias Across Regions–but only via Name Frequency
Abstract
The word embedding association test (WEAT) is an important method for measuring linguistic biases against social groups such as ethnic minorities in large text corpora. It does so by comparing the semantic relatedness of words prototypical of the groups (e.g., names unique to those groups) and attribute words (e.g., ‘pleasant’ and ‘unpleasant’ words). We show that anti-black WEAT estimates from geo-tagged social media data at the level of metropolitan statistical areas strongly correlate with several measures of racial animus—even when controlling for sociodemographic covariates. However, we also show that every one of these correlations is explained by a third variable: the frequency of Black names in the underlying corpora relative to White names. This occurs because word embeddings tend to group positive (negative) words and frequent (rare) words together in the estimated semantic space. As the frequency of Black names on social media is strongly correlated with Black Americans’ prevalence in the population, this results in spurious anti-Black WEAT estimates wherever few Black Americans live. This suggests that research using the WEAT to measure bias should consider term frequency, and also demonstrates the potential consequences of using black-box models like word embeddings to study human cognition and behavior.
One of the most important innovations in the last decade of natural language processing has been the development of word embeddings algorithms (Mikolov et al. 2013; Pennington, Socher, and Manning 2014). These tools leverage statistical patterns in large text corpora to build representations of words’ meanings according to the distributional hypothesis–that words deployed in similar contexts have similar meanings. There are now several different varieties of such models, and they are widely used by social scientists, computational linguists, and practitioners (van Loon and Freese in press; Nelson 2021; Arseniev-Koehler and Foster 2020; Kozlowski, Taddy, and Evans 2019).
These models can be used to measure the “bias” present in a particular text corpus. The most prominent method for doing so, the word embeddings association test (WEAT), compares the semantic relatedness of different sets of words using the cosine similarity of their vector representations to detect potentially subtle ways in which one set of targets is talked about differently than another (Caliskan, Bryson, and Narayanan 2017). For instance, the WEAT might test whether flowers are portrayed in a more positive manner than insects in the Google News corpus, or whether women are discussed as being more related to the home than men are on Wikipedia. This approach has had a large impact on computational social science and computational linguistics, and continues to be popular.
Here, we share a cautionary tale about how the tendency of word embeddings to encode all kinds of unexpected or unintended information can lead estimates of semantic relatedness—and thus the WEAT—astray. Using a geo-tagged data set of general population US Twitter data, we show that estimates of anti-black bias using the WEAT at the metropolitan statistical area (MSA) level significantly predicts various measures of prejudice against African Americans in those same communities. This linguistic bias measure, for instance, predicts the average black-white Implicit Association Task (IAT) score from Project Implicit (Xu, Nosek, and Greenwald 2014) (an experimental measure of bias) originating from that MSA and the level of black-white residential segregation in the MSA. We further show that these relationships are robust to wide set of standard statistical controls.
We go on to show, however, that each of these relationships are in fact spurious, explained away by a single omitted variable—the relative frequency of names unique to ethnic minorities in the underlying corpora. Word embeddings have a tendency to conflate term frequency and positivity, making the anti-black linguistic bias detected a complete methodological artifact. This name frequency is, however, strongly correlated with the proportion of the population that is black, which is itself strongly correlated with many of these outcomes. The result is that the WEAT appears to be a highly sophisticated way for detecting linguistic bias, but it is in fact just a noisy proxy measuring how rare Black names are in the data.
Contributions. We show empirically that a popular measure of the linguistic bias in word embeddings, the WEAT, has a tendency to conflate the frequency of category words with their positivity. In settings such as ours where the frequency of category words is correlated with meaningful information, this results in misleading omitted variable bias.
Related Work
The WEAT was introduced by Caliskan, Bryson, and Narayanan (2017). It takes as input a trained word embedding model, two sets of “category words” and , and two sets of “attribute words” and . Where is the cosine similarity between the vectors assigned to words and by the trained word embedding model, it outputs a single measure of how ‘biased’ the set of word embeddings are, measured as:
So, for instance, and might be uniquely European-American and African-American names respectively, and might be ‘pleasant’ and ‘unpleasant’ words respectively (for a review of how these attribute words are chosen, see Antoniak and Mimno [2021]), and the word embedding model might be a Word2Vec model (Mikolov et al. 2013) trained on a corpus of interest. In this case, is the difference between how much more pleasant words are associated with white names than black names () and how much more unpleasant words are associated with white names than black names (). If pleasant words were found to be more associated with white names while unpleasant words were found to be more associated with black names, the overall measure would be positive, indicating anti-black bias in the underlying text corpus the word embeddings were trained on.
This deceptively simple measure has become an integral part of the computational linguistics toolkit. Other high-profile papers such as Garg et al. (2018) and Lewis and Lupyan (2020) have used the WEAT to study cultural biases across time and place. Importantly, the method is now being used to evaluate the political biases of websites (Knoche et al. 2019), detect the purposeful spread of misinformation on social media by state-sponsored actors (Toney et al. 2021), uncover biases present and proliferated through popular song lyrics (Barman, Awekar, and Kothari 2019), and even to measure how much gender bias US judges display in their judicial opinions (Ash, Chen, and Galletta 2021).
However, there are well-known issues with word embeddings in general and the WEAT specifically that should make us skeptical of this proliferation. Silva, Tambwekar, and Gombolay (2021), for instance, find that (at least when using contextualized embedding models) WEAT estimates poorly predict bias estimated by other measures and is even internally inconsistent. Goldfarb-Tarrant et al. (2020) find that estimates of the bias present in word embeddings (such as those produced by the WEAT) do not meaningfully correlate with downstream biases of applications using those embeddings. Finally, terms in the semantic space estimated by word embeddings tend to cluster on non-intuitive dimensions such as term frequency (Arora, Liang, and Ma 2017; Mu, Bhat, and Viswanath 2017; Gong et al. 2018).
We focus in on this final issue–that a term’s frequency in a corpus shapes its estimated vector representation in a word embedding. Human language exhibits a clear “linguistic positivity bias”, where positive words are used more frequently than negative words (Dodds et al. 2015). In theory, this might result in rare words being on average closer to negative words than positive words and frequent words being on average closer to positive words than negative words. Wolfe and Caliskan (2021), consistent with this reasoning, find that the degree of linguistic bias, estimated using the WEAT, towards names unique to ethnic minorities is highly correlated with the frequency with which they appear in the underlying corpus.
Data and Methods
Geo-Tagged Twitter Data
A random 10% sample of the Twitter stream (i.e., the “Garden Hose”) was collected between January 2010 and May 2014, after which the data was reduced to a 1% sample for the remainder of 2014 (Preotiuc-Pietro et al. 2012). Each tweet was mapped to a MSA (by first mapping to a U.S. county which is then trivially mapped to a MSA). If latitude/longitude information is available, then a tweet can trivially be mapped to a US county. If latitude/longitude data is not available for a given tweet, then location information is extracted from the self-reported User Location field, if available. This is a rule based mapping system designed to avoid false positives (i.e., incorrect mappings) at the expense of fewer mappings. For full details please see Schwartz et al. (2013).
We also removed retweets and quoted tweets from the corpus, as we were interested only in the original language produced by MSA residents. All retweets and quoted tweets in our data contained “RT @” followed by the handle of the account the tweet was a retweet/quote of. Therefore, we excluded from analysis any tweet that contained “RT @” in its main body. However, some small number of tweets that were not retweets or quoted tweets likely contained this, and may have thus been unduly removed from the analysis.111To asses how accurate this heuristic was, we tested it on similar Twitter data for which we did have ground-truth meta-data indicating whether a tweet was a retweet or quoting tweet. We found the heuristic to be over 99.995% accurate in identifying retweets. After excluding MSAs with less that 500k tweets (see below), the final data set consists of 1.12 billion tweets from 214 MSAs (out of 384 possible MSAs).
MSA-Level WEAT Estimates
Our empirical strategy is to compare WEAT-based measures of the anti-black linguistic bias present in each MSA’s Twitter discourse and compare that to other regional measures of racial animus. One straight-forward approach to this would be to train completely independent word embedding models on each MSA’s respective Twitter data, and subject each of these models to the WEAT. One obstacle to realizing this strategy is that the volume of Twitter data produced by the residents of many MSAs over our observation period is relatively small. Even in our large data set, the median number of tweets (after removing retweets as specified above) in an MSA was 615,474—a smaller number than typically used for high-quality word embeddings. Further, variation in the number of tweets available for each MSA might introduce unwanted bias into our estimates.
To overcome this limitation, we leveraged the approach taken in van Loon et al. (2020), which allows for estimating linguistic differences among (relatively) small sub-populations. In our case, it works by first randomly sampling a fixed number of tweets from every MSA, compiling them together, and training a word embedding model (in our case a Word2Vec model222CBOW model, vector size of one-hundred, minimum term count of ten, using negative sampling and an initial learning rate of 0.025) on this stratified corpus. This model, built over 1 million tweets, is referred to as the “baseline model” and represents the consensual linguistic understanding among the MSAs. Then, for each MSA, a larger fixed number of tweets is sampled from that MSA and used to continue training the baseline model. Specifically, we sample 500k tweets per MSA, excluding those with less than 500k tweets. The resulting model is the “updated model”, which learns the idiosyncratic linguistic norms of its MSA. This updated model is then what the WEAT is performed on. This is repeated five times and the WEAT estimates for each MSA are averaged to overcome stochastic variation in sampling and in training the embedding models.
We wanted our WEAT to be as similar to that performed by Caliskan, Bryson, and Narayanan (2017) as possible. To that end, we used the same list of African-American and European-American names and pleasant and unpleasant words as them. Since they used multiple lists from different sources, we simply took the union of these different lists (and excluded any which were not frequent enough in the corpus to be included in the baseline model). Just as in Caliskan, Bryson, and Narayanan (2017), a higher score on the WEAT indicates more anti-black bias.
Other Variables
We briefly describe each variable below, with full descriptions in the Supplemental Materials.
Racial Animus Measures.
Implicit Bias is derived through IAT experiments. It is represented by the average -score (a measure of the difference in response latency when pleasant [unpleasant] words were paired with white [black] faces and vice versa) for all respondents in a given MSA. Explicit Bias measures feeling more warmly towards European Americans relative to African Americans (as self-reported). Opposition to Affirmative Action asks how respondents felt about affirmative action policies in general, which is averaged for all white respondents (on surveys). Racial Resentment is measured by racial resentment scale which attitudes thought to be indicative of racial animus among contemporary American whites (on surveys) (Kinder, Sanders, and Sanders 1996). Residential Segregation is the proportion of one group that would need to change the location of their residence for the MSA to have no segregation.
Relative Black Name Frequency.
For each MSA, we measure how often each name used as a category word in the WEAT appears in the MSA’s Twitter discourse and find the proportion of all name occurrences that are uniquely black.
Controls
We collect the following information for each MSA to use as standard control variables: the proportion of the population living in poverty, the log of the total population count, the logged population density, the proportion of residents whose highest educational attainment was completing high school or less, and the proportion of households that live in a rural area. We also collect the proportion of residents that identify as black. Finally, we create a series of binary variables indicating in which of the nine census division each MSA resides.
Statistical Analysis
Following the methods used in the social sciences, we use ordinary least squares (OLS) regression, which models the outcome as a weighted linear combination of the predictors with random, Gaussian-distributed noise and for every predictor yields a standardized coefficient with an associated significance. The simultaneous inclusion of multiple predictors allows OLS to partial out (control for) the associations of different covariates with the outcome. In all models, all variables are standardized (mean centered and re-scaled to a unit standard deviation ) to ease comparison and interpretability.
Results
|
|
|
|
||||||||||
|---|---|---|---|---|---|---|---|---|---|---|---|---|---|
| Implicit bias | 0.23*** | 0.22** | 0.12* | 0.06 | |||||||||
| Explicit bias | 0.23*** | 0.14* | 0.16* | 0.10 | |||||||||
| Racial resentment | -0.19** | -0.10* | -0.09 | -0.05 | |||||||||
| Opp. affirm. action | -0.23*** | -0.18** | -0.12 | -0.08 | |||||||||
| Res. segregation | -0.19** | -0.12* | -0.12 | -0.12 |
Table 1 reports a summary of our results. Each cell displays the estimated coefficient corresponding to the strength of the relationship between an MSA’s WEAT estimate and the outcome variable indicated by the row label. Each column corresponds to a set of covariates included in the model simultaneously. Asterisks denote levels of statistical significance.
In the first column labeled ‘No controls’, coefficients are equivalent to the bivariate Pearson correlation between WEAT estimates and the outcome. As can be seen, the WEAT estimates significantly correlate with each of the outcome measures, and each correlation is highly significant. Note, however, that the direction of the correlations with racial resentment, opposition to affirmative action, and residential segregation are all in the opposite direction of what one might initially expect (i.e., MSAs with higher survey-measured racial resentment show lower WEAT-measured anti-black bias).
The second column of Table 1 displays the same coefficient when controlling for an extensive list of standard controls at the MSA level, including census division dummies as well as proxies for socioeconomic status, average level of education, and rural/urban status. Even with these controls, the WEAT estimates strongly and significantly correlate with each of the five outcomes, suggesting robust relationships.
The third column summarizes the results of models that only control for percent of the MSA that identifies as black (and does not include the several covariates included under ‘Standard controls’). As can be seen in the table, in most cases the coefficient magnitude is reduced more when controlling for this one variable than when controlling for the several covariates included the previous column. However, the relationships between WEAT estimates and implicit bias as well as explicit bias remain statistically significant.
The fourth and final column of Table 1 shows the coefficient of the relationship between WEAT estimates and each outcome when controlling for relative black name frequency. As can be seen, none of the relationships attain statistical significance. This indicates that the WEAT estimates don’t contain significantly more information regarding the outcomes than the name frequencies alone.
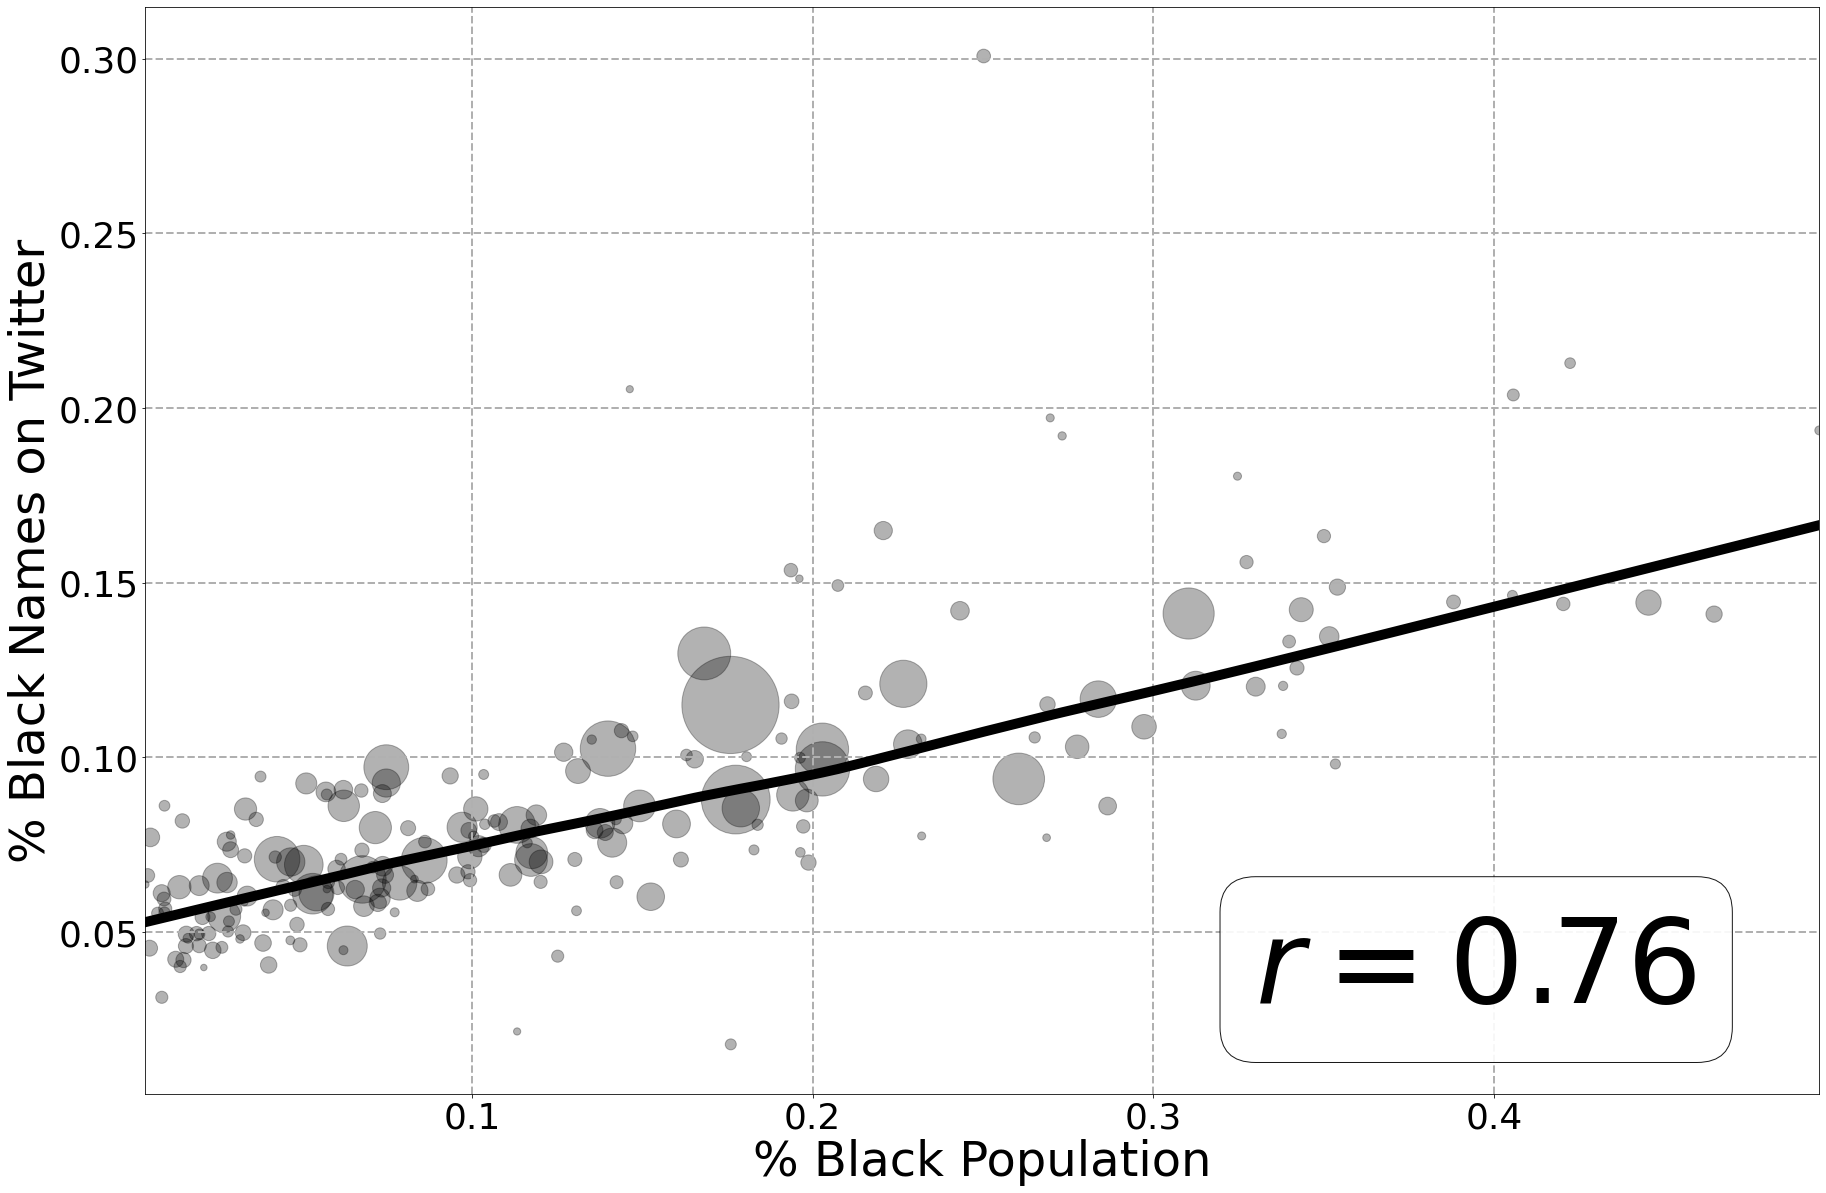
To unpack the difference between columns 3 and 4, see Figure 1, which shows that that the proportion of the population that identifies as black and the proportion of occurrences of uniquely black names in the WEAT are highly correlated (explaining over half of the variance). That is, Black names are used more in areas where Black Americans reside–and while controlling for % Black Population partially accounts for the association between the WEAT and Racial Animus Measures, it is really the relative occurrence of Black names that fully accounts for these associations.
Conclusion
Word embeddings are an undeniably powerful tool for the study of human language and cognition. A prominent article in the American Sociological Review has even said that they reveal the very “geometry of culture” (Kozlowski, Taddy, and Evans 2019). However, these models are also black-boxes; they seem to provide valuable information, but due to their complexity researchers cannot easily observe how they arrive at that information.
In this work, we showed that one potentially unintuitive aspect of word embeddings (their tendency to separate rare and common words in their estimated semantic space) can have unintended consequences for the study of human attitudes. Specifically, when estimating latent linguistic biases against social groups using the popular Word Embedding Association Test (WEAT), these models can conflate the relative frequency of words prototypical of the groups with positivity. This is especially problematic in our setting where we analyzed linguistic bias against groups with varying prevalences in the text-generating populations, which corresponds to a commensurate lack of representation in the Twitter data. In sum, this created spurious relationships between our estimates of linguistic bias and various experimental and survey-based measures of regional racial animus.
We were able to uncover this tendency by showing that these relationships vanished upon controlling for a single variable: the frequency of the words prototypical of the minority group relative to that same frequency for the majority group. While it’s relieving that we were able to find a simple way to alleviate this omitted variable bias, it’s worrisome that a different but fairly extensive set of controls did not sufficiently correct for it. This indicates that if other biases we don’t know about are also introduced by the use of word embeddings, we might not be able to rely on standard sociodemographic controls to fully address them.
The current work relies on the widely used Word2Vec model (Mikolov et al. 2013); future work may extend analysis to GloVe models (Pennington, Socher, and Manning 2014) and contextual embeddings models such as BERT (Devlin et al. 2018), as well as consider other measures of linguistic bias beyond the WEAT.
Our findings have important consequences for computational linguistics and computational social science. First and foremost, research using the WEAT in a way similar to how we do here should strongly consider either measuring and controlling for the relative frequency of the seed words used in the WEAT or estimating their word embeddings such that they are frequency-agnostic (Mu, Bhat, and Viswanath 2017; Gong et al. 2018). Second, other measures for assessing linguistic bias should be audited to uncover whether or not similar biases exist as in the WEAT. Finally, social scientists using word embeddings models should take heed: these models are complex and their validity has not been properly demonstrated. Careful study of these models with this goal in mind is necessary before they can truly be considered a measure of the “geometry of culture.”
References
- Antoniak and Mimno (2021) Antoniak, M.; and Mimno, D. 2021. Bad seeds: Evaluating lexical methods for bias measurement. In Proceedings of the 59th Annual Meeting of the Association for Computational Linguistics and the 11th International Joint Conference on Natural Language Processing (Volume 1: Long Papers), 1889–1904.
- Arora, Liang, and Ma (2017) Arora, S.; Liang, Y.; and Ma, T. 2017. A simple but tough-to-beat baseline for sentence embeddings. In International conference on learning representations.
- Arseniev-Koehler and Foster (2020) Arseniev-Koehler, A.; and Foster, J. G. 2020. Machine learning as a model for cultural learning: Teaching an algorithm what it means to be fat. arXiv preprint arXiv:2003.12133 .
- Ash, Chen, and Galletta (2021) Ash, E.; Chen, D. L.; and Galletta, S. 2021. Measuring Judicial Sentiment: Methods and Application to US Circuit Courts. Economica .
- Barman, Awekar, and Kothari (2019) Barman, M. P.; Awekar, A.; and Kothari, S. 2019. Decoding the style and bias of song lyrics. In Proceedings of the 42nd International ACM SIGIR Conference on Research and Development in Information Retrieval, 1165–1168.
- Caliskan, Bryson, and Narayanan (2017) Caliskan, A.; Bryson, J. J.; and Narayanan, A. 2017. Semantics derived automatically from language corpora contain human-like biases. Science 356(6334): 183–186.
- Devlin et al. (2018) Devlin, J.; Chang, M.-W.; Lee, K.; and Toutanova, K. 2018. Bert: Pre-training of deep bidirectional transformers for language understanding. arXiv preprint arXiv:1810.04805 .
- Dodds et al. (2015) Dodds, P. S.; Clark, E. M.; Desu, S.; Frank, M. R.; Reagan, A. J.; Williams, J. R.; Mitchell, L.; Harris, K. D.; Kloumann, I. M.; Bagrow, J. P.; et al. 2015. Human language reveals a universal positivity bias. Proceedings of the national academy of sciences 112(8): 2389–2394.
- Garg et al. (2018) Garg, N.; Schiebinger, L.; Jurafsky, D.; and Zou, J. 2018. Word embeddings quantify 100 years of gender and ethnic stereotypes. Proceedings of the National Academy of Sciences 115(16): E3635–E3644.
- Goldfarb-Tarrant et al. (2020) Goldfarb-Tarrant, S.; Marchant, R.; Sanchez, R. M.; Pandya, M.; and Lopez, A. 2020. Intrinsic bias metrics do not correlate with application bias. arXiv preprint arXiv:2012.15859 .
- Gong et al. (2018) Gong, C.; He, D.; Tan, X.; Qin, T.; Wang, L.; and Liu, T.-Y. 2018. Frage: Frequency-agnostic word representation. arXiv preprint arXiv:1809.06858 .
- Kinder, Sanders, and Sanders (1996) Kinder, D. R.; Sanders, L. M.; and Sanders, L. M. 1996. Divided by color: Racial politics and democratic ideals. University of Chicago Press.
- Knoche et al. (2019) Knoche, M.; Popović, R.; Lemmerich, F.; and Strohmaier, M. 2019. Identifying biases in politically biased wikis through word embeddings. In Proceedings of the 30th ACM conference on hypertext and social media, 253–257.
- Kozlowski, Taddy, and Evans (2019) Kozlowski, A. C.; Taddy, M.; and Evans, J. A. 2019. The geometry of culture: Analyzing the meanings of class through word embeddings. American Sociological Review 84(5): 905–949.
- Lewis and Lupyan (2020) Lewis, M.; and Lupyan, G. 2020. Gender stereotypes are reflected in the distributional structure of 25 languages. Nature human behaviour 4(10): 1021–1028.
- Mikolov et al. (2013) Mikolov, T.; Chen, K.; Corrado, G.; and Dean, J. 2013. Efficient estimation of word representations in vector space. arXiv preprint arXiv:1301.3781 .
- Mu, Bhat, and Viswanath (2017) Mu, J.; Bhat, S.; and Viswanath, P. 2017. All-but-the-top: Simple and effective postprocessing for word representations. arXiv preprint arXiv:1702.01417 .
- Nelson (2021) Nelson, L. K. 2021. Leveraging the alignment between machine learning and intersectionality: Using word embeddings to measure intersectional experiences of the nineteenth century US South. Poetics 101539.
- Pennington, Socher, and Manning (2014) Pennington, J.; Socher, R.; and Manning, C. D. 2014. Glove: Global vectors for word representation. In Proceedings of the 2014 conference on empirical methods in natural language processing (EMNLP), 1532–1543.
- Preotiuc-Pietro et al. (2012) Preotiuc-Pietro, D.; Samangooei, S.; Cohn, T.; Gibbins, N.; and Niranjan, M. 2012. Trendminer: An architecture for real time analysis of social media text. In In Proceedings of the 6th International AAAI Conference on Weblogs and Social Media, Workshop on Real-Time Analysis and Mining of Social Streams, ICWSM.
- Schwartz et al. (2013) Schwartz, H. A.; Eichstaedt, J. C.; Kern, M. L.; Dziurzynski, L.; Lucas, R. E.; Agrawal, M.; Park, G. J.; Lakshmikanth, S. K.; Jha, S.; Seligman, M. E. P.; and Ungar, L. H. 2013. Characterizing geographic variation in well-being using tweets. In Proceedings of the 7th International AAAI Conference on Weblogs and Social Media, ICWSM.
- Silva, Tambwekar, and Gombolay (2021) Silva, A.; Tambwekar, P.; and Gombolay, M. 2021. Towards a Comprehensive Understanding and Accurate Evaluation of Societal Biases in Pre-Trained Transformers. In Proceedings of the 2021 Conference of the North American Chapter of the Association for Computational Linguistics: Human Language Technologies, 2383–2389.
- Toney et al. (2021) Toney, A.; Pandey, A.; Guo, W.; Broniatowski, D.; and Caliskan, A. 2021. Automatically Characterizing Targeted Information Operations Through Biases Present in Discourse on Twitter. In 2021 IEEE 15th International Conference on Semantic Computing (ICSC), 82–83. IEEE.
- van Loon and Freese (in press) van Loon, A.; and Freese, J. in press. Word embeddings reveal how fundamental sentiments structure natural language. American Behavioral Scientist .
- van Loon et al. (2020) van Loon, A.; Stewart, S.; Waldon, B.; Lakshmikanth, S. K.; Shah, I.; Guntuku, S. C.; Sherman, G.; Zou, J.; and Eichstaedt, J. 2020. Explaining the ‘Trump Gap’in Social Distancing Using COVID Discourse. In Proceedings of the 1st Workshop on NLP for COVID-19 (Part 2) at EMNLP 2020.
- Wolfe and Caliskan (2021) Wolfe, R.; and Caliskan, A. 2021. Low Frequency Names Exhibit Bias and Overfitting in Contextualizing Language Models. arXiv preprint arXiv:2110.00672 .
- Xu, Nosek, and Greenwald (2014) Xu, K.; Nosek, B.; and Greenwald, A. 2014. Psychology data from the race implicit association test on the project implicit demo website. Journal of Open Psychology Data 2(1).