Intermittency analysis of collisions at 0.9, 7 and 8 TeV from the CMS experiment
Abstract
The method of horizontal scaled factorial moments as outlined by Bialas and Peschanski was used to conduct intermittency analysis for collisions at 0.9, 7 and 8 TeV from the CMS experiment. The data was obtained and processed from the CERN Open Data Portal. It was found from 1D analysis that the intermittency strength decreases with increasing energy, indicating that the signature of the -model of random cascading that the former is based on seems to be weakening. Intermittency was stronger in 2D, but did not reveal any clear trend with increasing collision energy.
1 Introduction
Motivated by the observations of spikes and voids in the (pseudo)rapidity distribution of some high energy events from JACEE [1] and NA22 [2]) in the late 1980s, Bialas and Peschanski [3, 4] established the context and laid the foundations for intermittency in multiparticle production, which would go on to engage high energy physicists for more than a decade. Based on the -model of turbulence [3], they proposed studying this phenomena by a measurement of the bin-averaged scaled factorial moments,
| (1) |
where is the bin-averaged moment, is the number of bins that the (pseudo)rapidity space is divided into (each with size ), is the multiplicity in bin , is the total event multiplicity and represents an average over events.
Equation 1 has come to be known as the horizontal moments111Other variants of the scaled factorial moments have been proposed as well, such as the vertical moments [3, 4], which have been found to give unstable results as the bin window decreases (e.g. ). Hence, they will not be used in this analysis.. The system is considered intermittent if we have
| (2) |
as . would manifest as the positive gradient of a straight line in a plot of vs , which reflects the power law relation between and in equation 1. been referred to in literature as the “intermittency exponent”, “intermittency index” or “slope parameter” and characterises the strength of intermittency [5, 6].
From its conceptual inception in 1986 up until the late 1990s, intermittency generated great excitement in the high energy physics community. A lot of work was done in its experimental measurements and theoretical studies (see [7] for a comprehensive review of the subject), and intermittency seemed to be a universal feature of multiparticle spectra [8]. However, further advances in this field were held up by the lack of data.
With the commissioning of the Large Hadron Collider at CERN in 2009 heralding a new era in TeV collider physics, it is of interest to check for the presence of intermittency at this new energy frontier. In this analysis, we expand on our earlier works [9, 10] by making an experimental measurement of the intermittency exponents in 1D and 2D for collisions at 0.9, 7 and 8 TeV.
2 About the data
This analysis is performed on Run 1 data from the CMS collaboration processed from the CMS Open Data Portal, covering centre-of-mass energies 0.9, 7 and 8 TeV. The analysis method follows largely that of CMS [11], which analysed minimum-bias (MinBias), non-single diffractive (NSD) multiplicity distributions.
NSD events were selected by requiring that at least one forward hadron (HF) calorimeter tower on each side of the detector have at least 3 GeV of energy deposited in the event. The primary vertex was chosen as the vertex with the highest number of associated tracks, which must also be within 15 cm of the reconstructed beamspot in the beam axis and be of good reconstruction quality (ndof 4).
Good quality tracks were selected by requiring them to carry the highPurity label. Furthermore, we select for tracks with 10% relative error on the transverse momentum () measurement () to reject low-quality and badly reconstructed tracks. Secondaries were removed by requiring a small impact parameter with respect to the selected primary vertex. Also, tracks were required to have MeV/c, which will be extrapolated to zero via unfolding.
Finally, unfolding was performed using an iterative “Bayesian unfolding method”, which is more accurately known as “D’Agostini iteration with early stopping” and described in [12]. This infers the original charged hadron multiplicity distribution (MinBias NSD) from the charged track multiplicity distribution measured.
3 Results
In analysing the intermittency data, it was found that excluding from the analysis results in a clearer intermittency signal (i.e. straight lines with clear positive gradient in the log-log plots). Thus, for each processed multiplicity distribution, was omitted and the rest of the data points were renormalised to unity. A possible explanation for this effect is the unnaturally high values of in the unfolded data for 7 and 8 TeV, which would greatly skew the scaling of the horizontal moments (equation 1).
We present our measurement results of the horizontal moments from Run 1 data from the CMS collaboration processed from the CMS Open Data Portal, covering centre-of-mass collision energies 0.9, 7 and 8 TeV. Data treatment has been kept uniform across the energies, so as to observe for trends that appear solely as a function of collision energy. The uncertainties of each data point have been computed and plotted; however, they are small as the partial systematic error analysis has resulted in underestimating the overall error.
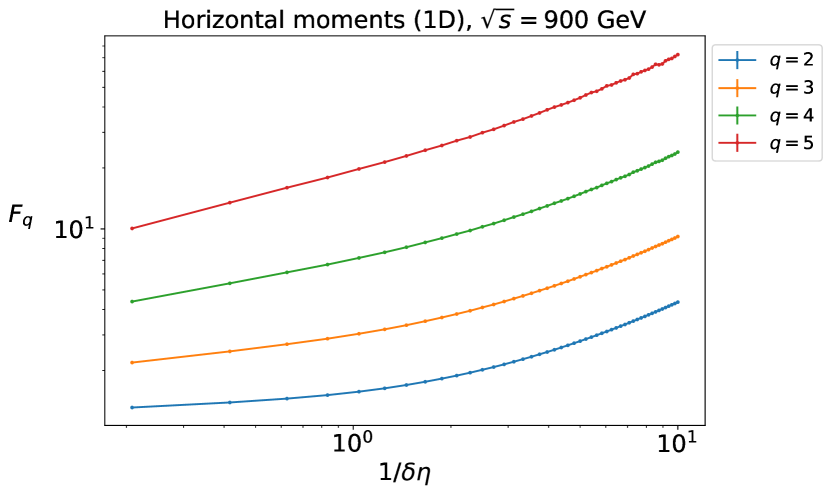
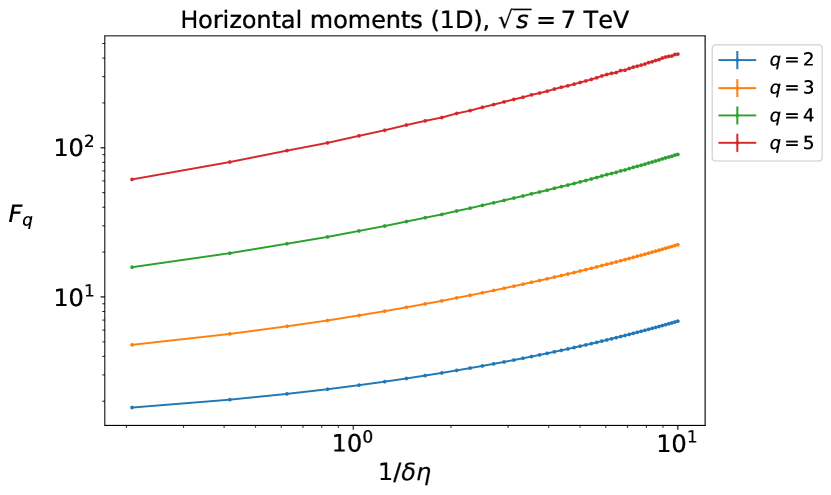
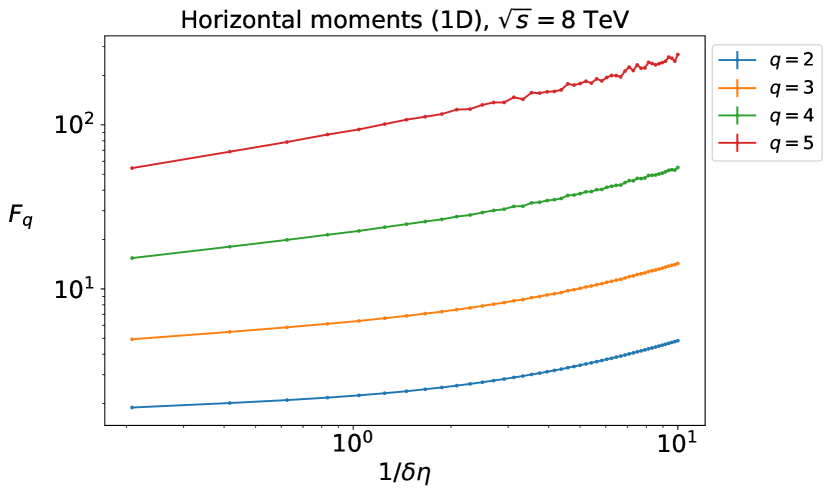
3.1 Intermittency in 1 dimension ()
Intermittency has traditionally been studied in the rapidity () variable. Here, pseudorapidity () will be used instead. In our analysis, we will partition the pseudorapidity space from to bins (and every integer in between), for 48 different partitions with the smallest pseudorapidity resolution at . Figure 1 shows the traditional log-log plots, while Table 1 presents the intermittency exponents experimentally obtained via linear regression on the 10 points corresponding to the smallest sizes.
| 900 GeV | 7 TeV | 8 TeV | |
|---|---|---|---|
| 2 | |||
| 3 | |||
| 4 | |||
| 5 |
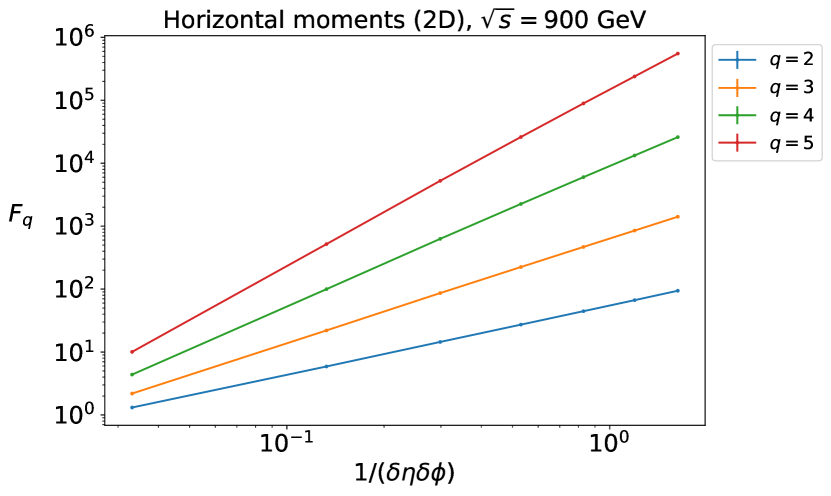
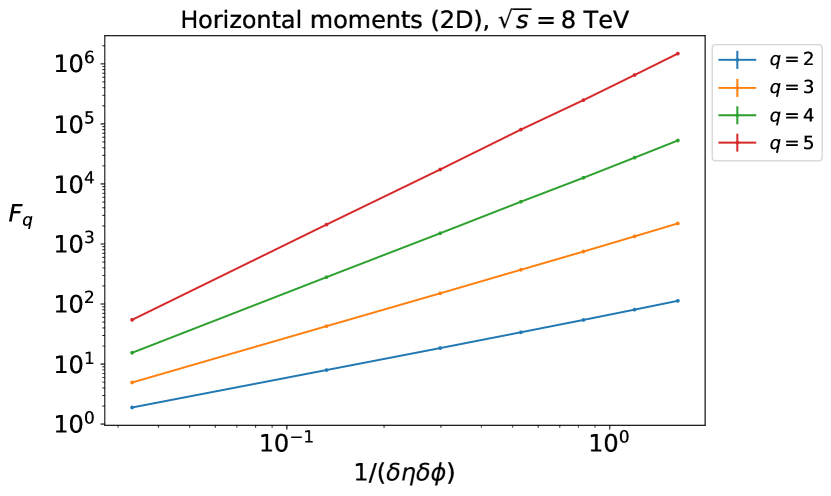
3.2 Intermittency in 2 dimensions (-)
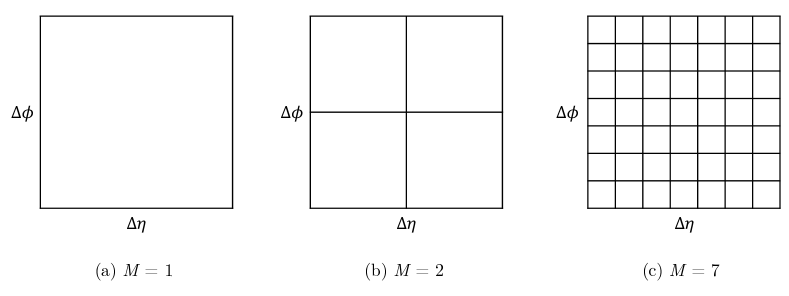
Intermittency in higher dimensions has also been extensively studied, for example by Ochs [13]. Here, we shall investigate intermittency in (-), which confers a natural geometric interpretation of the -model particles branching out in 3D-space. We adopt a simple partitioning scheme to carve up the (-) phase space, with to (and every integer in between): each value of divides each of the and space into equal widths, for a total of bins. The scheme is illustrated in Figure 2.
Figure 3 shows the traditional log-log plots, while Table 2 presents the intermittency exponents experimentally obtained via linear regression on the 5 points corresponding to the smallest sizes.

| 900 GeV | 7 TeV | 8 TeV | |
|---|---|---|---|
| 2 | |||
| 3 | |||
| 4 | |||
| 5 |
4 Discussion and conclusion
Table 1 shows that the intermittency strength in 1D decreases with increasing energy. This is a possible indication that the -model of multiparticle production is getting suppressed.
For the 2D case, Table 2 shows that the intermittency exponents for 2D have a greater magnitude than the 1D case, indicating a stronger intermittency signal. However, the trends with increasing energy is not observed, as the exponents rise slightly from 900 GeV to 7 TeV before a dropping quite significantly at 8 TeV. When compared to the results from 1D analysis, the 2D exponents for 7 TeV are most likely to be anomalous, and would require further investigation.
The results of this chapter strongly indicate that intermittency is still present in multiparticle production in collisions up to 8 TeV. This suggests that multiparticle production mechanisms, at energies up to the TeV scale, ought to have features such as self-similarity, scaling, correlations and branching.
Appendix A Datasets used
| Dataset | Ref. | |
| (TeV) | ||
| 0.9 | /MinimumBias/Commissioning10-07JunReReco_900GeV/RECO | [14] |
| 7 | /MinimumBias/Run2010A-Apr21ReReco-v1/AOD | [15] |
| 8 | /MinimumBias/Run2012B-22Jan2013-v1/AOD | [16] |
| Dataset | Ref. | |
| (TeV) | ||
| 0.9 | /MinBias_TuneZ2_900GeV_pythia6_cff_py | [17] |
| _GEN_SIM_START311_V2_Dec11_v2 | ||
| 7 | /MinBias_TuneZ2star_7TeV_pythia6/Summer12-LowPU2010 | [18] |
| _DR42-PU_S0_START42_V17B-v1/AODSIM | ||
| 8 | /MinBias_TuneZ2star_8TeV-pythia6/Summer12_DR53X-PU | [19] |
| _S10_START53_V7A-v1/AODSIM |
References
- [1] T. H. Burnett “Extremely High Multiplicities in High-Energy Nucleus Nucleus Collisions” In Phys. Rev. Lett. 50, 1983, pp. 2062–2065 DOI: 10.1103/PhysRevLett.50.2062
- [2] M. Adamus “Maximum Particle Densities in Rapidity Space of pi+ p, K+ p and p p Collisions at 250-GeV/c” In Phys. Lett. B 185, 1987, pp. 200–204 DOI: 10.1016/0370-2693(87)91554-1
- [3] A. Bialas and Robert B. Peschanski “Moments of Rapidity Distributions as a Measure of Short Range Fluctuations in High-Energy Collisions” In Nucl. Phys. B 273, 1986, pp. 703–718 DOI: 10.1016/0550-3213(86)90386-X
- [4] A. Bialas and Robert B. Peschanski “Intermittency in Multiparticle Production at High-Energy” In Nucl. Phys. B 308, 1988, pp. 857–867 DOI: 10.1016/0550-3213(88)90131-9
- [5] P. Lipa and B. Buschbeck “From strong to weak intermittency” In Phys. Lett. B 223, 1989, pp. 465–469 DOI: 10.1016/0370-2693(89)91634-1
- [6] L. K. Chen, A. H. Chan and C. K. Chew “Multifractality and high-energy multiparticle production” In Z. Phys. C 60, 1993, pp. 503–507 DOI: 10.1007/BF01560048
- [7] E. A. De Wolf, I. M. Dremin and W. Kittel “Scaling laws for density correlations and fluctuations in multiparticle dynamics” In Phys. Rept. 270, 1996, pp. 1–141 DOI: 10.1016/0370-1573(95)00069-0
- [8] A. Bialas “Four issues in correlations and fluctuations”, 1998 arXiv:hep-ph/9812457
- [9] Z. Ong et al. “Intermittency in pseudorapidity space of pp collisions at = 7 TeV” In EPJ Web Conf. 206, 2019, pp. 09004 DOI: 10.1051/epjconf/201920609004
- [10] Z. Ong et al. “Intermittency in collisions at 0.9, 7 and 8 TeV from the CMS collaboration” In 50th International Symposium on Multiparticle Dynamics, 2021 arXiv:2110.13087 [hep-ph]
- [11] Vardan Khachatryan “Charged Particle Multiplicities in Interactions at , 2.36, and 7 TeV” In JHEP 01, 2011, pp. 079 DOI: 10.1007/JHEP01(2011)079
- [12] G. D’Agostini “A Multidimensional unfolding method based on Bayes’ theorem” In Nucl. Instrum. Meth. A 362, 1995, pp. 487–498 DOI: 10.1016/0168-9002(95)00274-X
- [13] Wolfgang Ochs “Multidimensional intermittency analysis” In Z. Phys. C 50, 1991, pp. 339–344 DOI: 10.1007/BF01474088
-
[14]
CMS collaboration (2019)
“MinimumBias primary dataset in RECO format from the 0.9 TeV
Commissioning run of 2010
(/MinimumBias/Commissioning10-07JunReReco_900GeV/RECO). CERN Open Data
Portal.
DOI:10.7483/OPENDATA.CMS.1R58.OMBD” -
[15]
CMS collaboration (2019)
“MinimumBias primary dataset in AOD format from RunA of 2010
(/MinimumBias/Run2010A-Apr21ReReco-v1/AOD). CERN Open Data Portal.
DOI:10.7483/OPENDATA.CMS.6B3H.TR6Z” -
[16]
CMS collaboration (2017)
“MinimumBias primary dataset in AOD format from RunB of 2012
(/MinimumBias/Run2012B-22Jan2013-v1/AOD). CERN Open Data Portal.
DOI:10.7483/OPENDATA.CMS.HU6U.DRLD” -
[17]
CMS Collaboration (2019)
“Simulated dataset
MinBias_TuneZ2_900GeV_pythia6_cff_py_GEN_SIM_
START311_V2_Dec11_v2 in GEN-SIM-RECO format for 2010 commissioning data. CERN Open Data Portal.
DOI:10.7483/OPENDATA.CMS.JPB5.X7CN” -
[18]
CMS Collaboration (2018)
“Simulated dataset MinBias_TuneZ2star_7TeV_pythia6 in
AODSIM format for 2010 collision data. CERN Open Data Portal.
DOI:10.7483/OPENDATA.CMS.VTJ2.E5JN” -
[19]
CMS Collaboration (2021)
“Simulated dataset MinBias_TuneZ2star_8TeV-pythia6 in
AODSIM format for 2012 collision data. CERN Open Data Portal.
DOI:10.7483/OPENDATA.3GIM.7SPW”