Forward-backward multiplicity distribution with the Chou-Yang model for collisions at 0.9, 7 and 8 TeV from the CMS experiment
Abstract
A Chou-Yang type multiplicity distribution comprising a total multiplicity component and a binomial asymmetry component is used to describe charged hadron multiplicity data at 0.9, 7 and 8 TeV from the CMS experiment at CERN. The data was obtained and processed from the CERN Open Data Portal. For the total multiplicity component, it was found that a convex sum of a Negative Binomial Distribution (NBD) and a Furry-Yule Distribution (FYD) is able to describe the shoulder-like structure characteristic of KNO scaling violation well. The mean cluster size produced from collisions was also found to increase with collision energy. A prediction is given for collisions at 14 TeV.
1 Introduction
The Chou-Yang model was proposed by T.T. Chou and C.N. Yang in 1984 [1] to describe the forward-backward multiplicity distribution of high energy collisions. In their paper, they defined the variables
| (1) |
| (2) |
to describe an event with total multiplicity and forward-backward (FB) asymmetry respectively. and are the number of particles produced in the forward () and backward () regions. They found that the collision data at 540 GeV from the UA5 collaboration seemed to obey
| (3) |
which led them to postulate that the asymmetry parameter is governed by a binomial distribution. Hence, they proposed that the distribution be composed of two components – one to describe the production of charged particles, and another to describe (i.e. how they are distributed in the FB direction):
| (4) |
where is the KNO scaling function describing , is a combinatorial factor describing the binomial distribution of , and is factor that normalises the latter,
| (5) |
such that the overall probability distribution is normalised.
1.1 Proposed modification to the Chou-Yang Model: total multiplicity
Presently, it is well-established that the multiplicity distributions of collisions no longer obey KNO scaling [2] at UA5 energies and beyond. This led to several studies that replaced the KNO scaling function in with other analytic distributions. Lim et al. [3, 4] suggested replacing the KNO scaling function with the Negative Binomial Distribution (NBD, equation 6), and Lai et al. [5] and Phang et al. [6] developed the approach further by replacing the NBD with the Generalised Multiplicity Distribution (GMD, equation 7):
| (6) |
| (7) |
where is the Gamma function, which generalises the arguments of the combinatorial prefactors of the NBD and GMD from positive integers to positive real numbers. Thus, we now have
| (8) |
where is either or .
The GMD is defined for values of such that . This mathematical requirement might severely constraint the overall ability of to describe the data, since it would cause several bins in to be empty. Hence, we propose using a constructed from a convex sum of the two limiting forms of the GMD (which becomes the NBD when , and the FYD when ), so that all values of can be described:
| (9) |
where .
1.2 Mean cluster size
Lim et al. [3, 4] considered the prospect that the factor ‘2’ in equation 5 could take on other numbers. They replaced it with , which results in a reinterpretation of the original binomial model: the original particles are first grouped into clusters, each of which then gets distributed in according to the modified Chou-Yang scheme. This has come to be known as the “cluster model”; thus, in Chou and Yang’s original paper [1], we have clusters for the special case of collisions at 540 GeV from UA5.
2 Investigation at LHC energies
We wish to make two measurements. The first is to investigate how our proposed NBD-FYD distribution (equation 9) is able to describe the collision data, and if it is able to offer some physical insight into the multiparticle production process.
The second measurement concerns the asymmetry part of the generalised version of the Chou-Yang model,
| (12) |
Specifically, we wish to find out how varies with collision energy in the CMS Run 1 data. This will be obtained by extracting the 2-dimensional probability distribution from data, plotting vs. , and performing linear regression to obtain in equation 11.
3 About the data
This analysis is performed on Run 1 data from the CMS collaboration processed from the CMS Open Data Portal, covering centre-of-mass energies 0.9, 7 and 8 TeV. The analysis method follows largely that of CMS [7], which analysed minimum-bias (MinBias), non-single diffractive (NSD) multiplicity distributions.
NSD events were selected by requiring that at least one forward hadron (HF) calorimeter tower on each side of the detector have at least 3 GeV of energy deposited in the event. The primary vertex was chosen as the vertex with the highest number of associated tracks, which must also be within 15 cm of the reconstructed beamspot in the beam axis and be of good reconstruction quality (ndof 4).
Good quality tracks were selected by requiring them to carry the highPurity label. Furthermore, we select for tracks with 10% relative error on the transverse momentum () measurement () to reject low-quality and badly reconstructed tracks. Secondaries were removed by requiring a small impact parameter with respect to the selected primary vertex. Also, tracks were required to have MeV/c, which will be extrapolated to zero via unfolding.
Finally, unfolding was performed using an iterative “Bayesian unfolding method”, which is more accurately known as “D’Agostini iteration with early stopping” and described in [8]. This infers the original charged hadron multiplicity distribution (MinBias NSD) from the charged track multiplicity distribution measured.
4 Results and discussion
4.1 Multiplicity component
| 900 GeV | 7 TeV | 8 TeV | |
| /d.o.f. | 60.55 | 11.44 | 13.76 |
-
•
Note: The large number of decimal figures for for 900 GeV and 7 TeV are the optimiser’s attempts to generate as large a real number below 5 and 4 respectively, so as not to sacrifice one data point from the FYD component (which is defined only for ).
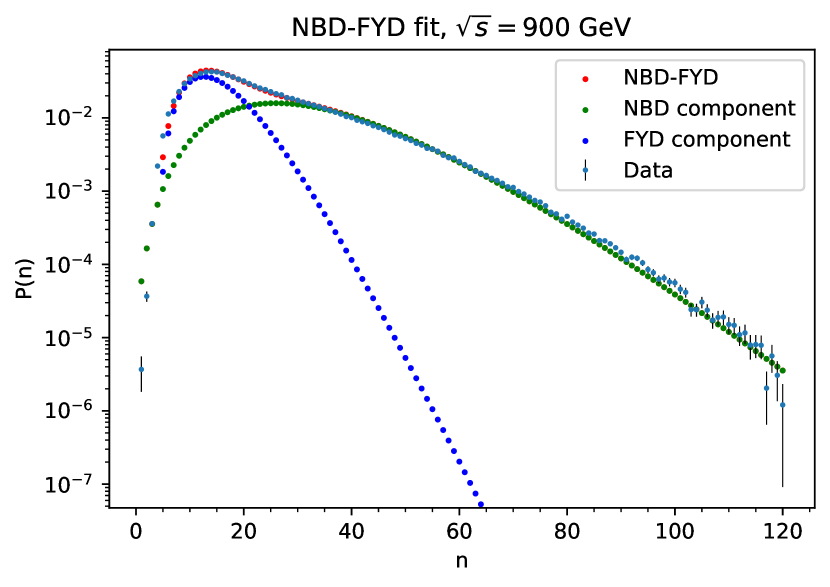
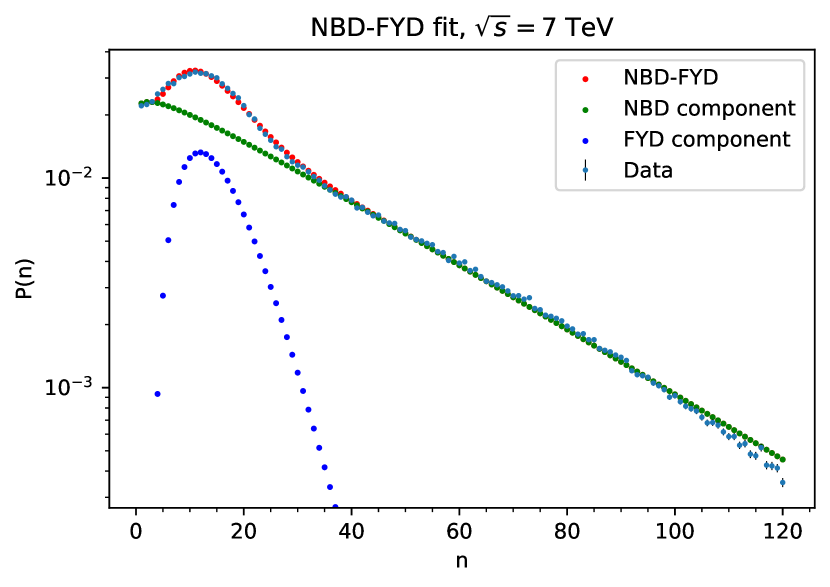
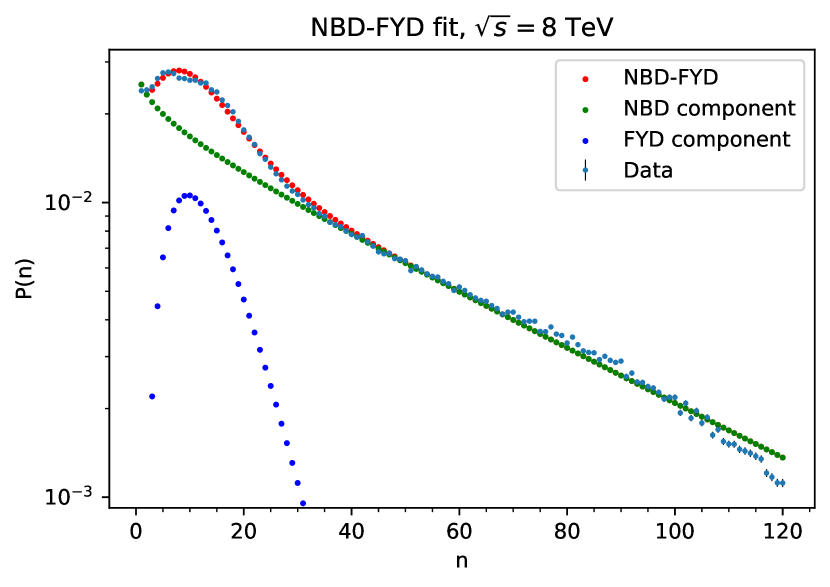
Table 1 summarises the best-fit parameters found for the NBD-FYD model in describing the data, and Figure 1 shows the collision data, the fitted NBD-FYD model and its constituent NBD and FYD components. In optimising the parameters, only data points within were used; was excluded from the fitting due to the high values of which are not described by the model, while data points at suffered from low statistics and were not smooth, which would interfere adversely with the optimisation process. The values are much greater than unity due to the small magnitudes of the errors (due to underestimating the systematic errors). However, it can be ascertained visually that the model describes the data very well. Most importantly, the model is able to describe the shoulder-like structure (from KNO scaling violation) of the data.
It is interesting to note the manner in which the NBD-FYD model brings about the shoulder-like structure. The NBD component (green dots in Figure 1) provides the general overall downward-sloping profile, and the FYD component (blue dots) provides the protruding “head”, which also defines the “shoulder”. As increases, the FYD component becomes narrower to manifest a more pronounced change in gradient (i.e. a more pronounced shoulder-like structure). This narrowing is brought about by an increase in and a decrease in . It is also worth noting that remains relatively constant at all values of .
Interpretation of NBD-FYD model
The above findings raise an issue of interpretation that is potentially incompatible with the GMD. Chan and Chew’s analysis [9] showed that as collision energies increase towards the TeV scale, the GMD will approach the FYD (via decreasing and increasing ), indicating significant contribution from gluon branching. The NBD-FYD model proposed here seems to suggest the opposite, with a diminishing FYD component. While the NBD-FYD model describes the data excellently, it seems to be incompatible with the GMD’s notion of quark and gluon branching from the NBD and FYD components respectively.
It is useful to reconsider the origins of the NBD and FYD. As Hwa pointed out [10], these are particular solutions to the basic evolution equation
| (13) |
which has been adapted to describe the evolution of the multiplicity distribution , with as the QCD evolution parameter. The coefficient is proportional to “creation” processes, which describes birth, emission, fragmentation or branching in the context of multiparticle production. is proportional to “annihilation” processes, which describes death, absorption, recombination or decay [10].
In this framework, the NBD is the solution to the evolution equation describing birth, death and immigration processes, having coefficients of the form , . The FYD is the solution describing only birth processes, having coefficients of the form , .
When considered with the results in Table 1, the NBD-FYD model paints a physical picture of an increasingly complex mode of multiparticle production. At lower energies, multiparticle production mainly involves pure-birth processes, as described by the FYD; at higher energies, additional death and immigration processes come into play, as described by the NBD.
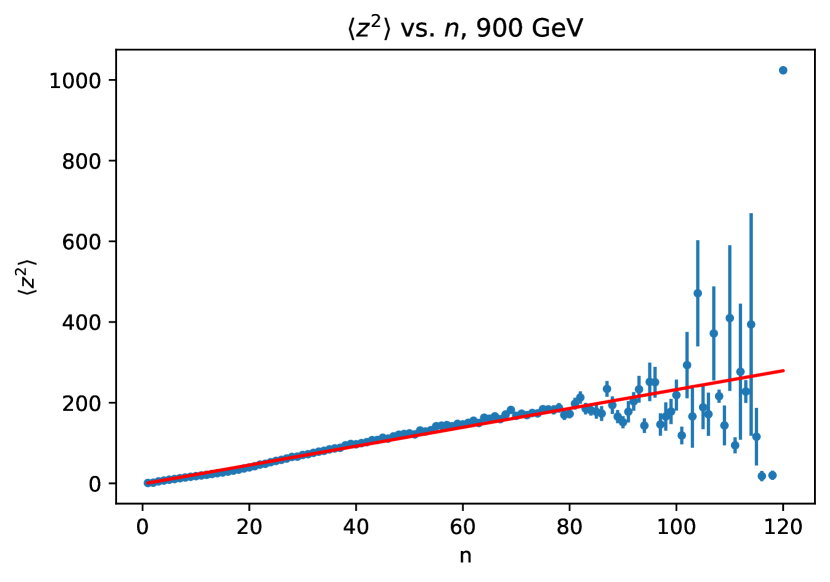
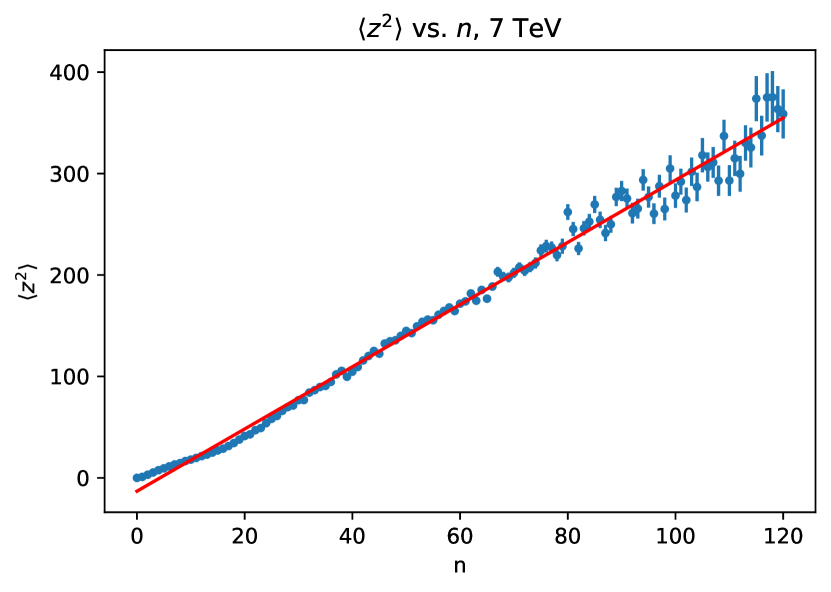
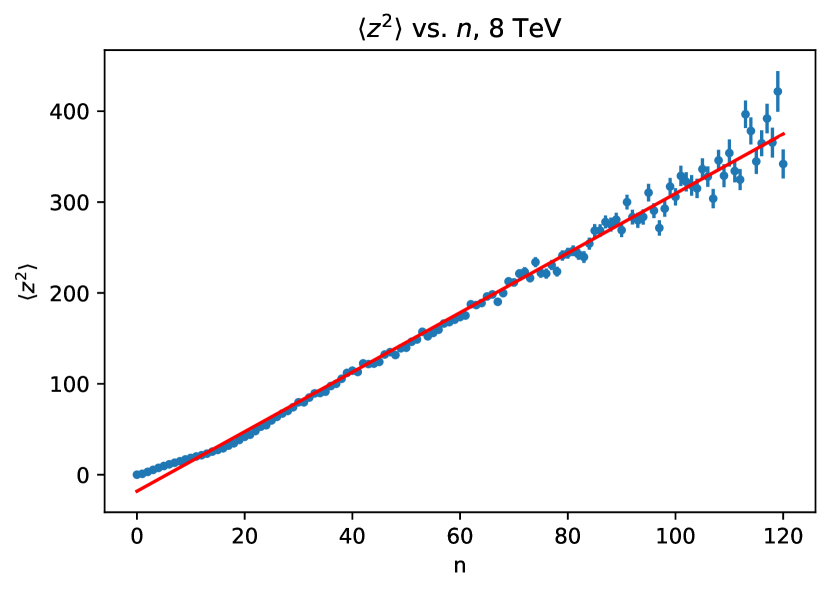
4.2 FB component
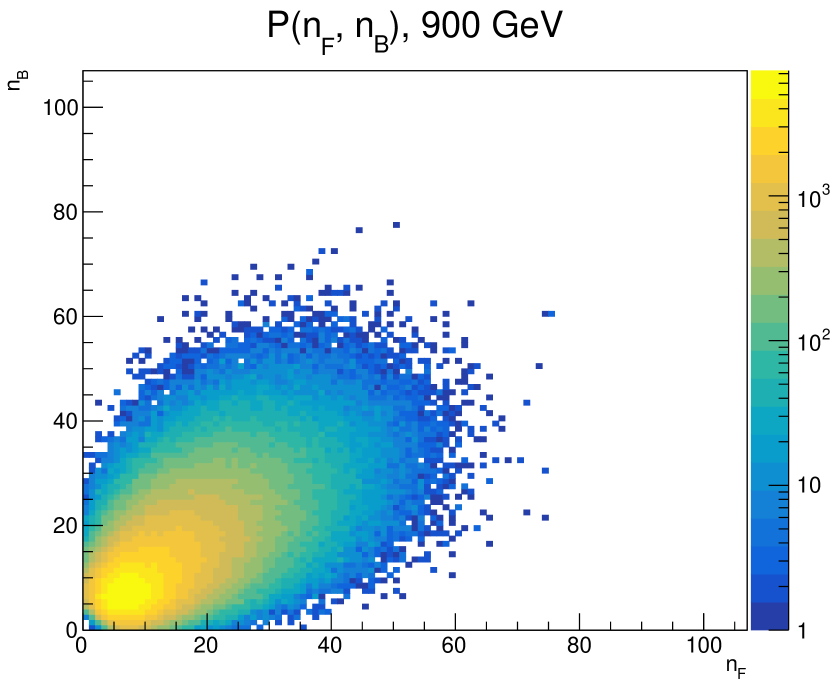
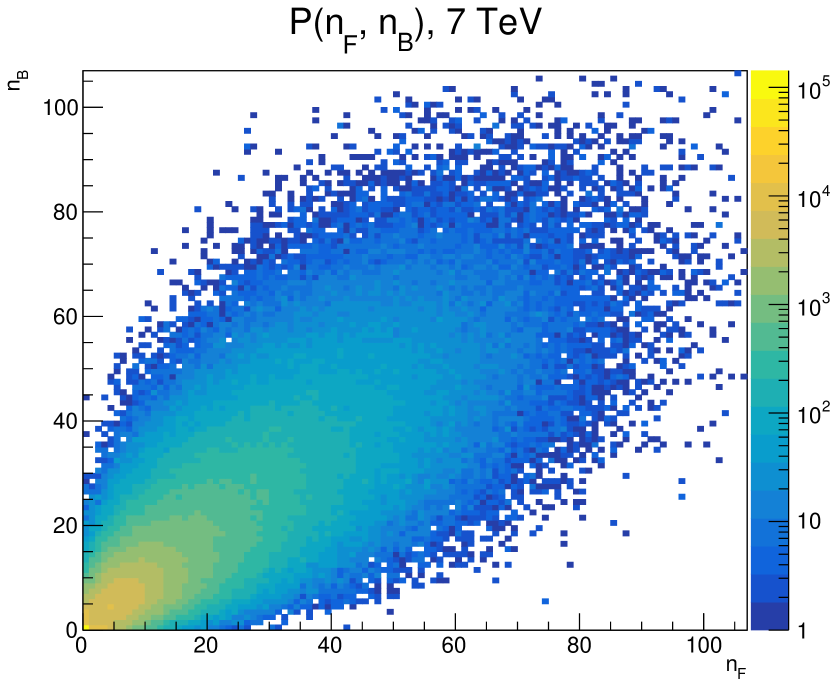

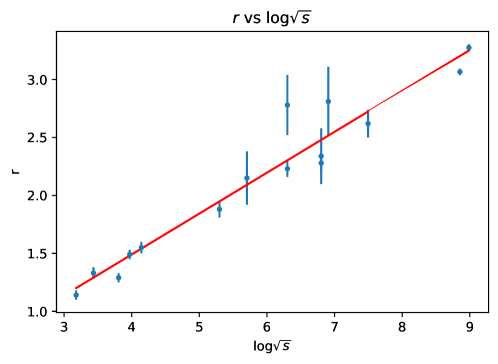
Figure 2 shows the unfolded (and unnormalised) 2D multiplicity distribution plots of the data111The maximum values of and were restricted to 107 due to the memory limitations (in computer RAM) of the ROOT system. This will affect the computation of high values of total multiplicity due to truncation effects.. From this, vs. can be computed, and the results are shown in Figure 3. The values of obtained from the data are summarised in Table 2 and compiled alongside results from previous studies. Figure 4 shows how varies with collision energy for hadronic collisions. The increase in seems to follow the relation [5]
| (14) |
with and .
| Collaboration | Source | ||
|---|---|---|---|
| ISR () | 24 | [3] | |
| 31 | |||
| 45 | |||
| 53 | |||
| 63 | |||
| UA5 () | 200 | [3] | |
| 546 | |||
| 900 | |||
| E735 () | 300 | [11] | |
| 546 | |||
| 1000 | |||
| 1800 | |||
| CMS () | 900 | (New measurement) | |
| 7000 | |||
| 8000 |
5 Conclusion
We presented a model that describes the multiplicity distribution as a convex sum of a Furry-Yule Distribution (FYD) and a Negative Binomial Distribution (NBD). It was found to describe data well. The FYD component diminishes with increasing energy while the NBD component becomes more prominent, the latter suggesting an increase in complexity of multiparticle production with death and immigration processes starting to emerge.
An increase in mean cluster size has also been observed in hadronic collisions from 24 GeV to 8 TeV. The increase in seems to follow the relation , with and . Based on this, we predict that we would have at 14 TeV, and we look forward to analysing 14 TeV data when it becomes available.
Acknowledgements
The authors would like to thank Prof Kati Lassila-Perini from the Data Preservation and Open Access project in the CMS experiment at CERN for help with the 8 TeV Monte Carlo dataset. This work is supported by the NUS Research Scholarship.
Appendix A Datasets used
| Dataset | Ref. | |
| (TeV) | ||
| 0.9 | /MinimumBias/Commissioning10-07JunReReco_900GeV/RECO | [12] |
| 7 | /MinimumBias/Run2010A-Apr21ReReco-v1/AOD | [13] |
| 8 | /MinimumBias/Run2012B-22Jan2013-v1/AOD | [14] |
| Dataset | Ref. | |
| (TeV) | ||
| 0.9 | /MinBias_TuneZ2_900GeV_pythia6_cff_py | [15] |
| _GEN_SIM_START311_V2_Dec11_v2 | ||
| 7 | /MinBias_TuneZ2star_7TeV_pythia6/Summer12-LowPU2010 | [16] |
| _DR42-PU_S0_START42_V17B-v1/AODSIM | ||
| 8 | /MinBias_TuneZ2star_8TeV-pythia6/Summer12_DR53X-PU | [17] |
| _S10_START53_V7A-v1/AODSIM |
References
- [1] T. T. Chou and Chen Ning Yang “Binomial Distribution for the Charge Asymmetry Parameter” In Phys. Lett. B 135, 1984, pp. 175–178 DOI: 10.1016/0370-2693(84)90478-7
- [2] G. J. Alner “Scaling Violations in Multiplicity Distributions at 200 GeV and 900 GeV” In Phys. Lett. B 167, 1986, pp. 476–480 DOI: 10.1016/0370-2693(86)91304-3
- [3] S. L. Lim, Y. K. Lim, C. H. Oh and K. K. Phua “Forward-backward multiplicity correlation in high energy hadron-hadron collisions” In Z. Phys. C 43, 1989, pp. 621 DOI: 10.1007/BF01550941
- [4] S. L. Lim, C. H. Oh and K. K. Phua “The forward-backward multiplicity correlations, the single hemisphere multiplicity distributions and the mean cluster size in high-energy and hadron-hadron collisions” In Z. Phys. C 54, 1992, pp. 107–114 DOI: 10.1007/BF01881713
- [5] W. C. Lai, A. H. Chan and C. H. Oh “Chou-Yang multiplicity correlations in high energy multiparticle production and LHC prediction” In Int. J. Mod. Phys. A 24, 2009, pp. 3552–3560 DOI: 10.1142/S0217751X09047181
- [6] S. W. Phang et al. “Chou-Yang Model for Forward-Backward Multiplicity Correlations at 7 TeV using Generalized Multiplicity Distribution.” In EPJ Web Conf. 206, 2019, pp. 09005 DOI: 10.1051/epjconf/201920609005
- [7] Vardan Khachatryan “Charged Particle Multiplicities in Interactions at , 2.36, and 7 TeV” In JHEP 01, 2011, pp. 079 DOI: 10.1007/JHEP01(2011)079
- [8] G. D’Agostini “A Multidimensional unfolding method based on Bayes’ theorem” In Nucl. Instrum. Meth. A 362, 1995, pp. 487–498 DOI: 10.1016/0168-9002(95)00274-X
- [9] A. H. Chan and C. K. Chew “Parton branching model for collisions” In Phys. Rev. D 41, 1990, pp. 851–862 DOI: 10.1103/PhysRevD.41.851
- [10] Rudolph C. Hwa “Branching Processes in Multiparticle Production” In Adv. Ser. Direct. High Energy Phys. 2, 1988, pp. 556–613 DOI: 10.1142/9789814503259˙0014
- [11] T. Alexopoulos “Charged particle multiplicity correlations in collisions at 0.3-1.8 TeV” In Phys. Lett. B 353, 1995, pp. 155–160 DOI: 10.1016/0370-2693(95)00554-X
- [12] CMS collaboration (2019) “MinimumBias primary dataset in RECO format from the 0.9 TeV Commissioning run of 2010 (/MinimumBias/Commissioning10-07JunReReco_900GeV/RECO). CERN Open Data Portal.” DOI: DOI:10.7483/OPENDATA.CMS.1R58.OMBD
-
[13]
CMS collaboration (2019)
“MinimumBias primary dataset in AOD format from RunA of
2010
(/MinimumBias/Run2010A-Apr21ReReco-v1/AOD). CERN Open Data Portal.” DOI: DOI:10.7483/OPENDATA.CMS.6B3H.TR6Z -
[14]
CMS collaboration (2017)
“MinimumBias primary dataset in AOD format from RunB of
2012
(/MinimumBias/Run2012B-22Jan2013-v1/AOD). CERN Open Data Portal.” DOI: DOI:10.7483/OPENDATA.CMS.HU6U.DRLD -
[15]
CMS Collaboration (2019)
“Simulated dataset
MinBias_TuneZ2_900GeV_pythia6_cff_py_GEN_SIM_START311_V2_Dec11_v2 in GEN-SIM-RECO format for 2010 commissioning data. CERN Open Data Portal.” DOI: DOI:10.7483/OPENDATA.CMS.JPB5.X7CN - [16] CMS Collaboration (2018) “Simulated dataset MinBias_TuneZ2star_7TeV_pythia6 in AODSIM format for 2010 collision data. CERN Open Data Portal.” DOI: DOI:10.7483/OPENDATA.CMS.VTJ2.E5JN
- [17] CMS Collaboration (2021) “Simulated dataset MinBias_TuneZ2star_8TeV-pythia6 in AODSIM format for 2012 collision data. CERN Open Data Portal.” DOI: DOI:10.7483/OPENDATA.3GIM.7SPW