Gas condensation in Brightest Group Galaxies unveiled with MUSE.
The origin of the cold gas in central galaxies in groups is still a matter of debate. We present Multi-Unit Spectroscopic Explorer (MUSE) observations of 18 optically selected local (0.017) Brightest Group Galaxies (BGGs) to study the kinematics and distribution of the optical emission-line gas. MUSE observations reveal a distribution of gas morphologies including ten complex networks of filaments extending up to 10 kpc to two compact (3 kpc) and five extended (5 kpc) disk-dominated structures. Some rotating disks show rings and elongated structures arising from the central disk. The kinematics of the stellar component is mainly rotation-dominated, which is very different from the disturbed kinematics and distribution found in the filamentary sources. The ionized gas is kinematically decoupled from the stellar component for most systems, suggesting an external origin for the gas. We find also that the H luminosity correlates with the cold molecular gas mass. By exploring the thermodynamical properties of the X-ray atmospheres, we find that the filamentary structures and compact disks are found in systems with small central entropy values, , and ratios. This suggests that, like for Brightest Cluster Galaxies (BCGs) in cool core clusters, the ionized filaments and the cold gas associated are likely formed from hot halo gas condensations via thermal instabilities, consistently with the Chaotic Cold Accretion simulations (as shown via the C-ratio, , and k-plot). We note that the presence of gaseous rotating disks is more frequent than in BCGs. An explanation for the origin of the gas in those objects is a contribution to gas fueling by wet-mergers or group satellites, as qualitatively hinted by some sources of the present sample. Nonetheless, we discuss the possibility that some extended disks could also be a transition stage in an evolutionary sequence including filaments, extended disks and compact disks, as described by hot gas condensation models of cooling flows.
Key Words.:
Galaxies: groups: intracluster medium – Galaxies: groups: general1 Introduction
Elliptical galaxies, particularly those sitting at the core of galaxy clusters, were thought to be red and dead, lacking cold gas reservoirs and containing mainly old stars. Notwithstanding, in the last decade, new surveys have dramatically changed this picture with the arrival of state of the art telescopes. In particular, studies of the nearby Universe have found that many elliptical galaxies can harbor a complex multiphase medium, containing a reservoir of cold molecular () gas traced by CO emission lines (e.g., Edge, 2001; Salomé & Combes, 2003; Lim et al., 2008; Temi et al., 2018; Tremblay et al., 2018; Olivares et al., 2019; Russell et al., 2019; Rose et al., 2019, 2020), warm (103 K) molecular hydrogen (e.g., Edge et al., 2002), a warm ionized (104 K) gas traced mainly through optical H+[NII] emission lines (e.g., Heckman et al., 1989; Hatch et al., 2007; Werner et al., 2014; McDonald et al., 2010, 2012; Hamer et al., 2016), OVI emitting gas (105.5 K, e.g., Bregman et al. 2005), and a very hot ( K) atmosphere (Sun et al., 2009; O’Sullivan et al., 2001; Su et al., 2015; Gaspari et al., 2019; Werner et al., 2019). However, the origin of the cold gas is a matter of discussion.
Most of the studies related to the origin of the cold gas have focused principally on the most massive and brightest elliptical galaxies located at the core of galaxy clusters, so-called brightest cluster galaxies. Observations of the ionized gas in galaxy clusters, traced with the H emission line, show spectacular filamentary structures extending up to 70 kpc from the core of the central galaxy (e.g., Heckman et al., 1989; Hatch et al., 2007; McDonald et al., 2010, 2011b; Hamer et al., 2016, 2018; Tremblay et al., 2018; Olivares et al., 2019; Ciocan et al., 2021). Systems with nebular emission, cold molecular gas, and ongoing star formation are preferentially found in galaxy clusters with short central cooling times, 1 Gyr and low central entropy values, 30 keV cm2 (e.g., Cavagnolo et al., 2008; Bildfell et al., 2008; Pipino et al., 2009; Rafferty et al., 2008a; Pulido et al., 2018; Loubser et al., 2016). These correlations have been interpreted as an indication of ICM cooling, with the gas becoming thermally unstable and condensing to form multiphase filaments (e.g., Gaspari et al., 2012; Prasad et al., 2015; Voit et al., 2017; Beckmann et al., 2019; Li et al., 2020). Early theoretical studies suggested that the ICM condenses when the cooling time over the free-fall time, , is below 10 (e.g., Sharma et al., 2012; McCourt et al., 2012; Li & Bryan, 2014; Prasad et al., 2015). Other simulations and analytical studies predict the onset of condensation when is between 5–20, as an outcome of precipitation-regulated feedback (e.g., Gaspari et al., 2012; Prasad et al., 2018, 2020; Voit et al., 2017; Beckmann et al., 2019). In a similar vein, simulations by Gaspari et al. (2018) predict that the ICM condenses through turbulent non-linear instabilities triggered by the AGN feedback when the cooling time over the eddy-turnover time is close to unity, generating extended H nebulae (see also Prasad et al. 2018). On the other hand, some studies have proposed that filaments form out of the low-entropy gas lifted by AGN bubbles (e.g., Revaz et al., 2008; Pope et al., 2010; Li & Bryan, 2014; McNamara et al., 2016). Furthermore, simulations carried out by Qiu et al. (2019, 2020) show that multiphase filaments can form from warm AGN-driven outflows when the cooling time is shorter than rising timescales. In particular, the condensed multiphase gas plays an essential role in the self-regulation of the central Super Massive Black Hole (SMBH), in particular by feeding and triggering the AGN via Chaotic Cold Accretion (CCA, Gaspari et al. 2013, 2020 for a review; see also Pizzolato & Soker 2005 and King & Pringle 2006 for related papers but different modeling).
While a consensus has emerged that cold gas in BCGs forms through the hot atmosphere’s cooling, less attention has been paid to the lower-mass counterparts, galaxy groups (see Oppenheimer et al. 2021 for a recent review). Some galaxy groups show remarkable similarities to galaxy clusters. Many of them are observed to possess a hot intragroup medium (IGrM) (e.g., Dong et al., 2010; O’Sullivan et al., 2018), that cools through X-ray emission in a similar form to the ICM in galaxy clusters. Of galaxy groups in the local Universe with detected IGrM, about 80% of them have a central temperature decline indicating a rapid radiative cooling (Dong et al., 2010; O’Sullivan et al., 2017).
Some of the brightest X-ray galaxy groups have short central cooling times, H emitting gas, and cold molecular clouds around their central galaxies (e.g., Werner et al., 2014; David et al., 2014, 2017; Temi et al., 2018; Schellenberger et al., 2020), similar to what is found within the massive BCGs. In particular, Werner et al. (2014) presented H+[NII] imaging of warm ionized gas of 8 BGGs, using narrow-band imaging from the Southern Astrophysical Research (SOAR) telescope. These observations reveal extended filamentary emission-line nebulae in some sources, suggesting that the cold gas is produced by cooling from the hot phase, but disks, rings, and compact gas distribution are also present. In the case of a galaxy merger (or interaction) event, a fraction of the gas is likely to evade the shock process and fall to the center of the galaxy, often producing a central disk or rings (Mazzuca et al., 2006; Eliche-Moral et al., 2010), but can also form gaseous streams of low entropy gas (see Poole et al. 2006). An internal origin for the cold gas has also been suggested, through the cooling of material injected from the stellar population (stellar-mass loss, Davis et al. 2011; Voit & Donahue 2011; Bregman & Parriott 2009).
Recently, O’Sullivan et al. (2015, 2018) reported molecular gas detection in 36/53 central group galaxies from the Complete Local Volume Groups Sample (CLoGS, O’Sullivan et al. 2017), using Institut de Radioastronomie Millimetrique (IRAM) 30m and Atacama Pathfinder Experiment telescope (APEX) observations. CLoGS111http://www.sr.bham.ac.uk/~ejos/CLoGS.html is a statistically complete optically-selected survey of 53 nearby (D80 Mpc) galaxy groups, observed in X-ray, optical, and radio wavebands. The CLoGS survey provides comprehensive coverage of the galaxy groups to study the origin of the cold gas in BGGs. Our goal here, is to determine the optical emitting gas properties of these central group galaxies to explore the origin and life-cycle of the cold material. Additionally, galaxy groups are a critical and diverse environment to study the life-cycle of gas, and a great laboratory to investigate turbulence, non-gravitational and environmental processes, such as AGN-feedback, stellar feedback, and mergers, due to the group’s shallower gravitational potential and the smaller separation between galaxy members (Sun et al., 2009).
In this paper, we present optical observations of 18 BGGs, which are part of the CLoGS, with the MUSE instrument on the Very Large Telescope (VLT). The present paper focuses on the distribution and kinematics of the ionized gas. A dedicated analysis of the line ratios, the excitation of the gas, and and chemical abundances will be presented in a future paper. This paper is laid out as follows. In section 2 we present the description of the sample. In Section 3, the MUSE observations and data analysis are described. The description of the distribution and kinematics of gas and stars is presented in Section 4. The origin of the warm ionized gas and a possible evolution sequence is discussed in Section 5. Finally, the conclusions are summarized in Section 6.
Throughout this paper, we assume a standard cosmology with H0=70 km s-1 Mpc-1, and =0.3.
2 Sample
To investigate the various properties and nature of the optical line-emitting gas in nearby BGGs, we observed with MUSE 18 sources drawn from the 26-member CLoGS high-richness sub-sample (R222Richness (R) is defined as the number of galaxies within the group with B-band luminosity log LB 10.2 (O’Sullivan et al., 2017).4-8) (O’Sullivan et al., 2015, 2017, 2018). The CLoGS sample consists of 53 galaxy groups selected via friends-of-friends and hierarchical clustering algorithms from the LEDA (Lyon-Meudon Extragalactic Database; Garcia 1993) galaxy catalog (Makarov et al., 2014). Worth noting that the groups were chosen to own an elliptical as a group-dominant galaxy. The CLoGS provides an ideal sample in which to study the origin of the gas within lower-mass systems. For the interested reader, a detailed description of the CLoGS sample selection criteria can be found in O’Sullivan et al. (2017). In terms of stellar velocity dispersion (a proxy for gravitational potential), the MUSE sources show no significant difference from the other CLoGS group dominant galaxies in the high or low-richness sub-samples. Table LABEL:tab:sample2 and Table LABEL:tab:prop_multiwave, summarize the MUSE observations and the main properties for each target, respectively.
Our MUSE sample spans a wide range of stellar masses, SFRs, X-ray and radio properties. The stellar masses span a factor of approximately 5, from 41010 to 261010 M⊙, With NGC 1060 being the most luminous, and NGC 584 the dimmest. For comparison, BCGs have typical stellar masses higher than 1011 M⊙. The stellar masses were determined using a mass-to-light ratio model, and using galaxy colors from SDSS ugriz and 2MASS (2 Micron All Sky Survey) JHK magnitudes (O’Sullivan et al., 2018).
Optical emission line narrow-band spectroscopy had already been carried out for a couple of sources (NGC 584, NGC 5846, NGC 7619), by using narrow-band filter centered on the H+[NII] emission lines from New Technology Telescope (NTT) (Macchetto et al., 1996). The authors identify different morphologies from compact up to filamentary as we also found in galaxy clusters. The observations reveal H+[NII] luminosities of 18–401039 erg s-1. Detection of warm ionized gas through H+[NII] imaging and spectroscopy has been presented only in one source of our MUSE sample (NGC 5846), using SOAR observations (Werner et al., 2014). The SOAR observations show optical emission concentrated in the innermost 1.5 kpc of the galaxy, but the distribution of the gas is filamentary, with some sign of interaction with the central AGN.
Based on their central cooling time classification presented by Hudson et al. (2010) some groups have either weak-cool-core (WCC), or strong-cool-core (SCC) (O’Sullivan et al., 2017). Galaxy groups have lower central temperature than galaxy clusters, and given that emission lines are more effective at radiating away thermal emission at 1 keV than the continuum, that leads to shorter central cooling times in galaxy groups. In O’Sullivan et al. (2017) has been discussed an alternative approach to classifying groups in cool-core (CC) and non-cool-core (NCC) based on the temperature profiles of the X-ray emitting gas, although adiabatic heating can flatten the temperature profiles. O’Sullivan et al. (2017) found that NCC and CC groups have nearly identical entropy and profiles. In addition, the amplitude of the entropy profiles are almost 10 times higher than the self-similar values inside R500, indicating that the entropy may highly affected by AGN and SN feedback, cooling, and star formation (Oppenheimer et al., 2021).
Extended X-ray emission (65 kpc) with luminosities ( 1041 erg s-1) and temperatures typical of group-scale haloes are seen in a few of our sources. Some other systems have an X-ray distribution with galaxy-scale sizes of 10–65 kpc with X-ray luminosities on the order of 1040 erg s-1, or a point-like appearance (with an extension smaller than the XMM PSF). In these groups, a variety of X-ray morphologies are observed, including galaxy mergers (e.g., NGC 1060 and NGC 7619), and one sloshing-disturbed system (NGC 5846). In a few cases, disturbances in the X-ray emitting gas are suspected to be caused by a central radio AGN (NGC 193, NGC 4261; O’Sullivan et al. 2017). See Table LABEL:tab:prop_multiwave for more details on each source.
Radio-jets have been identified in some sources of our MUSE sample, with a range of physical scale, 10–80 kpc, and radio power, 1020 to 1024 W Hz -1, using the VLA and the GMRT, at 1.4 GHz, 610 and 235 MHz (Kolokythas et al., 2018). However, most of the sources lack radio jets. Instead, the radio emission show a diffuse or point-like distribution.
Several sources have confirmed molecular gas detection through CO(1-0) and CO(2-1) emission lines using IRAM 30m and APEX observations. Those observations reveal a broad range of molecular gas masses of 107 up to 109 M⊙ (O’Sullivan et al., 2015, 2018), a few orders of magnitude lower than it is usually found in the BCGs (1010–1011 M⊙; Edge 2001; Salomé & Combes 2003). From double-horned HI and CO profiles, O’Sullivan et al. (2018) reported that some sources (e.g., NGC 924, NGC 940 and ESO 507-25) likely host molecular disks. ALMA observations of one of our targets, NGC 5846 (Temi et al., 2018), reveals 105 M⊙ of giant molecular clouds associated with some filaments and dust structures.
Our sources also have very low SFRs, 0.01–5 M yr-1 (SFR=LFIR/(5.8109 M⊙); Kennicutt 1998). The SFRs were derived from FIR-based observations with The Infrared Astronomical Satellite (IRAS) or Spitzer Space Telescope (Spitzer). They also present short depletion times 1 Gyr (=5.8 Mmol/LFIR Gyr) indicating a fast replenishment of their gas reservoirs (O’Sullivan et al., 2015, 2018).
| Group | BGG | Scale | Exp. time | Seeing | G. | H info | Emission lines | ||||
|---|---|---|---|---|---|---|---|---|---|---|---|
| (kpc/) | (s) | () | Type | detected | |||||||
| (1) | (2) | (3) | (4) | (5) | (6) | (7) | (8) | (9) | (10) | (11) | (12) |
| LGG 9 | NGC 193 | 0.014723 | 0.359 | 3900 | 1.98 | 00:39:18.6 | 03:19:52 | 7 | E | Emission | H, [NII], [OIII], H, [SII] |
| LGG 18 | NGC 410 | 0.017659 | 0.373 | 3900 | 1.10 | 01:10:58.9 | 33:09:07 | 6 | E2 | Emission | H, [NII], [OIII], H, [SII] |
| LGG 27 | NGC 584 | 0.006011 | 0.121 | 3900 | 1.59 | 01:31:20.7 | 06:52:05 | 4 | S0 | Abs/Emis | H, [NII], [OIII], H, [SII] |
| LGG 31 | NGC 677 | 0.017012 | 0.378 | 3900 | 0.65 | 01:49:14.0 | 13:03:19 | 7 | E3 | Emission | H, [NII], [OIII], H, [SII], [OI] |
| LGG 42 | NGC 777 | 0.016728 | 0.354 | 3900 | 0.86 | 02:00:14.9 | 31:25:46 | 5 | E1 | Abs/Emis | H, [NII] |
| LGG 58 | NGC 940 | 0.017075 | 0.359 | 3900 | 0.77 | 02:29:27.5 | 31:38:27 | 3 | S0 | Abs/Emis | H, [NII], [OIII], H, [SII] |
| LGG 61 | NGC 924 | 0.014880 | 0.310 | 3900 | 0.73 | 02:26:46.8 | 20:29:51 | 3 | S0 | Emission | H, [NII], [OIII], H, [SII], [OI] |
| LGG 66 | NGC 978 | 0.015794 | 0.334 | 3900 | 1.16 | 02:34:47.6 | 32:50:37 | 7 | E/S0 | Abs/Emis | H, [NII], [OIII], H, [SII], [OI] |
| LGG 72 | NGC 1060 | 0.017312 | 0.368 | 3900 | 0.43 | 02:43:15.0 | 32:25:30 | 8 | E/S0 | Abs/Emis | H, [NII], [OIII], [SII] |
| LGG 103 | NGC 1453 | 0.012962 | 0.305 | 3900 | 0.80 | 03:46:27.2 | 03:58:08 | 4 | E3 | Emission | H, [NII], [OIII], H, [SII], [OI] |
| LGG 117 | NGC 1587 | 0.012322 | 0.247 | 3900 | 0.97 | 04:30:39.9 | 00:39:42 | 4 | E1 | Abs/Emis | H, [NII], [OIII], H, [SII], [OI] |
| LGG 262 | NGC 4008 | 0.012075 | 0.262 | 3900 | 0.79 | 11:58:17.0 | 28:11:33 | 4 | E5 | Abs/Emis | H, [NII], H |
| LGG 276 | NGC 4169 | 0.012622 | 0.218 | 3900 | 0.68 | 12:12:18.8 | 29:10:46 | 4 | S0a | Emission | H, [NII], [OIII], H, [SII], [OI] |
| LGG 278 | NGC 4261 | 0.007378 | 0.155 | 3880 | 0.78 | 12:19:23.2 | 05:49:31 | 7 | E2 | Emission | H, [NII], [OIII], H, [SII], [OI] |
| LGG 393 | NGC 5846 | 0.005711 | 0.126 | 7880 | 0.90 | 15:06:29.3 | 01:36:20 | 5 | E0 | Emission | H, [NII], [OIII], H, [SII], [OI] |
| LGG 421 | NGC 6658 | 0.014243 | 0.305 | 3870 | 1.82 | 18:33:55.6 | 22:53:18 | 4 | E2 | Absorption | – |
| LGG 473 | NGC 7619 | 0.012549 | 0.262 | 3870 | 0.47 | 23:20:14.5 | 08:12:22 | 8 | E3 | Abs/Emis | H, [NII], [SII], [OI] |
| LGG 310 | ESO 507-25 | 0.010788 | 0.218 | 3900 | 1.90 | 12:51:31.8 | 26:27:07 | 4 | S0 | Emission | H, [NII], [OIII], H, [SII], [OI] |
| BGG | M(H2) | log(M⋆) | SFR | CCT | min() | Core type | Tsys | K0 | K10 | R500 | M500 | Radio | LLS | X-ray | Notes | ||
|---|---|---|---|---|---|---|---|---|---|---|---|---|---|---|---|---|---|
| (108 M⊙) | (M⊙) | (M⊙ yr-1) | (Gyr) | T profile | Hudson | (keV) | (keV cm-2) | (keV cm-2) | (kpc) | (1013 M⊙) | (kpc) | ||||||
| (1) | (2) | (3) | (4) | (5) | (6) | (7) | (8) | (9) | (10) | (11) | (12) | (13) | (14) | (15) | (16) | (17) | (18) |
| NGC 193 | ¡1.35 | 10.92 | – | – | – | – | CC | – | 0.88 | 11.31 | 24.3 | 432 | 2.33 | JET | 80 | GRP | shock |
| NGC 410 | ¡1.17 | 11.37 | – | 0.102 | 18.2 | 0.5 | CC | SCC | 0.980.02 | 4.50 | 34.5 | 458 | 2.78 | pnt | 11 | GRP | |
| NGC 584 | ¡0.11 | 10.62 | 0.024 | – | – | – | – | – | – | ¡270.62 | ¿272.7 | – | – | pnt | 3 | – | |
| NGC 677 | ¡2.25 | 10.91 | – | 2.042 | 47.9 | 1.69 | CC | WCC | 0.790.01 | 5.82 | 31.9 | 406 | 1.94 | diffuse | 30 | GRP | |
| NGC 777 | ¡2.08 | 11.32 | 0.014 | 0.314 | 39.2 | 1.0 | NCC | SCC | 0.890.02 | 23.84 | 34.8 | 434 | 2.37 | pnt | 8 | GRP | |
| NGC 924 | 0.520.10 | 10.76 | 0.545 | – | – | – | – | – | – | ¡403.08 | ¿406.1 | – | – | pnt | 4 | – | |
| NGC 940 | 61.02.15 | 10.94 | 2.0 | – | – | – | – | – | 0.41 | ¡548.74 | ¿552.9 | 282 | 0.65 | pnt | 6 | pnt | |
| NGC 978 | ¡0.70 | 11.08 | 0.157 | 1.421 | 80.6* | – | (NCC) | WCC | 0.49 | 7.29 | 23.6 | 312 | 0.87 | pnt | 3 | gal | |
| NGC 1060 | ¡0.78 | 11.42 | 5.6 | 0.132 | 10.4 | 0.6 | CC | SCC | 1.020.01 | 11.20 | 41.8 | 468 | 2.97 | jet | 14 | GRP | merger |
| NGC 1453 | ¡0.78 | 11.16 | 0.217 | 0.390 | 64.4 | 1.6 | NCC | SCC | 0.740.03 | 14.08 | 40.4 | 392 | 1.74 | pnt | 11 | GRP | |
| NGC 1587 | 2.300.48 | 11.01 | – | 0.101 | 31.6* | 0.5 | NCC | SCC | 0.37 | 1.22 | 15.3 | 267 | 0.55 | diffuse | 22 | GRP | |
| NGC 4008 | ¡0.73 | 10.90 | 0.128 | 0.199 | 16.9* | 0.7 | (NCC) | SCC | 0.56 | 9.98 | 20.5 | 336 | 1.09 | pnt | 7 | gal | |
| NGC 4169 | 1.440.34 | 10.89 | 4.972 | – | – | – | – | – | 0.71 | ¡744.33 | ¿750.0 | 384 | 1.63 | pnt | 3 | pnt | |
| NGC 4261 | 0.1120.005⋆ | 11.05 | 0.034 | 0.097 | 15.0 | 1.2 | CC | SCC | 1.36 | 3.91 | 39.1 | 552 | 4.83 | JET | 80 | GRP | |
| NGC 5846 | 0.140.06 | 10.83 | 0.019 | 0.138 | 14.7 | 0.8 | CC | SCC | 0.950.01 | 7.07 | 25.6 | 452 | 2.65 | jet | 12 | GRP | sloshing |
| NGC 6658 | ¡0.71 | 10.76 | – | – | – | – | – | – | 0.29 | ¡586.82 | ¿591.3 | 233 | 0.36 | – | – | pnt | |
| NGC 7619 | ¡0.33 | 11.21 | 0.255 | 0.135 | 24.5 | 0.7 | CC | SCC | 1.000.01 | 6.62 | 36.4 | 464 | 2.88 | pnt | 6 | GRP | merger |
| ESO 507-25 | 4.230.56 | 10.95 | 0.497 | – | – | – | – | – | – | ¡331.42 | ¿333.9 | – | – | diffuse | 11 | – | |
(2) Molecular gas mass from single-dish IRAM and APEX observations (O’Sullivan et al., 2015, 2018). From ALMA observations (Boizelle et al., 2021).
(3) Stellar mass (O’Sullivan et al., 2005, 2018). (4) Star formation rate (O’Sullivan et al., 2005, 2018).
(5) Central cooling time at 10 kpc. (6). min tcool/tff values. Systems where no deprojected profile was available are marked with an asterisk and were calculated at 10 kpc (O’Sullivan et al., 2017).
(7) Values of tcool/teddy, where tcool is measure at 10 kpc (O’Sullivan et al., 2017). The eddy turn-over timescale, teddy, has been measured following Olivares et al. (2019).
(8) and (9) Type core indicates the classification of groups as cool-core/non-cool-core based on their temperature profiles, and based on the classification of Hudson et al. (2010) as strong (SCC), weak (WCC), and non-cool-core (NCC). Taken from O’Sullivan et al. (2017). Entries in brackets indicate systems where only a projected temperature profile with 3 bins is available.
(10) System temperature O’Sullivan et al. (2017).
(11) Entropy measured at 1 kpc based on X-ray profiles from O’Sullivan et al. (2017).
(12) Entropy measured at 10 kpc O’Sullivan et al. (2017).
(13) R500 refer to the radii at which the cluster mass density is 500 times the critical density of the universe.
(14) Total mass within R500.
(15) Radio morphology from Kolokythas et al. (2018). The physical scale of the radio emission moves from few kpcs with an (i) point-like (pnt) radio source with sizes 11 kpc, (ii) diffuse emission (diffuse) with no clear jet or lobe structure, (iii) small-scale (20 kpc) jets (jet) confined within the stellar body of the host galaxy, and (iv) large-scale (20 kpc) jets (JET) extending beyond the host galaxy and into the IGrM.
(16) The largest linear size (LLS) of the radio source, taken from Kolokythas et al. (2018).
(17) X-ray morphology classification and notes from O’Sullivan et al. (2017). For systems where thermal emission was detected, we classified the extent of the gas halo as either group-like (GRP) (extent 65 kpc), galaxy-like (Gal) (extent 10-65 kpc) or point-like (point) (unresolved, extent smaller than the XMM PSF). Although somewhat arbitrary, these classifications give a simple picture of the scale of the emission.
(18) X-ray features.
3 MUSE Observations and Analysis
The observations of the central group galaxies were obtained using the MUSE instrument during period 97 (097.A-0366(A) program; PI: S. Hamer) between April and July of 2016. The MUSE IFU on the ESO VLT is a large-FOV (1 1) optical (0.46–0.93 m) instrument with a resolving power of R3,000 at the center of the band. Two BGGs of 097.A-0366(A) program were not observed, NGC 2563 and NGC 1167, and will not be discussed in this work. The observations were carried out in the wide-field mode (WFM) of the instrument, which provided a spatial sampling of 0.2 over a FOV that was 11 arcmin. The observations consisted of four pointings. Three of 870s to 900s, were positioned at the center of each galaxy group, and a fourth targeted a nearby empty region for 120s to provide an accurate measure of the sky spectrum, uncontaminated by emission lines from the central galaxy. The observations were taken with seeing in the range of 0.5 to 1.9. See Table LABEL:tab:sample2 for more details for each source.
The data were reduced using the MUSE data reduction pipeline (version 2.6) provided by the ESO with the individual recipes executed from the European Southern Observatory Recipe Execution Tool (ESOREX v.3.13.1) command-line interface. After combining the science frames, the sky subtraction was done using the ZAP (version 2.1; Soto et al. 2016), a high precision sky subtraction tool. We included a sky-cube in order to improve the process in addition to the sky subtraction of the MUSE pipeline.
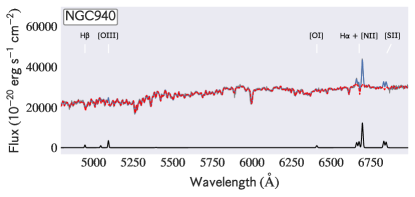
The data were corrected for galactic extinction using an O’Donnell extinction curve (O’Donnell, 1994) and the dust maps of Schlegel et al. (1998). The continuum and nebular emission were fitted simultaneously, using the Platefit code555http://userpages.planetefl.fr/flamareille/galaxie/, described in Tremonti et al. (2004). The MUSE coverage extends to 9,300 Å, but we have fitted and truncated it at 7,500 Å. Within this range, the important optical emission lines remain. In a few sources with weak optical emission lines but a strong continuum, the Balmer absorption features from the stellar atmospheres dominate over the emission lines, making it challenging to accurately fit the Balmer emission features. Those sources were labeled as Absorption in Table LABEL:tab:sample2. In such cases, the H line often appears very weak or even completely absent from some parts of the cube, usually at the central position of the galaxy (see Fig. 1 for an example), where the continuum is strong. Therefore, for the purpose of this work, we present the [NII]6583 as a reliable tracer of the ionized gas distribution for all the sources. To tackle this issue, a stellar model was reproduced using the latest version of the pPXF (Penalized Pixel-Fitting) code (Cappellari, 2017), taking stellar templates from the Indo-US spectral library, with Teff 3000-30000 K and [Fe/H]3–1 (Valdes et al., 2004), and fitting continuum and nebular emission, simultaneously. We chose this library because of its spectral resolution of 1.35Å. The fit of the emission lines was carried out by using Gaussians in velocity space to an adjustable list of lines (e.g., H, [NII]6548, [OI]6300, [OIII]5003, H, [SII]6717, and [SII]6732). All Forbidden and Balmer emission lines were tied to have the same velocity and velocity dispersion.
3.1 Stellar Kinematics
To extract the stellar kinematics from the MUSE spectrum, we used the pPXF code, fitting the observed spectra with the stellar population templates from the Indo-US spectral library, as described above. Then we performed the fit to spatially binned spectra based on S/N ratio (with a minimum S/N of 50), with the Voronoi tessellation techniques in the line-free stellar continuum (Cappellari & Copin, 2003). This allows us to derive for each Voronoi bin a rotational velocity and velocity dispersion estimate. The final maps of the kinematics of the stellar component are presented in Section 4 for each source. Note that all the MUSE velocity maps shown in this paper are projected at a zero-point set to the stellar systemic velocity of each source. This one is measured through the different absorption features (such as the sodium D absorptions, NaD 5895.9 and NaD 5889.9), that trace the galaxy’s stellar component by taking the median value of all spaxels.
3.2 Double Velocity Components
We note that some sources revealed the presence of second velocity components, with double optical emission lines per spaxel. Some examples of those components are the off-nuclear region seen in NGC 940 and ESO 507-25 (see Fig. 28 for some examples of the integrated spectra over those regions). Our fitting procedure was performed with a single-gaussian per spaxel per optical emission line and tied to have the same velocity and velocity dispersion. Consequently, some of the optical emission coming from the second velocity components was lost from our fitting procedure. To quantify the flux coming from those components, we created a residual map by subtracting the H integrated emission-line map from the observed continuum-subtracted cube to the fitted cube. Then we measured the residual flux coming from the pixels with a high 3-5 S/N. The second component is a small fraction of the first one. We found that although 25–75% of the total flux originates from the areas in which a second component is observed, the flux of the second component makes up only a small fraction (2-4%) of the total flux of each source. Double components thus remain rare and represent a very small fraction of the total emission. Therefore, we do not discuss the double-components here and leave them for a future study. An interesting value is the velocity shift between the two components 200 – 350 km s-1 and 300 km s-1 depending on the source. We suspect that those double components trace scattered gas threads aligned along the line of sight but with different orientations. Similar findings have been reported in a few cool-core clusters of galaxies, like Abell 1664 (Russell et al., 2013, 2019; Olivares et al., 2019). Hamer et al. (2016) also found nine multiple velocity component sources within the sample of 73 BCGs/BGGs using VIMOS observations.
4 Results
4.1 Stellar Distribution and Kinematics
Extended Rotating Disks
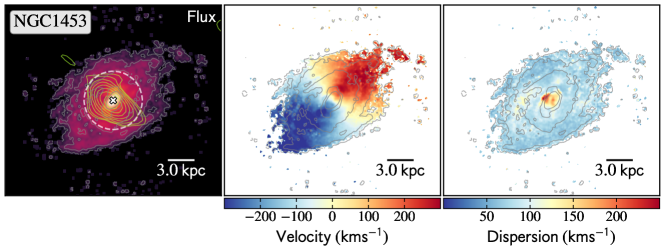

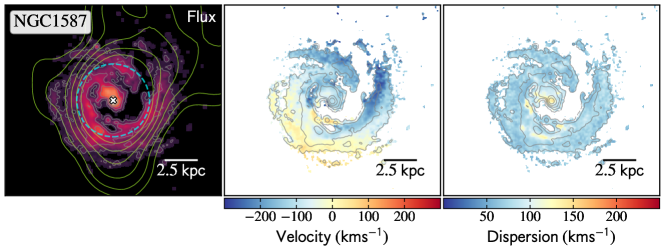
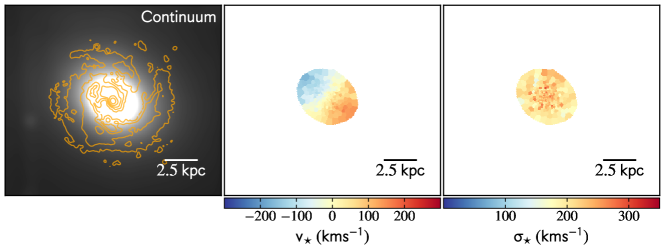
Maps of the spectral fitting to the MUSE data cubes for the sample. The first row, from left to right the panels are: 1) The [NII]6583 flux map in logarithmic scale, overlaid by GMRT 610 MHz contours in green from Kolokythas et al. (2018), 2) the line of sight velocity profile of the optical emission lines, 3) the velocity dispersion of the emission lines, overlying [NII]6583 contours in gray. The second row from left to right the panels are: 1) MUSE continuum image, overlaid by [NII]6583 contours in orange, 2) stellar velocity, and 3) stellar velocity dispersion. All sources names are indicated at the top of the first panel of the first row. The 30m beam size from IRAM and APEX observations has been added in white when the sources were non-detected, and in cyan when the molecular gas was detected. North is up and east is left.
Compact Rotating Disks


Extended Filaments
Compact Filaments
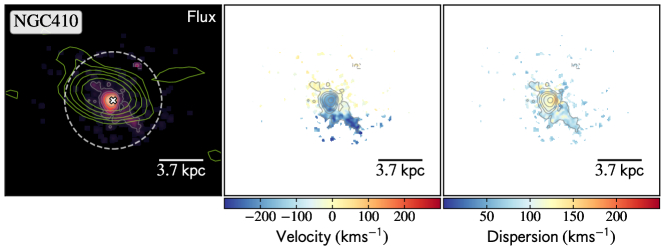

In figures 2 and 19 we present the distribution of the optical emitting gas traced by [NII]6584 emission line (first panel from the left), line of sight velocity (second panel), and velocity dispersion (third panel) maps on the top row. On the bottom row, we show the stellar continuum (first panel from the left), Voronoi-binned MUSE map of the stellar line of sight velocity (second panel) and velocity dispersion (third panel) for each source in our sample. Only Voronoi-binned spaxels with S/N50 are shown.
The optical continuum images from our MUSE observations unveil an extensive variety of morphologies, a large range of sizes, and shapes for our systems. The galaxies have been classified as E0, E1, E2, E3, E5, S0, and S0a (de Vaucouleurs et al., 1991). Table LABEL:tab:sample2 lists the galaxy type for each source. The stellar velocity fields reveal that most of the sources in our sample (10/18 sources, e.g., NGC 940, NGC 924, NGC 1453, NGC 4169, NGC 978, NGC 584, NGC 1587, NGC 4008, NGC 7619 and NGC 6658) show a clear large-scale rotation pattern in their stellar light. In the case of ESO 507-25, the stellar map reveals a non-regular rotation patter. Another 3 sources exhibit weaker signatures of stellar rotation (NGC 777, NGC 677, and NGC 4261) in their stellar velocity fields. In particular, NGC 4261 has a prolate morphology with rotation around its major axis (e.g., Davies & Birkinshaw, 1986). The detail of the stellar kinematics and angular momentum analysis will be discussed in separate paper (Loubser et al. in prep).
Contrary to the random motions of the stellar component in BCGs (e.g., Hamer et al., 2016), the kinematics of the stellar component lack clear net stellar rotation in only 4 sources of the sample (NGC 193, NGC 410, NGC 1060, and NGC 5846). Particularly in NGC 5846, there is a very weak hint of coherent stellar rotation in the inner region of the galaxy (West approaching, East receding), as well as in NGC 410 (Northwest receding, and Southeast approaching).
For the rotating stellar disk sources, we notice a large range of projected stellar velocities, from 40 km s-1 up to 350 km s-1, and the stellar velocity dispersion of 80 km s-1 up to 450 km s-1. Interestingly, we found that the stellar dispersion maps in a few sources with clear stellar rotation (such as NGC 940, NGC 924, NGC 4169 and NGC 584) exhibit a deeper decrease at large radii. For those systems, the stellar velocity dispersion displays a peak towards the galaxy center, with values of 180 up to 250 km s-1, while decreasing rapidly at larger radii, reaching velocity dispersions below 100 km s-1. For the case of NGC 924 and NGC 584, spatially resolved long-slit spectroscopy found consistent results (steep negative velocity dispersion gradient, see Loubser et al. 2018). Nonetheless, the stellar velocity dispersion map is more homogeneous for most sources, with a shallower radial dispersion decrease. Loubser et al. (2018) also compare the stellar properties of the high- and low-richness CLoGs sub-samples of BGGs to massive BCGs and found that lower mass systems are dominated by stellar rotation compare to massive systems (BCGs), where dispersion becomes more important. Our results agree with this picture, as more massive BGGs, 21013 M, usually either show weak or lack net stellar rotation (with the exception of NGC 4261).
In summary, the stellar component of the BGGs almost always reveals some patterns of rotation. Ten sources (55% of the sample) reveal a strong velocity gradient, while four (22%) other sources have a mild sign of rotation which is very different from local BCGs, where random motions generally dominate the stellar component.
4.2 Properties of the Ionized Gas
4.2.1 Distribution and Velocity of the Gas
From the sample of 18 BGGs observed with the MUSE telescope, we have a 3 detection of [NII]6583 emission line in 17/18 sources. In NGC 6658, optical-emission lines were not detected. The detected optical emission lines for each source are listed in Table LABEL:tab:sample2. In Table 3 we summarize the observed properties of the optical emission lines and the stellar component, such as the morphology of the ionized gas, projected size of the ionized nebula, integrated H flux, H luminosity, [NII]6583/H ratio, semi-major axis and kinematics of the stellar component. Our sample shows a wide range of H luminosities, 0.040.04–5.010.111040 erg s-1, and a broad range of ionized gas projected sizes, 1–21 kpc. A detailed description of distribution and kinematics of the ionized gas is presented in Appendix A for all sources.
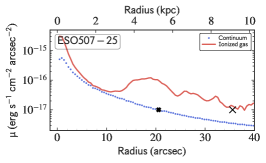
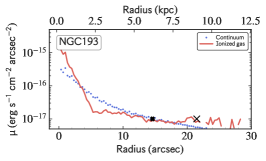
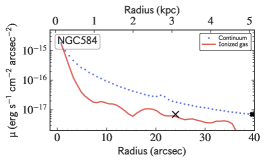
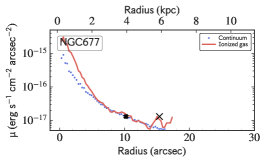
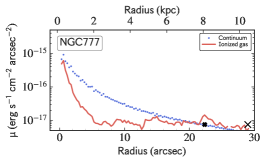
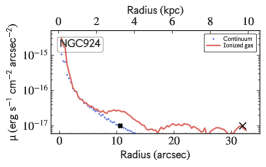
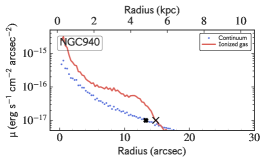
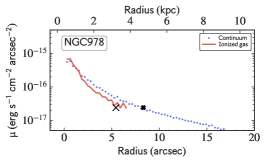
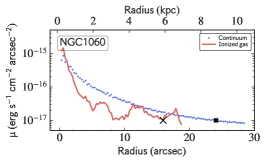
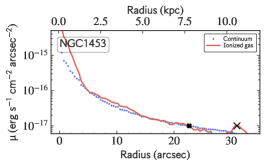
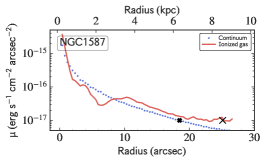
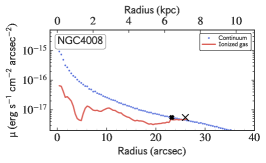
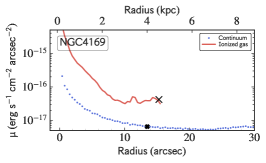
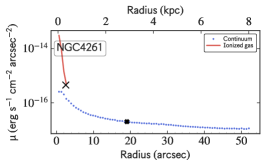
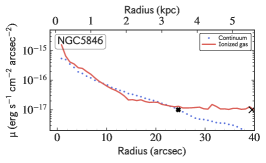
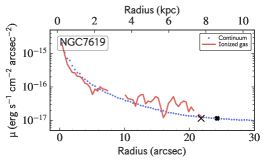
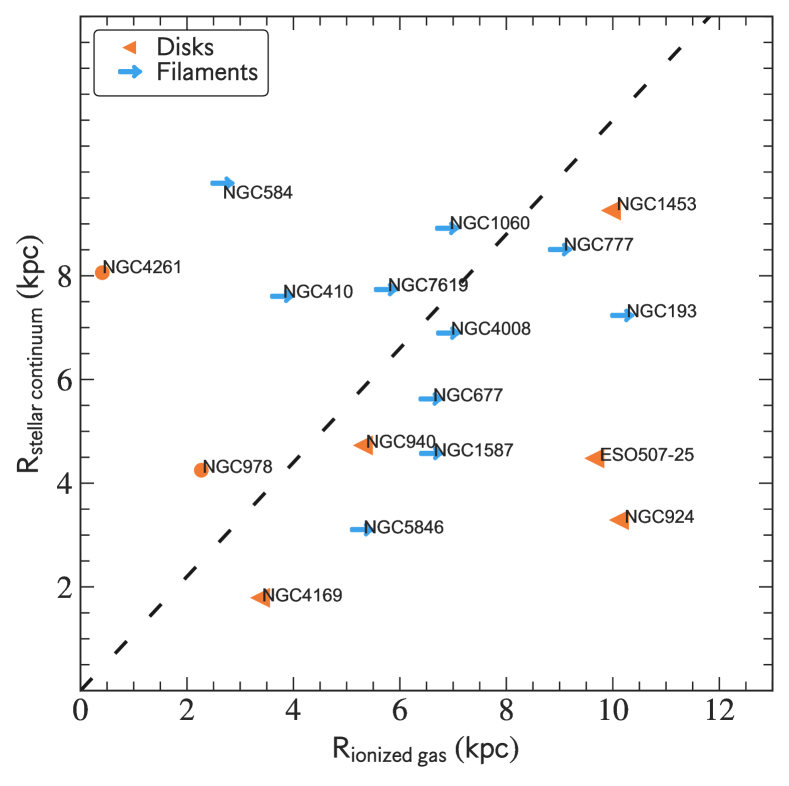
With the high-resolution of our MUSE observations (2″, 0.4 kpc), we can adequately compare the relative size of the ionized warm gas distribution to that of the stellar component. The distribution and relative sizes of the optical emission line and stellar components can be used as an indicator to distinguish between an internal and external origin of the gas. For that reason, we compute relative sizes at a given surface brightness to assure consistency in the comparison. We compute the surface brightness profile using circular apertures on the [NII]6583 flux map and the Johnson B filter continuum emission. Figure 30 show the surface brightness profiles of the optical emission line and stellar continuum emission (Johnson B filter) for each source. Spaxels with an S/N ratio below 7 in the [NII]6583 flux map were masked to compare the sizes at a given surface brightness value adequately. Additionally, stars or galaxies presented in the continuum map that do not correspond to the central galaxy were also masked. In Fig. 5 we compare the radial extension of the ionized gas and the continuum emission of the galaxy, measured at an apparent surface brightness of 10-17 erg s-1 cm-2 arcsec-2 (or 21 mag arcsec-2), which roughly corresponds to the surface brightness of the filaments. If the surface brightness threshold is set to a higher value, this could lead to a different classification from extended sources to compact.
We distinguished four categories for the ionized gas distribution based on the distribution and kinematics of the ionized gas and the comparison between the extension of the gas and the stars. For the sources dominated by rotation, we identify i) compact rotating disks and ii) extended rotating disks, while for the disturbed gas distribution, we have iii) extended filamentary and iv) compact filamentary sources. Note that the extension of the filamentary sources needs to be taken as a lower limit due to limited sensitivity and projection effects. In figure 2 we show an example for each category. It is important to note that the definitions are not mutually exclusive, as a single object may exhibit a morphology or kinematics of the gas that is consistent with two or more of the categories. We found that 5/18 sources are extended disks, 2/18 corresponds to compact disks, while the great majority 10 of the 18 are filamentary sources. Note that 3/18 of the extended disk-like sources also have elongated structures arising from the main disk, and one source (NGC 584) shows a smooth velocity field but a highly disturbed gas distribution. In the following, we describe each category.
Extended rotating disks: are sources dominated by rotation with relaxed gas distribution, in which the extension of the gas is larger than the stellar component. Five sources of the sample (5/18, NGC 924, NGC 940, NGC 1453, NGC 4169, ESO 507-25) belong to this category. The ionized gas distribution in these rotating disks is extended, with projected sizes from 5 to 21 kpc, and projected radii of 3.2–7.5 kpc, measured from the center of the galaxy to the faintest emission. We note that the peak of the [NII]6583 emission is usually well aligned with the peak of the stellar continuum. We also remark that three systems show a clumpy rotating ring (NGC 940, ESO 507-25, and NGC 924). The gaseous clumps of the rings have projected sizes of 1–3 (0.2–1 kpc). Furthermore, we note that several disks display tails and extended structures of ionized gas arising from the main rotating disk (ESO507-25, NGC 924, NGC 1453, and NGC 4169).
Compact rotating disks: are defined as objects in which the distribution and kinematics of the ionized gas is compact and dominated by rotation, and the projected radial extension of the ionized gas is smaller (1–3 kpc) than that of the stellar component. Two sources, NGC 4261 and NGC 978, in our sample (2/18) belong to this category.
Extended Filaments: are objects that show elongated structures, unrelaxed gas distributions, the kinematics of the gas is not dominated by rotation, and the optical emission is more extended than the continuum emission. As turbulence majorly dominates over rotation in these systems (see also Fig. 15), the CCA model suggests that these systems experience a more extended and filamentary rain of cold/warm gas (Gaspari et al., 2018). Six sources (6/18, NGC 193, NGC 677, NGC 777, NGC 1587, NGC 4008, NGC 5846) fall in this category.
Compact Filaments: Compact gaseous filamentary objects are systems that show a disturbed distribution, but the projected radial extension of the gas is smaller than that of the stellar component. We found that four sources (4/18) (e.g., NGC 410, NGC 584, NGC 1060, NGC 7619) belong to this category.
The sources in the filamentary categories display a velocity field dominated by disturbed kinematics, making the warm ionized filaments more challenging to interpret. Those disturbed velocity fields are probably due to a projection of several filaments that are inflowing or outflowing across the line of sight, as it has been shown in the Perseus Cluster through SITELLE observations, and in several cool-core clusters using ALMA and MUSE observations (e.g., Gendron-Marsolais et al., 2018; Tremblay et al., 2018; Russell et al., 2019; Olivares et al., 2019; North et al., 2021). The filamentary structures are often clumpy and without coherent velocity structure along the optical emitting nebulae. The best example is seen in NGC 5846, which hosts a very rich, dense network of filaments extending from the core out to a projected radius of 40 (5 kpc). NGC 584 also presents an exquisite clumpy net of threads extending along 24 (3 kpc) from the core of the galaxy. Many sources have an ionized gas peak that coincides with the center of the galaxy, accompanied by one single coherent structure in velocity (NGC 193, NGC 1060, NGC 1587). The projected sizes of these sources go from 4.5 to 14 kpc. Clear examples of very chaotic velocity fields can be seen in NGC 677, NGC 4008, and NGC 5846. In some cases, velocity gradients along the filaments are detected, but the gas is quite disturbed on average. Last, some hint of rotation is detected within the central kilo-parsecs of some BGGs (see for instances, NGC 193, NGC 584, NGC 677).
| BGG | Warm ionized gas component | Stellar component | |||||||
|---|---|---|---|---|---|---|---|---|---|
| Morphology | Size | H flux | Luminosity H | [NII]/H | Kinematics | ||||
| (kpc) | (10-14 erg s-1 cm-2) | (1040 erg s-1) | (kpc) | ||||||
| (1) | (2) | (3) | (4) | (5) | (6) | (7) | (8) | ||
| NGC 193 | E. Filament | 11.85 | 1.100.04 | 0.530.02 | 1.13 | Unordered | 5.14 | ||
| NGC 410 | C. Filament | 5.78 | 1.080.09 | 0.760.06 | 0.64 | Unordered | 10.76 | ||
| NGC 584 | C. Filament | 7.26 | 2.910.12 | 0.230.01 | 0.88 | Rotating disk | 2.52 | ||
| NGC 677 | E. Filament | 11.34 | 5.360.24 | 3.500.16 | 0.58 | Weak Rotation | 4.61 | ||
| NGC 777 | E. Filament | 9.91 | 0.190.02 | 0.120.01 | 2.27 | Weak Rotation | 6.65 | ||
| NGC 924 | E. Disk (+Ring) | 20.46 | 2.010.10 | 1.010.05 | 0.88 | Rotating disk | 6.18 | ||
| NGC 940 | E. Disk (+Ring) | 10.41 | 7.410.09 | 4.870.06 | 0.72 | Rotating disk | 4.15 | ||
| NGC 978 | C. Disk | 3.34 | 0.960.04 | 0.540.02 | 0.47 | Rotating disk | 4.64 | ||
| NGC 1060 | C. Filament | 9.86 | 0.400.05 | 0.270.03 | 1.95 | Unordered | 4.62 | ||
| NGC 1453 | E. Disk | 21.04 | 6.650.85 | 2.500.32 | 1.15 | Rotating disk | 3.51 | ||
| NGC 1587 | E. Filament | 11.61 | 5.070.45 | 1.720.15 | 0.69 | Rotating disk | 3.41 | ||
| NGC 4008 | E. Filament | 6.89 | 0.180.02 | 0.060.01 | 0.45 | Rotating disk | 5.06 | ||
| NGC 4169 | E. Disk | 4.80 | 5.230.09 | 1.860.03 | 0.95 | Rotating disk | 2.76 | ||
| NGC 4261 | C. Disk | 1.16 | 3.230.01 | 0.390.01 | 2.40 | Weak Rotation | 3.00 | ||
| NGC 5846 | E. Filament | 9.83 | 14.050.4 | 1.010.03 | 0.55 | Unordered | 1.96 | ||
| NGC 6658 | No gas | – | – | – | – | Rotating disk | 12.52 | ||
| NGC 7619 | C. Filament | 3.28 | 0.290.02 | 0.110.01 | 1.14 | Rotating disk | 7.62 | ||
| ESO 507-25 | E. Disk (+Ring) | 15.04 | 19.30.42 | 5.010.11 | 0.64 | Weak Rotation | 3.81 | ||
(2) Ionized gas classification (see text for details). Here “C” refers to compact disk or filaments, while “E” to extended disk or filaments.
(3) The projected size is the length of the major axis of the ionized gas.
(4) Integrated H flux integrated over all the map. Total fluxes of the measured emission lines are corrected for galactic and local extinction using the O’Donnell extinction curve (O’Donnell, 1994), and the dust maps of Schlegel et al. (1998).
(5) H luminosity. (6) [NII]/H ratios.
(7) Stellar kinematics.
(8) Semi-major axis of the stellar component.
4.2.2 Velocity Dispersion of the Gas
In figures 2 and 19 (last panel, top row) we present the projected velocity dispersion measured from our MUSE observations777The velocity dispersion are not corrected by instrumental broadening. Below, we describe the distribution of the projected velocity dispersion for the filaments and rotating disks categories separately.
Rotating disks – The velocity dispersion, , for the rotating disks usually peaked at the galaxy center with values of a few 100 km s-1. The of the clumpy rings detected in a few sources is smaller with values of 30–60 km s-1, implying that the ionized gas is significantly turbulent within those clumps. As predicted by the turbulence cascades from macro to micro scales mainly via Kolmogorov cascades (), smaller are expected within clumps. Along the disk, the is relatively small, close to 70 – 120 km s-1. Nonetheless, a few high dispersion velocity structures, 200 km s-1, sometimes with spiral shapes, are detected in a few sources (e.g., NGC 924, NGC 4169 and NGC 1453). In NGC 4261, we note that the broader dispersion is reached at the center of the galaxy, with a value of 210 km s-1. The regions at the East and the West of NGC 4261 have narrower-spectrum gas, with values between 80 and 100 km s-1.
Filamentary sources – In this category, the broadest velocity dispersion is, on average, found at the center of the galaxy with values of 150–350 km s-1. Whereas in the extended structures of those sources, the line-width is narrower, with velocity dispersion values of up to 60 km s-1. A broader dispersion spot (120 km s-1) is identified in the network of filaments in NGC 1587 located to the South of the center. Likewise, in NGC 5846, broader line widths are detected in some regions of the NE network of filaments (“arm”-like structure), likely due to several clumps located in projection along the same line of sight.
We found that the projected velocity dispersions of the gas are generally in the range of 30–350 km s-1, with lower values within the clumps of the rings and filaments (30–150 km s-1). Whereas, in the center, the gas is more perturbed with velocity dispersion values reaching 350 km s-1, likely because of an interaction/presence of an AGN, as well as due to an increase of inelastic collision of clouds at the center, the clouds and filaments cancel some angular momentum to later funnel toward the inner SMBH region, as predicted by the CCA feeding simulations (Gaspari et al., 2017). The superposition of clumps and filaments with a slightly different line of sight velocity could also broaden the optical emission line. We note that the high dispersion values at the center found in many sources tend to correlate with higher values of [NII]/H ratio consistent with LINER/AGN emission (see also Lagos et al. in prep).
5 Discussion
We map the kinematics and distribution of the ionized gas using new MUSE observations of a sample of 18 nearby BGGs selected from the CLoGS sample. We find that most sources have ionized gas kinematics and distribution consistent with (6/18) extended and (4/18) compact filamentary structures when comparing the sizes to the stellar component. Similarly, the rest of the systems show either (5/18) extended and (2/18) compact disks, while one source has no detected optical emission lines using pPXF and assumed stellar libraries. Contrary to the dispersion-dominated nature of the stellar component in BCGs, the stars appear to be mostly dominated by rotation in our sample. In this section, we compare the kinematics of the ionized gas to the stellar component, then we look at the correlation between the ionized gas and the molecular gas, X-ray and radio emission, and last we discuss the potential scenarios that can lead to the formation of the ionized gas in our sample.
5.1 Comparison of the Gas and Stellar Kinematics
5.1.1 Comparison of the velocity fields
| BGG | PAgas | PAstellar | |
|---|---|---|---|
| () | () | () | |
| Filaments | |||
| NGC 193 | 150.20.5 | 120.289.5 | 30.0 |
| NGC 410 | 28.9 0.9 | 185.42.3 | 156.5 |
| NGC 584 | 92.312.7 | 60.00.6 | 32.3 |
| NGC 677 | – | 118.56.3 | – |
| NGC 777 | – | 319.31.8 | – |
| NGC 1060 | 294.90.9 | 16.31.4 | 278.6 |
| NGC 1587 | 147.40.9 | 231.61.3 | 84.2 |
| NGC 4008 | 354.60.9 | 168.21.4 | 186.4 |
| NGC 5846 | 129.30.5 | 306.689.5 | 177.3 |
| NGC 7619 | 168.018.7 | 217.10.9 | 49.1 |
| Disks | |||
| NGC 924 | 41.60.5 | 52.50.9 | 10.9 |
| NGC 940 | 198.10.5 | 198.10.5 | 0.0 |
| NGC 978 | 72.40.5 | 72.40.5 | 0.0 |
| NGC 1453 | 313.00.5 | 25.31.8 | 287.7 |
| NGC 4169 | 143.80.5 | 332.90.9 | 189.1 |
| NGC 4261 | 340.15.0 | 56.11.4 | 284.0 |
| ESO 507-25 | 163.73.2 | 261.43.2 | 97.7 |
: Difference between the stellar and gas kinematic position angles,
When comparing the stellar and gas kinematics of the filamentary sources, it is clear that the gas velocity structure is distinct from the ordered motions usually seen in the stellar optical component. The latter suggests that the ionized gas in the filamentary sources is kinematically distinct and decoupled from the BGG stellar components, implying an external origin for the gas. Similar results have been found in galaxy clusters (Hamer et al., 2016).
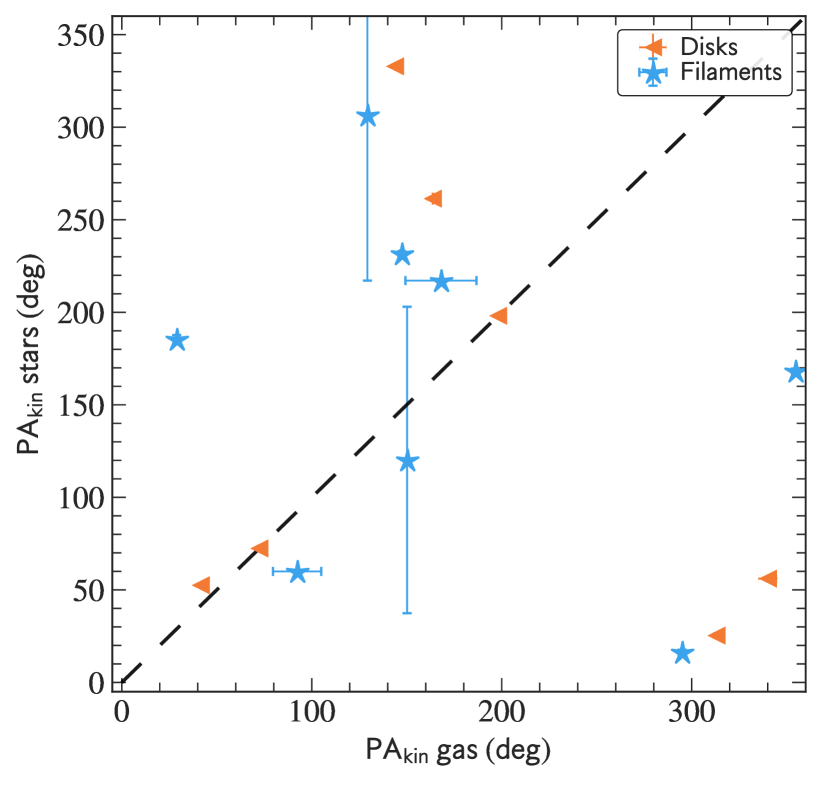
The situation is more complex for the rotating gaseous disks, as its stellar counterpart is also rotating. For these sources, we model the velocity fields of the stellar and gas component to determine the kinetic position angles (PAs), using the fitkinematicpa routine described in Krajnović et al. (2006). We define the degree of misalignment between the rotation of the stars and that of gas by taking the difference of both position angles, . Following other studies in the literature, (e.g., Lagos et al. 2015; Bryant et al. 2019, we define an object as being misaligned if this difference is higher than PA30, and aligned if the PA30. We also attempt to fit the kinematic PA for the filamentary sources even when the kinematics of the filamentary, following the same procedure. The PA values for the gas and stellar components of each source can be found in Table 8. Figure 6 we show the kinetic PA angle of the stars and gas for the disks (orange left-pointing triangles) and for some filamentary sources (blue stars) where the fitting of a rotating structure is possible. The kinetic PA of gas for the filamentary sources should, therefore, be taken with care. As previously mentioned, a few systems do not show clear net stellar rotation making it difficult to define the , leading to large uncertainties.
Three sources with rotating gas components have kinematics aligned with the stars (see NGC 940,NGC 978, and NGC 924). The ionized gas disks might be coupled to their stellar component, indicating the gas is relaxed in the galaxy potential. The latter can be seen in NGC 940, NGC 978, where the ionized gas and stellar disk have the same PA, with PA values of about 198.1, 72.4, respectively. NGC 924 has a of 11, indicating that this disk may be tilted.
Some disks clearly show velocity structures of the gas that are kinematically decoupled from the stellar components. For example, in ESO 507-25, the PA of the stars is 261, while the PA of gas distribution is 163. Similarly, in NGC 1453, the PA of the ionized gas disk (PA313) is very different from the PA of the stars (PA=25). In NGC 4261, where the stellar component shows prolate rotation, we also see that the gaseous disk (PA340) is misaligned with the stars (PA56).
Note also that in NGC 4169, the gas (PA143) is counter-rotating with respect to the stars (PA332.9), with a of 189. In summary, only 3/7 of the rotating gaseous disks are aligned with 0, whereas four disks are dynamically decoupled with 20. The aforementioned suggests an external origin of the gas for some of the rotating disk-like and most of the filamentary sources.
5.1.2 Velocity dispersion
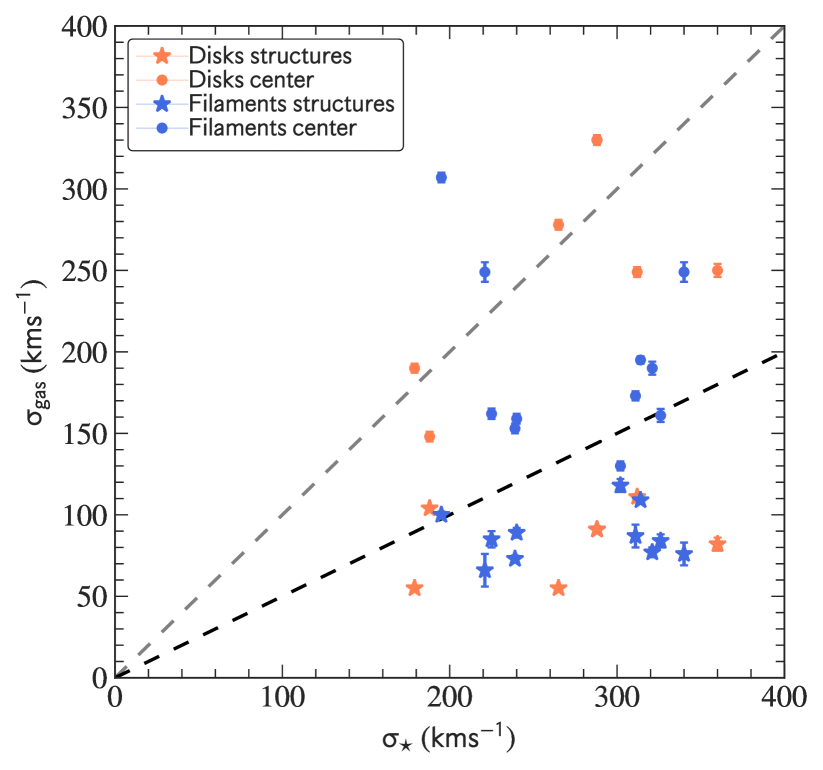
In Figure 7, we compare the velocity dispersion of the ionized gas () and the central stellar velocity dispersion (). We measured the gas velocity dispersion of the ionized gas from the central region (represented with circle symbols) and in different structures of the nebulae (e.g., filaments, clumps, and rings, displayed with star symbols). A numerical average value of the gas dispersion was taken of each structure for a given galaxy. We noticed that the dispersion of the structures (, star symbols) are at least two times smaller than the central stellar velocity dispersion (). Whereas the dispersion of the structures at the centers (, circle symbols) is, on average, smaller and sometimes equal to the central stellar dispersion. However, sometimes for disk center (orange circles), the points appear to be sitting on the equal relation (gray dashed line), and the for the filament center (blue circles) a few times also exceed the central stellar dispersion. The latter indicates that the gas is likely not dynamically relaxed in the gravitational potential of the galaxy, but may also indicate modulation of the gas sigma around the relaxed value, likely by intermittent AGN outburst.
In the framework of hot-halo cooling, two related models – warm AGN-driven outflows (Qiu et al., 2020) and turbulence-driven raining (Gaspari et al., 2018) – show a somewhat different scatter for the correlation between hot-warm gas velocity dispersions. In the former, the velocity dispersions of both phases are only intermittently correlated, with the hot gas typically displaying values in the 100–140 km s-1 range, except during peak activity. In the latter, while still being variable via the AGN feedback loop, the cold and warm gas share a similar dispersion over most of time, thus showing a tighter correlation scatter. Turbulent-driven precipitation simulations by Prasad et al. (2018) also find similarly varying hot-phase velocity dispersions tied to the feedback loop (50–200 km s-1). Hitomi observations gave us already a sneak peek at the hot gas line-of-sight velocity dispersion in Perseus cluster core of km s-1 (Hitomi Collaboration et al., 2016), which results to be fully consistent with that found by SITELLE H detection (see Figure 1 in Gaspari et al. 2018), thus favoring turbulent raining, at least in Perseus cluster. Analogous dispersion values have been found at the center of our filamentary systems (see Fig. 7, blue circles). However, future high-resolution X-ray IFU observations such as Lynx and Athena X-ray satellites are required to build the hot-gas sample and to compare with our MUSE observations of cool gas. Indeed, besides Perseus core, only upper limits are available on the hot-gas velocity dispersion; e.g., even XMM-Newton observations of the NGC 5044 BGG (using the Reflection Grating Spectrometer) provide wide upper limits of 320–720 km s-1 via the FeXVII line broadening.
5.2 AGN X-ray bubbles, Radio Emission versus Ionized Gas Comparison
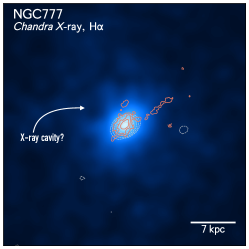
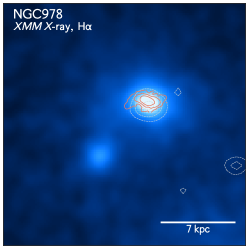
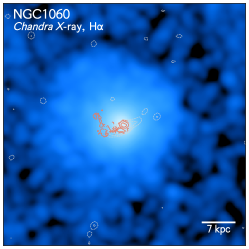
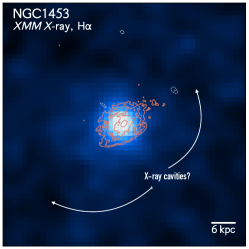
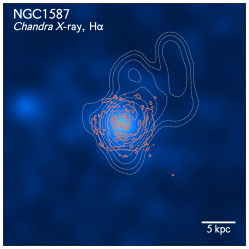
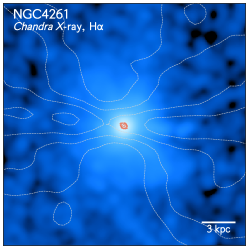
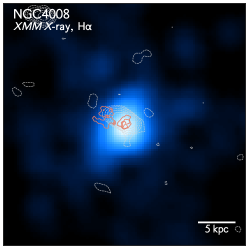
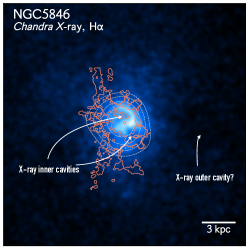
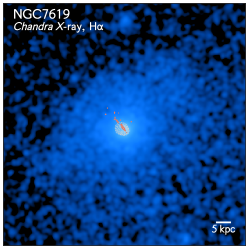
This section examines the spatial distribution of the ionized gas in connection with the radio emission and IGrM features. Radio jets in central clusters and groups galaxies are deemed to heat the IGrM/ICM compensating the radiative losses maintaining the long-term balance (see McNamara et al. 2006; Fabian 2012), plus potentially induce cold gas condensation via turbulence and uplifting of the low entropy gas (e.g. Revaz et al., 2008; Pope et al., 2010; McNamara et al., 2016; Gaspari et al., 2018). The 235 and 610 MHz GMRT radio data used was drawn from Kolokythas et al. (2018), while for NGC 4261 was drawn from the study of Kolokythas et al. (2015), NGC 1587 and NGC 193 from Giacintucci et al. (2011). Kolokythas et al. (2018) reported large- (20 kpc) and small-scales (20 kpc) radio jets in 4 of our systems, diffuse radio emission in 3 sources, whereas ten systems have a point-like radio emission (11 kpc) (see table LABEL:tab:prop_multiwave for details of each source). In the left-top panel of Figures 2 and 19, we show the ionized gas maps overlaid with contours from the GMRT 610 MHz radio emission in green. Whilst Figure 9 displays the X-ray emission from Chandra or XMM-Newton observations for the sources that have a detected X-ray halo, overlaid with contours from the ionized gas (red contours) and 610 MHz radio emission (dotted gray contours).
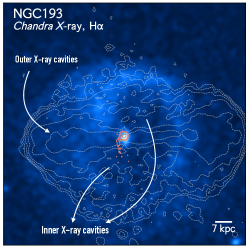
In NGC 193, the SW set of filaments are located in projection behind the rim of one of the inner Southern X-ray cavities excavated by the large-scale (80 kpc, Giacintucci et al. (2011)) radio jets (see Fig. 9). Noteworthy, any trace of ionized gas is found neither at the Northern inner bubble or the outer bubbles. According to Bogdán et al. (2014), the inner cavities correspond to a weaker old ( 70 Myr) AGN outburst, while the outer cavities to a strong younger ( 10–20 Myr) outburst. Based on the kinematics of the ionized gas and the spatial correspondence with the inner younger cavity, it is plausible that the SW filaments formed in a previous AGN outburst, and the cooled gas is now inflowing towards the galaxy center.
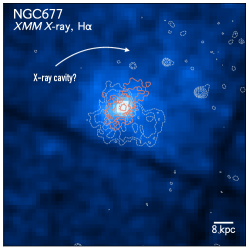
NGC 677 hosts a highly diffuse radio emission, but it does not seem to be aligned with the optical-line emitting gas. On the other hand, X-ray XMM-Newton observations show X-ray surface brightness depression, we interpreted as a possible cavity at the NW of the group’s center (see Fig. 9). Note that the data quality is not the best to make a reliable identification. The NW set of optical filaments found in NGC 677 (red contours) are located in projection behind this putative X-ray cavity.
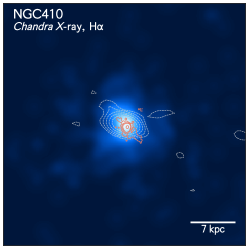
The shallow X-ray Chandra observations of NGC 777 reveal the presence of a potential X-ray cavity on the hot atmosphere detected by Panagoulia et al. (2014), located in projection near the NE H filament (see Fig. 9). The 4.85 GHz VLA and 610 MHz GMRT observations show no indication of jets (Kolokythas et al., 2018). However, Ho & Ulvestad (2001) found a slightly resolved radio emission at 5 GHz, which appears to be aligned with the direction of the SE-NW ionized filaments.
NGC 1060 hosts a small-scale jet, although the low spatial resolution of XMM-Newton observations are insufficient to resolve any X-ray cavities at the scale of the jets (Kolokythas et al., 2018). Nevertheless, the distribution of the SE filament seems to be spatially linked to one of the radio lobes, raising the possibility that AGN outburst could have triggered the formation of the cold gas and produced the smooth velocity gradient in the SE clumpy filament (see Fig. 19).
From visual inspection, we found the XMM-Newton X-ray image of NGC 1453 shows hints of two depressions along the NW-SE axis indicating the presence of possible X-ray cavities (see Fig. 9). The two depressions are chosen out of the others for being the biggest; however, deeper X-ray observations are needed to confirm the presence of any cavity. These two depressions are aligned with the major axis of the ionized gas disk. Therefore, if these are cavities, the redshifted NW and SE blueshifted structures coming out of the disk could be related to these possible X-ray depressions. Note that NGC 1453 hosts a radio point emission with no evidence of jets (Kolokythas et al., 2018).
The 610 MHz radio observations reveal that NGC 1587 hosts a central radio source surrounded by a diffuse emission extending out to the NW, whose nature is unclear (Giacintucci et al., 2011; Kolokythas et al., 2018). Consistently, the 1.4 GHz VLA observations show a small-scale radio emission (1 kpc, 4) to the NW, hinting an interaction with the ionized filaments (see Fig. 2).
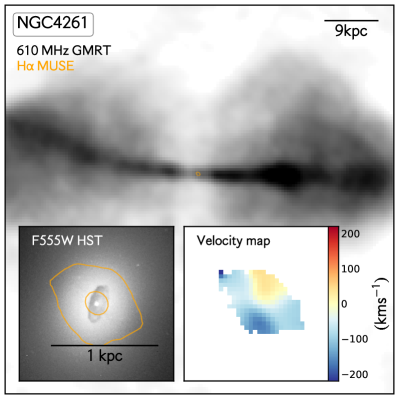
In NGC 4261, the large-scale radio jets are being ejected by the SMBH nearly perpendicular to the plane of the ionized gas disk (see Fig. 8) excavating cavities on the IGrM (O’Sullivan et al., 2011), similar to the BCG in Hydra-A (Hamer et al., 2014; Rose et al., 2019). Long-lived disks revealed by simulations are shown to play a crucial role in driving strong jets perpendicular to the plane of the disk (Beckmann et al., 2019; Li et al., 2015). The little amount of raw material and compact gas distribution is potentially a consequence of a disbalance between the jet power and cooling, where the former is about two orders of magnitude greater than the radiative losses Kolokythas et al. (2015, 2018).
The ionized gas in NGC 5846 is distributed along the rims of the inner X-ray cavities that have been detected within the inner 2 kpc of the IGrM filled out with radio emission (Dong et al. (2010), see also Fig. 9). The small-scale radio jets might entrain the North set of filaments, distributed in an ”arm-shape“ (see Fig. 19), while the South network of filaments is spatially coincident with the radio lobe. The extended NE filaments are also preferentially located along the radio lobes. There is also evidence of a larger outer cavity located west of the central galaxy (Machacek et al., 2011), but no cold gas is found close to this cavity.
In NGC 7619, the 610 MHz GMRT display an unresolved radio emission, and no X-ray bubbles have been identified for this interacting system (Dong et al., 2010).
Note that spatial coincidence between the radio jets/emission and the warm ionized gas does not necessarily indicate a direct uplift of cold gas. The radio jets could also produce strong turbulence and compression on the hot gas, triggering non-linear thermal instabilities. We also recall that the putative X-ray cavities mentioned in this paper are only potential as deeper X-ray observations are needed to confirm those. NGC 6658, the source without optical emission lines, also lacks radio emission at any radio frequencies observed with the GMRT telescope. The rest of the sources have an unresolved point-like radio distribution. As well as a diffuse (ESO 507-25) radio emission with no clear association with the ionized gas. We recall that feeding can generate compact radio synchrotron emission close to the inner gravitational region, even without active feedback in action.
5.3 Is the Ionized Gas linked to the Molecular Gas?
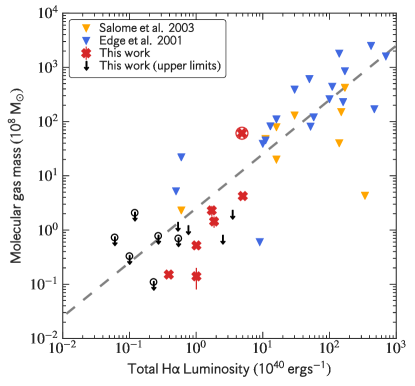
The sources of our sample have been observed with the single-dish IRAM 30m or APEX telescope (O’Sullivan et al., 2015, 2018), but CO(1-0) or CO(2-1) emission lines were only detected in six of the galaxies (see Table LABEL:tab:prop_multiwave for the details of each source). The sources with detected CO emission lines have molecular gas masses within a range from 0.14 up to 61 M⊙. Half of the sources (NGC 940, NGC 924, and ESO 507-25; O’Sullivan et al. 2018) show double-horn profiles in agreement with the ionized gas distribution. In particular, two sources with filamentary structures, NGC 5846 and NGC 1587, have CO emission line detections. Molecular emission from filaments is much fainter and harder to detect, making it more challenging to detect molecular clumps in extended structures. Plus, there is likely a bias that favors the detection of molecular gas when it has settled into a massive rotating disk. Numerical simulations of CCA predict that in groups, the condensed gas mass should be about 2 dex lower than in clusters (Gaspari et al., 2017), making it more challenging to detect it, particularly in small clouds. Therefore, cooling in the less luminous X-ray galaxy groups should provide less condensation of cold gas, as they have less hot gas available. Another possibility has been pointed out by Liang et al. (2016), where the gas could have been expelled by either SN or AGN-driven winds up to 3–4 R200 at early times, and it has not been entirely re-accrete yet. Deeper observations are needed to detect the fainter molecular gas (if present). This is a current limitation that will be further explored with future ALMA and NOEMA observations.
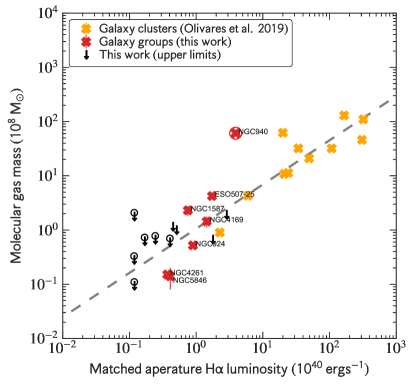
In Figure 10 we compare the molecular gas mass with the H luminosity. The left panel shows the overall correlation between molecular gas mass against the total H luminosity for our MUSE sample. We have also included BCGs taken from the literature (Edge, 2001; Salomé & Combes, 2003; Pulido et al., 2018; Olivares et al., 2019). In the right panel of Figure 10, the H luminosity has been estimated from the same aperture as the CO measurements using ALMA and IRAM observations for the BCGs and BGGs, respectively. The CO aperture of each source is shown in the second panel of Figures 2 and 19 with a white a cyan circle for upper limits and detections, respectively. As shown in Fig. 10, the scatter is reduced when both quantities are measured within the same aperture, preserving the tight correlation between these two gas phases, including less massive systems.
Previous studies of cool-core clusters using ALMA and MUSE observations in synergy have found that the molecular and warm ionized gas are co-spatial and co-moving, consistent with the hypothesis that H emission comes from warm ionized envelopes of cooled molecular clouds (e.g., Tremblay et al., 2018; Olivares et al., 2019). The aforementioned suggests a common origin for these two gas phases likely via the top-down multiphase condensation cascade, and thus the cold and clumpy gas may have formed from the hot ICM or IGrM condensation through the CCA mechanism (Gaspari et al., 2017). The molecular-gas-mass-to-H-luminosity correlation which follows our sample supports this scenario (see Fig. 10). However, further kinematic and spatial information of the cold molecular gas is required to unveil whether these two phases are tightly connected as expected from this scenario (Gaspari et al., 2018). In particular, the turbulence driven in the hot halo by recurrent AGN feedback (Wittor & Gaspari, 2020) is expected to percolate through the phases, with the ensemble warm filaments acting as the best kinematical tracers for the CCA condensation rain (see also Sec. 5.4).
Our preliminary NOrthern Extended Millimeter Array (NOEMA) observations of NGC 940 reveal a cold molecular gas disk (Olivares et al. in prep), which appears to be co-spatial and co-moving with the optical emission lines in a rotating disk structure. Likewise, ALMA observations of NGC 4261 show a cold molecular rotating disk (Boizelle et al., 2021), consistent with MUSE observations. Besides that, ALMA observations of NGC 5846 show sub-kpcs molecular CO clouds of 105 M⊙ associated with some of the H filaments and dust structures unveiled by the HST dust extinction maps (Temi et al., 2018), comparable to the gas distribution observed in cool-core clusters. Qualitatively similar results have been reported in several local BGGs by Werner et al. (2014), using [CII]157 emission line (a tracer of 100 K cold gas) and H+[NII] optical emission line, showing co-spatiality between the two temperature gas phases. Hence, molecular and ionized gas are either associated inside a disk or in clumps within the filaments. A careful study of the morphology of ionized gas excitation can help shed light on the origin (or evolutionary stage) of these different gaseous structures (HII regions vs shock or energetic particles heating).
5.4 Origin of the Gas
The question of how galaxies acquired their gas is still a matter of debate. Several scenarios have been discussed for the origin of cold gas in elliptical galaxies over the past years. Those scenarios are the acquisition of cold gas from the cooling of gas ejected by the stellar population (stellar-mass loss), through mergers or interactions with gas-rich galaxies, or cooling from the hot atmosphere (cooling-flows). A mixture of these different processes is also, and likely possible. Davis et al. (2011) suggested that in elliptical galaxies, the gas produced by the stellar-mass loss should form a kiloparsec-scale rotating disk aligned with the stellar component, while the gas brought into the system through mergers is likely to be misaligned or to create multiple tails, rings, or disks. Numerical simulations of cool-core clusters and groups also found kiloparsec rotating disks of raw material at the center of the galaxy. The formation of the cold rotating disk may thus also occur via the condensation of the hot gas via thermal instabilities (e.g., Gaspari et al., 2015; Prasad et al., 2018; Gaspari et al., 2018; Beckmann et al., 2019) or merger events.
5.4.1 Stellar-mass loss
In most cases, there is a kinematics misalignment between the gas and the stars in discrepancy with the stellar-mass loss scenario, where a kinematic alignment between the gas and the bulk of the stellar population is expected due to angular momentum conservation (Davis et al., 2011). Only in three rotating-disks (NGC 940, NGC 978, and NGC 924), the gas is kinematically aligned with the stellar component by at least 10. Furthermore, the distribution of the gaseous disks differs from the stellar population, with some sources even displaying gaseous structures arising (e.g., NGC 978) from the main disk and outer rings (e.g., NGC 924), making it difficult to reconcile with this scenario. In particular, only in the lenticular galaxy NGC 940, the distribution of both components appears to be alike.
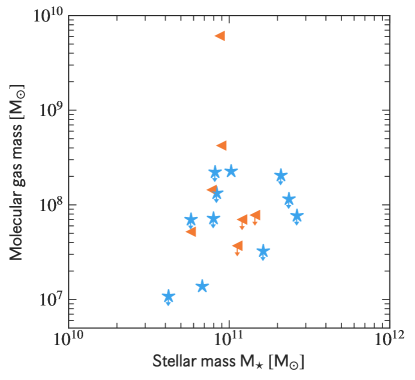
Most of the material produced by stellar mass loss is expected to be thermalized by shocks and will join the hot galaxy halo (Parriott & Bregman, 2008; Bregman & Parriott, 2009), though a fraction might contribute to the raw material settling onto a rotating disk. Most internal processes that can return material to the IGrM are related to the mass of the stars present in the galaxy, and its star formation history. Canning et al. (2013) suggested that evolved stellar population is expected to provide about 1 M⊙ yr-1 of gas per 1011 M⊙, which corresponds to roughly the stellar mass of the sources in our sample. Considering that the cooling time is 108 yr, the mass rate is not constant, and only a fraction of expelled gas condenses into molecular gas (without producing star formation), the galaxies would take at least 1 Gyr to build such cold gas mass budget. It is also important to know whether the reservoir of gas correlates with stellar mass (Young et al., 2011; Davis et al., 2019). As shown in Fig. 11, we do not find any correlation between the amount of cold gas mass and stellar mass, indicating that the stellar mass loss is likely not the dominant source of cold gas and that the gas might originate through external processes.
5.4.2 Gas-rich mergers and interaction
The distinct kinematic and spatial distribution between the stellar and the gas component may suggest another dominant mechanism for acquiring cold gas in our sample. In particular, we found that four gaseous rotating disk systems have misaligned stars and gas kinematics with PA90 °(NGC 1453, NGC 4261, NGC 4169, and ESO 507-25), while three sources display extended rotating rings (NGC 940, NGC 924, and ESO 507-25), in addition to the filamentary source, NGC 584, whose kinematics show sign of rotation. The oxygen abundances distribution of the circumnuclear star-forming regions detected in the rotating rings show a chemically homogeneous ISM (Lagos et al. 2021, in prep.), with metallicity near Solar for these systems. This could indicate short time scales for the accretion process.
It is also worth mentioning that most of the extended rotating disks and NGC 584 lack a detected IGrM and have a point-like radio source (NGC 940, NGC 924, and ESO 507-25, NGC 4169). The latter may be indicative of cold gas formed through gas-rich mergers or galaxy interactions, which could potentially form central disks and rings in the final stages of mergers (Eliche-Moral et al., 2010), as also suggested by studies on elliptical galaxies (Young et al., 2008; Crocker et al., 2011; Davis et al., 2011).
Another possible mechanism comes from interactions with satellites. Cosmological ROMULUS simulations show that satellite galaxies are not required to merge to deliver their gas to the central BGG. Instead, the gas from the satellites gets stripped (Babul et al. in prep) forming gaseous streams, proving another source of filaments formation, that could eventually end up raining down onto the central galaxy. If the satellites are sufficiently low mass, they can continue orbiting until they lose most of their gas. From a kinematic point of view, galaxy satellites also generate wakes and turbulence, producing disturbed kinematics. Still, some extended rotating structures and rings of a few ten kpcs lengths are also formed, as the gaseous streams naturally contain significant angular momentum allowing for the gas to settle in an extended rotating structure.
In terms of timescales, the gaseous disks have surprisingly short depletion timescales (/SFR), implying a very rapid replenishment of their gas reservoirs on timescales of 1108 yr. Moreover, based on FIR measurements the specific star formation rate () is about 0.020 Gyr-1 and 0.0008 Gyr-1 for the extended and compact disks, respectively (see for more details O’Sullivan et al. 2015, 2018). Note that SFR derived from UV measurements are typical of the order of 10-2 Myear-1 (Kolokythas et al., 2018), with a negligible contribution to the total SFR. The latter suggests that most galaxies have formed their stars in earlier star formation episodes (O’Sullivan et al., 2015). The replenishment of the cold gas must be in very short timescales of 1108 yr, making it difficult to reconcile with a merger scenario. On the other hand, these timescales are of the same order of magnitude as the cooling time seen in these objects, 0.1 Gyr.
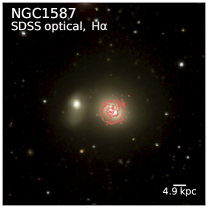
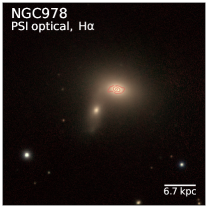
We do not find any evidence of long tidal tails and streams of stars seen in the optical images, reminiscent of ongoing galactic collision of two galaxies (e.g., Saviane et al., 2008), but note that the FOV of MUSE is limited to the central galaxy. Only NGC 1587 and NGC 978 reveal a hint of interaction with its neighboring elliptical, NGC 1588 and MCG+05-07-017, respectively. The set of optical filaments in NGC 1587 appears spiral inflowing into the central galaxy, indicating signs of tidal stripping (see Fig 12, left panel). This single example is perhaps indicative of the merger role in gas accretion in these systems. On the contrary, in NGC 978, a rotating disk system, no sign of cold gas is found between the two galaxies (see Fig 12, right panel). Instead, the optical-emission line gas shows some emission arising of the disk to the SE-NW direction, although this emission is only extending 1.5 kpc (4) in projection. The filamentary gas in our sample usually has disturbed velocity structures within their short extension, 10 kpc, in contrast to what might be expected from the kinematics of tidal tails in interacting galaxies (e.g., Bournaud et al., 2004). Some shallow velocity gradients are found along the filaments. However, these filament morphologies are more consistent with the scenario of a condensing hot halo (e.g., Beckmann et al., 2019) rather than being from a “wet” merger event. We also do not see evidence of shells structures in the optical images, features expected in post-merger galaxies (Prieur, 1990). We note that even if they are present, these structures are very faint and thus difficult to detect.
5.4.3 Accretion from a hot IGrM
In terms of kinematics, misaligned angular momentum between stars and gas may not necessarily imply a merger origin. The same can occur in an IGrM cooling scenario, including counter-rotation, by an angular momentum misalignment among the cooling IGrM, stellar disks, and dark matter halos (Lagos et al., 2015). Counter-rotation is also possible for cooling gas as it is not known how the angular momentum may develop as it sinks to the center of the potential.
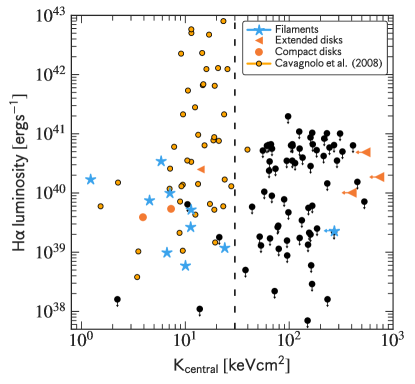
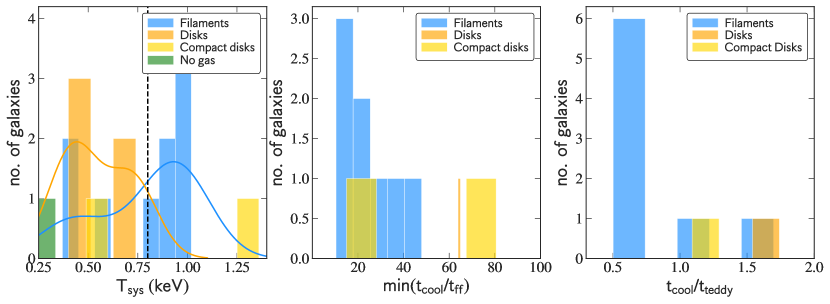
Observational studies found the presence of nebular and cold molecular gas, in galaxy clusters, groups, and even elliptical galaxies, in systems with shallower X-ray entropy profile and lower inner entropy values, K10, below 35 keV cm-2 (e.g., Rafferty et al., 2008b; Cavagnolo et al., 2008; Lakhchaura et al., 2018; Babyk et al., 2019). Numerical simulations and theoretical studies have interpreted the latter, as a consequence of IGrM condensation, which develops a multiphase medium via thermal instabilities triggered by the influence of the AGN feedback, when the cooling time is short enough, or when the ratio of the cooling time over a dynamical time-scale such as the free-fall time, , is below 10 (e.g., Sharma et al., 2012; McCourt et al., 2012).
Subsequent simulations and theoretical studies show that condensation may develop when 5–20, as an outcome of precipitation-regulated feedback (e.g., Gaspari et al., 2012; Voit et al., 2017; Prasad et al., 2018, 2020; Wang et al., 2018), which corresponds to a central entropy threshold of 30–40 keV cm-2. It is important to note that, unlike in early thermal instability simulations, this does not appear to be a line-in-the-sand criterion, but rather a wide band with large scatter.
In a similar perspective, the C-ratio, defined as the ratio of the gyration time scale of turbulent eddies, , and the cooling time, , is considered to be crucial for the development of non-linear thermal instabilities and the onset of gas condensation via turbulence. Cold gas precipitation occurs when the C-ratio is 1 (Gaspari et al., 2018). The eddy turnover timescales, defined as , is inversely proportional to the gas velocity dispersion, , measured at the injection scale, . As described in Gaspari et al. (2018), we use the length of the filaments as a proxy for the injection scale, and the velocity dispersion, , from the MUSE observations. Recently, Wang et al. (2018) found strong evidence of multiphase gas in one of their galaxy group simulations, which has comparatively shallower and entropy profiles than single-phase systems. O’Sullivan et al. (2017) found that CC and NCC groups have very similar entropy and profiles. An alternative is the formation of cold gas via stimulated-feedback (Revaz et al., 2008; Pope et al., 2010; Li & Bryan, 2014; McNamara et al., 2016), or similarly, AGN-driven outflows (Qiu et al., 2019, 2020), in which the cold gas condenses out of the uplifted low-entropy gas by the radio bubbles (see Section 5.4.6).
While most of clusters have an X-ray emitting ICM, in our optically-selected groups, only twelve sources (12/18, 65%) have a detected extended (10 kpc) hot gas halo that allows us to investigate the condensation criteria. The rest of the groups have an extension smaller than the (XMM) PSF (3/18, point-like), and two lack X-ray detection (O’Sullivan et al., 2017). Note that X-ray observations were constrained to detect very faint X-ray halos with X-ray luminosities of a few 1040 erg s-1. Noteworthy, all point-like and non-detection corresponds to extended disk-like sources and NGC 584, a source categorized as filamentary but dominated by rotation. The detection of an IGrM for those sources will be explored with future X-ray facilities (e.g., Athena). Detailed X-ray properties of each source are listed in Table LABEL:tab:prop_multiwave.
In Fig. 13, we plot the central entropy values at 1 kpc as a function of H luminosity. We found that twelve sources (12/17, 70%) with cold gas have low central entropy values below 30 keV cm-2. As shown in Fig. 13, all of them correspond to filamentary sources (blue stars) and compact disks-like systems (orange circles). On the contrary, if we estimate the entropy at 10 kpc, only five sources are consistent with the entropy threshold, while another six sources have central entropy values between 30 and 40 keV cm-2. Bear in mind that the fixed radius of 10 kpc to measure the inner entropy values may be larger than the cooling region in some cases, as the radial projection sizes of the ionized gas are usually smaller.
Taking as a strict onset of TI the criterion of min() 10, only one source may have condensed their cold gas through thermal instabilities (see Fig. 14, middle panel). Note that most of the the tcool/tff, never goes below 10, as found in BCGs (e.g., Hogan et al., 2017; Olivares et al., 2019). This shows that the TI-ratio has a large scatter and is likely not the primary criterion of condensation. One needs to note that those predictions are based mostly on idealized simulations, where other important cosmological processes such as satellites accreting onto groups, orbiting and being stripped, and possibly merging, may be dominant in galaxy group environments (see, for example Jung 2021).
On the other hand, the ratio of the cooling time to the eddy turn-over timescales, , are within the range of 0.5–1.6 at 10 kpc in seven sources (see Fig. 14, last panel), consistent with the range of values predicted by numerical simulations (C=0.6–1.8, Gaspari et al. (2018)). Again, all the sources belong to the filamentary category, including one compact disk (NGC 4261). Only in NGC 1453 with an extended-rotating disk, the is close to unity (0.6 at 10 kpc). However, its min() ratio is high, 64. If the emission line gas in this system has formed through cooling, this indicates that the C-ratio criterion is likely a more reliable threshold to dissect the condensation than TI-ratio.
From the criteria presented above ( and ), we found that the filamentary sources have an IGrM that appears to be cooling according to either i) , or ii) the low central entropy values, , except for NGC 584, where the IGrM was not detected by the XMM-Newton observations (O’Sullivan et al., 2017). In the compact rotating disk systems, NGC 978 and NGC 4261, both low central entropy values, and the cooling time to the eddy turnover time ratios, , suggest that the warm ionized gas condensed through the cooling of the IGrM. Similar results have been found for X-ray and optically bright selected elliptical galaxies presented in Babyk et al. (2019) and Lakhchaura et al. (2018), who investigate the connection between the thermodynamical properties of hot X-ray emitting gas, using Chandra observations, the H+[NII] emitting phase, and cold molecular gas, respectively.
5.4.4 Could extended disks also be condensing from rotation-dominated hot atmospheres?
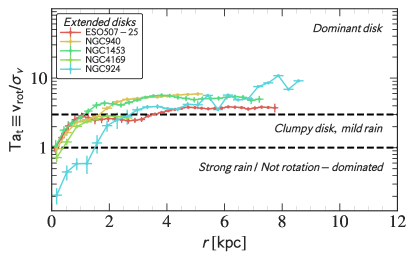
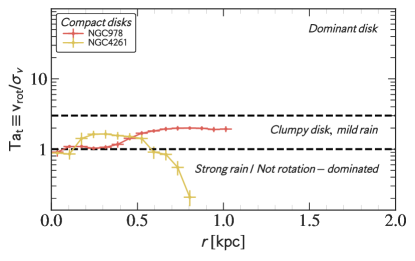
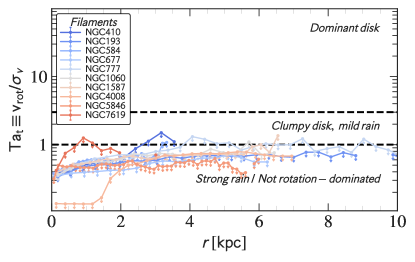
Several arguments favor hot gas cooling for the origin of the filamentary structures. However, discussing the origin of the extended rotating disk systems in the context of hot gas condensation is more complicated since these systems possess the highest cold molecular gas masses of the sample but usually lack IGrM detections. It might be thus possible that the dominant origin of the gas for most of these systems is either from wet mergers or gas spilled by cosmological satellites, as discussed above. The following section discusses arguments supporting a possible contribution from hot gas condensation for the extended disks.
Only NGC 1453 has a detected IGrM, which appears to be cooling according to the criteria discussed above. It is noteworthy that, as shown in Fig. 14, the extended rotating disk systems tend to have lower global X-ray temperature, consequently fainter X-ray halos, compared to the filamentary systems, although radio jets are not found in any of the observed radio frequencies. In smaller systems than clusters, other physical processes are also important in controlling the thermal state of the X-ray halos Mathews & Brighenti (2003). SN heating can be similar to the radiative cooling losses in some elliptical galaxies (Voit et al., 2020), and it also has been shown that SN explosions can facilitate precipitation, as well as driving turbulence in elliptical galaxies (Li et al., 2020a, b).
The lack of a hot halo detection in some of the extended rotating disks can be due to the angular momentum effect of the galaxy on the existence of a hot atmosphere. In this sense, angular momentum reduces the hot gas density, lowering the X-ray surface brightness and temperature in rotating galaxies to non-rotating galaxies, as shown by numerical simulations of group halos and individual ellipticals (e.g., Negri et al., 2014a, b; Gaspari et al., 2015). On the other hand, theoretical studies show that hot gas content and baryon fraction is more susceptible to feedback processes than clusters (e.g. Liang et al., 2016). A more likely explanation for the lack of hot gas in some systems arises from gas removal driven by SN winds (or also AGN-driven), which may be able to expel the gas up to 3–4 R200 at early times as shown by simulations (Liang et al., 2016). At the same, it is worth to note that several of these systems are expected to host halos emitting mainly in the very soft X-ray band, with current instruments having difficulty in retrieving strong constraints even with a deep exposure.
Werner et al. (2014) found similar peculiarities in their two disk-like systems of its BGG sample. The two sources are the X-ray faintest and, controversially, the strongest [CII] and H+[NII] emitter galaxies of their sample. However, the bolometric X-ray luminosity of these two sources is about ten times higher than of our extended gaseous disk-like sources. The authors also argue that hot gas may be more prone to condensation in rotating systems as rotational support may prevent gas from infalling, and thermal instabilities may develop more easily (see also Juráňová et al. 2019, 2020 for S0s rotating galaxies). Another option that could explain this dichotomy of high molecular mass and lack of IGrM medium in the extended disks is that these systems could be in a heating-dominated phase, where the IGrM gas has been recently heated up by either AGN-outbursts or SN heating, challenging the detection of the X-ray emitting gas. However, the low SFR (0.5 M yr-1), as well the lack of radio jets on these systems makes it less plausible. Note that even in the case that these galaxies do not have a hot halo detected, they could have it in the past. Thus the massive sink of raw material could have originated through previous cooling episodes.
Gaspari et al. (2015) investigate the influence of the large-scale rotating hot atmosphere in the AGN feedback and feeding. The simulations predict the formation of multiphase filaments when the turbulent Taylor number, , is below (turbulence-dominated), here and are the rotational velocity and velocity dispersion of the gas, respectively. As rotation is introduced in the hot atmosphere, the condensation shifts from turbulence-driven to rotationally-driven, leading to the formation of a central disk. As the rotation dominates, the accretion changes from clumpy disks with mild condensation when to a coherent rotating disk. The rotation suppresses the accretion onto the SMBH due to the angular momentum barrier, leading to a longer condensation onto the equatorial direction, when . The feedback is also very weak due to the angular momentum barrier, agreeing with the lack of radio jets in these systems. In the absence of major CCA rain, the extension of the rotating disks will be consistent with the duration of the condensation. In other words, the larger the disk, the longer the condensation cascade (Gaspari et al., 2017).
We compute the Taylor number profiles, assuming that the gaseous disks form out of the hot gas condensation. We obtained the rotational velocity, , by building a disk model using Barolo3D (Di Teodoro & Fraternali, 2015) that describes the kinematics of the ionized gas. While the velocity dispersion, , was measure as the average value in radial bins of 1. The radial profiles of of the extended and rotating disks shown in Fig. 15 (top panel) are consistent with the predictions from the simulations (Gaspari et al., 2015), as 1–3 over most of their extensions. At the inner region of some extended disks, is below 1 (Fig. 15), indicating that the disks are influenced by turbulence and could be raining. The galaxy dynamics could also increase the velocity dispersion of the gas at the center, decreasing the value. The radial profile of NGC 978, the compact disk, is 1–2 along most of the nebula (Fig. 15, middle panel), indicating a clumpy disk with mild condensation. In NGC 4261, the is 1 along the extension of the blueshifted NE and SW filaments (0.5 kpc) seen in Fig. 8. As for the filamentary structures identified in some of the extended rotating disks, the turbulent Taylor number, , is typical 3 as they follow the kinematics of the disk.
Lastly, in the case of the filamentary sources, the turbulent Taylor number, , is 1 since the kinematics is not dominated by rotation, then the rotational velocity is minimal. By assuming a conservative upper limit for the rotational velocity of km s-1 for the filamentary sources, we derived an upper limit for Taylor number of 1 along most of the optical emission-line gas (Fig. 15, bottom panel).
5.4.5 Predictions from CCA simulations
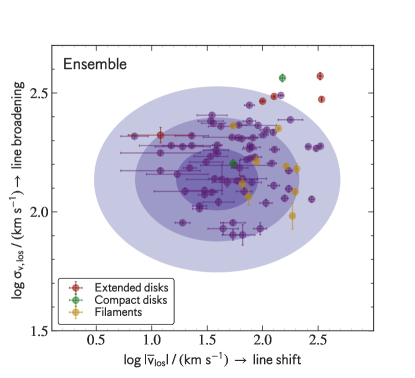
Simulations of CCA predict the cold gas to be in a certain location of the velocity shift versus velocity dispersion diagram (Gaspari et al., 2018). In Fig. 16, we compare observation from the ensemble region for our sample with prediction from the simulations. The ensemble gas, which comprises the kinematics of the cold gas at large scales from the AGN, gives us information on the macro-evolution of the global halo condensation. To compute the ensemble points displayed in Fig. 16, we followed the same procedure described in Sec 4 of Gaspari et al. (2018) performed for the VIMOS observations of 73 BCGs taking the Hamer et al. (2016) sample. We found that the ensemble gas observations are consistent with that of H+[NII] ensemble detection in other BCGs and BGGs (purple points) from Hamer et al. (2014) sample, as well with the prediction from the CCA simulations (purple shaded regions). As for the rotating disks, the ensemble gas detection is slightly deviated to a higher velocity shift compared to the predictions, as expected in rotating-driven systems (see also Maccagni et al. 2021). The shift is mainly produced by the large velocity gradient observed in the those disks.
This finding suggests a tight correlation between the turbulent hot atmosphere and colder gas phases (Gaspari et al., 2018). The data points for our BGG sample predict values for the hot gas turbulence. These predictions can be tested in the near future with the upcoming X-IFU satellites (such as XRIMS and Athena).
5.4.6 Stimulated feedback and AGN-driven outflows
Based on the observed spatial distribution of the molecular gas flows around the radio bubbles or X-ray cavities in several galaxy clusters, several authors proposed the uplifting mechanism or so-called stimulated feedback model (see Revaz et al. 2008; Pope et al. 2010; Li & Bryan 2014; McNamara et al. 2016; Qiu et al. 2020, 2021). In this model, the cold molecular clouds condense from the uplifted X-ray low-entropy gas in the wake of the radio bubbles inflated by the central AGN. As a result, the uplifted X-ray low-entropy gas will become thermally unstable, and it will develop a multiphase gas at an altitude where the ratio of the cooling time over the infall time, tcool/tinfall, is below or close to unity.
The interaction between the AGN bubbles and the ionized gas has been observed in a few of our sources with filamentary structures (previously mentioned in Section 5.2). The most remarkable cases are seen in NGC 5846 and NGC 193, and potentially in NGC 677, where the H network of filaments trails the wake of the X-ray cavities. Comparable features have been observed previously in other galaxy groups, such as NGC 5044, and NGC 4636 (David et al., 2014; Werner et al., 2014; Temi et al., 2018). Note that higher-sensitivity X-ray observations are needed to detect potential X-ray cavities on the fainter X-ray galaxy groups. Alternatively, other bands (such as radio SZ) can be used to further probe cavities (e.g., Yang et al., 2019). It is also possible that the cold gas condensation may not need radio jets (or cavities), but when present, there is clear evidence that it enhances the precipitation. Additionally, spatial distribution of the ionized gas correlates with the one from the radio emission in some sources as discussed in Section 5.2, indicating that the AGN feedback may play a role in the gas condensation.
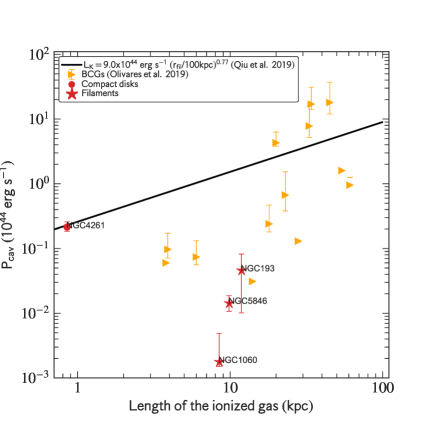
In the context of radiatively cooling AGN-driven outflows (Qiu et al., 2020), simulations by Qiu et al. (2019) find a positive correlation between the AGN feedback power and the spatial filaments extent (see Fig 17, solid black line). We plot this relation for our sample using cavity power, , as a proxy for the AGN feedback power from Kolokythas et al. (2018) for the four BGGs with confirmed X-ray cavities (red stars). For a comparison, we have also included 12 BCGs from Olivares et al. (2019) (yellow inverted triangles). As shown in Fig 17, the BGGs rarely sit along the relation except for NGC 4261, a very compact system with a mighty AGN. The cavity powers of the BGGs are a few orders of magnitude below the predicted values by the simulations. The BCGs tend to follow a bit more the relation, albeit the scatter is still substantial. We recall that the correlation was found in simulations of galaxy clusters, in which the AGN feedback is thought to be well coupled to the ICM, as well they do not include the effect of possible mergers and stirring by orbital galaxies (see Section 5.3.4 of Sarazin 1988, and references therein). In summary, the lack of a tight and significant correlation shows that AGN-outflow condensation likely plays a sub-dominant role.
5.5 Evolutionary transition?
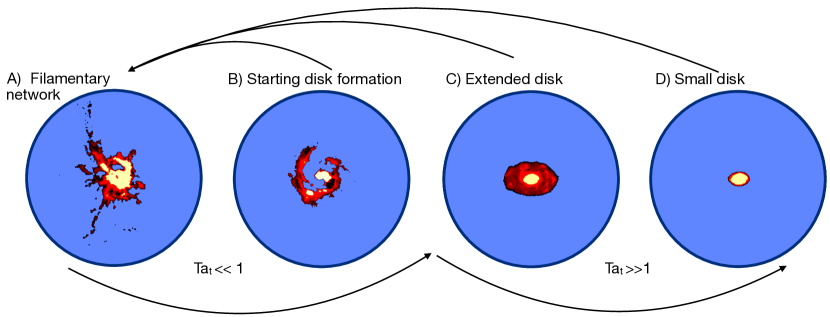
In figure 18, we propose a possible evolutionary transition to explain the variety of ionized gas distributions in our sample. This evolutionary transition for the cold gas is consistent with an extensive suite of high-resolution hydrodynamical simulations (Gaspari, 2015; Gaspari et al., 2015). In this scenario, the hot gas cools via CCA or stimulated feedback, forming (i) multiphase filaments via thermal instabilities. At this stage, the turbulence drives the dynamics of the gas if the turbulent Taylor number T1 (Gaspari et al., 2015). The filamentary phase is likely to be the longest, based on the large fraction of systems (56%) found in our sample that stands in this phase. As the gas precipitates (ii), the filaments experience chaotic collisions at the inner region of the galaxy, boosting the accretion rate. As a consequence, the turbulence drops, the turbulent Taylor number becomes T, and the thermal instabilities become weaker, resulting in the formation of a (iii) gaseous disk. In this systems the feeding is not efficient due to the angular momentum barrier, thus the feedback is also very weak, allowing for longer condensation sink from the hot halo onto the expanding equatorial. Star formation is more likely to be detected at this stage. This extended disk phase is potentially shorter (28%) than the filamentary stage. The star formation may provide some feedback and limit the cooling. More importantly, the angular momentum lowers the X-ray surface brightness, making it more difficult to detect the X-ray halo in this phase, as well as preventing the cold gas from being rapidly accreted. The residual is a quiescent, (iv) compact disk, poor in molecular gas and star formation. The compact disk phase is likely very short (11%). Later during this stage, the cold gas will be accreted onto the SMBH, potentially triggering the jets (as seen in NGC 4261), and may restart hot gas cooling (see also Wang et al. 2018). As previously mentioned, there are maybe some exceptions where the origin of the gas is not clear, such as NGC 584, where an X-ray halo has not been detected.
In principle, the evolutionary transition might be explained the other way around, starting with disks or compact structures to extended filamentary structures (see upper arrows in Fig 18): as the cold gas accumulates at the center of the BGG and feeds the central engine, an AGN outburst is triggered which expels some of the ionized gas to further distances, forming extended filamentary structures as suggested by AGN-driven outflow models (Revaz et al., 2008; Pope et al., 2010; Li & Bryan, 2014; McNamara et al., 2016; Beckmann et al., 2019; Qiu et al., 2020, 2021). However, the direct uplift of cold gas is extremely difficult to achieve given the large mass ratio between the cold gas and the very light jet (akin to moving a brick with wind).
The systems presented in this work are likely at different stages of the AGN feedback cycle. It has been shown that the duty cycle can be pretty irregular and even shorter in groups compared to clusters, on the order of a few 10s Myr (e.g., Gaspari et al., 2011; Sharma et al., 2012; Prasad et al., 2015; Wang et al., 2018). This could be reflected in the complex and diverse range of optical morphologies and properties presented in this work.
6 Conclusion
This paper presents the morphology and kinematics of the ionized gas and stars using MUSE observations of 18 BGGs selected from the high-richness CLoGS sub-sample. Characterizing the properties of the ionized gas in galaxy group cores is an important aspect to develop a complete picture of the nature of the accretion of the cold gas in groups and clusters. We summarize our main findings below:
-
1.
The optical emitting gas shows filamentary structures in most (10/18) of the sources of our sample, with a variety of shapes and projected sizes, 3–12 kpc, similar to what we found in the central cluster galaxies. The projected sizes of the filaments in groups are shorter than those found in central cluster galaxies, consistent with the different sizes of the condensation regions of the hot halos (McDonald et al., 2011a). Another significant difference with cluster galaxies is the presence of several (7/18) disks and rings dominated structures found in our sample, of which two disks are very compact, 1–3 kpc, whereas the rest of the disks can reach projected sizes of up to 21 kpc. The extended disks also reveal clumpy rings and extended structures. The velocity structure of the ionized gas in the sources with filaments is often chaotic, but some shallow velocity gradients are noticed along some filaments. The velocity dispersion maps of the ionized gas show a peak towards the center of the galaxy. The velocity dispersion peak is generally consistent with the peak of the gas emission, with values of 100–300 km s-1, although it can be below 100 km s-1 on the filaments and rings, similar to what we find in clusters of galaxies. Both chaotic kinematics and increased central velocity dispersion are consistent with the macro-scale CCA rain and inner related inelastic collisions.
-
2.
The stellar kinematics of the BGGs in our sample seem to be rotation-dominated compared to BCGs where the stars are consistent with random motions (Hamer et al., 2016). At least 14 of the 18 systems (78%) show some sign of rotation within their stellar light. Only in four sources (22%), is the stellar component dominated by random motions. The velocity field of the stellar light varies for each system and ranges from 40 and up to 350 km s-1.
-
3.
In most cases, the ionized gas is kinematically decoupled from the stellar component. In three of the rotation-dominated systems (3/7), the ionized gas is kinematically coupled (including one disk that may be tilted by at least 10); whereas four systems (4/7) are dynamically decoupled. In one of these disks, the gas and the stellar component are counter-rotating. This all indicates that in most cases the stellar population and the ionized gas are not associated, supporting an external origin of the gas.
-
4.
We find that the H luminosity correlates strongly with the cold molecular gas. Moreover, the scatter on this relation is highly reduced by 0.5 dex when these two physical quantities are measured on the same aperture in both galaxy clusters and groups. As shown for galaxy cluster cores, this tight correlation suggests a common origin for these two gas phases.
-
5.
According to the tcool/teddy ratios, and central entropies values of the X-ray atmosphere, at least 11 sources in the sample are possibly cooling gas from their hot atmospheres via thermal instabilities. They all correspond to filaments, compact disk-dominated sources, and one extended rotating disk (NGC 1453). The only exception is NGC 584 (a filamentary source), where X-ray observations do not detect a thermal emission, likely because of sensitivity limits. However, a merger origin can not be ruled out. Besides, we find the -ratio () criterion is a more reliable threshold to unveil the condensation rain.
-
6.
NGC 1587 shows signs of tidal interaction with its elliptical neighbor. Accordingly, we suspect that at least a fraction, if not all, of the colder gas detected in this source, may have been acquired through a galaxy interaction. Still, based on the condensation criteria, the IGrM is also compatible with gas cooling.
-
7.
The larger fraction of rotating disks in central group galaxies than in clusters may hint towards a non-negligible contribution of mergers or gas stripped from cosmological satellites, that are more prone to happen in low-mass halos (extended gas disks are found in systems where the IGrM is not detected by the current X-ray observations and they lack radio-jets). We thus discuss the possibility that the presence of extended disks could trace a less intense cooling phase of the feedback, likely allowing for a longer condensation sink from the hot halos. The latter is consistent with the turbulent Taylor number, , which indicates such condensation may occur on non-radial orbits, gradually forming a disk.
-
8.
As supported by high-resolution hydrodynamical simulations (see Gaspari 2016, for a review), we propose a possible evolutionary sequence for the multiphase gas: the filaments first condense out of the hot gas via CCA, followed by a transitional episode, where the gaseous threads will start to accrete onto the center to form a massive extended kiloparsec rotating star-forming disk in the galaxy. The raw material of the disk can then be consumed either by star formation activity (which can also provide feedback) or by fueling the center of the AGN, leading to a compact and quiescent rotating disk.
Acknowledgements.
This work was supported by the ANR grant LYRICS (ANR-16-CE31-0011). Based on observations collected at the European Organisation for Astronomical Research in the Southern Hemisphere under ESO programme 097.A-0366(A), and/or data products created thereof. M.G. acknowledges partial support by NASA Chandra GO9-20114X and HST GO-15890.020/023-A. E.O’S. acknowledges support from NASA through XMM-Newton award 80NSSC19K1056. PL (contract DL57/2016/CP1364/CT0010) is supported by national funds through Fundação para a Ciência e Tecnologia (FCT) and the Centro de Astrofísica da Universidade do Porto (CAUP).References
- Babyk et al. (2019) Babyk, I. V., McNamara, B. R., Tamhane, P. D., et al. 2019, ApJ, 887, 149
- Beckmann et al. (2019) Beckmann, R. S., Dubois, Y., Guillard, P., et al. 2019, A&A, 631, A60
- Bildfell et al. (2008) Bildfell, C., Hoekstra, H., Babul, A., & Mahdavi, A. 2008, MNRAS, 389, 1637
- Bogdán et al. (2014) Bogdán, Á., van Weeren, R. J., Kraft, R. P., et al. 2014, The Astrophysical Journal, 782, L19
- Boizelle et al. (2021) Boizelle, B. D., Walsh, J. L., Barth, A. J., et al. 2021, The Astrophysical Journal, 908, 19
- Bournaud et al. (2004) Bournaud, F., Duc, P. A., Amram, P., Combes, F., & Gach, J. L. 2004, A&A, 425, 813
- Bregman et al. (2005) Bregman, J. N., Miller, E. D., Athey, A. E., & Irwin, J. A. 2005, ApJ, 635, 1031
- Bregman & Parriott (2009) Bregman, J. N. & Parriott, J. R. 2009, ApJ, 699, 923
- Bryant et al. (2019) Bryant, J. J., Croom, S. M., van de Sande, J., et al. 2019, MNRAS, 483, 458
- Canning et al. (2013) Canning, R. E. A., Sun, M., Sanders, J. S., et al. 2013, MNRAS, 435, 1108
- Cappellari (2017) Cappellari, M. 2017, MNRAS, 466, 798
- Cappellari & Copin (2003) Cappellari, M. & Copin, Y. 2003, MNRAS, 342, 345
- Cavagnolo et al. (2008) Cavagnolo, K. W., Donahue, M., Voit, G. M., & Sun, M. 2008, ApJ, 683, L107
- Ciocan et al. (2021) Ciocan, B. I., Ziegler, B. L., Verdugo, M., et al. 2021, A&A, 649, A23
- Crocker et al. (2011) Crocker, A. F., Bureau, M., Young, L. M., & Combes, F. 2011, MNRAS, 410, 1197
- David et al. (2014) David, L. P., Lim, J., Forman, W., et al. 2014, ApJ, 792, 94
- David et al. (2017) David, L. P., Vrtilek, J., O’Sullivan, E., et al. 2017, ApJ, 842, 84
- Davies & Birkinshaw (1986) Davies, R. L. & Birkinshaw, M. 1986, ApJ, 303, L45
- Davis et al. (2011) Davis, T. A., Alatalo, K., Sarzi, M., et al. 2011, MNRAS, 417, 882
- Davis et al. (2019) Davis, T. A., Greene, J. E., Ma, C.-P., et al. 2019, MNRAS, 486, 1404
- de Vaucouleurs et al. (1991) de Vaucouleurs, G., de Vaucouleurs, A., Corwin, Herold G., J., et al. 1991, Third Reference Catalogue of Bright Galaxies (Springer)
- Di Teodoro & Fraternali (2015) Di Teodoro, E. M. & Fraternali, F. 2015, MNRAS, 451, 3021
- Dong et al. (2010) Dong, R., Rasmussen, J., & Mulchaey, J. S. 2010, The Astrophysical Journal, 712, 883
- Edge (2001) Edge, A. 2001, MNRAS, 328, 762
- Edge et al. (2002) Edge, A. C., Wilman, R. J., Johnstone, R. M., et al. 2002, MNRAS, 337, 49
- Eliche-Moral et al. (2010) Eliche-Moral, M. C., González-García, A. C., Balcells, M., et al. 2010, in American Institute of Physics Conference Series, Vol. 1240, American Institute of Physics Conference Series, ed. V. P. Debattista & C. C. Popescu, 237–238
- Fabian (2012) Fabian, A. 2012, ARA&A, 50, 455
- Garcia (1993) Garcia, A. M. 1993, A&AS, 100, 47
- Gaspari (2015) Gaspari, M. 2015, Proceedings of the International Astronomical Union, 11, 17
- Gaspari (2016) Gaspari, M. 2016, in Galaxies at High Redshift and Their Evolution Over Cosmic Time, ed. S. Kaviraj, Vol. 319, 17–20
- Gaspari et al. (2015) Gaspari, M., Brighenti, F., & Temi, P. 2015, A&A, 579, A62
- Gaspari et al. (2019) Gaspari, M., Eckert, D., Ettori, S., et al. 2019, ApJ, 884, 169
- Gaspari et al. (2018) Gaspari, M., McDonald, M., Hamer, S. L., et al. 2018, ApJ, 854, 167
- Gaspari et al. (2011) Gaspari, M., Melioli, C., Brighenti, F., & D’Ercole, A. 2011, MNRAS, 411, 349
- Gaspari et al. (2013) Gaspari, M., Ruszkowski, M., & Oh, S. P. 2013, Monthly Notices of the Royal Astronomical Society, 432, 3401
- Gaspari et al. (2012) Gaspari, M., Ruszkowski, M., & Sharma, P. 2012, ApJ, 746, 94
- Gaspari et al. (2017) Gaspari, M., Temi, P., & Brighenti, F. 2017, MNRAS, 466, 677
- Gaspari et al. (2020) Gaspari, M., Tombesi, F., & Cappi, M. 2020, Nature Astronomy, 4, 10
- Gendron-Marsolais et al. (2018) Gendron-Marsolais, M., Hlavacek-Larrondo, J., Martin, T. B., et al. 2018, MNRAS, 479, L28
- Giacintucci et al. (2011) Giacintucci, S., O’Sullivan, E., Vrtilek, J., et al. 2011, The Astrophysical Journal, 732, 95
- Hamer et al. (2014) Hamer, S. L., Edge, A. C., Swinbank, A. M., et al. 2014, MNRAS, 437, 862
- Hamer et al. (2016) Hamer, S. L., Edge, A. C., Swinbank, A. M., et al. 2016, MNRAS, 460, 1758
- Hamer et al. (2018) Hamer, S. L., Fabian, A. C., Russell, H. R., et al. 2018, MNRAS, 483, 4984
- Hatch et al. (2007) Hatch, N. A., Crawford, C. S., & Fabian, A. C. 2007, MNRAS, 380, 33
- Heckman et al. (1989) Heckman, T. M., Baum, S. A., van Breugel, W. J. M., & McCarthy, P. 1989, ApJ, 338, 48
- Hitomi Collaboration et al. (2016) Hitomi Collaboration, Aharonian, F., Akamatsu, H., et al. 2016, Nature, 535, 117
- Ho & Ulvestad (2001) Ho, L. C. & Ulvestad, J. S. 2001, ApJS, 133, 77
- Hogan et al. (2017) Hogan, M. T., McNamara, B. R., Pulido, F. A., et al. 2017, ApJ, 851, 66
- Hudson et al. (2010) Hudson, D. S., Mittal, R., Reiprich, T. H., et al. 2010, A&A, 513, A37
- Jung (2021) Jung, L. 2021
- Juráňová et al. (2019) Juráňová, A., Werner, N., Gaspari, M., et al. 2019, MNRAS, 484, 2886
- Juráňová et al. (2020) Juráňová, A., Werner, N., Nulsen, P. E. J., et al. 2020, MNRAS, 499, 5163
- Kennicutt (1998) Kennicutt, Jr., R. C. 1998, ApJ, 498, 541
- King & Pringle (2006) King, A. R. & Pringle, J. E. 2006, MNRAS, 373, L90
- Kolokythas et al. (2015) Kolokythas, K., O’Sullivan, E., Giacintucci, S., et al. 2015, MNRAS, 450, 1732
- Kolokythas et al. (2018) Kolokythas, K., O’Sullivan, E., Raychaudhury, S., et al. 2018, MNRAS, 481, 1550
- Krajnović et al. (2006) Krajnović, D., Cappellari, M., de Zeeuw, P. T., & Copin, Y. 2006, MNRAS, 366, 787
- Lagos et al. (2015) Lagos, C. d. P., Padilla, N. D., Davis, T. A., et al. 2015, MNRAS, 448, 1271
- Lakhchaura et al. (2018) Lakhchaura, K., Werner, N., Sun, M., et al. 2018, MNRAS, 481, 4472
- Li et al. (2020a) Li, M., Li, Y., Bryan, G. L., Ostriker, E. C., & Quataert, E. 2020a, The Astrophysical Journal, 894, 44
- Li et al. (2020b) Li, M., Li, Y., Bryan, G. L., Ostriker, E. C., & Quataert, E. 2020b, The Astrophysical Journal, 898, 23
- Li & Bryan (2014) Li, Y. & Bryan, G. L. 2014, ApJ, 789, 153
- Li et al. (2015) Li, Y., Bryan, G. L., Ruszkowski, M., et al. 2015, ApJ, 811, 73
- Li et al. (2020) Li, Y., Gendron-Marsolais, M.-L., Zhuravleva, I., et al. 2020, ApJ, 889, L1
- Liang et al. (2016) Liang, L., Durier, F., Babul, A., et al. 2016, MNRAS, 456, 4266
- Lim et al. (2008) Lim, J., Ao, Y., & Dinh‐V‐Trung. 2008, ApJ, 672, 252
- Loubser et al. (2016) Loubser, S. I., Babul, A., Hoekstra, H., et al. 2016, 456, 1565
- Loubser et al. (2018) Loubser, S. I., Hoekstra, H., Babul, A., & O’Sullivan, E. 2018, MNRAS, 477, 335
- Maccagni et al. (2021) Maccagni, F. M., Serra, P., Gaspari, M., et al. 2021, arXiv e-prints, arXiv:2108.05247
- Macchetto et al. (1996) Macchetto, F., Pastoriza, M., Caon, N., et al. 1996, A&AS, 120, 463
- Machacek et al. (2011) Machacek, M. E., Jerius, D., Kraft, R., et al. 2011, ApJ, 743, 15
- Makarov et al. (2014) Makarov, D., Prugniel, P., Terekhova, N., Courtois, H., & Vauglin, I. 2014, A&A, 570, A13
- Mathews & Brighenti (2003) Mathews, W. G. & Brighenti, F. 2003, Annual Review of Astronomy and Astrophysics, 41, 191
- Mazzuca et al. (2006) Mazzuca, L. M., Sarzi, M., Knapen, J. H., Veilleux, S., & Swaters, R. 2006, ApJ, 649, L79
- McCourt et al. (2012) McCourt, M., Sharma, P., Quataert, E., & Parrish, I. J. 2012, MNRAS, 419, 3319
- McDonald et al. (2012) McDonald, M., Bayliss, M., Benson, B. A., et al. 2012, Nature, 488, 349
- McDonald et al. (2011a) McDonald, M., Veilleux, S., & Mushotzky, R. 2011a, ApJ, 731, 33
- McDonald et al. (2010) McDonald, M., Veilleux, S., Rupke, D. S. N., & Mushotzky, R. 2010, ApJ, 721, 1262
- McDonald et al. (2011b) McDonald, M., Veilleux, S., Rupke, D. S. N., Mushotzky, R., & Reynolds, C. 2011b, ApJ, 734, 95
- McNamara et al. (2006) McNamara, B. R., Rafferty, D. A., Birzan, L., et al. 2006, ApJ, 648, 164
- McNamara et al. (2016) McNamara, B. R., Russell, H. R., Nulsen, P. E. J., et al. 2016, ApJ, 830, 79
- Negri et al. (2014a) Negri, A., Ciotti, L., & Pellegrini, S. 2014a, MNRAS, 439, 823
- Negri et al. (2014b) Negri, A., Posacki, S., Pellegrini, S., & Ciotti, L. 2014b, MNRAS, 445, 1351
- North et al. (2021) North, E. V., Davis, T. A., Bureau, M., et al. 2021, MNRAS, 503, 5179
- O’Donnell (1994) O’Donnell, J. E. 1994, ApJ, 422, 158
- Olivares et al. (2019) Olivares, V., Salome, P., Combes, F., et al. 2019, A&A, 631, A22
- Oppenheimer et al. (2021) Oppenheimer, B. D., Babul, A., Bahé, Y., Butsky, I. S., & McCarthy, I. G. 2021, Universe, 7, 209
- O’Sullivan et al. (2015) O’Sullivan, E., Combes, F., Hamer, S., et al. 2015, A&A, 573, A111
- O’Sullivan et al. (2018) O’Sullivan, E., Combes, F., Salomé, P., et al. 2018, Astronomy & Astrophysics, 618, A126
- O’Sullivan et al. (2001) O’Sullivan, E., Forbes, D. A., & Ponman, T. J. 2001, MNRAS, 328, 461
- O’Sullivan et al. (2018) O’Sullivan, E., Kolokythas, K., Kantharia, N. G., et al. 2018, MNRAS, 473, 5248
- O’Sullivan et al. (2017) O’Sullivan, E., Ponman, T. J., Kolokythas, K., et al. 2017, MNRAS, 472, 1482
- O’Sullivan et al. (2005) O’Sullivan, E., Vrtilek, J. M., & Kempner, J. C. 2005, ApJ, 624, L77
- O’Sullivan et al. (2011) O’Sullivan, E., Worrall, D. M., Birkinshaw, M., et al. 2011, Monthly Notices of the Royal Astronomical Society, 416, 2916
- Panagoulia et al. (2014) Panagoulia, E. K., Fabian, A. C., Sanders, J. S., & Hlavacek-Larrondo, J. 2014, MNRAS, 444, 1236
- Parriott & Bregman (2008) Parriott, J. R. & Bregman, J. N. 2008, ApJ, 681, 1215
- Pipino et al. (2009) Pipino, A., Kaviraj, S., Bildfell, C., et al. 2009, 395, 462
- Pizzolato & Soker (2005) Pizzolato, F. & Soker, N. 2005, ApJ, 632, 821
- Poole et al. (2006) Poole, G. B., Fardal, M. A., Babul, A., et al. 2006, MNRAS, 373, 881
- Pope et al. (2010) Pope, E. C. D., Babul, A., Pavlovski, G., Bower, R. G., & Dotter, A. 2010, MNRAS, 406, 2023
- Prasad et al. (2015) Prasad, D., Sharma, P., & Babul, A. 2015, The Astrophysical Journal, 811, 108
- Prasad et al. (2018) Prasad, D., Sharma, P., & Babul, A. 2018, ApJ, 863, 62
- Prasad et al. (2020) Prasad, D., Sharma, P., Babul, A., Voit, G. M., & O’Shea, B. W. 2020, MNRAS, 495, 594
- Prieur (1990) Prieur, J. L. 1990, Status of shell galaxies., ed. R. Wielen, 72–83
- Pulido et al. (2018) Pulido, F. A., McNamara, B. R., Edge, A. C., et al. 2018, ApJ, 853, 177
- Qiu et al. (2019) Qiu, Y., Bogdanović, T., Li, Y., & McDonald, M. 2019, ApJ, 872, L11
- Qiu et al. (2020) Qiu, Y., Bogdanović, T., Li, Y., McDonald, M., & McNamara, B. R. 2020, Nature Astronomy, 4, 900
- Qiu et al. (2021) Qiu, Y., Hu, H., Inayoshi, K., et al. 2021, ApJ, 917, L7
- Rafferty et al. (2008a) Rafferty, D. A., McNamara, B. R., & Nulsen, P. E. J. 2008a, ApJ, 687, 899
- Rafferty et al. (2008b) Rafferty, D. A., McNamara, B. R., & Nulsen, P. E. J. 2008b, ApJ, 687, 899
- Revaz et al. (2008) Revaz, Y., Combes, F., & Salomé, P. 2008, Astronomy & Astrophysics, 477, L33
- Rose et al. (2019) Rose, T., Edge, A. C., Combes, F., et al. 2019, MNRAS, 489, 349
- Rose et al. (2019) Rose, T., Edge, A. C., Combes, F., et al. 2019, MNRAS, 485, 229
- Rose et al. (2020) Rose, T., Edge, A. C., Combes, F., et al. 2020, MNRAS, 496, 364
- Russell et al. (2013) Russell, H. R., McNamara, B. R., Edge, A. C., et al. 2013, MNRAS, 432, 530
- Russell et al. (2019) Russell, H. R., McNamara, B. R., Fabian, A. C., et al. 2019, MNRAS, 490, 3025
- Salomé & Combes (2003) Salomé, P. & Combes, F. 2003, A&A, 412, 657
- Sarazin (1988) Sarazin, C. L. 1988, X-ray emission from clusters of galaxies (Cambridge University Press)
- Saviane et al. (2008) Saviane, I., Momany, Y., Da Costa, G. S., Rich, R. M., & Hibbard, J. E. 2008, ApJ, 678, 179
- Schellenberger et al. (2020) Schellenberger, G., David, L. P., Vrtilek, J., et al. 2020, ApJ, 894, 72
- Schlegel et al. (1998) Schlegel, D. J., Finkbeiner, D. P., & Davis, M. 1998, ApJ, 500, 525
- Sharma et al. (2012) Sharma, P., McCourt, M., Quataert, E., & Parrish, I. J. 2012, MNRAS, 420, 3174
- Soto et al. (2016) Soto, K. T., Lilly, S. J., Bacon, R., Richard, J., & Conseil, S. 2016, MNRAS, 458, 3210
- Su et al. (2015) Su, Y., Irwin, J. A., White, Raymond E., I., & Cooper, M. C. 2015, ApJ, 806, 156
- Sun et al. (2009) Sun, M., Voit, G. M., Donahue, M., et al. 2009, ApJ, 693, 1142
- Temi et al. (2018) Temi, P., Amblard, A., Gitti, M., et al. 2018, ApJ, 858, 17
- Tremblay et al. (2018) Tremblay, G. R., Combes, F., Oonk, J. B. R., et al. 2018, Apj, 865, 13
- Tremonti et al. (2004) Tremonti, C. A., Heckman, T. M., Kauffmann, G., et al. 2004, ApJ, 613, 898
- Valdes et al. (2004) Valdes, F., Gupta, R., Rose, J. A., Singh, H. P., & Bell, D. J. 2004, ApJS, 152, 251
- Voit et al. (2020) Voit, G. M., Bryan, G. L., Prasad, D., et al. 2020, arXiv e-prints, arXiv:2006.09381
- Voit & Donahue (2011) Voit, G. M. & Donahue, M. 2011, ApJ, 738, L24
- Voit et al. (2017) Voit, G. M., Meece, G., Li, Y., et al. 2017, ApJ, 845, 80
- Voit et al. (2017) Voit, G. M., Meece, G., Li, Y., et al. 2017, The Astrophysical Journal, 845, 80
- Wang et al. (2018) Wang, C., Li, Y., & Ruszkowski, M. 2018, Monthly Notices of the Royal Astronomical Society, 482, 3576
- Werner et al. (2019) Werner, N., McNamara, B. R., Churazov, E., & Scannapieco, E. 2019, Space Sci. Rev., 215, 5
- Werner et al. (2014) Werner, N., Oonk, J. B. R., Sun, M., et al. 2014, MNRAS, 439, 2291
- Wittor & Gaspari (2020) Wittor, D. & Gaspari, M. 2020, MNRAS, 498, 4983
- Yang et al. (2019) Yang, H. Y. K., Gaspari, M., & Marlow, C. 2019, ApJ, 871, 6
- Young et al. (2008) Young, L. M., Bureau, M., & Cappellari, M. 2008, ApJ, 676, 317
- Young et al. (2011) Young, L. M., Bureau, M., Davis, T. A., et al. 2011, MNRAS, 414, 940
Appendix A Distribution and kinematics of the ionized gas
A.1 Compact and Extended Rotating Disks
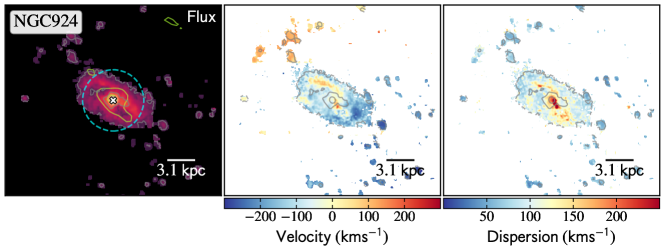
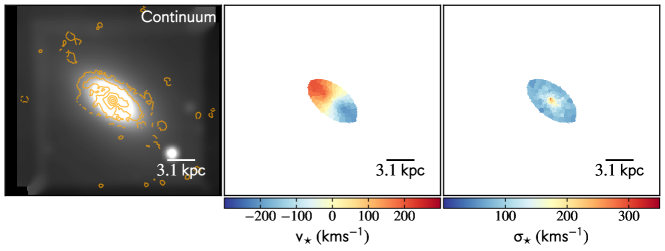
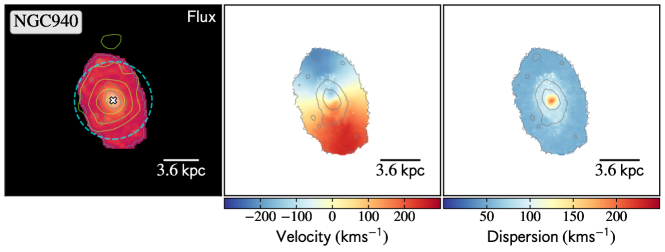
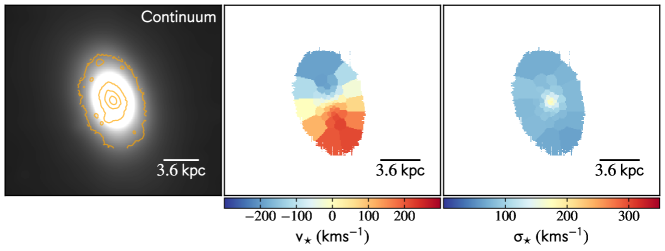
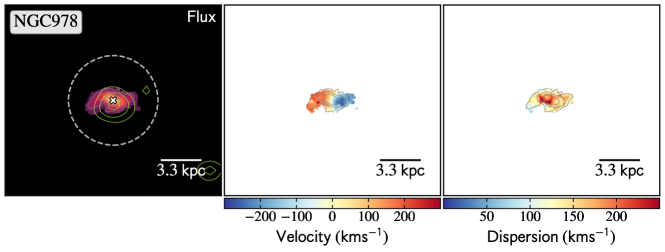
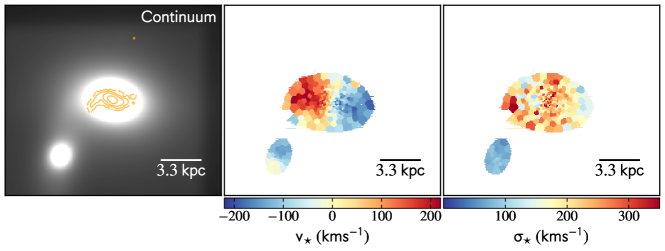

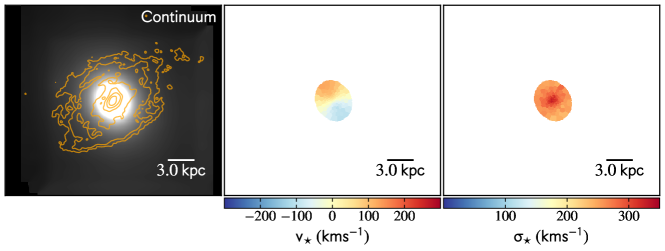
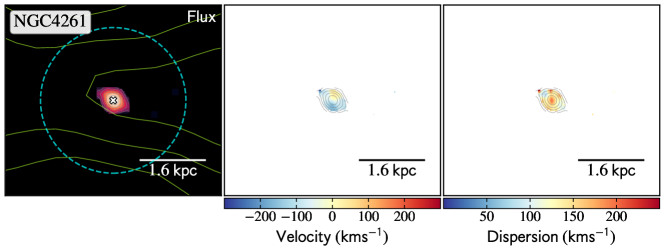
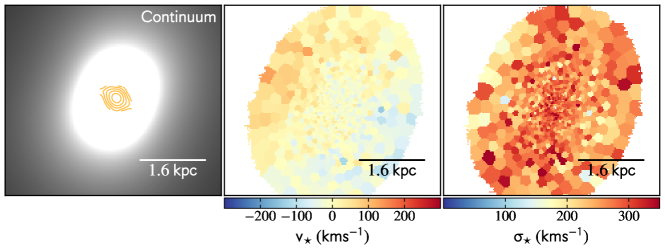
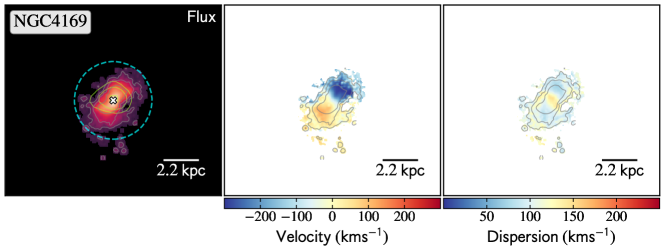
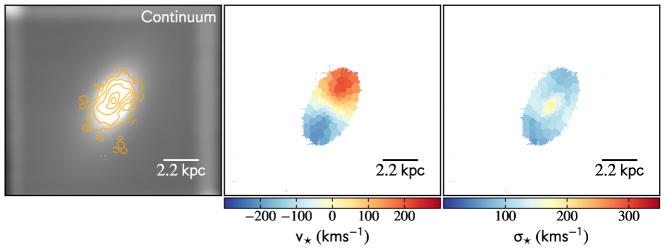
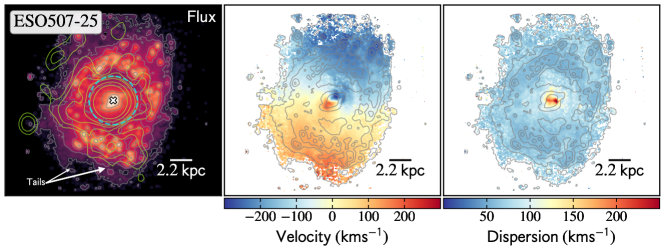
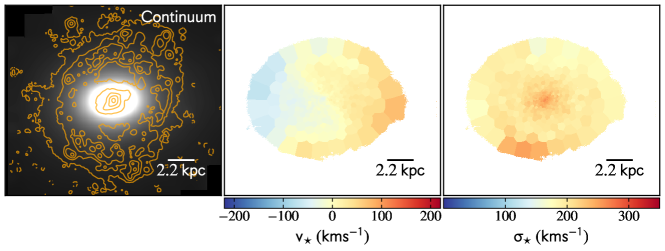
NGC 924 – NGC 924 shows a more complex kinematics. Ordered velocity structures are found along the inner 9 kpc (30) of the galaxy with a velocity range from 260 to 110 km s-1 from SE to NW. Around the rotating disk, a clumpy outer ring of gas is moving from 170 to 280 km s-1 located at 7.5 kpc (25) of the central disk. A few clumps located SE and NW of the disk are inflowing/outflowing of the inner disk with a velocity of 270 km s-1 and 120 km s-1, respectively.
NGC 940 – A smooth rotating disk of gas is detected centered on the AGN in NGC 940, with the gas moving from 300 to 170 km s-1 from NW to SE across 11 kpc. An inner nuclear disk of 2.5 kpc (7) is located in the inner region of the galaxy with a slightly different PA that the main extended rotating disk.
NGC 978 – The gas distribution in NGC 978 is a very compact. NGC 978 has a smooth velocity gradient from 210 to 180 km s-1 in the EW direction along 3.6 kpc (11). Small tails of ionized gas are detected to the SW and NE of the central disk following the kinematics of the disk.
NGC 1453 – Similarly, NGC 1453 shows a smooth velocity gradient from 300 to 360 km s-1 from North to South across 21 kpc. An inner compact disk of 3 kpc (9.5) of diameter, with a slightly different PA from that of the major disk, is found at the very center of the galaxy. Extended structures are seen in NGC 1453 located 9 kpc (30) at the NW the center of the galaxy, moving at 250 km s-1.
NGC 4261 – NGC 4261 reveals a very compact gas distributions. A compact rotating disk is detected in NGC 4261, with a velocity gradient from 150 up to 70 km s-1 across 0.5 kpc (3) along the SN axis (minor-axis). Additionally, some blueshifted gas is moving at 80 km s-1, towards the E and W directions from the galaxy center across 1 kpc. HST images reveal a dusty torus around the inner rotating disk of ionized gas (see Fig. 8).
NGC 4169 – The velocity field of NGC 4169 is moving from 150 to 280 km s-1 going from SE to NW across 4.8 kpc of extension, with some clumpy structure at 3 kpc (15) of the SE center. It also hosts some extended structures located 2.8 kpc (13) to the SW of the galaxy center, moving at 30 km s-1.
ESO 507-25 – This galaxy shows a nuclear rotating disk centered on the galaxy, with a velocity gradient from 150 to 250 km s-1 from the SE to the NW extending along 2.2 kpc (10.2). A ring structure is found misaligned with the inner disk, which exhibits a smooth velocity gradient from 260 to 210 km s-1 from the SE to the NW across 15 kpc of extension. Also, two tails of ionized gas are extending out of the ring to the SW moving at 160 km s-1 and 90 km s-1.
A.2 Compact and Extended Filaments
Filaments
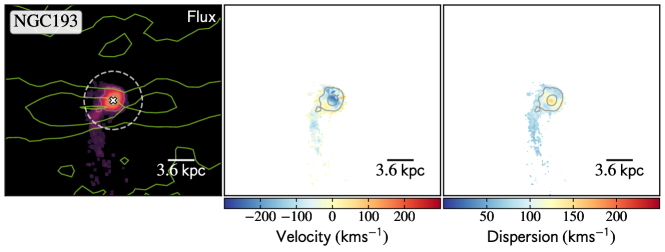
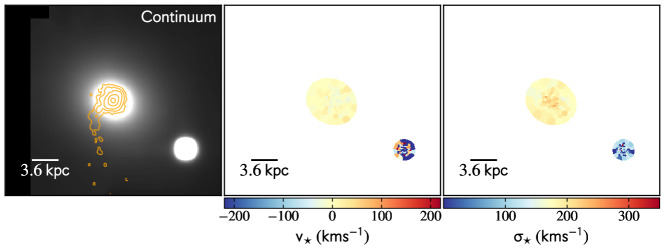

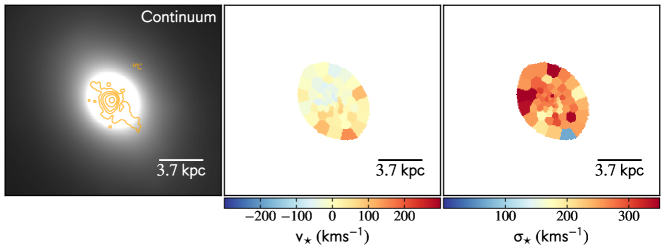
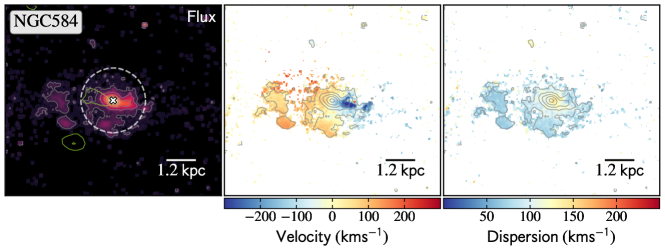
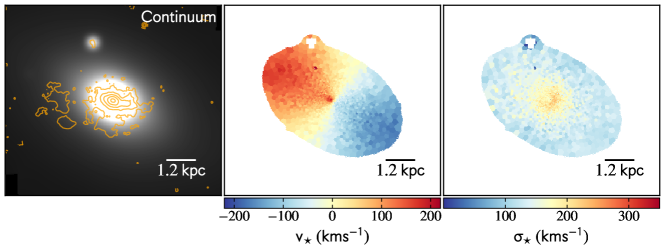
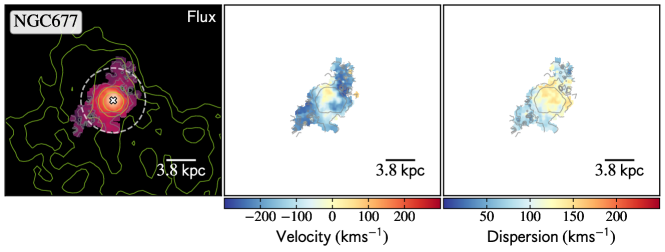
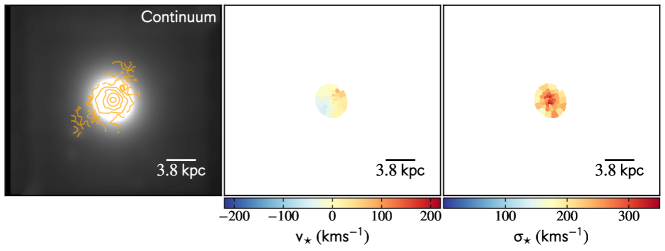
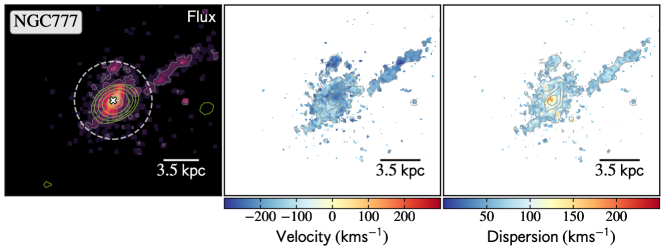
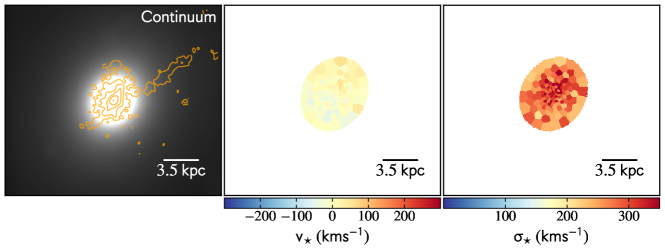
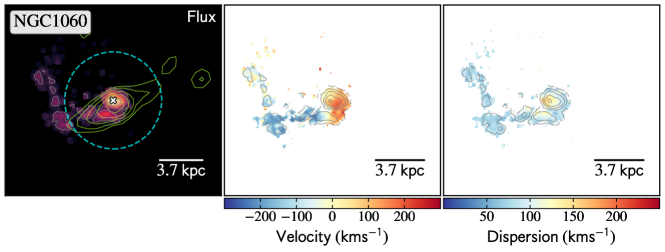
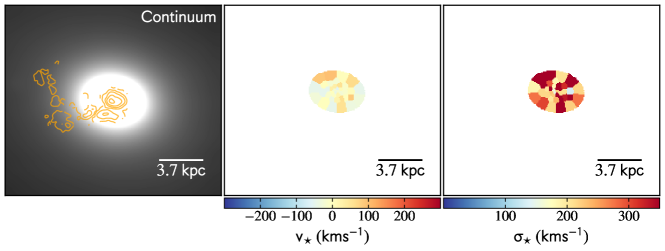


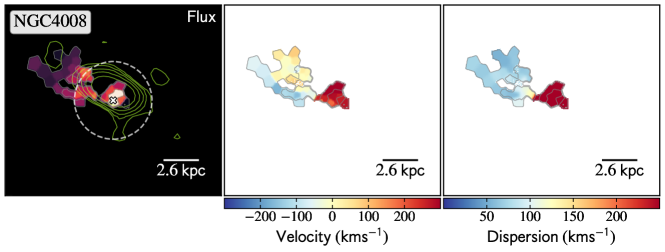
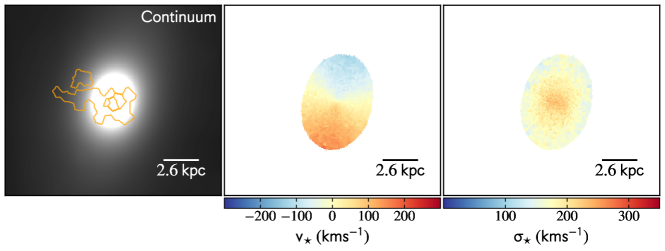
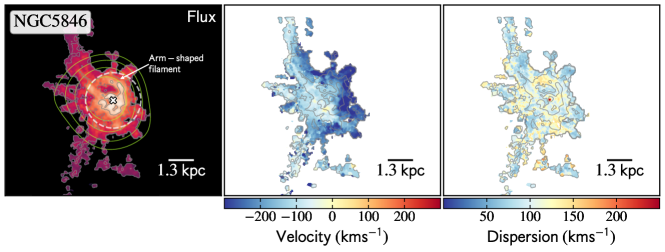
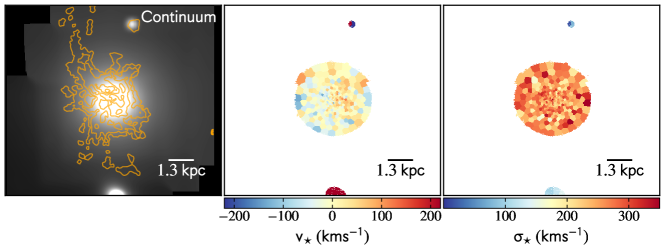
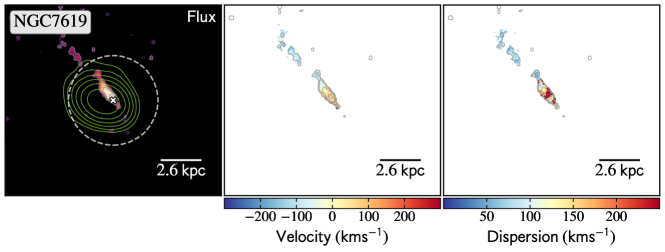
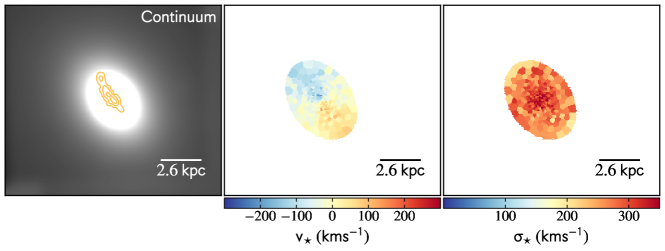
NGC 193 – In the central region of NGC 193, we note signs of gas rotation, with a velocity gradient going from 300 to 30 km s-1 across 3.5 kpc (10). This inner region is followed by a blueshifted velocity stream of ionized gas extending from 60 to 120 km s-1 towards the south direction of the galaxy. An X-ray cavity has been detected at the location of the SW filament from X-ray observations (O’Sullivan et al. 2017).
NGC 410 – hosts a stream of ionized gas with a smooth gradient going from NE to SW with a velocity from 50 to 400 km s-1.
NGC 584 – has a velocity field slightly dominated by rotation, with a velocity gradient from 150 to 300 km s-1 in the WE direction along with 5 kpc (50) in extension. However, the distribution of the ionized gas is quite perturbed and clumpy, with a few radial filaments.
NGC 677 – host complex set of filaments, with several clumpy structures at the center. A set of 5.6 kpc (15) overlapping filaments is found at southwest of the center that appears to be spiraling moving with a velocity of 180 km s-1 and 270 km s-1, and to the southeast with velocities of 150 km s-1. A faint 9.5 kpc(25) clumpy structures are seen at northeast of the galaxy center with similar velocities.
NGC 777 – there is indication of rotation along the SE–NW axis at the center, with a velocity gradient between 90 km s-1 to km s-1. The peak is followed by a 7.5 kpc (21) NW clumpy filament moving at about 170 km s-1, and a NE filament of 1.8 kpc (5) on size filament moving with a velocity of 270 km s-1.
NGC 1060 – Similarly, NGC 1060 have a smooth velocity gradient along its filament length. This clumpy ionized filament is moving to the EW with a velocity from 180 km s-1 at the peak of the emission to 130 km s-1, followed by another NE clumpy filament moving from 180 to 40 km s-1 along 3.5 kpc (10).
NGC 1587 – shows indications of rotation, but this is probably due to several thin filaments that are inflowing or outflowing toward the center of the galaxy. In this source, the ionized gas is moving from 280 to 80 km s-1 from NW to SE across 11 kpc (44) in a spiral form.
NGC 4008 – reveal three faint almost parallel NE filaments. The southern filament has a size of (9) and a velocity of 80 km s-1, the middle (3.5) and velocity of 20 km s-1, finally the northern filament has a length (5) and a velocity of km s-1.
NGC 5846 – NGC hosts a very complex net of clumpy filaments, and most of them are connected to the center. The clumpy “arm-shaped” filament follows the distribution of the knotty-rimmed X-ray cavities with a velocity 120–140 km s-1 along its (11) length. A very elongated (40) parallel net of clumpy filament is detected to the Northeast of the center moving at different velocities between 20 km s-1 km s-1, 100 km s-1, and 170 km s-1. There are some filaments coming out to the southeast of the galaxy center, in particular a very elongated filament (40) has a velocity of 80 km s-1 to 20 km s-1.
NGC 7619 – host an elongated (12) filament along the NE–SW axis. It has a shallow velocity gradient of 20 km s-1–40 km s-1. There is a fainter filament located 3.6 kpc (14) NE of the center moving with a projected velocity of roughly 90 km s-1.
Appendix B Double components
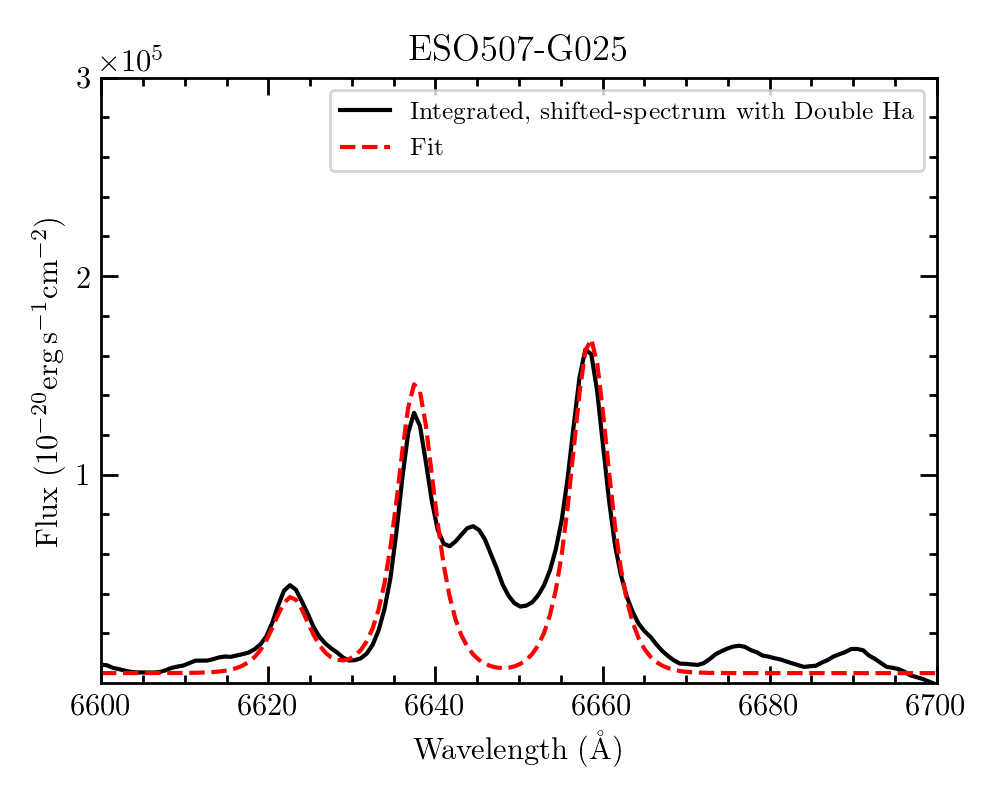
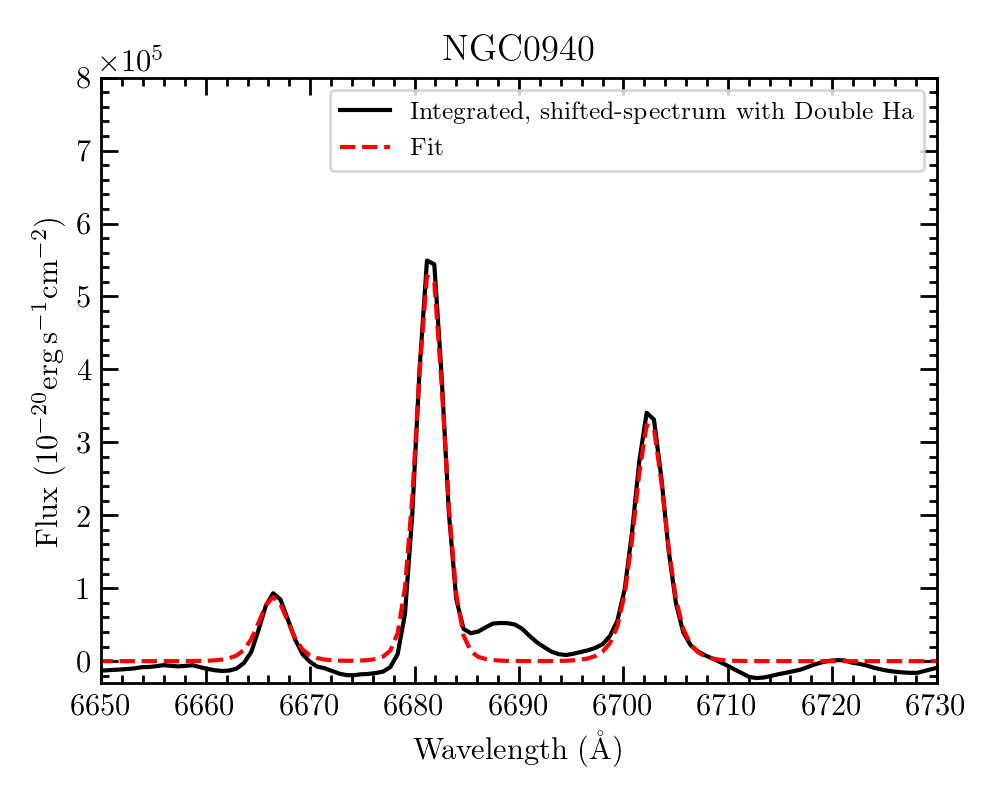
Appendix C Velocity dispersion of gas and stars
| BGG | ||||||
|---|---|---|---|---|---|---|
| () | () | () | () | () | ||
| (1) | (2) | (3) | (4) | (5) | (6) | (7) |
| Disks | ||||||
| NGC924 | 3301.5 | 912.0 | 288 | 94 | 203 | 2.17 |
| NGC940 | 1901.4 | 551.0 | 179 | 81 | 219 | 2.71 |
| NGC978 | 2502.0 | 824.0 | 401 | 210 | 227 | 1.08 |
| NGC1453 | 2491.5 | 1111.4 | 328 | 263 | 125 | 0.47 |
| NGC4169 | 1481.5 | 1040.6 | 190 | 112 | 208 | 1.86 |
| NGC4261 | 1951.1 | 1090.3 | 415 | 256 | 130 | 0.51 |
| ESO507-25 | 2781.5 | 551.0 | 264 | 197 | 73 | 0.37 |
| Filaments | ||||||
| NGC193 | 1591.5 | 893.0 | 517 | 183 | 34 | 0.18 |
| NGC410 | 1731.4 | 877.0 | 362 | 258 | 150 | 0.58 |
| NGC584 | 1621.6 | 855.0 | 246 | 135 | 298 | 2.21 |
| NGC677 | 1301.4 | 1184.0 | 322 | 228 | 79 | 0.35 |
| NGC777 | 1902.0 | 773.0 | 375 | 269 | 59 | 0.22 |
| NGC1060 | 1612.0 | 844.0 | 452 | 299 | 98 | 0.33 |
| NGC1587 | 1531.5 | 732.0 | 295 | 207 | 158 | 0.76 |
| NGC4008 | 2493.0 | 6610.0 | 258 | 131 | 172 | 1.31 |
| NGC5846 | 3071.5 | 1002.0 | 361 | 257 | 119 | 0.46 |
| NGC7619 | 2493.0 | 767.0 | 401 | 266 | 124 | 0.47 |
(2) Gas velocity dispersion measure at the central region of each source.
(3) Gas dispersion measure at one of the structures (e.g. filaments, disk and clumps).
(4) Central stellar velocity dispersion.
(5) Mean stellar dispersion measure from the dispersion map.
(6) Maximum stellar velocity measured from the stellar velocity map.
(7) Ratio of the maximum stellar velocity and the mean stellar dispersion.
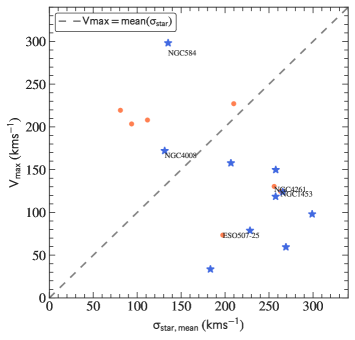
Appendix D Surface brightness profiles