A Taxonomy of Testable HTML5 Canvas Issues
Abstract
The HTML5 <canvas> is widely used to display high quality graphics in web applications. However, the combination of web, GUI, and visual techniques that are required to build <canvas> applications, together with the lack of testing and debugging tools, makes developing such applications very challenging. To help direct future research on testing <canvas> applications, in this paper we present a taxonomy of testable <canvas> issues. First, we extracted 2,403 <canvas>-related issue reports from 123 open source GitHub projects that use the HTML5 <canvas>. Second, we constructed our taxonomy by manually classifying a random sample of 332 issue reports. Our manual classification identified five broad categories of testable <canvas> issues, such as Visual and Performance issues. We found that Visual issues are the most frequent (35%), while Performance issues are relatively infrequent (5%). We also found that many testable <canvas> issues that present themselves visually on the <canvas> are actually caused by other components of the web application. Our taxonomy of testable <canvas> issues can be used to steer future research into <canvas> issues and testing.
Index Terms:
html5 canvas, web applications, issue taxonomy, issue reports1 Introduction
The HTML5 <canvas> allows the rendering of high quality graphics in web applications. The Canvas API and WebGL API each provide JavaScript methods for drawing graphics on the HTML <canvas> element. The <canvas> is widely-used to develop web applications such as data visualizations, animations, and web games. The use of <canvas> in web applications is expected to grow even further, because its main alternative, Adobe Flash, is no longer supported in modern browsers as of 2021 [3, 2].
However, developers face challenges when working with the <canvas>. For example, a study of web development Q&A forum posts found that the <canvas> can cause confusion for developers, which is attributed to a lack of API documentation [11]. In terms of web applications, API documentation is arguably particularly important for the <canvas>, as <canvas> applications operate differently from traditional web applications. Traditional web applications are controlled through the Document Object Model (DOM), which represents the web page as nodes and objects [54]. Testing methods for traditional web applications often rely on the DOM to test the page. However, instead of being represented in the DOM, <canvas> contents are represented as a bitmap which is directly manipulated using the Canvas API or WebGL API [51]. The lack of a DOM representation of <canvas> contents makes it less intuitive and much harder to build and test <canvas> applications.
To better understand the issues that developers face with the <canvas>, we address the following research question in our study: What types of testable issues do developers encounter when creating web applications with the HTML5 <canvas>?
In this paper, we construct a taxonomy of testable <canvas> issues to give better insights on how <canvas> issues are different from generic web application issues, and to direct future research on testing the HTML5 <canvas>. In our study, we build an understanding of the types of testable <canvas> issues by manually analyzing the contents of 332 <canvas>-related issue reports in 123 open-source GitHub projects. We combine an existing taxonomy of GUI issues [42] and an existing taxonomy of web issues [45] to provide a baseline taxonomy that contains an initial set of issue types. Then, we perform a manual classification process to classify issues into the existing types and define new issue types as necessary. The main contribution of our paper is a taxonomy of testable HTML5 <canvas> issues, which allows future researchers to better target their efforts on testing methods for the <canvas>.
The remainder of our paper is structured as follows. In Section 2, we provide background information to motivate our study. In Section 3, we discuss related work. We present our methodology in Section 4. We present our taxonomy of testable <canvas> issues in Section 5. In Section 6, we compare <canvas> issues to generic web issues and GUI issues. In Section 7, we discuss future research directions. In Section 8, we discuss threats to validity. Section 9 concludes our paper.
2 Background and Motivation
2.1 HTML5 <canvas> applications
The HTML5 <canvas> is particularly useful for web applications which require dynamic graphics [78], such as animations, interactive data visualizations, or web games. A <canvas> application can be made interactive by making it listen and respond to browser events such as mouse clicks [49]. After the occurrence of such an event, its associated JavaScript code is executed, which changes the <canvas> bitmap. This interactive behaviour allows developers to create ‘complete’ applications inside the <canvas> element. As a result, many <canvas> applications have their own GUI, which is rendered on the <canvas> bitmap as well. Because <canvas> applications have a GUI, deal with graphics rendering, and execute inside of a web browser, a diverse skill set is needed to build such applications, making development challenging.
2.2 Difficulties in <canvas> testing
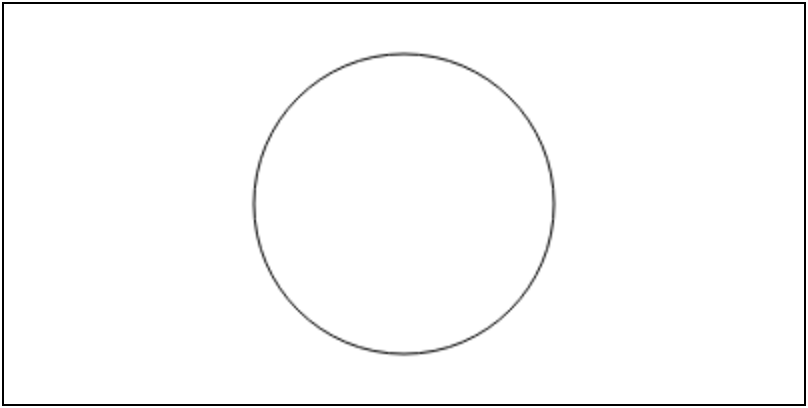
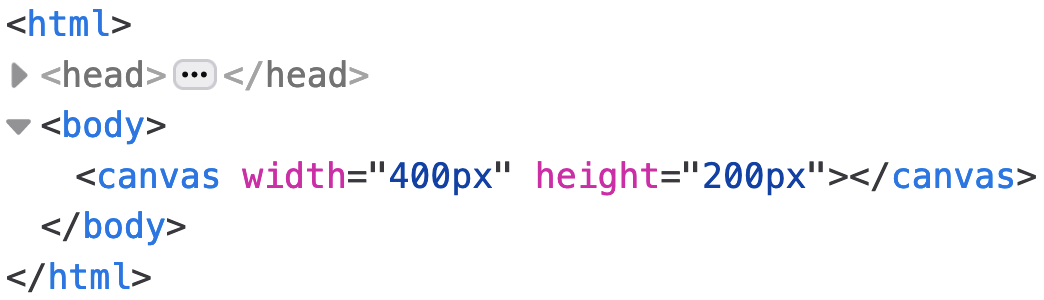
To illustrate the challenges of testing the HTML5 <canvas>, we provide a simple motivating example. Figure 1(a) shows an empty <canvas> element on a web page. Figure 1(b) shows the updated <canvas> element after executing the JavaScript code shown in Listing 1. Figure 1(c) shows the DOM representation of the <canvas> element for both Figure 1(a) and Figure 1(b). Clearly, the <canvas> contents have changed, but the DOM representation of the <canvas> element has not changed, showing that the <canvas> contents are not represented in the DOM.

As web testing is typically done through several widely-used test automation frameworks that rely on analyzing the DOM, such as Selenium111https://www.selenium.dev/, Cypress222https://www.cypress.io/, and Playwright333https://playwright.dev/, existing web testing techniques are severely limited in <canvas> testing. There are many websites which use the <canvas> [75] yet there is no good way to test the <canvas>, meaning these websites either use manual testing, or do not test the <canvas> at all. With a lack of available <canvas> testing tools, there are opportunities for future research. A testable issue taxonomy provides a detailed classification of possible issue types, and a detailed classification is necessary to build testing tools that target different types of testable issues [88]. Additionally, challenges in brainstorming useful approaches to testing can be mitigated by using a testable issue taxonomy [82]. A testable issue taxonomy can help identify gaps in our knowledge and direct future research [68]. Therefore, our taxonomy of testable <canvas> issues can be used to guide future research on <canvas> testing.
3 Related Work
3.1 HTML5 <canvas> issues
While there is extensive prior work on web issues and web testing, there is limited prior work that investigates <canvas> issues. As a discussion of related work on non-<canvas> web testing is outside the scope of our paper, we refer to the systematic literature review by Doğan et al. [26] and the grey literature review by Ricca and Stocco [72] for an overview of related work about web testing.
Bajammal and Mesbah [12] propose an approach for automated visual testing of the <canvas>, and report high accuracy. However, their approach is evaluated by injecting only a single type of testable <canvas> issue. In our work, we investigate the types of testable <canvas> issues that developers encounter, so that future research on <canvas> testing can target a wider range of relevant testable issues.
Hoetzlein [32] conducted a study on graphics performance in web applications, finding HTML5 <canvas> showed different performance across different browsers. However, a difference in performance may not constitute a testable issue, and our study is concerned with many types of <canvas> issues, rather than just performance issues on the <canvas>.
Bajaj et al. [11] investigated Stack Overflow questions asked by web developers, and found that developers faced implementation issues with the <canvas>. They reason that this is due to a lack of clear API documentation. While this does suggest that developers have problems with the <canvas>, our work further investigates problems with the <canvas> by identifying the types of testable issues developers face.
3.2 Related issue taxonomies
There are some existing issue taxonomies that are related to the GUI, web, and graphics rendering characteristics of the <canvas>. Lelli et al. [42] constructed a taxonomy of GUI faults that allows for the evaluation of GUI testing tools. Marchetto et al. [45] constructed a taxonomy of web faults that focuses on web architecture faults. Our work differs in that we focus specifically on testable <canvas> issues, allowing us to determine whether these taxonomies are useful in describing <canvas> issue types, and define new issue types for the <canvas> as required.
Ocariza et al. [60] constructed a taxonomy of client-side JavaScript bugs, finding that most client-side JavaScript bugs are DOM-related. As explained in Section 2, the <canvas> contents are not represented in the DOM, meaning the taxonomy of client-side JavaScript bugs has limited relevance to testable <canvas> issues.
Woo et al. [87] provide a taxonomy of problems in rendering algorithms. While their taxonomy may be complimentary to our taxonomy (in describing the causes of Rendering issues), our work takes a higher-level and broader view of testable <canvas> issue types.
4 Methodology
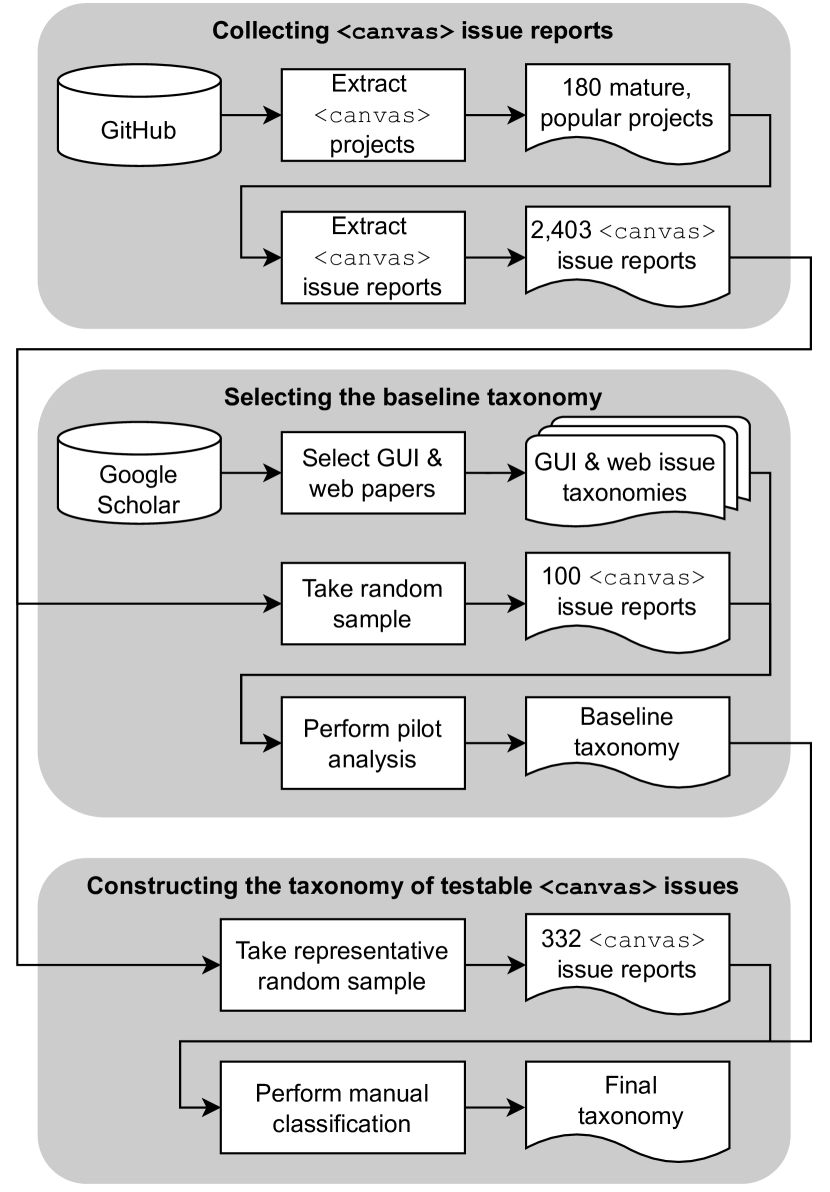
In this section, we describe our methodology for constructing a taxonomy of testable <canvas> issues. Table I provides an overview of how we used taxonomy construction guidelines provided by Usman et al. [80] and Ralph [68] to facilitate the construction of our taxonomy. Issue taxonomies have been defined in a variety of ways, which is mainly due to differences in objectives [82]. However, issue taxonomies have commonly been constructed via the manual classification of relevant issue reports [18]. Our goal was to guide future research on <canvas> testing by uncovering the types of testable issues (based on their symptoms) that are reported in <canvas> projects, and manually classifying issue reports provides the insight we require to build a taxonomy of testable <canvas> issues. Therefore to construct our taxonomy of testable <canvas> issues, we collected and manually classified <canvas> issue reports from GitHub. We took an initial set of labels from existing taxonomies, based on known aspects of the HTML5 <canvas>: the <canvas> is used as a GUI, for graphics rendering, and is a web technology. An overview of our methodology can be seen in Figure 2.
| Usman et al. [80] | Ralph [68] | Section(s) of our paper |
| Planning | Choose a strategy | 4 |
| Identification | Site selection | 4.1 and 4.2 |
| and extraction | Data collection | 4.1.1, 4.1.2, and 4.2.1 |
| Design and | Data analysis | 4.2.2, 4.3, 4.3.1, and 4.3.2 |
| construction | ||
| Validation | Conceptual evaluation | 4.4 |
4.1 Collecting <canvas> issue reports
To analyze the types of issues that developers face when using the <canvas>, we looked at <canvas>-related issue reports in popular open source projects that use the <canvas>. Issue reports in popular open-source projects that use the <canvas> are appropriate to study because they can contain detailed descriptions and discussions of real-world testable issues encountered by software developers, as shown by previous studies that mine issue reports in popular open source projects [88, 18, 5, 6, 7]. We have made our collected data available on Zenodo at the following link: https://zenodo.org/record/6886143
4.1.1 Extracting <canvas> projects
We created a custom crawler that utilized the GitHub API to search GitHub for open source projects that use the <canvas>. We searched for open source projects on GitHub that matched the keywords ‘canvas’, ‘html-canvas’, or ‘html5-canvas’ in their title, description, readme file, or topic tags. We limited our search to projects which use the following languages: HTML, JavaScript, or TypeScript. To ensure only mature, popular projects were considered in this study, inclusion criteria of at least 1,000 stars and at least 2 contributors were set empirically, similar to prior work [16, 41, 36]. We avoid immature projects because issue reports for immature projects are not necessarily representative of real testable issues, for example because the report is simply for a feature that is not finished or well-tested yet. Focusing on mature projects should improve the likelihood of issue reports being more representative. With our inclusion criteria applied, we had a list of 375 open source projects that matched our search criteria. We then manually filtered out false positives. Some false positives were due to our use of keyword matching in project readme files. For example, one false positive was microsoft/Web-Dev-For-Beginners, which contains some guides for the <canvas> but does not utilize it in a specific software application. Other false positives were projects which utilized a non-HTML5 canvas object, such as node-canvas for Canvas API compatibility with Node.js desktop applications. For projects with a non-HTML5 canvas object, it was difficult to automatically ascertain whether bug reports discuss the <canvas> of interest, or the other canvas object. With the false positives removed, we were left with a list of 180 projects from which <canvas>-related issue reports could be extracted.
4.1.2 Extracting <canvas> issue reports
To collect issue reports for our analysis, we modified our custom crawler to search GitHub for relevant issue reports in each of the 180 projects. To ensure we study only relevant issue reports, we only include closed issue reports in our analysis, similar to prior work [18, 79]. Closed issue reports contain the information required to understand the main symptom of the reported testable issue [18], for example, developer responses that confirm that the reported issue was indeed a testable issue and other relevant discussion in the comments of the issue report. We searched for closed issue reports with descriptions that matched the keyword ‘canvas’. Our search returned a list of 9,672 closed issue reports, from which we were able to identify testable issue reports. For GitHub issue reports that were labelled, we selected issue reports that had a label containing the keyword ‘bug’ (except for labels like ‘not bug’). For GitHub issue reports that were not labelled, we identified testable issue reports using a keyword-based search on the issue report descriptions, similar to prior work [18, 37, 79, 36]. Specifically, we selected issue reports with descriptions that matched one of the following keywords: ‘error’, ‘bug’, ‘fix’, or ‘fault’. Our selection process provided 1,105 labelled issue reports and 1,301 unlabelled issue reports. To ensure specific issue reports were not over-represented in our population of collected issue reports, we removed issue reports that had been marked as duplicates on GitHub by the repository maintainer(s). After removing issue reports that were marked as duplicates on GitHub, we were left with a total of 2,403 <canvas>-related issue reports. We only identified relevant issue reports in 123 of the projects.
4.2 Selecting the baseline taxonomy
To reduce subjectivity during the manual issue classification, we started our classification from a baseline taxonomy. To select the baseline taxonomy, a pilot analysis was conducted with a taxonomy of GUI faults [42] and a taxonomy of web faults [45].
4.2.1 Selecting papers with relevant taxonomies
As a web technology, we expected the <canvas> to exhibit testable issues that are present in web applications. Also, the <canvas> is often used for both the GUI and graphics of web applications. Therefore, we also expected the <canvas> to exhibit testable issues that are present in the GUIs of desktop applications. To find relevant issue taxonomies, we searched Google Scholar with the following queries: ‘web bug taxonomy’ and ‘gui bug taxonomy’. The use of Google Scholar to find relevant software engineering works is suggested by Brereton et al. [17], and provides a wide coverage of search results as discussed by Landman et al. [40]. The search results were manually analyzed, and two papers providing a relevant taxonomy were selected (one for GUI issues [42] and one for web issues [45]).
4.2.2 Performing the pilot analysis
A pilot analysis was conducted by the first author to verify that each of the selected taxonomies were useful for our purposes. Manual classification was performed with a random sample of 100 issue reports. Listing 2 shows the process for the pilot analysis.
Once the pilot analysis was complete, we were able to define the baseline taxonomy using the selected taxonomies. For the GUI characteristic of the <canvas>, most issue types from the taxonomy provided by Lelli et al. [42] were adopted into the baseline taxonomy. For the web characteristic of the <canvas>, one of the issue types from the taxonomy provided by Marchetto et al. [45] was adopted into the baseline taxonomy. The baseline taxonomy can be seen in Table II.
| Characteristic | Type |
|---|---|
| User interface | Data presentation |
| GUI structure and aesthetics | |
| User interaction | Action |
| Behaviour | |
| Web architecture | Browser incompatibility |
4.3 Constructing the taxonomy of testable <canvas> issues
To construct our taxonomy of testable <canvas> issues, we manually classified a sample of the issue reports that we collected. We randomly selected a statistically representative sample of 332 of our collected issue reports with a confidence level of and a confidence interval of . We used stratified sampling to reduce bias [47] towards projects with a higher number of issue reports in our dataset. To manually classify the issue reports, we performed a manual labelling process over two stages. First, we performed multi-label classification to determine which issue reports contained issue types already defined in the baseline taxonomy. Then, we performed card sorting primarily to elicit and define new issue types. When assigning labels to issue reports, we considered not only the title and description provided by the reporter, but also discussion by developers and users in the comments of the issue reports.
4.3.1 Independent multi-label classification
In the first stage of manual classification, the first and second authors each independently performed a multi-label classification of the sampled issue reports. Listing 3 shows the process we followed to perform multi-label classification. There were cases where no issue types were assigned to an issue report, because the baseline taxonomy was not fully descriptive of testable <canvas> issue types.
To measure inter-rater reliability (IRR) when performing multi-label classification of the issue reports, we calculated IRR on a per label basis, similar to prior work [81]. We measured IRR for each label individually using Cohen’s kappa () [22], which we calculated as follows:
Where is the observed percentage of agreement, is the expected percentage of agreement based on how often raters assigned the categories, is the total number of samples, and is the number of samples assigned category by each rater 1 and 2. For our multi-label classification we are calculating Cohen’s kappa on a per-label basis, and so the set of categories considered when calculating Cohen’s kappa is simply , and we repeat the calculation for each label. The subtables contained in Table III(f) each show the confusion matrix and kappa value for each label after the first step of our classification process.
After completing the first stage of manual classification, the first and second authors agreed that the GUI structure and aesthetics and Data presentation labels were not mutually exclusive, as these labels often had to be grouped together as if they were the same label. This is because the <canvas> can act as both a GUI and a graphics container for web applications. So, to improve our classification, we merged the labels from the User interface characteristic of the baseline taxonomy, and for clarity we renamed this characteristic to Visual in our taxonomy. After merging, we calculated Cohen’s kappa for the Visual label to be , an increase over either of the original labels. Then, the sixth author independently performed conflict resolution for the cases where only one of the first two authors selected a specific issue type for a given issue report. The low kappa values measured in our first stage of classification indicated that additional steps of taxonomy construction were necessary, and not every issue report had been labelled yet, leading to the second stage of our manual classification.
| Rater 2 | |||
|---|---|---|---|
| Yes | No | ||
| Rater 1 | Yes | 48 | 64 |
| No | 21 | 199 | |
| Rater 2 | |||
|---|---|---|---|
| Yes | No | ||
| Rater 1 | Yes | 24 | 26 |
| No | 45 | 237 | |
| Rater 2 | |||
|---|---|---|---|
| Yes | No | ||
| Rater 1 | Yes | 11 | 12 |
| No | 24 | 285 | |
| Rater 2 | |||
|---|---|---|---|
| Yes | No | ||
| Rater 1 | Yes | 11 | 6 |
| No | 16 | 299 | |
| Rater 2 | |||
|---|---|---|---|
| Yes | No | ||
| Rater 1 | Yes | 30 | 11 |
| No | 10 | 281 | |
| Rater 2 | |||
|---|---|---|---|
| Yes | No | ||
| Rater 1 | Yes | 102 | 57 |
| No | 19 | 154 | |
4.3.2 Card sorting
In the second stage of manual classification, the first and second authors performed card sorting together to develop a more comprehensive and detailed taxonomy of testable <canvas> issues. Card sorting is a process of assigning each subject (issue report) to a single label, and is a widely-used approach that can help develop useful classifications [59]. Listing 4 shows the steps we took to perform card sorting.
Through card sorting, we were able to define new issue types for our taxonomy and develop a more detailed classification for Visual issues. After the first stage of manual classification, there were issue reports that had been assigned more than one label because multiple symptoms could be present in a single issue report. During card sorting (the second stage of classification) we came to an agreement together to determine what the main issue symptom (type) was, allowing us to assign a single label for such issue reports. 9% of the issue reports did not contain a testable issue, and were discarded from the sample.
4.4 Evaluating our taxonomy of testable <canvas> issues
After completing the construction of our taxonomy, we evaluated our final taxonomy using established quality criteria for taxonomies [80, 68].
Utility demonstration
The utility of a taxonomy is demonstrated by classifying subject matter examples [80, 76], such as issue reports. To evaluate the utility of our taxonomy, the first and second author each independently performed a multi-label classification of a random sample of 50 issue reports from a proprietary <canvas> application. The proprietary application is a <canvas> game for children’s education that is played by more than 100 million children across the world. The game is representative of <canvas> applications as the entire game is contained within the <canvas>. We did not require any new labels to classify these issue reports, and measured considerably higher Cohen’s kappa values for all labels when compared to the first stage of our taxonomy construction. We calculated Cohen’s kappa for our validation exercise the same way as described in Section 4.3.1. Confusion matrices and kappa values for the validation exercise are shown in Table IV(i). Other than the Rendering label, we measured the lowest kappa for a label to be 0.790 and the highest to be 1. For the Rendering label, we measured a kappa value of 0 despite there only being a single disagreement as seen in Table IV(d). For the proprietary application, Rendering issues are not a concern and are rarely reported, meaning that a single instance with disagreement led to a low kappa value. Our validation results show that our taxonomy is useful in describing testable <canvas> issues found in real, industrial <canvas> applications, and therefore meets the utility criterion.
Orthogonality demonstration/Reflects (dis)similarities between instances
The orthogonality of a taxonomy, i.e., that the labels in the taxonomy do not overlap with each other, is implied by the design of the taxonomy [80, 76]. Our results in Section 5.6 indicate that there is a difference in resolution times between our testable issue types, which supports that there are differences between the issue types in our taxonomy. However, during the evaluation of the utility of our taxonomy, we observed that the industry issue reports sometimes required multiple labels. The need for multiple labels suggests that symptoms can occur together, and that the issue types in our taxonomy are not completely mutually exclusive. At the same time, the symptoms do not always occur together; indicating that the issue types in our taxonomy are dissimilar enough to warrant not merging them. As the goal of our taxonomy is to identify directions for research on <canvas> testing, we do not consider it problematic that the taxonomy is not completely orthogonal.
Benchmarking
Benchmarking involves comparing the constructed taxonomy with similar classification schemes [80, 76]. As described in Section 4.2.2, we conducted a pilot analysis to determine the relevance of labels in similar taxonomies (for GUI [42] and web [45] issues) when constructing our taxonomy of testable <canvas> issues, meaning our methodology for taxonomy construction contains an implicit benchmarking exercise with the two aforementioned taxonomies. Additionally, in Section 6 of our paper, we provide detailed discussion of the (dis)similarities between our final taxonomy and the GUI [42] and web [45] issue taxonomies, including discussion of new testable issue types in our taxonomy that are specific to the <canvas>.
Fit-for-purpose
To determine if our taxonomy is fit-for-purpose, we consider the degree to which our taxonomy is effective at the specific purpose it was designed for [68]. As defined in Section 1, our guiding question in constructing our taxonomy was “What types of testable issues do developers encounter when creating web applications with the HTML5 <canvas>?”, and our underlying motivation is to direct future research on testing the <canvas>. As discussed in Section 6.3, our taxonomy answers our research question by providing a detailed classification of testable issue types reported in popular open-source projects that utilize the <canvas>, including issue types defined in existing GUI [42] and web [45] issue taxonomies, as well as new issue types specific to the <canvas>. Furthermore, in Section 7 we identified several future lines of research based on our taxonomy of testable <canvas> issues. Based on these characteristics, we conclude that our taxonomy is fit-for-purpose.
| Rater 2 | |||
|---|---|---|---|
| Yes | No | ||
| Rater 1 | Yes | 9 | 2 |
| No | 0 | 39 | |
| Rater 2 | |||
|---|---|---|---|
| Yes | No | ||
| Rater 1 | Yes | 15 | 4 |
| No | 0 | 31 | |
| Rater 2 | |||
|---|---|---|---|
| Yes | No | ||
| Rater 1 | Yes | 1 | 0 |
| No | 0 | 49 | |
| Rater 2 | |||
|---|---|---|---|
| Yes | No | ||
| Rater 1 | Yes | 0 | 0 |
| No | 1 | 49 | |
| Rater 2 | |||
|---|---|---|---|
| Yes | No | ||
| Rater 1 | Yes | 9 | 1 |
| No | 1 | 39 | |
| Rater 2 | |||
|---|---|---|---|
| Yes | No | ||
| Rater 1 | Yes | 1 | 0 |
| No | 0 | 49 | |
| Rater 2 | |||
|---|---|---|---|
| Yes | No | ||
| Rater 1 | Yes | 9 | 2 |
| No | 0 | 39 | |
| Rater 2 | |||
|---|---|---|---|
| Yes | No | ||
| Rater 1 | Yes | 9 | 2 |
| No | 0 | 39 | |
| Rater 2 | |||
|---|---|---|---|
| Yes | No | ||
| Rater 1 | Yes | 9 | 2 |
| No | 0 | 39 | |
4.5 Determining issue resolution time
In addition to constructing a taxonomy of testable <canvas> issues, we also quantified issue resolution time for our set of classified open-source issue reports to better understand how developers deal with different types of testable <canvas> issues. To calculate the issue resolution time, we calculated the difference between the issue open time and the final issue close time for each issue report, similar to prior work [16]. We calculated the median resolution time for each issue characteristic in our taxonomy by taking the median of the resolution times for all issue reports associated with each issue characteristic.
4.5.1 Collecting data for comparison
To provide a baseline for comparison for issue resolution times, we collected non-<canvas> issue reports from the projects in our studied population. We followed a similar process to how we identified <canvas> issue reports in the projects, except we collected only issue reports that did not mention the <canvas>.
| Characteristic | Type | Description |
| Visual (35%) | Rendering (20%) | Objects appear blurry, distorted, or contain artifacts. |
| Layout (12%) | Objects have incorrect positioning, layering, or size. | |
| State (2%) | Objects displayed in the wrong state, e.g. visible vs. invisible. | |
| Appearance (1%) | Objects have incorrect aesthetics, e.g. wrong colour. | |
| User interaction (14%) | Action (6%) | Incorrect result from single DOM event on the <canvas>. |
| Behaviour (8%) | Incorrect result from combination of DOM events on the <canvas>. | |
| Web architecture (17%) | Different behaviour across browsers (14%) | Incorrect <canvas> functionality on specific browsers. |
| Cross-origin resource sharing (3%) | Incorrect usage of CORS policies prevents the loading of resources. | |
| Performance (5%) | Inefficient memory usage (5%) | Memory leaks from inefficient usage of the Canvas or WebGL APIs. |
| Integration (29%) | Saving <canvas> data (2%) | Saving the <canvas> bitmap to a file provides an unexpected result. |
| Browser runtime error (27%) | Error outside of the <canvas> prevents <canvas> functionality. |
5 Our taxonomy of testable canvas issues
In this section, we provide a detailed description of each of the types in our taxonomy of testable <canvas> issues. Table V shows our taxonomy of testable <canvas> issues, including the frequency of each issue type in the studied issue reports.
5.1 Visual issues
Visual issues are problems in the presentation of objects on the <canvas> bitmap. We discovered four types of Visual issues: Rendering, Layout, State, and Appearance.
Rendering issues are often related to the incorrect scaling of objects or images on the <canvas>, with example instances such as distortion or blurriness being common. Some instances of Rendering issue reports described unexpected visual results due to more specific logical errors in using the Canvas API (or WebGL API) to display specific shapes, such as a waveform [48]. Figure 3(a) shows an example instance of a Rendering issue [46]. We noticed that some Rendering issue reports discussed how the incorrect scaling occurred due to a failure in accounting for differences in device resolutions [77, 44, 43, 71], or changes in <canvas> dimensions [29, 39]. We also found an instance of a Rendering issue where artifacts appeared on the screen only when using WebGL on devices with an outdated graphics driver [20].
Layout issues are related to incorrect positioning and sizing of objects on the <canvas>. Figure 3(b) shows an example instance of a Layout issue, with misaligned objects on the <canvas> [23]. Layout issues may be the incorrect coordinates (like ) for an object [28], or the incorrect layering (like z-index) for an object [15] on the <canvas>. In one instance, a data visualization was not fully viewable because some objects had been assigned positions outside of the <canvas> viewport [10]. In another instance, a <canvas> animation was not fully viewable due to the <canvas> dimensions being too small [65].
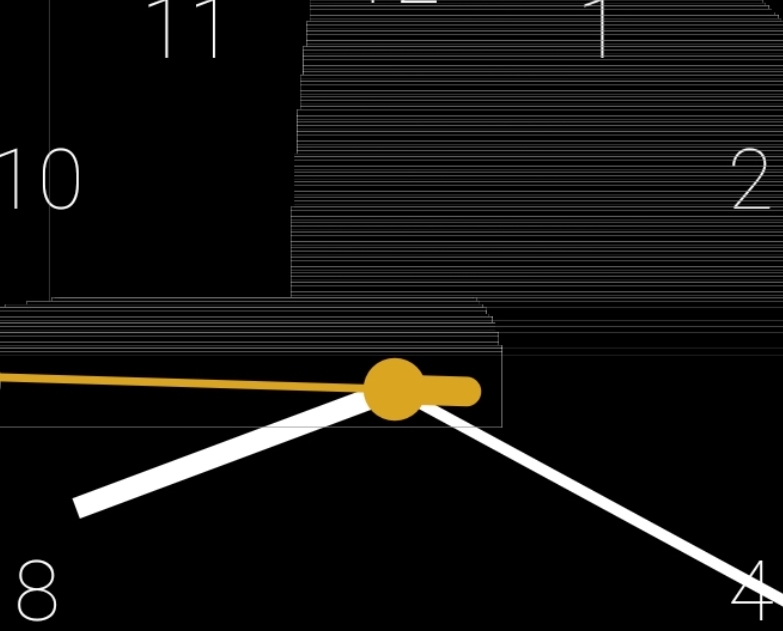
State issues are those in which an object (or text) is displayed in a different state than it should be. For example, an object that is visible on the <canvas> should be invisible, or vice versa. Figure 3(c) shows an example instance of a State issue, with circles appearing when they should not be visible [83]. In one State issue report, game controls were not removed when changing views on the <canvas> to a text box for chat [69]. In another more complicated case, multiple HTML <canvas> elements were used to render different objects, and specific HTML <canvas> elements were not being hidden when they should have been [24].
Appearance issues are related to the incorrect aesthetics of objects on the <canvas>, such as incorrect colour, transparency, or font. Figure 3(d) shows an example instance of an Appearance issue, with the legend of the graph having incorrect colours [33]. We found some instances of Appearance issues where the incorrect font was used when rendering text on the <canvas> [84, 86].

5.2 User interaction issues
User interaction issues are related to DOM events that are triggered on the HTML <canvas> element. We discovered two types of User interaction <canvas> issues. Action issues occur when a single action fails to execute correctly. Meanwhile, Behaviour issues are those which consist of multiple actions that together provide an incorrect result. Some example instances of Action issue reports we encountered include: click-dragging the cursor to zoom does not work when the cursor moves outside of the bounds of the HTML <canvas> element [25], and a tooltip is not showing when mouse hovering over a graph rendered to the <canvas> [70]. Other instances of Action issue reports were similar in that a specific action was failing [1, 27, 66], which prevented user interaction functionality in web applications built with the <canvas>. For Behaviour issues, some example instances we encountered include: drawing functionality does not work correctly while simultaneously scrolling within the <canvas> [35], and dragging an object on the <canvas> does not function as expected after scrolling within the <canvas> [56]. In general, Behaviour issues involve two or more actions that are performed simultaneously or in succession, which ultimately provide incorrect functionality with the <canvas>. Although User interaction issues are related to DOM events, they were often described in issue reports by comparing the expected and buggy visual results.
5.3 Web architecture issues
We discovered two types of Web architecture <canvas> issues: Different behaviour across browsers, and Cross-origin resource sharing.
Different behaviour across browsers issues occur when a <canvas> application works on some browsers but not others. Many such issues were caused by the use of an outdated browser, such as IE8 [64], or an outdated version of a modern browser, such as Firefox 51.0 when the latest stable release was Firefox 63.0 [38]. However, we also found instances of Different behaviour across browsers issues where <canvas> functionality was incorrect for a latest stable release version of a modern browser. For example, we found some instances where a <canvas> application did not function correctly on Safari, despite working on Firefox and Chrome [31, 62]. In another case, a specific browser issue in Chrome prevented a <canvas> application from functioning [30].
Cross-origin resource sharing (CORS) issues are related to the incorrect use of CORS policies with <canvas>. CORS policies provide a secure method for loading <canvas> resources (such as images or WebGL textures) from foreign domains, but if they are not used correctly, the resources will either not be loaded [53], or prevent the <canvas> data from being saved to a file [50]. In one instance, an AWS bucket was not correctly configured with CORS policies, which prevented the loading of those resources to a <canvas> application [63]. In some instances, CORS headers were not used in the HTTP requests to foreign domains, preventing resources from being loaded [9, 21].
5.4 Performance issues
Performance issues can occur with the <canvas> due to Inefficient memory usage. issue reports which described Inefficient memory usage issues commonly discussed how the outcome of such bugs was a frozen or crashed web application. Some example instances of Inefficient memory usage issues include <canvas> applications crashing due to: rendering occurring too often [73], and new objects being rendered to the <canvas> without old (hidden/invisible) objects being removed from memory [58].
5.5 Integration issues
When connecting the <canvas> with other parts of a web application, Integration issues can occur. We discovered two types of Integration issues: Saving <canvas> data and Browser runtime error.
Saving <canvas> data issues can occur when saving the <canvas> bitmap to a file using custom JavaScript methods or JavaScript methods built into the browser. One instance described how saving the <canvas> bitmap using a built-in browser method produced a file with a black background that was not present in the browser [57]. This indicates that built-in methods such as getImageData, toBlob, or toDataURL may not produce the same result as what is seen on the <canvas>. Other instances of Saving <canvas> data bugs were due to errors in custom methods for saving the <canvas> bitmap, for example we found an instance where the saved data was unexpectedly compressed [55].
We discovered issue reports that discussed <canvas> functionality despite the issue being located in a different part of the web application, and classified such issue reports as Browser runtime error. While these issue reports did mention the <canvas>, these issues were not actually directly related to <canvas> problems. Example instances of Browser runtime error issues include: referencing an HTML <canvas> element that had not been created [67], and using incorrect syntax for a JavaScript library method that added objects to a data visualization on the <canvas> [19]. It appears that most Browser runtime error issues are reported by developers who are not experienced with web development or the <canvas>.
5.6 Results for issue resolution time
As described in Section 4.5, we quantified the median issue resolution times for each issue characteristic in our taxonomy to better understand how developers deal with different types of testable <canvas> issues. Table VI shows the median issue resolution times per issue characteristic in our taxonomy. Our results indicate that developers of open source projects that utilize the <canvas> may, for example, prioritize issues reports belonging to Visual bug types over issue reports belonging to Web Architecture bug types.
5.6.1 Resolution times for non-<canvas> issue reports
As described in Section 4.5.1, we also collected non-<canvas> issue reports to compare issue resolution times. For the non-<canvas> issue reports in the 123 studied projects, we found that the median resolution time was 6 days. Comparing this result with our results in Table VI, we can conclude that developers may either prioritize non-<canvas> issue reports over most <canvas> issue reports, or that <canvas> issue reports are harder to resolve. However, Integration issues (from our taxonomy) are usually resolved more quickly than non-<canvas> issue reports.
| Characteristic in our taxonomy | Median time to resolve (days) |
|---|---|
| Integration | 4 |
| Visual | 8 |
| User Interaction | 13 |
| Performance | 32 |
| Web Architecture | 48 |
6 Discussion
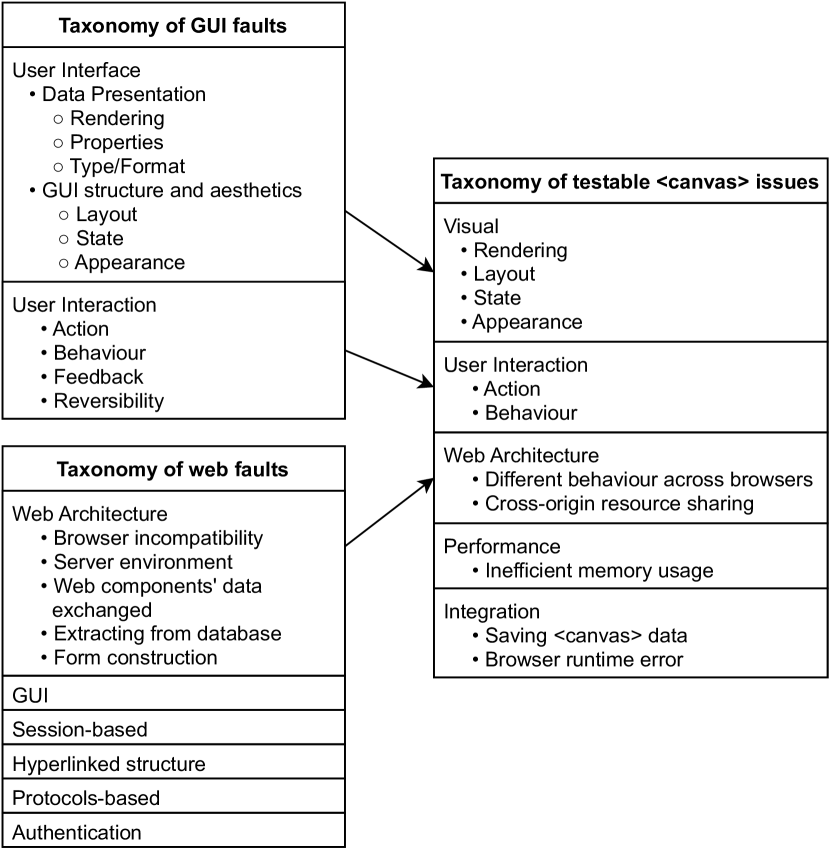
Prior to performing classification, we hypothesized that testable <canvas> issues are similar to the issues found in GUIs and web applications. While we did discover some overlap, we found that some GUI issue types and many web issue types are not relevant to <canvas> applications. We also discovered some new types of issues that are specific to the <canvas>. In this section, we discuss the differences between our taxonomy of testable <canvas> issues and the taxonomies that contributed to the baseline taxonomy (that we selected in Section 4.2). A mapping of the selected taxonomies to our taxonomy of testable <canvas> issues can be seen in Figure 4.
6.1 Comparing GUI issues and <canvas> issues
The key difference between GUI issues and <canvas> issues is that it is difficult to distinguish GUI structure and aesthetics and Data presentation for the <canvas>. Additionally, while several of the specific User interface issue types provided in the taxonomy of GUI faults [42] were descriptive of Visual issues on the <canvas>, we did not use Type/format or Properties in our classification. The absence of such issue types in our taxonomy may be explained by the fact that the <canvas> renders a bitmap rather than a structured markup language (e.g. HTML, XML) that contains separate properties for the display of raw numerical and textual data. With regards to User interaction issue types, we did not find any Feedback or Reversibility issues in <canvas> issue reports. Together, these comparisons indicate that the <canvas> is like a specific kind of GUI that deals heavily with graphics rendering. However, our taxonomy of testable <canvas> issues contains issue types that are not GUI-related, meaning <canvas> testing has additional complexities that are not seen in desktop GUIs.
6.2 Comparing web issues and <canvas> issues
Our taxonomy of testable <canvas> issues contains very few issue types seen in the taxonomy of web faults [45], indicating there is not a lot of overlap between <canvas> issues and generic web application issues. For the Web architecture aspect of <canvas>, the only obvious similarity between the taxonomy of web faults [45] and our taxonomy of testable <canvas> issues is the presence of the Different behaviour across browsers type. Given that <canvas> is a client-side technology (i.e. it is implemented by browsers), the existence of Different behaviour across browsers issues is not surprising. In our taxonomy of testable <canvas> issues, the Cross-origin resource sharing type is somewhat similar to the Server environment type in the taxonomy of web issues [45]. Knowing that <canvas> is a client-side technology, one might not expect Server environment issues to affect <canvas> in web applications. However, the specific challenges posed by CORS means that there are some <canvas> issues that could also be described by Server environment. We did not use Web components’ data exchanged, Extracting from database, or Form construction types, meaning <canvas> issues do not range the full scope of generic web architecture issues. The smaller scope of web-related <canvas> issues compared to generic web application issues is also indicated by the lack of many other types that were proposed in the taxonomy [45] from which we took initial Web architecture types.
6.3 Summary of findings
To complete the discussion of our constructed taxonomy of testable <canvas> issues, below we summarize our findings with reference to the research question defined in the introduction section of our paper: What types of testable issues do developers encounter when creating web applications with the HTML5 <canvas>?
7 Future research directions
7.1 Detecting Visual issues
The most frequently reported <canvas> issues in the open source projects are Visual issues, as can be seen in Table V. Visual issues may be hard to diagnose, because the <canvas> state is not exposed through the DOM. The only existing research [12] that addresses testing the <canvas> focuses on detecting what we have defined as State issues in our taxonomy. Although there is extensive prior work regarding Visual GUI testing [4, 13], this testing paradigm is not synonymous with detecting Visual issues [34]. Visual issues would interfere with Visual GUI testing methods that leverage the visual aspect of the application to drive test automation. Snapshot testing is a Visual GUI testing approach that could target Visual issues on the <canvas>, however snapshot testing has many inherent drawbacks that limit its utility as an automated testing strategy [12], and future research is required to understand to what extent snapshot testing is useful in catching Visual issues on the <canvas> in web applications. This emphasizes that research on <canvas> testing is still in an early stage, and that there are many opportunities for future research on <canvas> testing. Given the high frequency and notable variety of Visual issues, new approaches for testing the <canvas> must be developed.
7.2 Detecting correct usage of the <canvas>
Using the <canvas> can lead to new challenges in terms of performance. While the <canvas> opens the door to many interesting use-cases in web applications, it also may lead to Performance issues that are specific to the <canvas>. As seen in Table V, one of our newly defined types of <canvas> issues is Inefficient memory usage, which can lead to memory leaks or high CPU usage. While much of the graphics rendering with the <canvas> is optimized under-the-hood, particularly when using WebGL, it is still up to developers to utilize the provided APIs in a performant manner. The same <canvas> animation might be produced through several different approaches, and some approaches outperform others. In lieu of performance testing tools for the <canvas>, developers may be able to utilize performance profiling tools built into a browser, such as Chrome DevTools [14], to analyze the runtime performance of web applications built with the <canvas>. Alternatively, an approach to profiling graphics performance such as the one detailed by Hoetzlein [32] could also prove useful. However, performance analysis is not an automated testing approach, and automated performance testing would be very difficult with performance profiling tools due to their computational overhead. Therefore, future research should investigate the detection of Inefficient memory usage issues.
As shown in Table V, one of our newly defined issue types is Cross-origin resource sharing. To render resources (such as images or WebGL textures) from foreign domains to the <canvas>, the foreign domains must be configured to allow CORS requests, and any HTTP request for these resources must contain a valid set of headers as defined in the CORS protocol [85]. Failure to correctly implement either end of the communication will lead to these resources not being rendered to the <canvas>. Future research should develop testing approaches for the <canvas> that detect incorrect usage of CORS policies with the <canvas>.
Many issues that appear to affect the <canvas> are issues that are Browser runtime errors. As shown in Table V, many issue reports in the open source projects discussed <canvas> issues that were not actually due to problems with <canvas>, but instead runtime errors that consequently affected <canvas> functionality. When debugging web applications that use the <canvas>, it would be useful to be able to automatically identify issues that are Browser runtime errors, so that developers do not waste time trying to locate <canvas> issues that originate in a different part of the web application. Therefore, future research should aim to save developer time and effort by developing testing tools for the <canvas> that help decide whether an issue originated in or outside of the <canvas>.
7.3 Detecting browser issues
Some browsers may provide incorrect <canvas> functionality. As can be seen in Table V, a fairly frequent type of <canvas> issue is Different behaviour across browsers. However, widely-used cross-browser testing frameworks rely on analyzing the DOM, meaning new forms of cross-browser testing are required for the <canvas>. Future research should investigate cross-browser testing methods for the <canvas>.
Browser-provided JavaScript methods for saving <canvas> data may not always provide the expected result. As can be seen in Table V, one of our newly defined types of <canvas> issue is Saving <canvas> data. Although there are JavaScript methods built into browsers for saving the <canvas> bitmap to a file (such as toDataURL and getImageData), we found one issue report where a built-in browser method produced a different result than what was rendered on the web page. This means that even if such methods usually work, we may not be able to fully rely on them to know what was rendered to a specific frame on the <canvas>. This finding has particular relevance for the development of <canvas> testing tools that rely on visual analysis, which would require high confidence in the input data. Further research should seek to understand why browser-provided JavaScript methods for saving the <canvas> bitmap can provide unexpected results.
8 Threats to Validity
Internal validity
Our project selection relied on the direct mention of <canvas>-related keywords in each GitHub project’s title, description, topic tags, or readme file. While this provided a wide coverage of search results that had to be manually filtered for false positives, we may still have missed some <canvas> projects, producing a possible bias in our results. We mitigated this threat mostly by including a wide range of <canvas> projects and using stratified sampling to reduce bias towards specific projects. However, further studies may be required to confirm that our results generalize to all open source <canvas> projects.
We used a custom set of keywords to identify testable issue reports in the set of unlabelled GitHub issue reports, which poses a threat to internal validity. While we may have missed some <canvas> issue reports, our set of keywords reflects terms often found in GitHub issue reports that report a testable issue. More research is required to better automatically identify testable issue reports in a set of GitHub issue reports.
Potential subjectivity in manually classifying issue reports is a threat to internal validity. While automatic classification could have reduced such subjectivity, manual classification was required to discover new testable issue types. Additionally, we did not perform the second stage of our classification process independently, as this was necessary to perform card sorting and ensure we elicited all relevant labels for our taxonomy of <canvas> issues. We addressed this threat first by selecting a baseline set of issue types from empirically validated taxonomies that are related to known characteristics of the <canvas>. Then, the first two authors initially independently classified the issue reports, which helps reduce bias and mitigate the potential subjectivity. The first stage of our manual classification had fairly low Cohen’s kappa values for most labels, but this was not a concern as we completed further rounds of classification and measured high kappa values in our validation exercise. We then leveraged the results of our independent classification to perform card sorting with three authors. Having more than one author participate in card sorting also helped reduce potential subjectivity. Finally, we performed a validation exercise as described in Section 4.4 of our paper, in which we performed multi-label classification of 50 <canvas> issue reports from a proprietary <canvas> application, and measured high Cohen’s kappa values for all labels except Rendering. Also, because we used a statistically representative random sample during classification, our results should be valid for the full set of collected issue reports.
A threat to internal validity is our choice of inter-rater reliability (IRR) measure in our independent multi-label classification and validation exercise. We measured IRR using Cohen’s kappa on a per-label basis for our multi-label classification (and validation exercise) because calculating Cohen’s kappa directly over all labels would be inconsistent with the labeling task and ignore cases of partial agreement [74]. Although the use of Krippendorf’s alpha and variations of Cohen’s kappa (which account for coder bias) have been proposed to calculate agreement for multi-label classifications [8, 74, 61], it is difficult to compare these agreement scores across different manual classification exercises [8]. For example, differences between choice of distance measure in Krippendorf’s alpha can lead to greater variability in agreement scores than coder bias alone in multi-label classifications [8], and there is no consensus on which distance measure to use [8]. We have not provided any thresholds to interpret Cohen’s kappa, as there is a lack of consensus on how to interpret these IRR values [8].
External validity
Our findings are only valid for open-source <canvas> projects on GitHub, and may not generalize to other <canvas> projects. Further studies should validate whether our results generalize to other <canvas> projects.
To automatically identify <canvas> issue reports in our set of collected <canvas> projects, we manually filtered out projects that utilized a canvas object that was not related to HTML5. Examples of such projects include desktop Node.js applications that require node-canvas, or web applications that use react-canvas to render React components to <canvas> instead of the DOM. Further research would be required to validate that our findings generalize to projects that use non-HTML5 canvas objects.
9 Conclusion
In this paper, we study the types of testable issues that developers face when using the HTML5 <canvas> in their applications. We collected <canvas> issue reports from open-source GitHub projects that use the <canvas>. We selected a baseline taxonomy based on known aspects of the <canvas>, which also provided a set of initial issue types during our manual analysis. We conducted an iterative manual classification process using a random sample of issue reports. Through our study, we empirically constructed a taxonomy of testable <canvas> issues that provides the basis for future research on <canvas> testing. Our study also provided several insights for developers when working with the <canvas>:
-
•
Visual issues are the most frequently encountered <canvas> issues in the studied issue reports.
-
•
Often, issues which appear to be caused by the <canvas> are in fact due to issues in other parts of the web application.
-
•
Browsers do not necessarily provide the same <canvas> functionality, and this is particularly true for outdated browsers.
-
•
Use of the <canvas> brings specific performance concerns in web applications.
-
•
JavaScript methods built into browsers for saving <canvas> data may provide an unexpected result.
-
•
Cross-origin resource sharing policies must be correctly used to load <canvas> resources from foreign domains.
Acknowledgments
The research reported in this article has been supported by Prodigy Education and the Natural Sciences and Engineering Research Council of Canada under the Alliance Grant project ALLRP 550309.
References
- [1] AbhiThakare “Fatal Error On Hover”, 2018 URL: https://github.com/timdream/wordcloud2.js/issues/132
- [2] Adobe “Flash & the Future of Interactive Content”, 2017 URL: https://blog.adobe.com/en/publish/2017/07/25/adobe-flash-update.html
- [3] Adobe “Adobe Flash Player EOL General Information Page”, 2021 URL: https://www.adobe.com/products/flashplayer/end-of-life.html
- [4] Emil Alégroth, Robert Feldt and Pirjo Kolström “Maintenance of automated test suites in industry: An empirical study on Visual GUI Testing” In Information and Software Technology 73 Elsevier, 2016, pp. 66–80
- [5] John Anvik, Lyndon Hiew and Gail C Murphy “Coping with an open bug repository” In Proceedings of the 2005 OOPSLA workshop on Eclipse technology eXchange, 2005, pp. 35–39
- [6] John Anvik, Lyndon Hiew and Gail C Murphy “Who should fix this bug?” In Proceedings of the 28th international conference on Software engineering, 2006, pp. 361–370
- [7] John Anvik and Gail C Murphy “Determining implementation expertise from bug reports” In Fourth International Workshop on Mining Software Repositories (MSR’07: ICSE Workshops 2007), 2007, pp. 2–2 IEEE
- [8] Ron Artstein and Massimo Poesio “Inter-coder agreement for computational linguistics” In Computational linguistics 34.4 MIT Press One Rogers Street, Cambridge, MA 02142-1209, USA journals-info …, 2008, pp. 555–596
- [9] asela-wijesinghe “not accepting image url’s without CORS headers”, 2017 URL: https://github.com/Vibrant-Colors/node-vibrant/issues/43
- [10] aSqrd-eSqrd “Nodes outside view port when physics layout enabled”, 2016 URL: https://github.com/Netflix/vizceral/issues/44
- [11] Kartik Bajaj, Karthik Pattabiraman and Ali Mesbah “Mining questions asked by web developers” In Proceedings of the 11th Working Conference on Mining Software Repositories, 2014, pp. 112–121
- [12] Mohammad Bajammal and Ali Mesbah “Web canvas testing through visual inference” In 2018 IEEE 11th International Conference on Software Testing, Verification and Validation (ICST), 2018, pp. 193–203 IEEE
- [13] Mohammad Bajammal, Andrea Stocco, Davood Mazinanian and Ali Mesbah “A survey on the use of computer vision to improve software engineering tasks” In IEEE Transactions on Software Engineering IEEE, 2020
- [14] Kayce Basques “Analyze runtime performance”, 2017 URL: https://developer.chrome.com/docs/devtools/evaluate-performance/
- [15] boardfish “Objects clipping over each other”, 2019 URL: https://github.com/metafizzy/zdog/issues/20
- [16] Justus Bogner and Manuel Merkel “To Type or Not to Type? A Systematic Comparison of the Software Quality of JavaScript and TypeScript Applications on GitHub” In arXiv preprint arXiv:2203.11115, 2022
- [17] Pearl Brereton et al. “Lessons from applying the systematic literature review process within the software engineering domain” In Journal of systems and software 80.4 Elsevier, 2007, pp. 571–583
- [18] Gemma Catolino, Fabio Palomba, Andy Zaidman and Filomena Ferrucci “Not all bugs are the same: Understanding, characterizing, and classifying bug types” In Journal of Systems and Software 152 Elsevier, 2019, pp. 165–181
- [19] cbranje “errorBars causing graph not to render”, 2015 URL: https://github.com/danvk/dygraphs/issues/671
- [20] chirotaq “WebGlRenderer does not draw multiple lines well.”, 2015 URL: https://github.com/pixijs/pixijs/issues/1843
- [21] cnatis “Cross Origin Image Requests”, 2017 URL: https://github.com/tsayen/dom-to-image/issues/112
- [22] Jacob Cohen “A coefficient of agreement for nominal scales” In Educational and psychological measurement 20.1 Sage Publications Sage CA: Thousand Oaks, CA, 1960, pp. 37–46
- [23] CRLbazin “Display problem when importing a workflow saved on a screen with another resolution”, 2020 URL: https://github.com/alyssaxuu/flowy/issues/101
- [24] danpalmer “Bug: Renders canvas elements visible on the page”, 2017 URL: https://github.com/Vibrant-Colors/node-vibrant/issues/36
- [25] danvk “Drag-zoom over left or right edge of canvas results in aborted zoom”, 2014 URL: https://github.com/danvk/dygraphs/issues/323
- [26] Serdar Doğan, Aysu Betin-Can and Vahid Garousi “Web application testing: A systematic literature review” In Journal of Systems and Software 91 Elsevier, 2014, pp. 174–201
- [27] emirozer “filling half circle”, 2013 URL: https://github.com/Leimi/drawingboard.js/issues/9
- [28] erickne “Knob creates a 200px height canvas”, 2012 URL: https://github.com/aterrien/jQuery-Knob/issues/51
- [29] Erwin4 “Scaling problem”, 2016 URL: https://github.com/joewalnes/smoothie/issues/70
- [30] fadedyellowroses “Piskel is very slow with Chrome 65 and OSX 10.11.6”, 2018 URL: https://github.com/piskelapp/piskel/issues/796
- [31] frostbytedata “Node click event firing when mouse is released after dragging”, 2018 URL: https://github.com/vasturiano/3d-force-graph/issues/67
- [32] Rama C Hoetzlein “Graphics performance in rich internet applications” In IEEE computer graphics and applications 32.5 IEEE, 2012, pp. 98–104
- [33] iKrushYou “Legend ‘itemTextColor‘ no longer works 0.63+”, 2020 URL: https://github.com/plouc/nivo/issues/1321
- [34] Ayman Issa, Jonathan Sillito and Vahid Garousi “Visual testing of Graphical User Interfaces: An exploratory study towards systematic definitions and approaches” In 2012 14th IEEE International Symposium on Web Systems Evolution (WSE), 2012, pp. 11–15 IEEE
- [35] jordyvandomselaar “When scrolling down the line is above the cursor”, 2016 URL: https://github.com/jakubfiala/atrament.js/issues/12
- [36] Arthur V Kamienski, Luisa Palechor, Cor-Paul Bezemer and Abram Hindle “PySStuBs: Characterizing Single-Statement Bugs in Popular Open-Source Python Projects” In 2021 IEEE/ACM 18th International Conference on Mining Software Repositories (MSR), 2021, pp. 520–524 IEEE
- [37] Rafael-Michael Karampatsis and Charles Sutton “How often do single-statement bugs occur? the manysstubs4j dataset” In Proceedings of the 17th International Conference on Mining Software Repositories, 2020, pp. 573–577
- [38] kartojal “[BUG] [Firefox] _.debounce + 2.5.0 Chart.js + events not working”, 2017 URL: https://github.com/chartjs/Chart.js/issues/4090
- [39] lamego “Distorted and fuzzy bubbles on canvas”, 2018 URL: https://github.com/tipsy/bubbly-bg/issues/22
- [40] Davy Landman, Alexander Serebrenik and Jurgen J Vinju “Challenges for static analysis of java reflection-literature review and empirical study” In 2017 IEEE/ACM 39th International Conference on Software Engineering (ICSE), 2017, pp. 507–518 IEEE
- [41] Philipp Leitner and Cor-Paul Bezemer “An exploratory study of the state of practice of performance testing in java-based open source projects” In Proceedings of the 8th ACM/SPEC on International Conference on Performance Engineering, 2017, pp. 373–384
- [42] Valéria Lelli, Arnaud Blouin and Benoit Baudry “Classifying and qualifying GUI defects” In 2015 IEEE 8th International Conference on Software Testing, Verification and Validation (ICST), 2015, pp. 1–10 IEEE
- [43] Maksims “‘maxPixelRatio‘ is not respected in screenToWorld, and bugged on iOS initial load”, 2015 URL: https://github.com/playcanvas/engine/issues/328
- [44] marcbruederlin “Detect device pixel ratio”, 2017 URL: https://github.com/marcbruederlin/particles.js/issues/9
- [45] Alessandro Marchetto, Filippo Ricca and Paolo Tonella “An empirical validation of a web fault taxonomy and its usage for web testing” In Journal of Web Engineering, 2009, pp. 316–345
- [46] mathiastiberghien “Damage/redraw boundary issue for Canvas renderer”, 2020 URL: https://github.com/vega/vega/issues/2425
- [47] Rafael Maiani Mello, Pedro Corrêa Da Silva and Guilherme Horta Travassos “Investigating probabilistic sampling approaches for large-scale surveys in software engineering” In Journal of Software Engineering Research and Development 3.1 SpringerOpen, 2015, pp. 1–26
- [48] michaelgrc “How to draw a straight line before and after a wave using siriwave.js”, 2015 URL: https://github.com/kopiro/siriwave/issues/8
- [49] Kevin Moot “Handling user input in HTML5 Canvas-based games”, 2012 URL: https://developer.ibm.com/tutorials/wa-games/?mhsrc=ibmsearch_a&mhq=induction
- [50] Mozilla “Allowing cross-origin use of images and canvas”, 2021 URL: https://developer.mozilla.org/en-US/docs/Web/HTML/CORS_enabled_image
- [51] Mozilla “Canvas: The Graphics Canvas element”, 2021 URL: https://developer.mozilla.org/en-US/docs/Web/HTML/Element/canvas
- [52] Mozilla “CanvasRenderingContext2D.arc()”, 2021 URL: https://developer.mozilla.org/en-US/docs/Web/API/CanvasRenderingContext2D/arc
- [53] Mozilla “Cross-Origin Resource Sharing (CORS)”, 2021 URL: https://developer.mozilla.org/en-US/docs/Web/HTTP/CORS
- [54] Mozilla “Introduction to the DOM”, 2021 URL: https://developer.mozilla.org/en-US/docs/Web/API/Document_Object_Model/Introduction
- [55] newerton “Calculation of bytes”, 2014 URL: https://github.com/blueimp/JavaScript-Canvas-to-Blob/issues/20
- [56] nicoladaoud “Blocks don’t snap correctly after flowchart becomes large in size (blocks do not update positions correctly)”, 2019 URL: https://github.com/alyssaxuu/flowy/issues/31
- [57] NisSAM “saveImage returns image with the black background”, 2012 URL: https://github.com/HumbleSoftware/Flotr2/issues/173
- [58] Nokitoo “Entities destruction memory leak”, 2018 URL: https://github.com/playcanvas/engine/issues/1299
- [59] Nur Nurmuliani, Didar Zowghi and Susan P Williams “Using card sorting technique to classify requirements change” In Proceedings. 12th IEEE International Requirements Engineering Conference, 2004., 2004, pp. 240–248 IEEE
- [60] Frolin S Ocariza, Kartik Bajaj, Karthik Pattabiraman and Ali Mesbah “A study of causes and consequences of client-side JavaScript bugs” In IEEE Transactions on Software Engineering 43.2 IEEE, 2016, pp. 128–144
- [61] Rebecca Passonneau “Measuring agreement on set-valued items (MASI) for semantic and pragmatic annotation”, 2006
- [62] paulmasson “Documentation pages with iframe unreadable on iOS”, 2016 URL: https://github.com/mrdoob/three.js/issues/9195
- [63] pdfowler “Continued CORS Issues”, 2018 URL: https://github.com/mosch/react-avatar-editor/issues/268
- [64] pdincubus “0% in IE8 shows full pie chart”, 2013 URL: https://github.com/rendro/easy-pie-chart/issues/8
- [65] peternewman “Wind icon animation and non 1:1 aspect ratios”, 2019 URL: https://github.com/darkskyapp/skycons/issues/28
- [66] pilootchoum “OnSnap not working properly”, 2020 URL: https://github.com/alyssaxuu/flowy/issues/56
- [67] pws2016 “error canvas!”, 2020 URL: https://github.com/bernii/gauge.js/issues/235
- [68] Paul Ralph “Toward methodological guidelines for process theories and taxonomies in software engineering” In IEEE Transactions on Software Engineering 45.7 IEEE, 2018, pp. 712–735
- [69] rami-dabain “detachControl not working”, 2013 URL: https://github.com/BabylonJS/Babylon.js/issues/17
- [70] rbishop-bah “Canvas path mouseover flaky”, 2013 URL: https://github.com/vega/vega/issues/101
- [71] rhysburnie “pixelated on iPhone 4 (retina)”, 2010 URL: https://github.com/sorccu/cufon/issues/154
- [72] Filippo Ricca and Andrea Stocco “Web test automation: Insights from the grey literature” In International Conference on Current Trends in Theory and Practice of Informatics, 2021, pp. 472–485 Springer
- [73] RitterD “Gauges crashing my App”, 2018 URL: https://github.com/Mikhus/canvas-gauges/issues/171
- [74] Andrew Rosenberg and Ed Binkowski “Augmenting the kappa statistic to determine interannotator reliability for multiply labeled data points”, 2004
- [75] SimilarTech “HTML5 Canvas Tag Market Share”, 2022 URL: https://www.similartech.com/technologies/html5-canvas-tag
- [76] Darja Šmite, Claes Wohlin, Zane Galviņa and Rafael Prikladnicki “An empirically based terminology and taxonomy for global software engineering” In Empirical Software Engineering 19.1 Springer, 2014, pp. 105–153
- [77] Soviut “Babylon canvas is the wrong size on retina displays”, 2014 URL: https://github.com/BabylonJS/Babylon.js/issues/319
- [78] Mihai Sucan “SVG or Canvas? Choosing Between the Two”, 2010 URL: https://dev.opera.com/articles/svg-or-canvas-choose/
- [79] Lin Tan et al. “Bug characteristics in open source software” In Empirical software engineering 19.6 Springer, 2014, pp. 1665–1705
- [80] Muhammad Usman, Ricardo Britto, Jürgen Börstler and Emilia Mendes “Taxonomies in software engineering: A systematic mapping study and a revised taxonomy development method” In Information and Software Technology 85 Elsevier, 2017, pp. 43–59
- [81] Markos Viggiato, Dayi Lin, Abram Hindle and Cor-Paul Bezemer “What Causes Wrong Sentiment Classifications of Game Reviews” In IEEE Transactions on Games IEEE, 2021
- [82] Giri Vijayaraghavan and Cem Kaner “Bug taxonomies: Use them to generate better tests” In Star East 2003, 2003, pp. 1–40
- [83] Vincenttbk “Halo does not disappear on hiding series (mobile)”, 2014 URL: https://github.com/highcharts/highcharts/issues/3533
- [84] vincenttheeten “Cannot get font() to work”, 2012 URL: https://github.com/jasondavies/d3-cloud/issues/3
- [85] WHATWG “Fetch - Living Standard”, 2021 URL: https://fetch.spec.whatwg.org/#http-cors-protocol
- [86] williamngan “canvasform.font doesn’t set font”, 2018 URL: https://github.com/williamngan/pts/issues/52
- [87] Andrew Woo, Andrew Pearce and Marc Ouellette “It’s really not a rendering bug, you see” In IEEE Computer Graphics and Applications 16.5 IEEE, 1996, pp. 21–25
- [88] Shahed Zaman, Bram Adams and Ahmed E Hassan “Security versus performance bugs: a case study on firefox” In Proceedings of the 8th working conference on mining software repositories, 2011, pp. 93–102