A fast radio burst progenitor born in a galaxy merger
Abstract
We report a Giant Metrewave Radio Telescope Hi 21 cm mapping study of the neutral atomic hydrogen (Hi) in the host galaxy of the fast radio burst (FRB) FRB 20180916B at . We find that the FRB host has an Hi mass of and a high Hi-to-stellar mass ratio, . The FRB host is thus a gas-rich but near-quiescent galaxy, that is likely to have acquired a significant mass of Hi in the recent past. The Hi distribution is disturbed, with extended Hi 21 cm emission detected in a north-eastern tail, a counter-tail towards the south, an Hi hole between the galaxy centre and the FRB location, and a high Hi column density measured close to the FRB position. The FRB host is part of a group with four companions detected in their Hi 21 cm emission, the nearest of which is only 22 kpc from the FRB location. The gas-richness and disturbed Hi distribution indicate that the FRB host has recently undergone a minor merger, which increased its Hi mass, disturbed the Hi in the galaxy disk, and compressed the Hi near the FRB location to increase its surface density. We propose that this merger caused the burst of star-formation in the outskirts of the galaxy that gave rise to the FRB progenitor. The evidence for a minor merger is consistent with scenarios in which the FRB progenitor is a massive star, formed due to the merger event.
1 Introduction
The origin of fast radio bursts (FRBs; Lorimer et al., 2007), the cosmologically-distant, highly energetic, milli-second radio pulses, is a mystery today (e.g. Cordes & Chatterjee, 2019). Understanding FRBs requires understanding the environments in which the bursts form; this is possible for FRBs that have been localized to kpc accuracy (e.g. Marcote et al., 2017, 2020; Chittidi et al., 2020; Kirsten et al., 2021; Nimmo et al., 2021a), allowing one to study the FRB environment in detail. Indeed, the nature of the FRB environments and of the host galaxies of FRBs are among the critical outstanding questions in the field.
Studies of FRB host galaxies have so far focussed on the stellar component of the FRB hosts (e.g. Heintz et al., 2020; Tendulkar et al., 2021; Mannings et al., 2021). We know very little about the gas conditions that triggered the star formation that is likely to have resulted in the FRB activity. Mapping the gas kinematics is critical for such understanding, as processes that give rise to violent star formation often leave indelible imprints upon the neutral gas. Hi 21 cm mapping studies provide an especially powerful tool to understand the recent history of a galaxy, via the signatures of different physical processes (e.g. smooth rotation, interactions, mergers, outflows, etc) in the gas spatial or velocity distributions (e.g. Sancisi et al., 2008). This is especially important in the case of minor mergers (i.e. between a massive galaxy and a smaller satellite), as these are difficult to detect in the optical photometry of galaxies, but may be identified as disturbances in the gas distribution. For example, Hi 21 cm mapping studies of the gas kinematics in the host galaxies of the nearest gamma ray burst, GRB 980425, and the fast luminous transient AT2018cow have yielded clear evidence for a disturbed gas disk, due to a merger, suggesting that the merger triggered massive star formation activity and hence the formation of the transient (e.g. Arabsalmani et al., 2015, 2019; Roychowdhury et al., 2019). Unfortunately, at present, very few identified FRB host galaxies are at sufficiently low redshifts, , to allow such sensitive Hi 21 cm mapping studies.
FRB 20180916B is a source of repeating bursts, recently discovered by the CHIME telescope (CHIME/FRB Collaboration; Andersen et al., 2019). Radio interferometric observations of FRB 20180916B have shown that the source is located in the outskirts of a spiral galaxy, SDSS J015800.28+654253.0 (hereafter, SDSS J0158+6542), at (Marcote et al., 2020). While no optical continuum or H emission is detected at the FRB location, the FRB lies pc from the brightest pixel of a region of active star-formation (Marcote et al., 2020; Tendulkar et al., 2021). The H emission from the FRB host is well fit by a thin rotating disk model (with an inclination of ), as expected for a spiral galaxy (Tendulkar et al., 2021).
We have used the Giant Metrewave Radio Telescope (GMRT) to carry out a deep Hi 21 cm study of SDSS J0158+6542, aiming to map its Hi 21 cm emission and determine its Hi properties. In this Letter, we describe the GMRT results, that have yielded the first image of the Hi distribution in an FRB host galaxy.111We use a standard flat, -cold dark matter cosmology throughout this paper, with , , and H km s-1 Mpc-1 (Planck Collaboration et al., 2020).
2 Observations and data analysis
| UVmax | Resolution | P.A. | RMS noise | N () |
| (k) | () | ∘ | (mJy beam-1) | ( cm-2) |
The GMRT Band-5 receivers were used to observe SDSS J0158+6542 in January, February, July, and August 2020, in proposals DDTC115 and 38_081 (PI: Nissim Kanekar), for a total time of hours (total on-source time hours). The GMRT Software Backend was used as the correlator, with a bandwidth of 4.167 MHz, sub-divided into 512 channels, and centred at 1374.26 MHz; the total velocity coverage is km s-1 at , with a velocity resolution of km s-1. Observations of the standard calibrators 3C48 and 3C147 at the start and the end of each run were used to calibrate the flux density scale, and of the nearby compact source J0157+7442, to calibrate the complex antenna gains and bandpass shapes.
The data were analysed in the Common Astronomy Software Applications package (casa version 5.6; McMullin et al., 2007), following standard procedures. For each observing run, we made a single-channel visibility data set and performed initial editing to elide visibilities from non-working antennas and visibilities affected by radio-frequency interference (RFI). The antenna-based complex gains were estimated from this single-channel data set, using the routine gaincalR (Chowdhury et al., 2020). The edits and gains were then applied to all channels of the multi-channel data set, and the antenna-based bandpass shapes were then estimated using the routine bandpassR (Chowdhury et al., 2020). The gains and bandpasses were then applied to the visibilities of SDSS J0158+6542, and the calibrated visibilities from all epochs combined to produce a single data set. The calibrated visibilities were then spectrally averaged, excluding edge channels and line channels, to produce a “channel-0” continuum data set, with a spectral resolution of MHz (to avoid bandwidth smearing). An iterative imaging and self-calibration procedure was then run on the channel-0 visibilities, to more accurately determine the antenna-based gains. The self-calibration solved for the phases of the complex gains alone, as the signal-to-noise ratio of the data was insufficient to accurately solve for both the relative amplitudes and the phases; the gain amplitudes were hence fixed to the values obtained from the original calibration. The imaging and self-calibration procedure, along with editing of the residual visibilities, was carried out until no improvement was seen in either the image or the residual visibilities after further iterations. The final continuum image has a synthesized beam of and a root mean square (RMS) noise of Jy/beam, away from bright continuum sources. After the self-calibration, the refined antenna-based gains were applied to the spectral-line visibility data set, and the routine uvsub was used to subtract out all continuum emission from the calibrated visibilities. The residual visibilities were then inspected visually, and any data affected by low-level RFI were removed.
The hybrid array configuration of the GMRT (Swarup et al., 1991) allowed us to make Hi 21 cm images with a wide range of angular resolutions. Our search for Hi 21 cm emission from SDSS J0158+6542 was carried out by imaging the residual calibrated visibilities at a velocity resolution of 12.5 km s-1, to produce spectral cubes at angular resolutions of . This provided measurements of the total Hi content of SDSS J0158+6542 and its Hi spatial and kinematic distributions, using coarse and fine angular resolutions, respectively. Before making the spectral cube at any given resolution, we first made a continuum image from the residual visibilities of the off-line channels (also excluding the edge channels), and subtracted out any detected continuum emission from the full visibility data set. This was done in order to remove any extended continuum emission that was not detected in our original -resolution continuum image. The cubes were made using the routine tclean with the Briggs robust parameter (Briggs, 1995) set to , in the barycentric frame. The cubes were “cleaned” during the imaging process, down to a threshold of , where is the RMS noise on each 12.5 km s-1 plane of the cube. Finally, for each cube, the routine imcontsub was used to fit, and subtract out, a first-order polynomial to line-free regions (again excluding edge channels), in order to remove any residual spectral baseline. Table 1 summarizes the details of the different spectral cubes.
Next, the spatial and kinematic distributions of Hi in galaxies can be studied by taking velocity moments of the 3-dimensional spectral cubes, integrating over the velocity axis to obtain 2-dimensional images. The zeroth moment image yields the velocity-integrated Hi 21 cm emission at each spatial location, while the first moment image yields the Hi velocity field, weighted by the Hi 21 cm line intensity. The moment images were made with the routine momnt in the Astronomical Image Processing System (aips; Greisen, 2003) package, producing Hi images and velocity fields of SDSS J0158+6542 and its environs at angular resolutions of . While making the moment images, each cube was first visually inspected to identify the velocity range of Hi 21 cm emission, between nulls; this was used to select the velocity range over which the cubes were integrated. Next, in order to not be biased by noise peaks in the spectral cubes, we used a flux density threshold for the inclusion of putative Hi 21 cm emission signals in the moment images. The threshold was applied after smoothing the cube in velocity (Hanning smoothing to a resolution of km s-1) and position [smoothing by a Gaussian with full width at half maximum the synthesized beam]. A threshold of was chosen, after applying the above smoothing, where is the RMS noise per 12.5 km s-1 channel for each spectral cube. We emphasize that the smoothing was only carried out in order to mask the original cubes, and that the results do not depend significantly on the choice of the threshold. For the velocity fields, noise spikes were further excluded by blanking the final images at locations that did not show a clear detection of Hi 21 cm emission in the Hi intensity image.
3 Results and Discussion
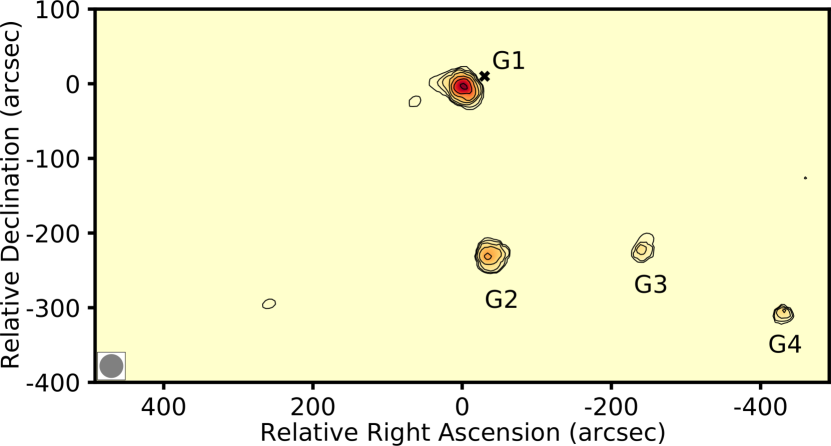
The large-scale Hi spatial distribution of the field of SDSS J0158+6542, at an angular resolution of , is shown in Fig. 1. This was obtained by integrating the Hi 21 cm emission over the velocity range km s-1 to km s-1, to cover the velocity range of the Hi 21 cm emission detected from all galaxies in the field. Besides the Hi 21 cm emission of SDSS J0158+6542, emission is also detected from three galaxies to the south and south-west, indicated as G2, G3, and G4 in the figure, all , i.e. kpc, away from SDSS J0158+6542. The Hi 21 cm emission of SDSS J0158+6542 is seen to be resolved in Fig. 1, even at the coarse angular resolution of . The emission extends over a region of angular size ; a similar angular extent is obtained from the image made at a resolution of (not shown here).
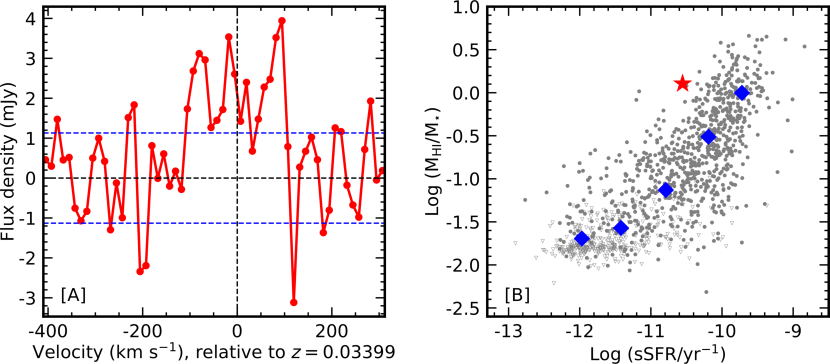

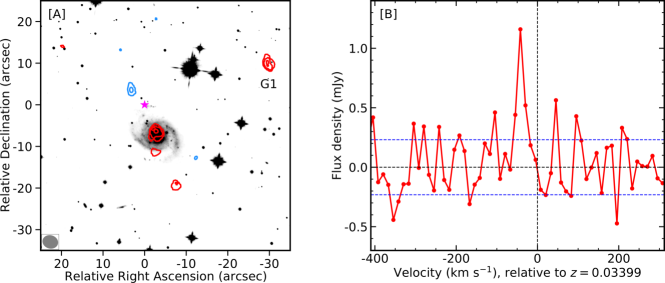
Fig. 2[A] shows the Hi 21 cm spectrum of SDSS J0158+6542, obtained from the spectral cube at a resolution of . The Hi 21 cm emission is detected at significance and is extended over a velocity range of km s-1 (between nulls), with a velocity-integrated line flux density of Jy km s-1. This implies an Hi mass of . The star-formation rate (SFR) and stellar mass of SDSS J0158+6542 are yr-1 and , respectively (Heintz et al., 2020); this gives a specific star-formation rate (sSFR) of per year. Combining the stellar mass and the Hi mass, we obtain an Hi-to-stellar mass ratio of .
Fig. 2[B] compares the Hi-to-stellar mass ratio of SDSS J0158+6542 with that of galaxies (at similar redshifts) of the stellar-mass-selected xGASS sample (Catinella et al., 2018). The figure shows that xGASS galaxies with sSFR values comparable to that of SDSS J0158+6542 have median Hi-to-stellar mass ratios , lower than that of SDSS J0158+6542 by an order of magnitude. Indeed, the ratio for SDSS J0158+6542 lies above the envelope of the ratios for the xGASS galaxies with comparable sSFR values, indicating that SDSS J0158+6542 is a gas-rich galaxy. Further, SDSS J0158+6542 lies well below the star-forming main sequence, and is almost a quiescent galaxy (Bhandari et al., 2021). The combination of gas-richness and near-quiescence indicates that SDSS J0158+6542 has acquired significant amounts of Hi in the recent past.
Next, to characterize the spatial and velocity distribution of the Hi in SDSS J0158+6542, we mapped the Hi 21 cm emission at an angular resolution of ; this provides independent beams across the galaxy, with a spatial resolution of , while retaining a high Hi column density sensitivity. Fig. 3[A] shows the velocity-integrated Hi 21 cm image of SDSS J0158+6542 at this resolution, overlaid on the Hubble Space Telescope (HST) F110W image (Tendulkar et al., 2021; Mannings et al., 2021), while Fig. 3[B] shows the Hi 21 cm-intensity weighted Hi velocity field; the FRB location is indicated by the magenta star in each panel.
Fig. 3[A] shows that the Hi 21 cm emission arises from well beyond the optical extent of the galaxy, towards the north-east and the south. The Hi 21 cm emission breaks up into three distinct components, one extending southwards from the optical galaxy centre, and the other two to the north and north-east of the optical galaxy, with the northern emission abutting on the FRB position. The Hi spatial distribution, with an Hi tail to the north-east and a counter-tail to the south, is reminiscent of minor merger galaxies of the M51 type (Rots et al., 1990; Verheijen & Sancisi, 2001; Hibbard et al., 2001). A clear hole is seen in the Hi distribution between the galaxy centre and the FRB location; the upper limit on the Hi column density in this region is cm-2 per 12.5 km s-1 channel. The contours of the Hi 21 cm emission around the galaxy centre lie close together towards the north, but are extended towards the south, indicating that the Hi in the northern part of the galaxy has been compressed.
The intensity-weighted Hi velocity field of SDSS J0158+6542 of Fig. 3[B] shows that the gas velocities are blueshifted to the east and north-east of the FRB location, but redshifted south of the FRB location (relative to the galaxy redshift ; Tendulkar et al., 2021). The Hi velocity field is very different from that expected from a rotating disk galaxy, and, in fact, shows no evidence of regular rotation. The velocity increases along the Hi tail to the north-east of SDSS J0158+6542, as is typical in minor merger tails (e.g. Rots et al., 1990).
Moving to even finer resolution, the resolution image of Fig. 4[A] is a composite, made by separately integrating over the two velocity ranges, km s-1 (blue contours), and km s-1 (red contours). This was done because the Hi 21 cm emission in the detected regions shows a clear separation in velocity, and the signal-to-noise ratio in each region can hence be increased by narrowing the velocity range to only pick out its Hi 21 cm emission. Fig. 4[A] shows that, at a resolution of , the Hi arises from compact components at the centre of the optical galaxy and close to the FRB location. Further, a new compact component, from the companion G1, is now visible to the north-west of SDSS J0158+6542. Fig. 4[B] shows the Hi 21 cm emission spectrum from the Hi clump close to (within kpc of) the FRB location; this has a very high Hi column density of cm-2, within a factor of of the Hi column density at the centre of the galaxy. This Hi clump lies adjacent to, and to the north-east of, the V-shaped knot of star-formation detected in the HST image (Marcote et al., 2020; Tendulkar et al., 2021). It has been suggested (Marcote et al., 2020) that this star-forming knot might have arisen due to an interaction, either within SDSS J0158+6542 or between the galaxy and a dwarf companion.
Taken together, our results suggest that SDSS J0158+6542 has recently undergone a minor merger with a gas cloud or a galaxy, that resulted in an increase in its gas content, disturbed the Hi in the galaxy disk, compressed the Hi near the FRB location, and yielded a distorted velocity field. It is likely that the increased Hi column density triggered a burst of star-formation that gave rise to both the FRB progenitor and the star-forming knot seen in the optical image (Marcote et al., 2020; Tendulkar et al., 2021; Mannings et al., 2021).
The FRB site lies between the star-forming knot detected in H emission (Tendulkar et al., 2021) and the location of high Hi column density in Fig. 4[A]. We tentatively detect (at significance) Hi 21 cm emission from the FRB location, obtaining an Hi column density of cm-2. However, the angular separation between the FRB site and the star-forming knot is only , an order of magnitude smaller than our angular resolution of ; it is hence possible that the detected Hi 21 cm emission arises from the star-forming knot, rather than from the FRB location. A low Hi column density at the FRB location would be consistent with the low free-free optical depth inferred from the detections of bursts at frequencies of MHz (Chawla et al., 2020; Pleunis et al., 2021), and with the non-detection of H emission at the FRB location (Tendulkar et al., 2021). These suggest that the FRB site has a low gas column density and is hence unlikely to be a star-forming region; the FRB source appears likely to have moved to its present location from the star-forming knot detected in the HST image (Tendulkar et al., 2021).
| Galaxy | J2000 co-ordinates | V | M | |
| Jy km s-1 | km s-1 | |||
| J0158+6542 | 01h58m00.28s, +65d42′53.10′′ | |||
| G1 | 01h57m55.94s, +65d43′10.16′′ | |||
| G2 | 01h57m55.53s, +65d39′08.53′′ | |||
| G3 | 01h57m22.15s, +65d39′12.28′′ | |||
| G4 | 01h56m52.21s, +65d37′50.87′′ |
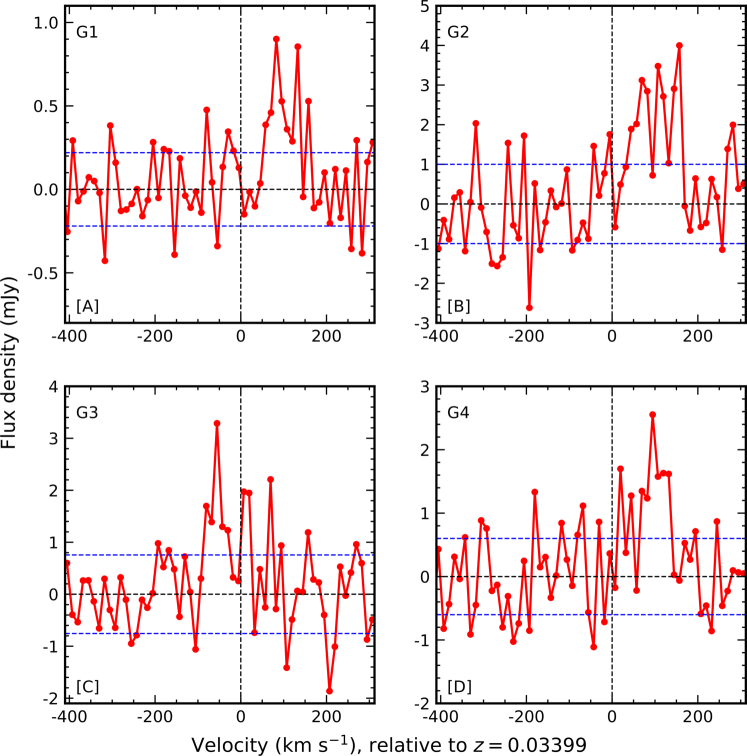
We measured the integrated the Hi 21 cm line flux densities of the companions G2, G3, and G4 from the spectral cube with an angular resolution of , and of G1 from the higher-sensitivity cube with an angular resolution of ; the Hi 21 cm spectra are shown in Fig. 5. In all cases, we also measured the integrated Hi 21 cm line flux densities at coarser resolutions, to ensure that we do not resolve out any spatially-extended emission. The positions of the galaxies (including SDSS J0158+6542), and their integrated Hi 21 cm line flux densities, Hi 21 cm line velocity widths, and Hi masses are listed in Table 2.
Our present data do not definitively identify the counterpart of SDSS J0158+6542 in the minor merger. It is tempting to identify G1, by far the closest of the Hi companions of SDSS J0158+6542 (only kpc away), as the merger companion. However, the mass of G1 is relatively low, , a factor of lower than that of SDSS J0158+6542. A merger with G1 is thus unlikely to have significantly increased the Hi-to-stellar mass ratio of the FRB host galaxy. Further, no optical emission is detected from the location of G1 in the HST F110W image (Mannings et al., 2021; Tendulkar et al., 2021); this suggests that G1 may be an Hi cloud in the circumgalactic medium of SDSS J0158+6542, rather than a companion galaxy. However, the Hi mass of G1 is significantly larger than that of the high-velocity cloud population in the Milky Way (Putman et al., 2012; Westmeier, 2018), making it unlikely that G1 is a normal high-velocity cloud. It is possible that G1 consists of gas pushed out of SDSS J0158+6542 by the minor merger; this would explain both the lack of a stellar counterpart and the higher Hi mass than that of typical high-velocity clouds.
An estimate of the dynamical mass of the FRB host may be obtained from the Hi 21 cm spectrum of Fig. 2[A], by assuming that the Hi lies in a disk and that the velocity spread arises due to rotation. Using the optical inclination, (Tendulkar et al., 2021), we obtain a maximum rotation velocity, km s-1. The angular extent of the Hi 21 cm emission is , implying a radius of kpc. For a rotating disk, we then obtain a dynamical mass of (e.g. Yu et al., 2020). This estimate is likely to be too high by a factor of a few, as the above estimates of both the radius and the maximum rotation velocity contain non-rotational contributions.
Similar disturbed Hi spatial distributions have been identified in the host galaxies of a nearby gamma ray burst GRB 980425 (Arabsalmani et al., 2019) and a fast blue optical transient AT2018cow (Roychowdhury et al., 2019). In both cases, high Hi column densities were found close to the location of the transient, akin to the situation for FRB 20180916B. This suggests that, similar to long-duration gamma-ray bursts and fast optical transients, the progenitor of the source of FRB 20180916B is likely to be a massive star, formed due to the merger event. The birth of the progenitor of the FRB source in a recent merger event is consistent with results from earlier studies of FRB 20180916B that suggest that the FRB arises in a neutron star in a high-mass X-ray binary system (Chime/FRB Collaboration; Amiri et al., 2020; Nimmo et al., 2021b; Tendulkar et al., 2021; Pleunis et al., 2021).
References
- Arabsalmani et al. (2015) Arabsalmani, M., Roychowdhury, S., Zwaan, M. A., Kanekar, N., & Michalowski, M. J. 2015, MNRAS, 454, L51
- Arabsalmani et al. (2019) Arabsalmani, M., Roychowdhury, S., Starkenburg, T. K., et al. 2019, MNRAS, 485, 5411
- Bhandari et al. (2021) Bhandari, S., Heintz, K. E., Aggarwal, K., et al. 2021, arXiv e-prints, arXiv:2108.01282
- Briggs (1995) Briggs, D. S. 1995, in American Astronomical Society Meeting Abstracts, Vol. 187, American Astronomical Society Meeting Abstracts, 112.02
- Catinella et al. (2018) Catinella, B., Saintonge, A., Janowiecki, S., et al. 2018, MNRAS, 476, 875
- Chawla et al. (2020) Chawla, P., Andersen, B. C., Bhardwaj, M., et al. 2020, ApJ, 896, L41
- Chime/FRB Collaboration; Amiri et al. (2020) Chime/FRB Collaboration; Amiri, M., Andersen, B. C., Bandura, K. M., et al. 2020, Nature, 582, 351
- CHIME/FRB Collaboration; Andersen et al. (2019) CHIME/FRB Collaboration; Andersen, B. C., Bandura, K., Bhardwaj, M., et al. 2019, ApJ, 885, L24
- Chittidi et al. (2020) Chittidi, J. S., Simha, S., Mannings, A., et al. 2020, arXiv e-prints, arXiv:2005.13158
- Chowdhury et al. (2020) Chowdhury, A., Kanekar, N., Chengalur, J. N., Sethi, S., & Dwarakanath, K. S. 2020, Nature, 586, 369
- Cordes & Chatterjee (2019) Cordes, J. M., & Chatterjee, S. 2019, ARA&A, 57, 417
- Greisen (2003) Greisen, E. W. 2003, in Astrophysics and Space Science Library, Vol. 285, Information Handling in Astronomy - Historical Vistas, ed. A. Heck, 109
- Heintz et al. (2020) Heintz, K. E., Prochaska, J. X., Simha, S., et al. 2020, ApJ, 903, 152
- Hibbard et al. (2001) Hibbard, J. E., van Gorkom, J. H., Rupen, M. P., & Schiminovich, D. 2001, in Astronomical Society of the Pacific Conference Series, Vol. 240, Gas and Galaxy Evolution, ed. J. E. Hibbard, M. Rupen, & J. H. van Gorkom, 657
- Kirsten et al. (2021) Kirsten, F., Marcote, B., Nimmo, K., et al. 2021, arXiv e-prints, arXiv:2105.11445
- Lorimer et al. (2007) Lorimer, D. R., Bailes, M., McLaughlin, M. A., Narkevic, D. J., & Crawford, F. 2007, Science, 318, 777
- Mannings et al. (2021) Mannings, A. G., Fong, W.-f., Simha, S., et al. 2021, ApJ, 917, 75
- Marcote et al. (2017) Marcote, B., Paragi, Z., Hessels, J. W. T., et al. 2017, ApJ, 834, L8
- Marcote et al. (2020) Marcote, B., Nimmo, K., Hessels, J. W. T., et al. 2020, Nature, 577, 190
- McMullin et al. (2007) McMullin, J. P., Waters, B., Schiebel, D., Young, W., & Golap, K. 2007, in Astronomical Society of the Pacific Conference Series, Vol. 376, Astronomical Data Analysis Software and Systems XVI, ed. R. A. Shaw, F. Hill, & D. J. Bell, 127
- Nimmo et al. (2021a) Nimmo, K., Hewitt, D. M., Hessels, J. W. T., et al. 2021a, arXiv e-prints, arXiv:2111.01600
- Nimmo et al. (2021b) Nimmo, K., Hessels, J. W. T., Keimpema, A., et al. 2021b, Nature Astronomy, 5, 594
- Planck Collaboration et al. (2020) Planck Collaboration, Aghanim, N., & et al. 2020, A&A, 641, A6
- Pleunis et al. (2021) Pleunis, Z., Michilli, D., Bassa, C. G., et al. 2021, ApJ, 911, L3
- Putman et al. (2012) Putman, M. E., Peek, J. E. G., & Joung, M. R. 2012, ARA&A, 50, 491
- Rots et al. (1990) Rots, A. H., Bosma, A., van der Hulst, J. M., Athanassoula, E., & Crane, P. C. 1990, AJ, 100, 387
- Roychowdhury et al. (2019) Roychowdhury, S., Arabsalmani, M., & Kanekar, N. 2019, MNRAS, 485, L93
- Sancisi et al. (2008) Sancisi, R., Fraternali, F., Oosterloo, T., & van der Hulst, T. 2008, A&A Rev., 15, 189
- Swarup et al. (1991) Swarup, G., Ananthakrishnan, S., Kapahi, V. K., et al. 1991, Current Science, 60, 95
- Tendulkar et al. (2021) Tendulkar, S. P., Gil de Paz, A., Kirichenko, A. Y., et al. 2021, ApJ, 908, L12
- Verheijen & Sancisi (2001) Verheijen, M. A. W., & Sancisi, R. 2001, A&A, 370, 765
- Westmeier (2018) Westmeier, T. 2018, MNRAS, 474, 289
- Yu et al. (2020) Yu, N., Ho, L. C. & Wang, J. 2020, ApJ, 898, 102