Structural changes across thermodynamic maxima in supercooled liquid tellurium:
a water-like scenario
Abstract
Liquid polymorphism is an intriguing phenomenon which has been found in a few single-component systems, the most famous being water. By supercooling liquid Te to more than 130 K below its melting point and performing simultaneous small-angle and wide-angle X-ray scattering measurements, we observe clear maxima in its thermodynamic response functions around 615 K, suggesting the possible existence of liquid polymorphism. A close look at the underlying structural evolution shows the development of intermediate-range order upon cooling, most strongly around the thermodynamic maxima, which we attribute to bond-orientational ordering. The striking similarities between our results and those of water, despite the lack of hydrogen-bonding and tetrahedrality in tellurium, indicate that water-like anomalies may be a general phenomenon among liquid systems with competing bond- and density-ordering.
I Introduction
Liquid polymorphism, or the existence of two or more liquid phases of the same substance, is a topic of much current interest [1, 2]. Although the concept dates back to at least the 1960s [3], supporting evidence had been lacking until recent years, when observations of phenomena related to liquid polymorphism began to emerge in a variety of systems. Perhaps the most intriguing among these are single-component systems, where the polymorphism points out the insufficiency of the theory of simple liquids [4] to describe real, albeit compositionally simple, fluid systems, while suggesting the strong influence of local structures even for the properties of amorphous materials. The current list of systems with clear experimental evidence for a liquid-liquid transition (LLT), in decreasing complexity, includes large molecules such as triphenyl phosphite [5] and atomic systems such as phosphorus [6, 7], sulfur [8], and cerium [9]. Meanwhile, an LLT has been suggested in many other systems with varying degrees of experimental and theoretical evidence [2].
Among these systems, water is perhaps the most famous. It is well-known that water exhibits a number of thermodynamic anomalies such as a density maximum at 4 ∘C under ambient pressure. Among the different scenarios explaining water’s anomalies [10, 11], the second critical point hypothesis [12] has emerged to be a leading theory, as it is observed in recent simulations of water models [13, 14] while also consistent with experimental results [15, 16] (although the latter ones are not without controversy [17, 18]). Under this framework, there exists an LLT in water in the deeply supercooled region and under elevated pressures, and the coexistence line of this LLT terminates at a liquid-liquid critical point (LLCP). A peculiar aspect of the LLT in liquid water, distinguishing it from most other systems, is the fact that the low-density liquid phase lies on the low temperature side of the transition. While this explains the density maximum in a straightforward way [12, 11], it also leads to the distinctive phase diagram where the LLT exists at higher pressures than the LLCP, thus setting water apart from other single-component systems mentioned above. In addition, the critical pressure is predicted to be positive but not far from zero, so thermodynamic effects related to critical fluctuations can be observed along the isobar [15]. These effects manifest as maxima in thermodynamic response functions such as the isothermal compressibility, and they form a line emanating from the LLCP usually referred to as the Widom line [19]. For ordinary water (H2O), evidence suggests that the Widom line intersects the isobar around 229 K [15]. A schematic phase diagram proposed for water is shown in Fig. S1.
In general, the physical origin of water’s peculiarities is not entirely clear, and it remains an open question whether they are unique to water or are general to a family of liquids. In fact, it has been suspected that other tetrahedrally coordinated systems (such as silicon) exhibit similar behaviors [20, 21]. Another candidate is liquid tellurium (Te), whose lack of tetrahedrality makes it a somewhat surprising example. As observed first by Kanno et al. [22] and reiterated by Angell [23], liquid Te also exhibits a variety of thermodynamic anomalies which bear a striking resemblance to those of water. A systematic study of the properties of liquid Te thus can be informative on the universality of water-type LLT, bearing significance from a fundamental physics aspect. From a practical point of view, Te is the basis element of several phase-change materials (PCMs) that are becoming increasingly important for information technology [24]. Thus, it is reasonable to expect that the phenomena attributed to liquid polymorphism in Te-based PCMs [25] are related to a possible LLT in liquid Te.
Therefore, in this work, we study the properties of bulk supercooled liquid Te under low vapor pressure ( mbar). We observe maxima in various thermodynamic response functions, including the isothermal compressibility, around 615 K. Moreover, we are able to determine details of the structural changes across the thermodynamic response maxima, which show many similarities with water. Our results clearly show that intermediate-range ordering plays a central role in the structural modification, and indicate that water-like thermodynamic anomalies may be attributed to a competition between density- and bond-ordering regardless of the details of the local structure.
II Simultaneous SAXS and WAXS
In order to systematically study the thermodynamic and structural changes, we performed simultaneous small-angle and wide-angle X-ray scattering (SAXS and WAXS) measurements at beamline 1-ID at the Advanced Photon Source. The high X-ray photon energy, 76.112 keV, allows us to probe bulk Te samples in a simple transmission geometry (see Materials and Methods for details).
Our dataset includes three scans. The scans are temporally separated during the experiment, performed on different samples, and the X-ray beam condition differs between the scans. The consistency of the results from all scans, as will be shown below, strongly supports our conclusions. Each scan consists of several rounds of temperature cycling, where in each round the sample is first heated above its melting point of 723 K and then cooled down in steps (usually 10 K) to the lowest temperature. At each step, after temperature equilibration, X-ray scattering patterns are collected for several minutes. Recrystallization happens suddenly and can be identified by the appearance of sharp Bragg peaks in the WAXS pattern; these data are excluded from the analysis.
Figure 1 shows the WAXS and SAXS results from scan 1. The structure factor is obtained from the WAXS patterns, and the results agree well with those in the literature (see SI Appendix). Several trends can be clearly observed. Firstly, with cooling, the first peak moves to lower values, which is similar to the behavior of water [15, 26]. The second peak becomes sharper while its position remains relatively constant at 3.3 Å-1. The broad third peak spanning 4 to 6 Å-1 gradually changes its symmetry upon cooling, with the low- side centered around 4.4 Å-1 decreasing in magnitude and the high- side centered around 5.1 Å-1 growing. Remarkably, the same phenomenon has been observed in ab initio molecular dynamics (AIMD) simulations [27], although the growth of the high- side becomes obvious in that study only at the very low temperature of 560 K.
An interesting feature is the presence of a pre-peak centered around 1.4 Å-1. More detailed analysis of this pre-peak will be presented later. We note here that a pre-peak is also observed in Te-based chalcogenides such as Ge15Te85 [28, 29, 30, 31], as well as phase-change materials [32] particularly in the supercooled liquid region. In these materials, the appearance of the pre-peak is attributed mostly to the Ge atoms [29] and explained as a Peierls-like distortion [30, 31]. Here in pure Te, the pre-peak is found to exist above the melting point as well, where the liquid is metallic [33]. Therefore, a Peierls-like distortion is unlikely, while it is possible that the pre-peak arises from bond-orientational order, as will be discussed later.
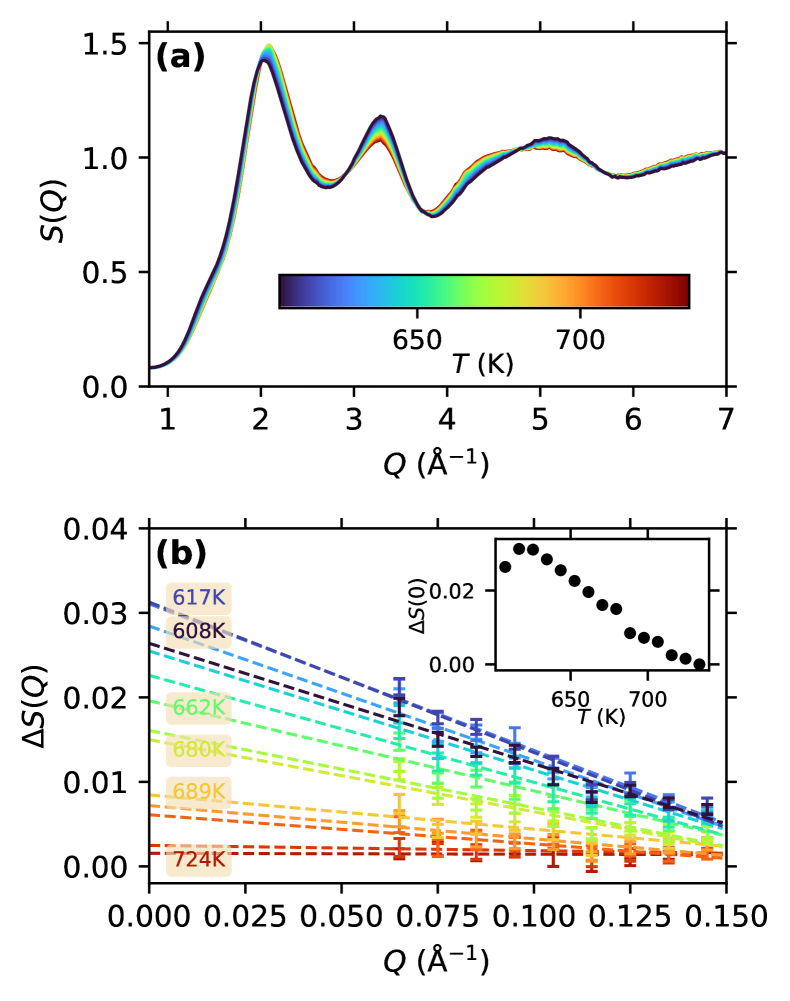
For SAXS, as in most other atomic liquids, the structure factor of liquid Te is much less than unity and the scattering is weak. Consequently, the background is significant and its pattern depends on the position of the sample and the furnace, and thus it is difficult to be measured and subtracted accurately. Nonetheless, within each scan, sample movement is negligible and the background pattern is expected to remain unchanged. Therefore, for the SAXS analysis we calculate the change in the structure factor, , from the highest temperature in each scan, which cancels out the background. For scan 1, this is 733 K, above the melting point at 723 K. The results are shown in Fig. 1b, and they show unambiguously a non-monotonic behavior with cooling: while increases at first, it begins to decrease at the lowest temperatures. To quantify the change, as in earlier works on chalcogen systems [34], we fit a linear function to with the results shown as dashed lines. The extracted intercept, , is plotted against temperature in the inset, and a peak can be clearly observed. This suggests the existence of thermodynamic maxima to be discussed below.
III Maxima in the thermodynamic response functions
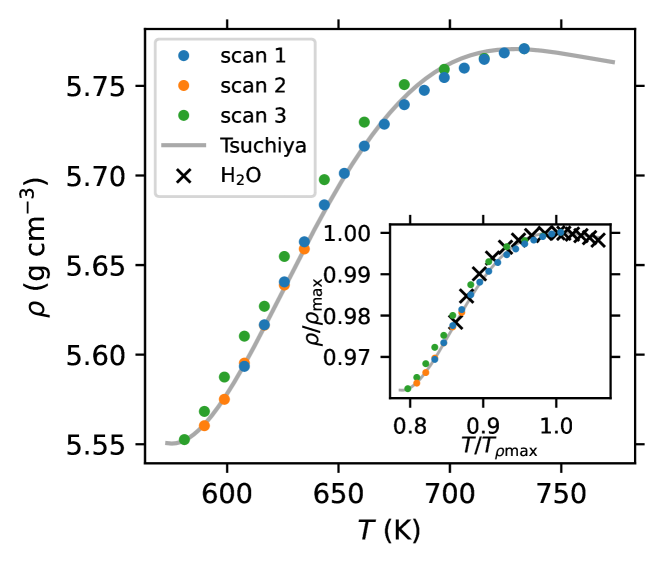
The non-monotonic behavior in the SAXS region bears much resemblance to recent results on supercooled water [15], where it is found to associate with the liquid-liquid transition. We now look further into the extent of similarities between the two systems. The density maximum at 4 ∘C is often thought to be a salient anomaly of water. Figure 2 shows our results from all three scans on the density of supercooled liquid Te obtained with X-ray transmission measurements (see SI Appendix). The results are consistent between scans, and all agree well with the values previously reported by Tsuchiya [35]. The inset shows the same data plotted on reduced scales normalized by the maximum density g/cm3 and the corresponding temperature K. When the available data on water is plotted on the same reduced scale (with g/cm3 and K), a remarkable resemblance between the two systems can be observed, as has been pointed out in the literature [22, 23]. In comparison, other tetrahedral systems such as silica (in experiment) [36] and silicon (in simulation) [37] show a density maximum that is significantly broader. Thus, the similarities between Te and water may suggest that the degree of structural ordering is comparable between them [38].
As in the case of water [11], the density anomaly in liquid Te hints at the possible existence of liquid polymorphism. To provide further evidence for this scenario, in Fig. 3 we show, with colored symbols representing different scans, four properties of liquid Te: (a) the limit of the structure factor, , (b) the isothermal compressibility, , (c) the temperature derivative of the position of the first peak, , and (d) the opposite of the thermal expansion coefficient . Of these quantities, can be obtained from the WAXS data in a straightforward way, and can be derived from the density measurement shown above. To obtain and , we use the following relation [41]:
| (1) |
where is the Boltzmann constant and is the mass of the Te atom. For , the value at the highest temperature for each scan is determined using Eq. (1) and a known value of : for scans 1 and 3, this is above the melting point and we use the value given in Ref. [35]; for scan 2, we use the results from the other two scans. Because we have measured the relative change from the highest temperature, the values of and are then obtained. The presence of maxima is evident in all panels of Fig. 3. For and we note that, although the procedure described above is used to obtain their absolute values, the maxima can already be seen in as shown in Fig. 1b as well as Figs. S10b and S11b in SI Appendix. The approximate position of the maxima, 615 K, is marked with a dashed vertical line in Fig. 3, while the shaded region indicates a K range as a guide to the eye.

The existence and the shape of these maxima provide crucial information on the thermodynamics of liquid Te, in particular the possible morphology of its liquid phase diagram, which has not been discussed much in the literature. Given the similarities between the thermodynamic properties of Te and water, however, it is reasonable to refer to studies on the latter, of which an extensive amount exist. Specifically, to explain water’s thermodynamic anomalies most of which are shared by Te, four scenarios have been proposed [10, 11]: (i) the “retracting spinodal” scenario [42], where the anomalies are consequences of the liquid-vapor spinodal re-entering the supercooled liquid region; (ii) the “second critical point” scenario [12], where the anomalies are effects related to an LLCP located in the supercooled region at positive pressures; (iii) the “hidden critical point” scenario [43], where the LLCP is located in the unstable region defined by the liquid-vapor spinodal and is thus unreachable; (iv) the “singularity free” scenario, where the thermodynamic maxima exist but there is no critical point on the phase diagram [44]. For liquid Te, the maxima observed in Fig. 3 rule out scenario (i) which predicts divergence due to the spinodal [42], while the breadth of these maxima and the continuous change in the structure factor (e.g., ) excludes scenario (iii) where a first-order LLT is expected [43].
Therefore, we are left with the LLCP scenario (ii) and the singularity-free scenario (iv). The present results do not fully confirm or exclude either case, since the fluctuations observed here are not large enough to be attributed to large-scale critical fluctuations, which only exist very close to a critical point. However, it should be noted that the mechanism underlying the singularity-free models proposed so far is the existence of two local states in the liquid and the interconversion between them, which is often referred to as the “two-state model” [11, 45, 46, 2]. Several of these models can be understood as variations of the LLCP model where the LLCP is inaccessible, for example because it is located at K [44, 47] or because the critical density is too high to be reached [45]. In those cases, the physics governing the behavior of the liquid is the same as that for the “supercritical” states in the LLCP scenario, which include the isobar. Nonetheless, given the lack of an actual LLCP in those cases, it may not be accurate to use the term “Widom line” to describe the thermodynamic response maxima; instead, the term “Schottky line” derived under the framework of the two-state model has been used in some works [2, 48]. Since our results do not distinguish between the two scenarios, in this work we simply use the phrase “thermodynamic response maxima” to refer to their approximate position, 615 K. It should be mentioned that similar controversies surround the interpretation of results on supercooled water as well [2, 45]; perhaps the most convincing proof would be to find the LLCP with critical-like behavior in its vicinity, as has been done in the molecular dynamics simulations of several water models [13, 2].
Notably, the maxima in all quantities shown in Fig. 3 are close to each other in temperature. This is an important observation because different quantities are expected to have a different background contribution given by the behavior of a normal liquid [48]. In particular, for ordinary liquids, increases with temperature, so the peak in is expected to shift to somewhat higher ; on the other hand, decreases with temperature for normal liquids, so the peak in should be shifted to lower . The fact that the peaks in Fig. 3b and d are very close in temperature means that the shifts are small; this is also consistent with the sharpness of the peaks. Therefore, 615 K should be a good approximation of the position of the Schottky or Widom line for liquid Te at .
Further evidence for the similarity between Te and water can be seen in Fig. 3a, where the measured values of in supercooled water [15] are also shown. Note that is a dimensionless quantity reflecting the number fluctuations in the system [41]:
| (2) |
where is the number of particles (Te atoms or water molecules) in a given sample volume and the angular brackets denote the ensemble average. Thus, the fact that is close in magnitude between Te and water at indicates that, if the LLCP exists, the critical pressure in liquid Te may be as close to zero pressure as in water.
IV Structural changes
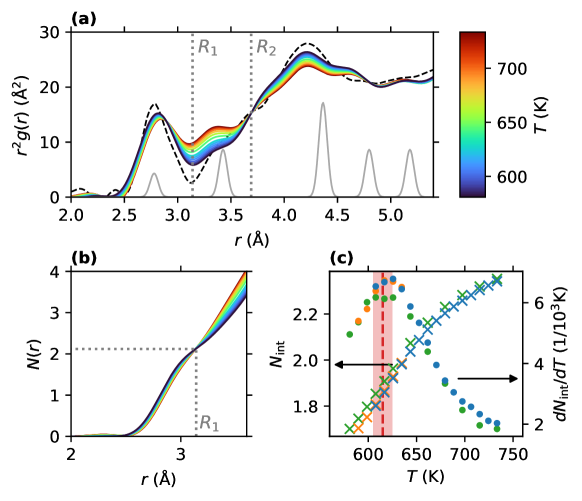
Pertinent to the phenomenon of liquid polymorphism is the underlying structural transformation between the different liquid forms. The WAXS data, with examples given in Fig. 1a, allows us to examine the microscopic structural changes across the thermodynamic maxima in detail. Our experimental setup provides data up to Å-1, and previous works have shown that little change appears in beyond 6 Å-1 across a range of 500 K [27, 49]. Therefore, we append literature data from 7 to 15 Å-1 [27, 50] to our results to obtain the radial distribution function (further details in SI Appendix), which describes the average density at a distance from a reference atom. In Fig. 4a, we show the function with cooling from 738 K to 585 K. Two salient features emerge: a decrease in the region between Å and Å, and an increase in the broad second peak from 3.7 to 4.7 Å. In Fig. 4b we plot the running coordination number, , which is obtained from and represents the averaged number of atoms within a distance from the reference atom. Indeed, the change in is small up to Å-1, where the data appears to have an isosbestic point. We thus take to be the boundary of the first coordination shell, resulting in a coordination number of approximately 2.1 under all temperatures. Remarkably, the position of also lies close to the first minimum in of amorphous Te [51], as shown in Fig. 4a, which further supports this choice of as the boundary of the first shell.
Here we note that earlier works attributed the structural transition in liquid Te to a decrease of coordination number from 3 to 2 upon cooling [33]. However, this model has been much debated in the literature [52], and it was pointed out that the measured coordination number depends sensitively on both the exact definition of the first shell boundary [53] and the available range [54]. In fact, more recent AIMD results [27] show that even the trend depends on the cutoff radius of the first shell: if the cutoff is at 3.1 Å, the coordination number increases with cooling, while it decreases with a cutoff at 3.2 Å. Notably, this is consistent with our observation that the coordination number remains constant with a cutoff around 3.14 Å, leading to the conclusion that the coordination number alone does not explain the behavior of supercooled Te.
The plots shown in Figs. 4a and 4b bear a notable resemblance to recent measurements on water [26]. In particular, an isosbestic point was also found in the running coordination number of water, leading to the conclusion that the first shell coordination is mostly constant from 300 K down to 244.2 K [26]. In addition, a depletion of molecules was found upon supercooling in the region between the first and second peak, referred to as the interstitial region [26]. This means that for both water and Te, intermediate-range ordering instead of changes in first-shell coordination drives the structural changes upon cooling and possibly distinguishes the two liquid structures: the high-temperature liquid is dominated by a denser and more disordered structure, including more interstitial atoms, while the low-temperature liquid is dominated by a less dense and more ordered structure up to the second shell.
To quantify the structural changes in liquid Te, we calculate the rate of depletion of atoms in between the first and second peaks, hereinafter referred to as the intermediate region. The lower boundary of this intermediate region is the first shell boundary , while we define the upper cutoff as the near-isosbestic point observed in , around 3.69 Å-1. Although this choice of is somewhat arbitrary, small changes do not alter the conclusions below (see SI Appendix). We can then obtain the number of atoms between and , , as a function of temperature. The results are plotted as crosses in Fig. 4c, and increases with temperature as expected. Further, the temperature derivative of can be obtained, as shown in the same panel, and it shows a peak similar in both position and shape to the maxima in Fig. 3. This provides strong evidence that the thermodynamic changes in Fig. 3 are accompanied by a fast depletion of atoms in the intermediate region, signifying an increase in intermediate-range ordering.
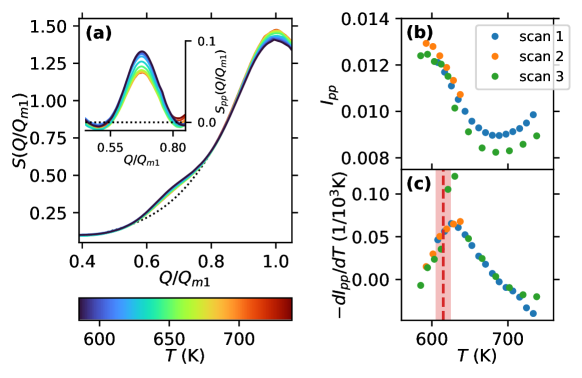
The growing intermediate-range order can also be seen in the rise of the pre-peak shown in Fig. 1a. A closer look reveals that, with cooling, the center of the pre-peak moves to lower similar to the first peak, . Therefore, to compare the pre-peak at different temperatures, in Fig. 5a we plot the structure factor as a function of the reduced momentum transfer, . In order to better visualize the pre-peak, we subtract a background indicated by the dotted line. The background is modeled as a 3-degree polynomial and fit with data before and after the pre-peak, and , where appears to change little with temperature (nevertheless, due to a possible temperature dependence, we specifically choose the data at K for the fit). After background subtraction, the data in the pre-peak region, denoted here as , is shown in the inset of Fig. 5a. Here, the near-Gaussian shape of the pre-peak and its growth with cooling becomes clear. Remarkably, the center position appears to remain the same at all temperatures. This means that the temperature dependence of the position of the pre-peak follows almost exactly that of the pre-peak, suggesting that they may share a common origin in the local structure.
For a more quantitative analysis, we obtain the integrated pre-peak intensity, , where . The temperature evolution of is shown in Fig. 5b. Below approximately 690 K, increases with cooling, gaining around 40% towards the lowest temperature measured. The increase with heating above 690 K, on the other hand, may be due to temperature-dependent changes in the background. These change are difficult to model, and because the pre-peak is a small-amplitude feature overlaid on a rapidly rising background, as can be seen in Fig. 5a, performing temperature-dependent fitting of the background leads to noisy and model-dependent results. Therefore, we have chosen to subtract the same background for all temperatures. In Fig. 5c we plot the temperature derivative, , where a peak can be seen close to the position of the thermodynamic response maxima. This signifies a rapid development of intermediate-range order consistent with the observations above. We note that, because a constant background is subtracted from all temperatures, the value of is independent from the modeling of this background. However, when interpreting the results, one should bear in mind that the temperature dependence of the actual background may contribute to the values of ; an accurate modeling of this background could be the subject of future work.
V Discussion and conclusions
The results above have shown clear evidence for rapid intermediate-range ordering across the thermodynamic response maxima in supercooled Te, but details of this ordering remain to be discussed. Here we propose that bond-orientational order plays a crucial role. The pre-peak, centered around Å-1, signals the presence of some structure on the order of Å. In the crystal, this corresponds to the distance between next-nearest neighbors within a chain (i.e., the third peak of trigonal Te in Fig. 4a), whose bonds with their common neighbor form an angle of 103.2∘ [55]. The second peak in the liquid is also close to 4.5 Å, but slightly lower in , indicating a somewhat smaller average bond angle consistent with AIMD results [27]. With decreasing temperatures, the pre-peak grows as discussed above, while AIMD shows that the bond-angle distribution becomes sharply peaked around [27]. In addition, the AIMD results have shown that two-coordinated atoms (within a soft cutoff around 3.2 Å) have a bond angle distribution which is strongly peaked around 100∘, whereas atoms with higher coordination show a broader bond-angle distribution peaked close to 90∘ [27]. This suggests that an increase in bond-orientational order would lead to a decrease in atoms in the intermediate region, as we have observed.
The similarities between Te and water in the various aspects we have discussed are worth emphasizing for several reasons. Firstly, the thermodynamic similarities indicate that the liquid phase diagrams of Te and water are likely similar. Thus, investigations into one may provide vital information for the other. Secondly, the similarities between the structural evolution of the two suggest a common microscopic origin. Our results confirm that a reduction in atoms in the intermediate region between the first and second peaks in , similar to the depletion of interstitial atoms observed in water [26], indeed accompanies the transition across the thermodynamic response maxima in liquid Te; such data is not yet available in water due to difficulties in reaching the deep supercooled state. Last but not least, the observed similarities strongly indicate that the anomalies of water are not limited to systems with hydrogen bonding or tetrahedral coordination, as is usually thought, but are general to a family of liquids. Finding the common features between Te and water may thus help generalize the origin of the observed phenomena. For example, it is well-known that water and other tetrahedral systems have an “open” local structure, while AIMD results have revealed an unusually large volume fraction of “cavities” in liquid Te as well [27]. On the other hand, the number of bonds is rather different between Te (2 to 3 per atom) and water (4 to 5 per molecule), and thus our observations indicate that the degree of thermodynamic anomalies cannot be predicted by bond number fluctuations alone.
Finally, we note that the enhanced intermediate-range ordering in the low-temperature limit is consistent with the two-state model mentioned above [46, 2], where the thermodynamic anomalies (such as the density maximum) are caused by an increasing amount of locally favored, albeit less dense, structures upon cooling. Since the presence of locally favored structures are expected in a number of liquids [2], it is reasonable to predict that more systems can be found to exhibit water-type anomalies. Studying the commonalities and differences between these systems may help reveal the role of intermediate-range structures and bond-orientational ordering in the behavior of liquids in general.
In conclusion, using a combination of small-angle and wide-angle X-ray scattering, we have observed clear maxima in the thermodynamic response functions in supercooled liquid Te as well as the structural changes that accompany it. Our results suggest that intermediate-range ordering, likely of a bond-orientational nature, is strongly associated with the anomalous properties of liquid Te. This is consistent with the two-state model and points to the possibility of liquid polymorphism in this system. Moreover, the striking resemblance between Te and water in various properties, in spite of their different local structures, points to the possible existence of water-like thermodynamic anomalies in a family of liquid systems. Thus, our study suggests that the competition between bond- and density-ordering can be a general phenomenon and plays a crucial role in the thermodynamics of liquid systems.
Materials and Methods
The samples used in this study are Te powder (99.999% metals basis, purchased from Alfa Aesar) vacuum-sealed in borosilicate glass ampoules. The inner diameter of the glass container is around 0.7 mm, and its wall thickness is around 0.085 mm.
The experiment was performed at beamline 1-ID at the Advanced Photon Source. The X-ray energy was 76.112 keV. The planes of the WAXS and SAXS detectors are 2.003 m and 6.420 m from the sample, respectively. The -positions of the WAXS detector pixels are calibrated using a CeO2 powder sample.
Further details on the experimental setup are provided in SI Appendix.
Acknowledgments
We thank Charles L. Troxel Jr. for his tremendous help during preparation for the experiment. We also thank Ali Mashayekhi for his valuable support during the experiment. This research used resources of the Advanced Photon Source, a U.S. Department of Energy (DOE) Office of Science User Facility at Argonne National Laboratory and is based on research supported by the U.S. DOE Office of Science-Basic Energy Sciences, under Contract No. DE-AC02-06CH11357. This work is supported by the U.S. Department of Energy, Office of Science, Office of Basic Energy Sciences under Contract No. DE-AC02-76SF00515; the Deutsche Forschungsgemeinschaft (DFG, German Research Foundation) through the Collaborative Research Centre (CRC) 1242, project number 278162697; and the National Science Centre, Poland, grant agreement No. 2017/27/B/ST3/02860.
References
- Stanley [2013] H. E. Stanley, ed., Liquid Polymorphism, Advances in Chemical Physics (John Wiley & Sons, Inc., Hoboken, NJ, USA, 2013).
- Tanaka [2020] H. Tanaka, Liquid–liquid transition and polyamorphism, The Journal of Chemical Physics 153, 130901 (2020).
- Rapoport [1967] E. Rapoport, Model for Melting‐Curve Maxima at High Pressure, The Journal of Chemical Physics 46, 2891 (1967).
- Hansen and McDonald [2006] J.-P. Hansen and I. R. McDonald, Theory of Simple Liquids, 3rd ed. (Academic Press, London, 2006).
- Kurita and Tanaka [2004] R. Kurita and H. Tanaka, Critical-Like Phenomena Associated with Liquid-Liquid Transition in a Molecular Liquid, Science 306, 845 (2004).
- Katayama et al. [2000] Y. Katayama, T. Mizutani, W. Utsumi, O. Shimomura, M. Yamakata, and K. Funakoshi, A first-order liquid-liquid phase transition in phosphorus, Nature 403, 170 (2000).
- Monaco et al. [2003] G. Monaco, S. Falconi, W. A. Crichton, and M. Mezouar, Nature of the First-Order Phase Transition in Fluid Phosphorus at High Temperature and Pressure, Physical Review Letters 90, 255701 (2003).
- Henry et al. [2020] L. Henry, M. Mezouar, G. Garbarino, D. Sifré, G. Weck, and F. Datchi, Liquid–liquid transition and critical point in sulfur, Nature 584, 382 (2020).
- Cadien et al. [2013] A. Cadien, Q. Y. Hu, Y. Meng, Y. Q. Cheng, M. W. Chen, J. F. Shu, H. K. Mao, and H. W. Sheng, First-Order Liquid-Liquid Phase Transition in Cerium, Physical Review Letters 110, 125503 (2013).
- Pallares et al. [2014] G. Pallares, M. El Mekki Azouzi, M. A. Gonzalez, J. L. Aragones, J. L. F. Abascal, C. Valeriani, and F. Caupin, Anomalies in bulk supercooled water at negative pressure, Proceedings of the National Academy of Sciences 111, 7936 (2014).
- Gallo et al. [2016] P. Gallo, K. Amann-Winkel, C. A. Angell, M. A. Anisimov, F. Caupin, C. Chakravarty, E. Lascaris, T. Loerting, A. Z. Panagiotopoulos, J. Russo, J. A. Sellberg, H. E. Stanley, H. Tanaka, C. Vega, L. Xu, and L. G. M. Pettersson, Water: A Tale of Two Liquids, Chemical Reviews 116, 7463 (2016).
- Poole et al. [1992] P. H. Poole, F. Sciortino, U. Essmann, and H. E. Stanley, Phase behaviour of metastable water, Nature 360, 324 (1992).
- Debenedetti et al. [2020] P. G. Debenedetti, F. Sciortino, and G. H. Zerze, Second critical point in two realistic models of water, Science 369, 289 (2020).
- Palmer et al. [2018] J. C. Palmer, P. H. Poole, F. Sciortino, and P. G. Debenedetti, Advances in Computational Studies of the Liquid-Liquid Transition in Water and Water-Like Models, Chemical Reviews 118, 9129 (2018).
- Kim et al. [2017] K. H. Kim, A. Späh, H. Pathak, F. Perakis, D. Mariedahl, K. Amann-Winkel, J. A. Sellberg, J. H. Lee, S. Kim, J. Park, K. H. Nam, T. Katayama, and A. Nilsson, Maxima in the thermodynamic response and correlation functions of deeply supercooled water, Science 358, 1589 (2017).
- Kim et al. [2020] K. H. Kim, K. Amann-Winkel, N. Giovambattista, A. Späh, F. Perakis, H. Pathak, M. L. Parada, C. Yang, D. Mariedahl, T. Eklund, T. J. Lane, S. You, S. Jeong, M. Weston, J. H. Lee, I. Eom, M. Kim, J. Park, S. H. Chun, P. H. Poole, and A. Nilsson, Experimental observation of the liquid-liquid transition in bulk supercooled water under pressure, Science 370, 978 (2020).
- Caupin et al. [2018] F. Caupin, V. Holten, C. Qiu, E. Guillerm, M. Wilke, M. Frenz, J. Teixeira, and A. K. Soper, Comment on “Maxima in the thermodynamic response and correlation functions of deeply supercooled water”, Science 360, eaat1634 (2018).
- Kim et al. [2018] K. H. Kim, A. Späh, H. Pathak, F. Perakis, D. Mariedahl, K. Amann-Winkel, J. A. Sellberg, J. H. Lee, S. Kim, J. Park, K. H. Nam, T. Katayama, A. Nilsson, F. Caupin, V. Holten, C. Qiu, E. Guillerm, M. Wilke, M. Frenz, J. Teixeira, and A. K. Soper, Response to Comment on “Maxima in the thermodynamic response and correlation functions of deeply supercooled water”, Science 360, eaat1729 (2018).
- Xu et al. [2005] L. Xu, P. Kumar, S. V. Buldyrev, S.-H. Chen, P. H. Poole, F. Sciortino, and H. E. Stanley, Relation between the Widom line and the dynamic crossover in systems with a liquid – liquid phase transition, Proceedings of the National Academy of Sciences 102, 16558 (2005).
- Vasisht et al. [2011] V. V. Vasisht, S. Saw, and S. Sastry, Liquid–liquid critical point in supercooled silicon, Nature Physics 7, 549 (2011).
- Beye et al. [2010] M. Beye, F. Sorgenfrei, W. F. Schlotter, W. Wurth, and A. Föhlisch, The liquid-liquid phase transition in silicon revealed by snapshots of valence electrons, Proceedings of the National Academy of Sciences 107, 16772 (2010).
- Kanno et al. [2001] H. Kanno, H. Yokoyama, and Y. Yoshimura, A New Interpretation of Anomalous Properties of Water Based on Stillinger’s Postulate, Journal of Physical Chemistry B 105, 2019 (2001).
- Angell [2007] A. Angell, Highs and lows in the density of water, Nature Nanotechnology 2, 396 (2007).
- Wong et al. [2010] H.-S. P. Wong, S. Raoux, S. Kim, J. Liang, J. P. Reifenberg, B. Rajendran, M. Asheghi, and K. E. Goodson, Phase Change Memory, Proceedings of the IEEE 98, 2201 (2010).
- Lucas et al. [2020] P. Lucas, S. Wei, and C. A. Angell, Liquid‐liquid phase transitions in glass‐forming systems and their implications for memory technology, International Journal of Applied Glass Science 11, 236 (2020).
- Benmore et al. [2019] C. Benmore, L. C. Gallington, and E. Soignard, Intermediate range order in supercooled water, Molecular Physics 117, 2470 (2019).
- Akola et al. [2010] J. Akola, R. O. Jones, S. Kohara, T. Usuki, and E. Bychkov, Density variations in liquid tellurium: Roles of rings, chains, and cavities, Physical Review B 81, 094202 (2010).
- Bergman et al. [2003] C. Bergman, C. Bichara, J. P. Gaspard, and Y. Tsuchiya, Experimental investigation of the waterlike density anomaly in the liquid Ge15Te85 eutectic alloy, Physical Review B 67, 104202 (2003).
- Kalikka et al. [2012] J. Kalikka, J. Akola, R. O. Jones, S. Kohara, and T. Usuki, Amorphous Ge$_{15}$Te$_{85}$: density functional, high-energy x-ray and neutron diffraction study, Journal of Physics: Condensed Matter 24, 015802 (2012).
- Wei et al. [2017] S. Wei, M. Stolpe, O. Gross, W. Hembree, S. Hechler, J. Bednarcik, R. Busch, and P. Lucas, Structural evolution on medium-range-order during the fragile-strong transition in Ge 15 Te 85, Acta Materialia 129, 259 (2017).
- Gaspard [2016] J.-P. Gaspard, Structure of covalently bonded materials: From the Peierls distortion to Phase-Change Materials, Comptes Rendus Physique 17, 389 (2016).
- Zalden et al. [2019] P. Zalden, F. Quirin, M. Schumacher, J. Siegel, S. Wei, A. Koc, M. Nicoul, M. Trigo, P. Andreasson, H. Enquist, M. J. Shu, T. Pardini, M. Chollet, D. Zhu, H. Lemke, I. Ronneberger, J. Larsson, A. M. Lindenberg, H. E. Fischer, S. Hau-Riege, D. A. Reis, R. Mazzarello, M. Wuttig, and K. Sokolowski-Tinten, Femtosecond x-ray diffraction reveals a liquid–liquid phase transition in phase-change materials, Science 364, 1062 (2019).
- Cabane and Friedel [1971] B. Cabane and J. Friedel, Local order in liquid tellurium, Journal de Physique 32, 73 (1971).
- Kajihara et al. [2012] Y. Kajihara, M. Inui, K. Matsuda, T. Nagao, and K. Ohara, Density fluctuations at the continuous liquid-liquid phase transition in chalcogen systems, Physical Review B 86, 214202 (2012).
- Tsuchiya [1991] Y. Tsuchiya, Thermodynamic evidence for a structural transition of liquid Te in the supercooled region, Journal of Physics: Condensed Matter 3, 3163 (1991).
- Angell and Kanno [1976] C. A. Angell and H. Kanno, Density Maxima in High-Pressure Supercooled Water and Liquid Silicon Dioxide, Science 193, 1121 (1976).
- Angell et al. [1996] C. Angell, S. Borick, and M. Grabow, Glass transitions and first order liquid-metal-to-semiconductor transitions in 4-5-6 covalent systems, Journal of Non-Crystalline Solids 205-207, 463 (1996).
- Shi and Tanaka [2018] R. Shi and H. Tanaka, Impact of local symmetry breaking on the physical properties of tetrahedral liquids, Proceedings of the National Academy of Sciences 115, 1980 (2018).
- Speedy [1987] R. J. Speedy, Thermodynamic properties of supercooled water at 1 atm, The Journal of Physical Chemistry 91, 3354 (1987).
- Wagner and Pruß [2002] W. Wagner and A. Pruß, The IAPWS Formulation 1995 for the Thermodynamic Properties of Ordinary Water Substance for General and Scientific Use, Journal of Physical and Chemical Reference Data 31, 387 (2002).
- Feigin and Svergun [1987] L. A. Feigin and D. I. Svergun, Structure Analysis by Small-Angle X-Ray and Neutron Scattering, edited by G. W. Taylor (Springer US, Boston, MA, 1987).
- Speedy [1982] R. J. Speedy, Stability-limit conjecture. An interpretation of the properties of water, The Journal of Physical Chemistry 86, 982 (1982).
- Poole et al. [1994] P. H. Poole, F. Sciortino, T. Grande, H. E. Stanley, and C. A. Angell, Effect of Hydrogen Bonds on the Thermodynamic Behavior of Liquid Water, Physical Review Letters 73, 1632 (1994).
- Sastry et al. [1996] S. Sastry, P. G. Debenedetti, F. Sciortino, and H. E. Stanley, Singularity-free interpretation of the thermodynamics of supercooled water, Physical Review E 53, 6144 (1996).
- Caupin and Anisimov [2021] F. Caupin and M. A. Anisimov, Minimal Microscopic Model for Liquid Polyamorphism and Waterlike Anomalies, Physical Review Letters 127, 185701 (2021).
- Tanaka [2012] H. Tanaka, Bond orientational order in liquids: Towards a unified description of water-like anomalies, liquid-liquid transition, glass transition, and crystallization, European Physical Journal E 35, 113 (2012).
- Stokely et al. [2010] K. Stokely, M. G. Mazza, H. E. Stanley, and G. Franzese, Effect of hydrogen bond cooperativity on the behavior of water, Proceedings of the National Academy of Sciences 107, 1301 (2010).
- Shi and Tanaka [2020] R. Shi and H. Tanaka, The anomalies and criticality of liquid water, Proceedings of the National Academy of Sciences 117, 26591 (2020).
- Endo et al. [2003] H. Endo, K. Maruyama, H. Hoshino, and H. Ikemoto, Local Structure of Liquid Te Studied by Neutron Diffraction and EXAFS, Zeitschrift für Physikalische Chemie 217, 863 (2003).
- A. Menelle et al. [1987] A. Menelle, R. Bellissent, and A. M. Flank, A Neutron Scattering Study of Supercooled Liquid Tellurium, Europhysics Letters 4, 705 (1987).
- Ichikawa [1973] T. Ichikawa, Electron Diffraction Study of the Local Atomic Arrangement in Amorphous Tellurium Films, physica status solidi (b) 56, 707 (1973).
- Tsuzuki et al. [1995] T. Tsuzuki, M. Yao, and H. Endo, Static and Dynamic Structures of Liquid Tellurium, Journal of the Physical Society of Japan 64, 485 (1995).
- Menelle et al. [1989] A. Menelle, R. Bellissent, and A. M. Flank, Short range order in liquid Se-Te system by neutron scattering, Physica B: Physics of Condensed Matter 156-157, 174 (1989).
- Hoyer et al. [1992] W. Hoyer, H. Neumann, and M. Wobst, Structure Investigation on Liquid Tellurium by X-Ray and Neutron Scattering, Zeitschrift für Naturforschung A 47, 833 (1992).
- Adenis et al. [1989] C. Adenis, V. Langer, and O. Lindqvist, Reinvestigation of the structure of tellurium, Acta Crystallographica C 45, 941 (1989).