Translational diffusion of a fluorescent tracer molecule in nanoconfined water
Abstract
Diffusion of tracer dye molecules in water confined to nanoscale is an important subject with a direct bearing on many technological applications. It is not yet clear however, if the dynamics of water in hydrophilic as well as hydrophobic nanochannels remains bulk-like. Here, we present diffusion measurement of a fluorescent dye molecule in water confined to nanoscale between two hydrophilic surfaces whose separation can be controlled with a precision of less than a nm. We observe that the fluorescence intensities correlate over a fast( 30 s) and slow ( 1000 s) time components. The slow timescale is due to adsorption of fluorophores to the confining walls and it disappears in presence of 1 M salt. The fast component is attributed to diffusion of dye molecules in the gap and is found to be bulk-like for sub-10 nm separations and indicates that viscosity of water under confinement remains unaltered up to confinement gap as small as 5 nm. Our findings contradict some of the recent measurements of diffusion under nanoconfinement, however they are consistent with many estimates of self-diffusion using molecular dynamics simulations and measurements using neutron scattering experiments.
Indian Institute of Science Education and Research Pune] Department of Physics, Indian Institute of Science Education and Research Pune, Pune-411008, Maharashtra, India Indian Institute of Science Education and Research Pune] Department of Physics, Indian Institute of Science Education and Research Pune, Pune-411008, Maharashtra, India
![[Uncaptioned image]](/html/2201.06765/assets/x1.png)
1 Introduction
Water is a an important solvent responsible for macromolecular organization, which is vital for life on earth1. For the most part, the water involved in these reactions is interfacial, or tightly confined to nanoscale cavities. Besides the scientific importance, investigation of nanoconfined water is useful in many applications such as filtration and desalination 2, fuel cells 3, properties of clays, minerals and food materials4. It also plays an important role in biological processes of protein folding 5 and transport in cellular pores 6.
In these situations, water is confined between either hydrophobic or hydrophilic solid walls, which are roughly separated by a few nm. Such nanoconfined water, through many experiments, is known to exhibit curious response to external perturbations such as mechanical shear or electrical fields. Among these are fast permeation of water in carbon nanotubes 7, permeation of water through helium-leak-tight membrane 8, dynamic solidification of water layers next to the surface 9, suppression of freezing 10, and anomalously low out-of-plane dielectric constant11. Through decades of research, there is some understanding of physical origins of these curious properties of water at nanoscale. However, the subject is active and not free from controversies12, 13, 14, 15 Many spectroscopic measurements have been performed with the purpose of shedding light on behavior of water residing at interfaces, nanoconfined between walls or contained in nanoscale pores16, 17.
In particular, viscosity or the damping coefficient of confined water is measured using Surface Force Apparatus 13, Atomic Force Microscope18, and Capillary action19. Few dissipation measurements have claimed that confined water has a viscosity similar to bulk13, while others concluded an 8-order increase in viscosity12. Nanoscale water also exhibits rheological response with characteristic timescales of the order of 1 to 10 s and analogies are drawn with slow-down in supercooled water12. This means that, self diffusion of water molecules or tracer diffusion of dye molecule through it, is expected to show signatures of dynamic heterogeneity inherent to glass-forming systems. Hence, diffusion measurements become central to answer the question- How does water exhibit slow response to both electrical and mechanical perturbations? .
The slow-down in dynamics, however, is not an universal feature of all spectroscopic measurements of diffusion so far. For instance, measurements using Quasi Elastic Neutron Scattering(QENS) in room temperature 20, 21 conclude that the self translational diffusion of nanconfined water in porous materials is same as bulk water within an order. While at low temperatures below bulk-freezing point, nanoconfined water remains fluid and has almost 100 times reduction in translational diffusion22, 23.
There are few measurements of tracer diffusion in water confined to single nanochannels. Using Fluorescence Correlation Spectroscopy(FCS) 24, 25, it was reported that there is no slow-down in diffusion of tracer dye. However, by tracking the fluorescence distribution along nanochannels over time, it was shown that diffusion is slowed down by factor of 100 in organic solvents26. These measurements are relevant to the newly emerging field of nanofluidics27, 28, 29. It has applications in iontronics30, 31, energy harvesting32 and sequencing of biopolymers33, 34. There are few reports of subdiffusion of proteins in nanochannels24. In this context it is important to know about the factors affecting the dynamics of solute molecules in the solution confined in nanochannels. The interfacial charge, viscosity and confinement effects are expected to have an effect, however it is still unclear beyond what length scale we can ignore interfacial effects.
Over last few decades, the questions regarding dynamics of water confined between hydrophilic walls separated by less than 1 nm are addressed through experiments9, 12, 14. This question is also tractable using molecular dynamics simulation and large body of work exists in literature35, 36. However, there is a lack of clarity on properties of water where confining walls are separated by distance in the range of 1 -10 nm, particularly about the dynamics of solute molecules. This is of immense interest to the newly emerging field of nanofluidics which has tremendous technological impact.
Here, we report diffusion of tracer dye, Coumarin (Cu343) in water confined to sub-10 nm separations using an instrument developed in our laboratory. An Aluminium-coated fiber tip, with an optical opening at its end is used to confine water between itself and the flat glass substrate. Using a servo control the gap between the tip and substrate is controlled with precision of less than a nm. The instrument allows us to probe diffusion of tracer dyes in the nanoscale gap which can be controlled in-situ. We clearly observed two timescales for diffusing dye indicating co-existence of slow and fast regions for diffusion of the dye.
The disappearance of slow component after addition of 1 M salt, indicates that it is likely due to fluorophores bound to the glass surface. Further, we show that the diffusion coefficient is bulk-like for sub-10 nm confinement gaps. The slow-down in tracer diffusion seen in the past can be attributed to the adsorption-desorption to the confining walls.
2 Experiments
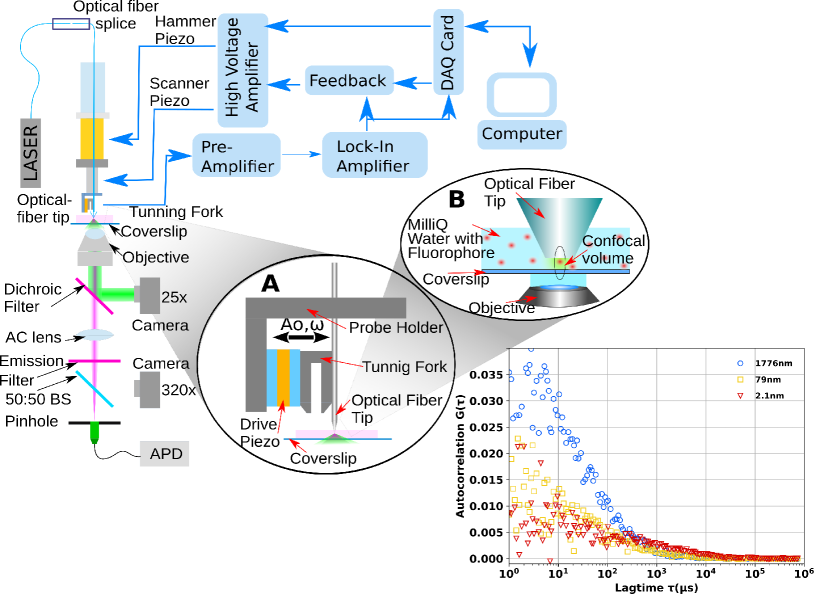
All experiments are performed with a home-built instrument37. A schematic of the instrument is shown in figure 1. In order to create a small controlled gap in which water is nano-confined, a sharp tip is pulled out of single mode optical fiber is used(Thorlabs 460HP, 125 diameter with cladding). The water is confined between the tip and the substrate. The tip is coated with 150 nm of aluminium and before mounting on one prong of Quartz Crystal Tunig Fork ( QTF), an optical aperture (200-900 nm diameter) is opened at its end using Focused Ion Beam(FIB) milling. This constitutes one of the two flat confining surfaces. The other end of the fiber is used to couple the light from a 446 nm continuous wave laser with 40 mW power. Before coupling, the power of the laser is reduced to 1 mW using neutral density filters. After coupling, around 5 to 50 of light comes out of the tip. The QTF is then mounted on a piezo drive fixed to the probe holder (Figure 1A). The liquid cell is fitted with a circular cover-slip which forms the other flat confining surface. This bottom confining surface is cleaned using UV-Ozone treatment. The cell is filled with pure water (MilliQ, 18 M cm) having 25-50 nM concentration of tracer dye in it. The QTF is mechanically oscillated on its resonance ( 32 kHz) using the piezo drive and amplitude of the prong with tip is 1 nm. This oscillation generates a piezo electric current of same frequency and its amplitude monotonically decreases as the tip-coverslip gap decreases. Before every experiment the QTF current amplitude is recorded with lock-in amplifier as a function of piezo extension. In the experiments we monitor and record the QTF current amplitude and use it to calculate the gap. In a typical experiment, the tip is approached towards the substrate with servo-control, in which the QTF current amplitude serves as input parameter to control the separation between the tip and the substrate. This defines the thickness of the water confined between two walls and can be controlled using an active feedback. Since we use 16- bit resolution DAQ for our analog outputs for piezo extension, the relative position of the tip can be controlled with precision of 0.1 nm. For gaps typically above 10-15 nm, the QTF current is not sensitive to the gap changes, so we cannot use the feedback. For such large separations, we give constant voltage to the piezo which corresponds to a specific gap. All separations are ‘average’ distances and are not directly measured in our experiments. They are calculated from the voltages provided to the scanner piezos.
The special optical fiber tip is capable of illuminating a local volume in the nanoconfined water beneath the tip. The diffusing fluorophores enter the nanoconfined water and transit through the illuminated volume to give fluorescence. A confocal arrangement is used to collect these fluorescence photons and an Avalanche Photodiode(APD) is used to detect them. Typically, the tip diameter is larger than the cross section of confocal volume at the beam waist. It ensures that only the fluorescence from the nanoconfined region is detected. The observation volume is the convolution of confocal volume and the nanoconfined gap produced by the tip and substrate. It is a disc-like volume with height of tip-sample gap and diameter of the confocal volume. The number of fluorophores in the observation volume fluctuates due to diffusion. For low concentrations, these fluctuations will be seen as the fluctuations in the detected fluorescence intensity. These fluctuations are correlated for the average time the fluorophore spends in observation volume. This average residential timescale can be extracted by taking the autocorrelation of the fluctuations in the fluorescence intensity. If the diffusion under confinement is significantly different from the bulk, the slow-down should give increase in this residential timescale. If there is a fraction of fluorophores undergoing adsorption-desorption events at the interface along with diffusion then those fluorophores spend more time in observation volume. In this case the autocorrelation will have another slow residential time scale along with the residential time scale of the freely diffusing molecules.
Each autocorrelation of fluorescent intensity fluctuations for a specific gap is calculated for 100 seconds using a correlator card(Correlator Flex99-12). The correlator card uses multiple-tau algorithm to calculate the autocorrelation38 and samples the time trace with a precision of 12.5 ns.
Using the instrument we performed experiments with fluorescent Coumarin 343 molecules(11-oxo-2,3,5,6,7,11-Hexahydro-1H-pyrano[2,3-f]pyrido[3,2,1-ij]quinoline-10-carboxylic acid;\chC16H15NO4). In experiments, fluorescent molecules are mixed in water to get 25-50 nM concentration by series dilution. For a certain set of experiments fluorescent molecule is mixed in 1M NaCl water solution to avoid adsorption of tracer dye on the glass surface. The bulk diffusion coefficient of Coumarin 343 is 550 (5.5 10)39. As per the 3D visualising tool "Jmol"40, maximum length along x,y,z dimensions of Coumarin 343 is ( 1.15 nm, 0.7 nm, 0.3 nm ).
The uncertainty in the gap between the tip and coverslip in our instrument is 2 nm. This is mainly determined by roughness in the tip and roughness of coverslip for the area beneath the tip. Using a commercial AFM we measured the roughness of the coverslip. For an area of 1m x 1m, coverslip has a RMS roughness of 0.50.2nm. The optical fiber tips are sliced with Galium ions (Ga+) which are accelerated by 30 kV and current of 40pA. From the Scanning Electron Microscopy images of the tips and roughness measure of coverslip, we estimate the uncertainty in tip-substrate separation to be 2 nm.
Another important point, which affect the accuracy of the tip-substrate separation is a possible relative tilt between them. As mentioned before, we utilize the voltage given for the scanner piezo to find out the gap. In our measurements, piezo voltage for zero of the separations is determined from the sudden change in QTF current amplitude when tip is about to make a contact with the substrate. If tilt exists between tip and substrate, one edge of the tip is closer to the substrate and may cause this sudden change in amplitude. For such a scenario, even when we measure zero separation there may exist a small gap between the substrate and center of the tip. This is likely to provide an underestimate in separation. To minimise the tilt, we take care to fix the tip perpendicular to the substrate and make FIB cut on the tip which is perpendicular to the axis of the fiber. Even with these cares, a slight tilt can be present. There is a way to check if surfaces are exactly aligned parallel to each other while performing measurements. If there is a tilt, as the tip oscillate laterally, the vertical force fields are also sampled. This contribution is largely due to van der Waals force between the tip and the substrate and it is expected to be attractive. As shown by Kim et. al.41, it introduces a phase lag in QTF current. This phase lag is present when the relative tilt between tip and substrate is more than . In all our measurements such phase lag is not seen. This amounts to a possible tilt of or less. Given the radius of our tip( 400 nm) and a tilt of , the gap size is likely to be about 2 nm at the centre of the confinement region when one end of the tip is touching the substrate. Therefore, we consider a systematic error of 2 nm in all our measurements. All the measurements of separations shown in our graphs are calculated from the piezo voltages and may have this possible systematic error.
Figure 1 shows the representative autocorrelations obtained for Coumarin 343 diffusing through the gap between the tip and substrate held at three different separations. For separations of the order of 1 m, the feedback control is turned off and the tip is pulled back from near-contact position by the distance mentioned in figure 1.
3 Theory
The average residential time spent by fluorophores in the observation volume determines the diffusion coefficient. It is estimated from the autocorrelations of fluorescence intensity fluctuations. A similar experimental technique called Fluorescence Correlation Spectroscopy(FCS) deals with autocorrelation of fluorescence instensity from the confocal volume in bulk. Elson and Magde have derived an expression for autocorrelation of intensities which accounts for geometrical details of the observation volume, quantum yield of the fluorophore and the detection efficiency of the instrument 42, 43. Fitting this expression to experimental autocorrelation data yields the average residential time. However, this expression, which is derived for a typical Fluorescence Correlation Spectroscopy (FCS) experiments needs modification in order to apply to our experimental data. In a typical FCS, the confocal volume is placed well inside the bulk of the solution and the movement of fluorophores are not restricted by any physical boundary. The illumination and collection is done using the same objective lens. We illuminate part of the confined region using the tip and emission is collected by an objective.
There are several attempts to derive an expression to fit autocorrelation data from FCS when there are two parallel boundaries present in the confocal volume44. For gaps much smaller than the height of confocal volume, this expression can be approximated by the one for two-dimensional(2-D) diffusion44. We use the expression describing 2-D diffusion in a typical FCS set up to fit our data and estimate the average residential time .
For a freely diffusing fluorescent species, the FCS expression for autocorrelation is:
| (1) |
Here, is the average number of fluorescent molecules in the observation volume and is the residential time. "T" is the fraction of fluorophores in triplet state and is the triplet transition timescale. If there are two fluorescent species in the observation volume with different diffusion coefficients, the autocorrelation modifies as:
| (2) |
Here, and are the residential time for species 1 and 2 respectively. And and are the corresponding weight factors for each species. The weight factor for a particular fluorescent species depends on its fluorescence yield and fraction of that species in the average number of total fluorescent species present in the observation volume(). If and are the fluorescence yield of molecule 1 and 2, and "" is the fraction of molecule 1. Then the weight factors; and are given by:
| (3) | ||||
In situations where the fluorescent molecule adsorbs or desorbs from the surface along with diffusion. The FCS expression for autocorrelation is given by45:
| (4) |
The weight factors and are defined exactly like in equation 3. Instead of subscripts 1 and 2 being different molecules, here 1 indicates the molecules undergoing diffusion and 2 indicates the faction of same molecules which are undergoing adsorption-desorption events. And "k" is the rate constant of desorption.
For typical FCS, the residential time is related to the radius of observation volume along lateral direction. This radius, , is the distance from the peak of Gaussian which determine the objective illumination to the value of the peak. This typically matched with the radius of confocal volume for FCS. The relation between residential time () and is Here, "D" is the diffusion coefficient of the fluorescent molecule. This follows from Einstein’s equation for mean square displacement in 2-D for the time period .
Similarly, in our setup we can define the width of the observation volume with the fit value of from the 2-D FCS autocorrelation expressions. In case where the tip illumination is broader than the width of confocal volume, the width of observation volume is mainly determined by the width of confocal volume and is fixed for a given tip and alignment. This implies that "D" is inversely proportional to for the measurements with same tip and same alignment. The estimate of at different separations with same tip and alignment, enables us to verify if diffusion is hindered due to nanoscale confinement.
For a given tip and alignment we can get an expression:
| (5) |
is the value measured at large separations (100 nm ) with the same tip, where the diffusion is bulk-like.
4 Simulations
The models described in previous section have assumptions which deviates from the experimental situation. Models uses 2D diffusion instead of confined diffusion and illumination from objective rather than from the tip. The quantification of diffusion coefficient may have systematic errors and hence its determination may not have significant confidence. We can also estimate diffusion coefficients from the experimental data using a Monte Carlo based fitting procedure37.
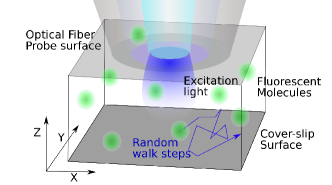
The schematic of the simulation box is given in figure 2. The top and bottom surfaces of the simulation box are the confining surfaces of tip and coverslip. Reflecting boundary conditions are used at these two surfaces. The separation between them is decided from the experiment. The other vertical sides of the simulation box have periodic boundary condition. The length and breadth of the box is at least 3 m each to avoid the artifacts of periodic boundary conditions for a typical tip illumination of 1 m diameter. Briefly, the simulation starts with a random distribution of fluorescent molecules with concentration used in the experiment. The fluorescent intensity obtained in confocal volume from this distribution of molecules under the tip illumination is calculated by taking an excitation profile, detection efficiency and other experimental parameters. In the next time step, the positions of fluorescent molecules are changed according to a certain diffusion coefficient. The fluorescent intensity is calculated again for the new distribution of fluorescent molecules. By performing such calculations for each time step, a time trace of fluorescent intensity is obtained. The autocorrelation of the fluctuations in this time trace is calculated.
As the values of concentration and fluorescence properties used in simulation and alignments in experiments can have slight variations from ideal expectations, the intercept of the simulated autocorretation may not match with the experimental autocorrelation. So before fitting the simulated autocorrelation with the experimental one, the intercept is fitted. This is done by multiplying a factor to the simulated autocorrelation to get a corrected one. The factor value is determined by finding the one which gives the least root mean square error between the simulated autocorreation and experimental autocorrelation. This way, corrected autocorrelations from the simulation for different diffusion coefficients are obtained. Among these simulated autocorrelations the one which gives the minimum of root mean square error is the simulation fit. The diffusion coefficient corresponding to this fit is the diffusion coefficient of the fluorophore in the experiment. See ref. 37 for more details about the simulations.
5 Results and Discussion
5.1 Diffusion in pure water
a The part of autocorrelation which gets affected by triplet state transitions are typically below . Our data from confinement is very noisy below . So the fit parameters values for T and will not be reliable. This doesn’t affect the fit values of other parameters.
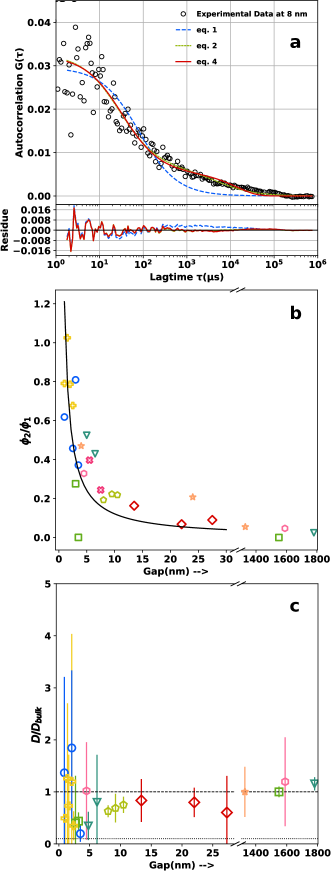
Figure 3a shows a representative autocorrelation of Coumarin 343 diffusing in 8 nm gap with best fits of three different equations; for single diffusing species (eq: 1), two diffusing species (eq: 2) and one single diffusing species performing adsorption-desorption events (eq: 4). Clearly, the single diffusing species poorly describes our data. The equation is not fitting well ( blue dashed line). Earlier 37, we have reported development of the instrument and presented preliminary data, wherein the autocorrelations below 100 s were noisy and excluded from fit procedures. This led to a single timescale over which intensities were correlated and we concluded that there is slow-down in the diffusion under confinement. We have now improved the instrument and the experimental protocol to reduce the noise in the early delay times. As a result, a larger range of data from 1 to 1 s is now fitted.
The fit parameters are listed in the table 1. Both, equation 2 (green dotted line) and equation 4 (red continuous line) fit equally well. This means that both pictures are equally possible as far as quality of fit is concerned. However, since we are using a single fluorophore for these measurements, single diffusing species performing adsorption-desorption events is more realistic model, provided the liquid under confinement is mostly homogeneous. In our experiments the confining walls are largely made of glass bearing negative charges. The large part of the tip is made up of metal coating and may accumulate charges. While performing measurements it is difficult to avoid the tip-substrate contact owing to the occasional instability of the feedback loop. The tip also needs to make a momentary contact during a approach-retract cycle. This cycle is essential for determining zero of the separation and dependence of tip-amplitude on the separation. Such intermittent tip-sample contact may smear the charges accumulated on the tip to substrate and render the confining wall positively charged locally. This positive charge becomes an adsorption sites for negatively charged Coumarin 343. It is important to note that on rare occasions when tip does not make the substrate positively charged in this way, the slow component seen in the autocorrelation curve in 3a is not seen. This, however, happens rarely and is not reproduced in a controlled manner. In the next section we will discuss a remedy to mitigate this situation.
The average number of molecules performing adsorption-desorption are same for different confinement gaps. This is because the area of interfaces in the observation volume from the tip and coverslip are the same for all the separation between coverslip and the tip. Thus, the number of adsorption sites accessed by the fluorescent molecules for a given concentration will be the same and number of molecules undergoing adsorption-desorption events; , a positive constant. The number of molecules undergoing diffusion should increase linearly with the gap as the observation volume increases linearly with increase in separation. So, , where "r" is the radius of observation volume, c is the concentration of the fluorescent molecule in the confinement region. This is likely to be different from the bulk concentraion. is another positive constant. Now we can calculate the fraction of diffusing molecules . Substituting this "" in the expressions for and and taking the ratio , we can see that this ratio is inversely proportional to gap(d) with a positive proportionality constant "". And
| (6) |
Our data does follow this trend. Figure 3b shows plot of the ratio of the weight factors of adsorbed to the diffusing fraction from experiments at different tip-substrate separations. The values of and is obtained by fitting equation 4 to the autocorrelation data. Each colour or type of symbol represents data from experiments performed using different tips. The fit to confirms that there are fluorophores homogeneously distributed over the confinement region except the ones adsorbed over the tip and substrate. The average residential time of the diffusing species can then be estimated by fitting equation 4 to all the data.
Using at different separations and ( fit to data at separations 100 nm), we find as mentioned in equation 5. Figure 3c shows values with-respect to gap. Each colour or type of symbol represents data from experiments performed using different tips. The error values for this ratio are calculated from the standard deviation of the from the fitting procedure. We find that fluctuates around the value 1 within 10 to 0.1. This means that the diffusion coefficient of Coumarin 343 in confined water, in gaps as low as 2 2 nm, is of same order of magnitude to the it’s bulk value.
5.2 Diffusion in 1M salt solution
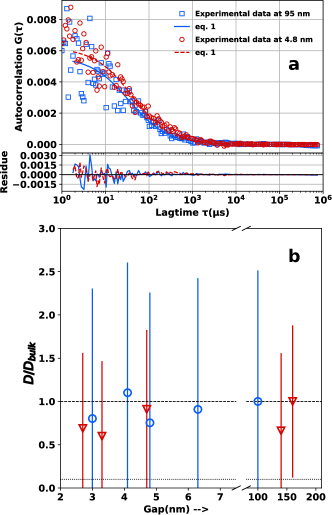
We further confirm our findings by mitigating the issue of fluorophore adsorption in a separate experiment. We performed experiments by adding 1M NaCl to the solution. Adding salt is known to reduce the charge mediated adsorptions by screening the local adsorption sites with counter-ions(ions of opposite charge compared to the adsorption site)46. We choose to add 1M NaCl as similar amount is found to enhance the probability of dynamic solidification of water15. Moreover, the Debye length at this concentration is 0.3 nm 47. Representative autocorrelation curves for Coumarin 343 in confined 1M NaCl solution are shown in figure 4a and 5a for gaps 2.6 2, 4.8 2 and 95 2 nm. The equation for single diffusing species with no adsorption (eq. 1) fits well on all experimental autocorrelations. We deduce that adsorptions are negligible and the autocorrelation curve is mainly determined by diffusion. The values corresponding to these representative autocorrelations for 2.6 2, 4.8 2 and 95 2 nm were 46, 52, 39 respectively.
The values from the fit are used to calculate . The values are plotted against the confinement gap in figure 4b. The error value for each is calculated from the standard deviation of from the fitting procedure. Similar to pure water, the values of Coumarin 343 fluctuates around 1 between 10 and 0.1. The diffusion coefficient of Coumarin 343 in confined 1 M NaCl solution, for confinements as low as 2.6 2 nm, is in the same order of magnitude of it’s bulk value.
5.3 Monte Carlo to estimate Diffusion
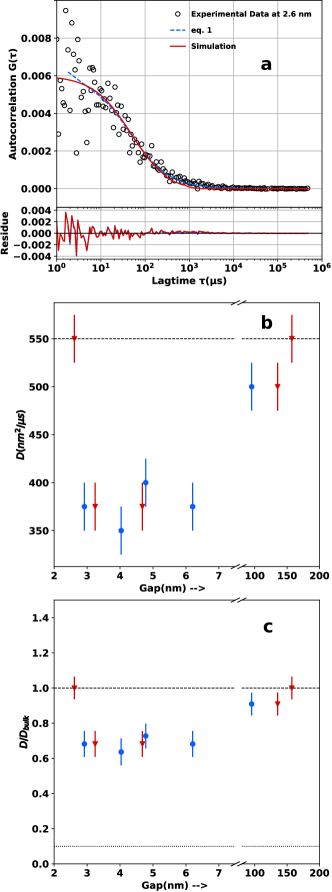
The data from NaCl solution are further analysed with the Monte Carlo fitting procedure. A typical simulation fit to the autocorrelation from nanoconfined NaCl solution is given in figure 5a. This data is for Coumarin 343 diffusing in confinement gap of 2.6 2 nm having 1 M NaCl solution. The diffusion coefficient corresponding to the auto-correlation data from the experiments is estimated from this fitting. For this particular data simulated autocorrelation for D=550 gave the best fit. The figure 5b shows the fitted diffusion coefficient for different separations in two different experiments with different tips. The error bars for each diffusion coefficient is the minimum change in diffusion coefficient around the fitted value such that a significant change() in root mean square error is obtained. We also find the values. The figure 5c shows the with respect to confinement gap.
5.4 Discussion
The autocorrelation of fluorescence intensity fluctuations revealed that there are two timescales over which intensity is correlated for the Coumarin 343 molecules diffusing in nanoconfined water. It is found that fast time scale corresponds to the average time required to cross the width of observation volume, provided the molecule has diffusion coefficient similar to its bulk value. The slower time scale disappeared in measurements with 1 M NaCl . Adding NaCl is known to avoid adsorption of solute molecules over substrates due to screening of electrostatic interactions. The Coumarin 343 molecule(11-oxo-2,3,5,6,7,11-Hexahydro-1H-pyrano[2,3-f]pyrido[3,2,1-ij]quinoline-10-carboxylic acid;\chC16H15NO4) has the caboxylic-acid group. It gains negative charge in pH 7. One of the confining surfaces, the cover-slip is cleaned with UV-Ozone before the experiments which enriches the surface with hydroxyl-terminations. This cover-slip in pH 7 water get negative charges48. As discussed earlier, the second confining surface, the tip-surface may accumulate unknown static charges owing to metal coating. This may render the glass surface positively charged. By adding NaCl to pure water, we introduce co-ions and counter-ions. The counter-ions get attracted to the local charge centres on the surfaces and forms Electrical Double Layer(EDL). The Debye length associated for this EDL in 1 M NaCl is 0.3 nm47. Thus 0.3 nm EDL is present over both of the confining surfaces. The Coumarin 343 diffusing in this confined gap experience highly shielded electrostatic potential due to EDL from the surfaces. This helps in avoiding the adsorption of Coumarin 343 over the confining surfaces. The disappearance of slower time scale in autocorrelation for 1 M NaCl confirmed that adsorption-desorption process is the reason for slower time scale in nanoconfined water without salt.
Furthermore, the ratio of weight factors of the fraction undergoing adsorption-desorption process and the fraction of molecules executing diffusion() show a trend with respect to confinement gap. This is consistent with our physical picture that number of molecules undergoing diffusion will increase linearly as the gap is increased while the number of molecules undergoing adsorption-desorption will remain unchanged. By fitting such a model, we could extract the residential time scale due to diffusion for various separations. Further, we could estimate the ratio of diffusion coefficient with it’s bulk value. We find that the diffusion coefficient of the tracer molecule is similar to the bulk value even for confinements as small as 2 2 nm. Similar behaviour is also seen in 1 M NaCl solution confined till 2.6 2 nm. This behaviour is independent of analysis method used to extract the diffusion coefficient. The estimate of diffusion coefficients at all separations using Monte Carlo simulation based fitting procedure, yields the same result.
In figure 1, we see that the y-intercept of autocorrelation from different gap are different. From equation 4 we realise that the intercept is given by . And and are defined according to equation 3. This behaviour of intercept in figure 1 is not simple to explain because of the nonlinear dependence of or with the fluorescence yield and fraction of diffusing molecules. With a systematic study of this variation of intercept with gap, one could estimate the fluorescence properties of adsorbed and unadsorbed molecules. This is outside the scope of this paper.
We discuss the uncertainty estimates in determining the slow and fast time-scales. This is not possible by performing a statistical analysis presented by Wohland et al.38 for a typical FCS experiment. This requires the experiments to be performed multiple number of times at the same separation and experimental conditions. Such analysis is possible in a typical FCS experiment, wherein the observation volume is in the bulk of liquid and any number repetitions under the same conditions are possible. Although, the tip-sample separation can be held fixed over several seconds or minutes in our experiments, the same is not true about the objective and the cover-slip. Thus, it is difficult to estimate uncertainty in diffusion coefficient under confinement using a statistical analysis used in a typical FCS experiments. However, the errors in diffusion coefficient are determined through fitting procedures and Monte Carlo method.
The interfacial water has unique properties compared to bulk water. Yet, it is not clear under what length scales of confinements the interfacial properties become prominent. This may even depend on the physical property being measured. For instance, the out-of-plane dielectric coefficient of nanoconfined water over hydrophobic confining surfaces was measured to be 2, which is much smaller than the bulk value 8011. This so called electrically dead nanoconfined water is thought to be due to the reduction of rotational freedom of water molecules near interface11, 49. The capacitance measurements revealed that a gap size of more than 100 nm is required for water to have a bulk-like dielectric coefficient11. However, behavior of nanoconfined water, when one measures translational diffusion seems different. There are reports of many orders of change in viscosity for interfacial water14, 12. This means it may exhibit a slow-down in self-diffusion as well as reduced tracer diffusion. The self-diffusion of water is probed in ensemble measurements using NMR or QENS50, 20, 51, 21. These measurements find that, at room temperature the translational diffusion of water is similar to bulk value within an order for confinements as small as 2 nm. However, below this separations the molecular effects, such as restriction in dye orientation and rotational diffusion are expected to affect the diffusion of the dye. In our measurements the diffusion coefficient retaining a bulk-like value at or below 2 nm could be owing to the limitations in determining the gap size accurately. From our data and analysis we can conclude that diffusion is certainly bulk-like at separations of 5 nm and above. Figure 3c, 4b, and figure 5c show that the diffusion coefficient of Coumarin 343 in nanoconfined water for gaps as small as 5 nm is within the same order of magnitude of the bulk value. This conclusion is consistent with NMR and QENS studies. However, like dielectric coefficient of interfacial water, the diffusion of tracer molecules can be anisotropic52. We measure the diffusion of fluorescent tracer molecules on an average moving parallel to the confining surfaces. The local out-of-plane diffusion might be different from what we measured.
The majority of rheological measurements with AFM or SFA have shown a large deviation of viscosity only below 1 nm of hydrophilic confinements12, 14, 53. Above 2 nm the average viscosity or dissipation measured were similar to bulk values. Thus, the AFM and SFA measurements also imply an average bulk-like diffusion for nanoconfined water in gaps more than 2 nm. Molecular dynamics simulations wherein, the in-plane transnational diffusion timescale for water in 2.44 and 1.65 nm gaps are found to be similar to bulk value35, also agree with our conclusion.
There are few reports of measurement of translational diffusion of tracer dye in water confined at nanoscale. The measurement with varying gap size below 10 nm is not routine. For sub-micrometer confinements many particle tracking measurements are done using colloidal tracers54, 55. These measurements are mostly consistent with fluid dynamic description of motion of a particle near interface. The smallest possible confinement is limited by the size of the colloidal tracer particle. The choice of small fluorescent molecules as tracer allows the confinement to be as small as 1-10 nm. Zhong et al. measured diffusion of Rhodamine B in ethanol taken inside nanochannels of height 8 nm and found a reduction in diffusion coefficient by 2 orders26. Kievsky et al. measured diffusion of Rhodamine 6G in water in porous material with pore diameter of 2.9 nm. They found an eight order reduction in diffusion coefficient56. Santo et al. measured diffusion of Rhodamine 6G in water in nanochannels of height 30, 20 and 10 nm. They found the diffusion coefficient to be similar to the bulk value in 30 and 20 nm channels and a 25% slow-down is seen in 10 nm channel24. Grattoni et al. measured diffusion of Rhodamine B in water in nanochannels having height 200 and 1 m, as well as 13 and 5.7 nm57. They found a reduction of diffusion coefficient as the channel height is reduced. The lowest diffusion coefficient they measured (in 5.7 nm channel) is still within an order of the bulk value. Our measurements on diffusion of Coumarin 343 agrees well with Santo et al. and Grattoni et al.
The reasons for the drastic slow-down in the studies by Zhong et al. and Kievsky et al. is not clear. Usually this slow-down is attributed to the geometric confinement effects, surface interactions and possible viscosity difference of nanoconfined water. It is clear from our findings that the diffusion appears slowed down due to adsorption-desorption. Then the apparent diffusion coefficient calculated from the slower residential timescale due to adsorption will be few order less even for our data37. It is possible that the slow-down reported by Zhong et al. and Kievsky et al. is due to adsorption-desorption interactions.
In order to compare our measurements better with existing literature we also performed measurements with Rhodamine 6G. The cationic Rhodamine 6G is known to adsorb over glass surfaces58. This adsorption is due to electrostatic and hydrophobic interactions59. We found that, while we could avoid the mild adsorptions of Coumarin 343 by adding NaCl, Rhodamine 6G have strong adsorption even in 1 M NaCl. The autocorrelation we measured for Rhodamine 6G have large adsorption-desorption contribution even for 1 m separations. As the contribution of diffusing species to the autocorrelation is less dominant, the average residential time estimated from fitting procedure is unreliable. This unreliability in fitting parameters from the adsorption-desorption FCS equation when adsorption is dominant has been pointed out before45. In the work of Kievsky et. al., manipulating the pH or using organic solvent did not change the eight order reduction in diffusion coefficient. We also faced similar difficulties with Rhodamine 6G. However, measurements performed using Alexa Fluor 568 were successful and supports conclusions drawn using Coumarin 343. We observe that the choice of fluorescent molecules and interfaces matters in these type of experiments.
The apparent diffusion coefficient which includes adsorption-desorption interactions can vary with separation even though the diffusion coefficient and timescale for adsorption-desorption interactions(1/k) are same for all separations. This is because the fraction of diffusing population changes with separations as we had seen in the trend of with gap. The time scale for this apparent diffusion can be estimated from the residential time scale for diffusing molecules and the residential time scale of the molecules undergoing adsorption-desorption. The timescales and from equation 2 can be interpreted as these timescales respectively. If we can extract out the values of , the fraction of diffusing molecules, from or , the residential timescale of apparent diffusion coefficient() can be estimated. It is the weighted average of and , given by . For estimating from or one needs to know the fluorescence yields of the fluorescent molecule away() and near to the surfaces() independently. Qualitatively, we can see that for large separations we have approaching 1 and will approach to bulk-like diffusion timescale, . And for small separations, approaches the slow residential time scale due to adsorption-desorption. For instance, if we consider value shown in table 1 for a sub-10 nm confinement, it is two orders larger than the bulk diffusion timescale. Thus we expect two order slower apparent diffusion when adsorption-desorption interaction is included. Our goal in this paper is to understand the dynamics in the confinement which is not driven by the surface effects but is a result of confinement itself. We conclusively show that there is no alteration in diffusion coefficient due to confinement alone. The slow-down of 2 orders seen in our experiments in the absence of salt, which is dominated by the measurement of apparent diffusion, can actually be attributed to the adsorption effects.
The length scale below 100 nm is particularly important in nanofluidics27, 28, 29. Nanofluidics is applied in fields of iontronics30, 31, sequencing of biopolymers33, 34, and energy harvesting32. In this field, the water at nanoscale is considered to have bulk-like viscosity in channels above 1 nm28. Our conclusions, which are arrived at from independent diffusion measurements, support this treatment of water at nanoscale. Usage of fluorescence correlation based measurements like Fluorescence Correlation Spectroscopy(FCS) is rare in nanofluidics. As FCS has been used to study reaction kinetics43, 42, flow and diffusion measurements43, 42, extending it to nanofluidics will open-up many new possibilities. Our study shows how to interpret the timescales in fluorescence autocorrelation. This is beneficial for fluorescence correlation based measurements in nanofluidics and close to an interfaces.
6 Conclusion
In conclusion, we measured diffusion of tracer dye in water confined to nanoscale, where the separation between the confining walls is as small as 5 nm. We found that the the diffusion coefficient of the tracer dye remains unchanged for such small gaps. It indicates that viscosity of nanoconfined water is bulk-like for separations of 5 nm. These conclusions are consistent with molecular dynamics simulations of water confined to similar gaps and many reports of self-diffusion of nanoconfined water using quasi-elastic neutron scattering experiments.
7 Author’s contributions
SP designed the instrument and planned experiment along with VJ. VJ built the instrument, performed experiments and did data analysis. VJ and SP wrote the manuscript together.
VJ acknowledges fellowship from DST- INSPIRE, Govt. of India. The work is supported by intramural grant from IISER Pune
References
- L. Finney 1996 L. Finney, J. Overview lecture. Hydration processes in biological and macromolecular systems. Faraday Discussions 1996, 103, 1–18, Publisher: Royal Society of Chemistry
- Das et al. 2014 Das, R.; Ali, M. E.; Hamid, S. B. A.; Ramakrishna, S.; Chowdhury, Z. Z. Carbon nanotube membranes for water purification: A bright future in water desalination. Desalination 2014, 336, 97–109
- Büchi and Scherer 2001 Büchi, F. N.; Scherer, G. G. Investigation of the Transversal Water Profile in Nafion Membranes in Polymer Electrolyte Fuel Cells. J. Electrochem. Soc. 2001, 148, A183, Publisher: IOP Publishing
- Aines and Rossman 1984 Aines, R. D.; Rossman, G. R. Water in minerals? A peak in the infrared. Journal of Geophysical Research: Solid Earth 1984, 89, 4059–4071, _eprint: https://agupubs.onlinelibrary.wiley.com/doi/pdf/10.1029/JB089iB06p04059
- Levy and Onuchic 2006 Levy, Y.; Onuchic, J. N. Water Mediation in Protein Folding and Molecular Recognition. Annual Review of Biophysics and Biomolecular Structure 2006, 35, 389–415, _eprint: https://doi.org/10.1146/annurev.biophys.35.040405.102134
- Takata et al. 2004 Takata, K.; Matsuzaki, T.; Tajika, Y. Aquaporins: water channel proteins of the cell membrane. Progress in Histochemistry and Cytochemistry 2004, 39, 1–83
- Majumder et al. 2005 Majumder, M.; Chopra, N.; Andrews, R.; Hinds, B. J. Enhanced flow in carbon nanotubes. Nature 2005, 438, 44–44
- Nair et al. 2012 Nair, R. R.; Wu, H. A.; Jayaram, P. N.; Grigorieva, I. V.; Geim, A. K. Unimpeded Permeation of Water Through Helium-Leak–Tight Graphene-Based Membranes. Science 2012, 335, 442–444, Publisher: American Association for the Advancement of Science Section: Report
- Khan et al. 2010 Khan, S. H.; Matei, G.; Patil, S.; Hoffmann, P. M. Dynamic Solidification in Nanoconfined Water Films. Phys. Rev. Lett. 2010, 105, 106101
- Alabarse et al. 2012 Alabarse, F. G.; Haines, J.; Cambon, O.; Levelut, C.; Bourgogne, D.; Haidoux, A.; Granier, D.; Coasne, B. Freezing of Water Confined at the Nanoscale. Phys. Rev. Lett. 2012, 109, 035701, Publisher: American Physical Society
- Fumagalli et al. 2018 Fumagalli, L.; Esfandiar, A.; Fabregas, R.; Hu, S.; Ares, P.; Janardanan, A.; Yang, Q.; Radha, B.; Taniguchi, T.; Watanabe, K.; Gomila, G.; Novoselov, K. S.; Geim, A. K. Anomalously low dielectric constant of confined water. Science 2018, 360, 1339–1342, Publisher: American Association for the Advancement of Science Section: Report
- Li and Riedo 2008 Li, T.-D.; Riedo, E. Nonlinear Viscoelastic Dynamics of Nanoconfined Wetting Liquids. Phys. Rev. Lett. 2008, 100, 106102
- Raviv et al. 2001 Raviv, U.; Laurat, P.; Klein, J. Fluidity of water confined to subnanometre films. Nature 2001, 413, 51–54, Number: 6851 Publisher: Nature Publishing Group
- Zhu and Granick 2001 Zhu, Y.; Granick, S. Viscosity of Interfacial Water. Phys. Rev. Lett. 2001, 87, 096104, Publisher: American Physical Society
- Khan et al. 2016 Khan, S. H.; Kramkowski, E. L.; Hoffmann, P. M. NaCl-Dependent Ordering and Dynamic Mechanical Response in Nanoconfined Water. Langmuir 2016, 32, 10802–10807
- Morishige and Nobuoka 1997 Morishige, K.; Nobuoka, K. X-ray diffraction studies of freezing and melting of water confined in a mesoporous adsorbent (MCM-41). J. Chem. Phys. 1997, 107, 6965–6969, Publisher: American Institute of Physics
- Dokter et al. 2005 Dokter, A. M.; Woutersen, S.; Bakker, H. J. Anomalous Slowing Down of the Vibrational Relaxation of Liquid Water upon Nanoscale Confinement. Phys. Rev. Lett. 2005, 94, 178301, Publisher: American Physical Society
- Jeffery et al. 2004 Jeffery, S.; Hoffmann, P. M.; Pethica, J. B.; Ramanujan, C.; Ozer, H. O.; Oral, A. Direct measurement of molecular stiffness and damping in confined water layers. Phys. Rev. B 2004, 70, 054114, Publisher: American Physical Society
- V. Churayev et al. 1970 V. Churayev, N.; D. Sobolev, V.; M. Zorin, Z. Measurement of viscosity of liquids in quartz capillaries. Special Discussions of the Faraday Society 1970, 1, 213–220, Publisher: Royal Society of Chemistry
- Bellissent-Funel et al. 1995 Bellissent-Funel, M.-C.; Chen, S. H.; Zanotti, J.-M. Single-particle dynamics of water molecules in confined space. Phys. Rev. E 1995, 51, 4558–4569, Publisher: American Physical Society
- Takahara et al. 2005 Takahara, S.; Sumiyama, N.; Kittaka, S.; Yamaguchi, T.; Bellissent-Funel, M.-C. Neutron Scattering Study on Dynamics of Water Molecules in MCM-41. 2. Determination of Translational Diffusion Coefficient. J. Phys. Chem. B 2005, 109, 11231–11239, Publisher: American Chemical Society
- Weigler et al. 2020 Weigler, M.; Winter, E.; Kresse, B.; Brodrecht, M.; Buntkowsky, G.; Vogel, M. Static field gradient NMR studies of water diffusion in mesoporous silica. Phys. Chem. Chem. Phys. 2020, 22, 13989–13998
- Luise Spehr et al. 2011 Luise Spehr, T.; Frick, B.; Zamponi, M.; Stühn, B. Dynamics of water confined to reverse AOT micelles. Soft Matter 2011, 7, 5745–5755, Publisher: Royal Society of Chemistry
- De Santo et al. 2010 De Santo, I.; Causa, F.; Netti, P. A. Subdiffusive Molecular Motion in Nanochannels Observed by Fluorescence Correlation Spectroscopy. Anal. Chem. 2010, 82, 997–1005
- Gravelle and Ybert 2019 Gravelle, S.; Ybert, C. Flow-induced shift of the Donnan equilibrium for ultra-sensitive mass transport measurement through a single nanochannel. J. Chem. Phys. 2019, 151, 244503, Publisher: American Institute of Physics
- Zhong et al. 2018 Zhong, J.; Talebi, S.; Xu, Y.; Pang, Y.; Mostowfi, F.; Sinton, D. Fluorescence in sub-10 nm channels with an optical enhancement layer. Lab Chip 2018, 18, 568–573
- Eijkel and Berg 2005 Eijkel, J. C. T.; Berg, A. v. d. Nanofluidics: what is it and what can we expect from it? Microfluid Nanofluid 2005, 1, 249–267
- Bocquet and Charlaix 2010 Bocquet, L.; Charlaix, E. Nanofluidics, from bulk to interfaces. Chemical Society Reviews 2010, 39, 1073–1095, Publisher: Royal Society of Chemistry
- Sparreboom et al. 2009 Sparreboom, W.; van den Berg, A.; Eijkel, J. C. T. Principles and applications of nanofluidic transport. Nature Nanotech 2009, 4, 713–720
- Karnik et al. 2005 Karnik, R.; Fan, R.; Yue, M.; Li, D.; Yang, P.; Majumdar, A. Electrostatic Control of Ions and Molecules in Nanofluidic Transistors. Nano Lett. 2005, 5, 943–948, Publisher: American Chemical Society
- Yan et al. 2009 Yan, R.; Liang, W.; Fan, R.; Yang, P. Nanofluidic Diodes Based on Nanotube Heterojunctions. Nano Lett. 2009, 9, 3820–3825, Publisher: American Chemical Society
- Ren and Stein 2008 Ren, Y.; Stein, D. Slip-enhanced electrokinetic energy conversion in nanofluidic channels. Nanotechnology 2008, 19, 195707, Publisher: IOP Publishing
- Marie et al. 2013 Marie, R.; Pedersen, J. N.; Bauer, D. L. V.; Rasmussen, K. H.; Yusuf, M.; Volpi, E.; Flyvbjerg, H.; Kristensen, A.; Mir, K. U. Integrated view of genome structure and sequence of a single DNA molecule in a nanofluidic device. PNAS 2013, 110, 4893–4898, Publisher: National Academy of Sciences Section: Physical Sciences
- Chinappi and Cecconi 2018 Chinappi, M.; Cecconi, F. Protein sequencing via nanopore based devices: a nanofluidics perspective. J. Phys.: Condens. Matter 2018, 30, 204002, Publisher: IOP Publishing
- Leng and Cummings 2005 Leng, Y.; Cummings, P. T. Fluidity of Hydration Layers Nanoconfined between Mica Surfaces. Phys. Rev. Lett. 2005, 94, 026101, Publisher: American Physical Society
- Sendner et al. 2009 Sendner, C.; Horinek, D.; Bocquet, L.; Netz, R. R. Interfacial Water at Hydrophobic and Hydrophilic Surfaces: Slip, Viscosity, and Diffusion. Langmuir 2009, 25, 10768–10781, Publisher: American Chemical Society
- Ajith and Patil 2020 Ajith, V. J.; Patil, S. A new method for measurement and quantification of tracer diffusion in nanoconfined liquids. Review of Scientific Instruments 2020, 91, 013702
- Wohland et al. 2001 Wohland, T.; Rigler, R.; Vogel, H. The Standard Deviation in Fluorescence Correlation Spectroscopy. Biophysical Journal 2001, 80, 2987–2999
- Sasmal et al. 2011 Sasmal, D. K.; Mandal, A. K.; Mondal, T.; Bhattacharyya, K. Diffusion of Organic Dyes in Ionic Liquid and Giant Micron Sized Ionic Liquid Mixed Micelle: Fluorescence Correlation Spectroscopy. J. Phys. Chem. B 2011, 115, 7781–7787, Publisher: American Chemical Society
- Jmo 2021 Jmol: an open-source Java viewer for chemical structures in 3D. 2021; \urlhttp://www.jmol.org/
- Kim et al. 2015 Kim, B.; Kwon, S.; Lee, M.; Kim, Q.; An, S.; Jhe, W. Probing nonlinear rheology layer-by-layer in interfacial hydration water. PNAS 2015, 112, 15619–15623, ISBN: 9781515033110 Publisher: National Academy of Sciences Section: Physical Sciences
- Magde et al. 1974 Magde, D.; Elson, E. L.; Webb, W. W. Fluorescence correlation spectroscopy. II. An experimental realization. Biopolymers 1974, 13, 29–61
- Thompson 1999 Thompson, N. L. In Topics in Fluorescence Spectroscopy: Techniques; Lakowicz, J. R., Ed.; Topics in Fluorescence Spectroscopy; Springer US: Boston, MA, 1999; pp 337–378
- Gennerich and Schild 2000 Gennerich, A.; Schild, D. Fluorescence Correlation Spectroscopy in Small Cytosolic Compartments Depends Critically on the Diffusion Model Used. Biophysical Journal 2000, 79, 3294–3306
- Wirth et al. 2001 Wirth, M. J.; Ludes, M. D.; Swinton, D. J. Analytic Solution to the Autocorrelation Function for Lateral Diffusion and Rare Strong Adsorption. Appl. Spectrosc., AS 2001, 55, 663–669, Publisher: Society for Applied Spectroscopy
- Daniels et al. 2010 Daniels, C. R.; Reznik, C.; Landes, C. F. Dye Diffusion at Surfaces: Charge Matters. Langmuir 2010, 26, 4807–4812, Publisher: American Chemical Society
- Schoch et al. 2008 Schoch, R. B.; Han, J.; Renaud, P. Transport phenomena in nanofluidics. Rev. Mod. Phys. 2008, 80, 839–883, Publisher: American Physical Society
- Parks 1965 Parks, G. A. The Isoelectric Points of Solid Oxides, Solid Hydroxides, and Aqueous Hydroxo Complex Systems. Chem. Rev. 1965, 65, 177–198, Publisher: American Chemical Society
- Sato et al. 2018 Sato, T.; Sasaki, T.; Ohnuki, J.; Umezawa, K.; Takano, M. Hydrophobic Surface Enhances Electrostatic Interaction in Water. Phys. Rev. Lett. 2018, 121, 206002, Publisher: American Physical Society
- Walther Hansen et al. 1995 Walther Hansen, E.; Schmidt, R.; Stöcker, M.; Akporiaye, D. Self-diffusion coefficient of water confined in mesoporous MCM-41 materials determined by 1H nuclear magnetic resonance spin-echo measurements. Microporous Materials 1995, 5, 143–150
- Mitra et al. 2001 Mitra, S.; Mukhopadhyay, R.; Tsukushi, I.; Ikeda, S. Dynamics of water in confined space (porous alumina): QENS study. J. Phys.: Condens. Matter 2001, 13, 8455–8465, Publisher: IOP Publishing
- Schlaich et al. 2016 Schlaich, A.; Knapp, E. W.; Netz, R. R. Water Dielectric Effects in Planar Confinement. Phys. Rev. Lett. 2016, 117, 048001, Publisher: American Physical Society
- Sakuma et al. 2006 Sakuma, H.; Otsuki, K.; Kurihara, K. Viscosity and Lubricity of Aqueous NaCl Solution Confined between Mica Surfaces Studied by Shear Resonance Measurement. Phys. Rev. Lett. 2006, 96, 046104, Publisher: American Physical Society
- Faucheux and Libchaber 1994 Faucheux, L. P.; Libchaber, A. J. Confined Brownian motion. Phys. Rev. E 1994, 49, 5158–5163
- Carbajal-Tinoco et al. 2007 Carbajal-Tinoco, M. D.; Lopez-Fernandez, R.; Arauz-Lara, J. L. Asymmetry in Colloidal Diffusion near a Rigid Wall. Phys. Rev. Lett. 2007, 99, 138303
- Kievsky et al. 2008 Kievsky, Y. Y.; Carey, B.; Naik, S.; Mangan, N.; ben Avraham, D.; Sokolov, I. Dynamics of molecular diffusion of rhodamine 6G in silica nanochannels. J. Chem. Phys. 2008, 128, 151102, Publisher: American Institute of Physics
- Grattoni et al. 2011 Grattoni, A.; Gill, J.; Zabre, E.; Fine, D.; Hussain, F.; Ferrari, M. Device for Rapid and Agile Measurement of Diffusivity in Micro- and Nanochannels. Anal. Chem. 2011, 83, 3096–3103, Publisher: American Chemical Society
- Chen et al. 2008 Chen, Z.; Tang, Y.-J.; Xie, T.-T.; Chen, Y.; Li, Y.-Q. Fluorescence Spectral Properties of Rhodamine 6G at the Silica/Water Interface. J Fluoresc 2008, 18, 93–100
- Mubarekyan and Santore 1998 Mubarekyan, E.; Santore, M. Characterization of Polystyrene Latex Surfaces by the Adsorption of Rhodamine 6G. Langmuir 1998, 14, 1597–1603, Publisher: American Chemical Society