Discovery of Three Candidate Magnetar-powered Fast X-ray Transients from Chandra Archival Data
Abstract
It was proposed that a remnant stable magnetar could be formed in a binary neutron-star merger, leading to a fast X-ray transient (FXT) that can last for thousands of seconds. Recently, Xue et al. suggested that CDF-S XT2 was exactly such a kind of source. If confirmed, such emission can be used to search for electromagnetic counterparts to gravitational wave events from binary neutron-star mergers that have short gamma-ray bursts and the corresponding afterglows seen off-axis and thus too weak to be detected. Here we report the discovery of three new FXTs, XRT 170901, XRT 030511, and XRT 110919, from preliminary search over Chandra archival data. Similar to CDF-S XT2, these new FXTs had a very fast rise (less than a few ten seconds) and a plateau of X-ray flux erg s-1 cm-2 lasting for 1–2 ks, followed by a steep decay. Their optical/IR counterparts, if present, are very weak, arguing against a stellar flare origin for these FXTs. For XRT 170901, we identified a faint host galaxy with the source at the outskirts, very similar to CDF-S XT2. Therefore, our newly discovered FXTs are also strong candidates for magnetar-powered X-ray transients resulting from binary neutron star mergers.
Subject headings:
gamma-ray burst: general, stars: neutron, X-rays: bursts, X-rays: individual1. INTRODUCTION
The detection of both the gravitational wave (GW) and multiwavelength electromagnetic (EM) signals from the binary neutron star (BNS) merger event GW170817 marked the arrival of the multi-messenger era (Abbott et al., 2017a). The identification of EM counterparts is essential to confirm the astrophysical origin of the GW events and to advance our understanding of the physics of compact object mergers. The EM emission from GW events depends on the merger types: BNS, binary black hole (BBH), or neutron star (NS)-black hole (BH). For BNS mergers, one expects the presence of short gamma-ray bursts (sGRBs), afterglows, and kilonovas (see Berger, 2014, for a review). There is evidence that the jets that produce sGRBs and afterglows are collimated (e.g., Burrows et al., 2006; Soderberg et al., 2006; Fong et al., 2014). This implies that a majority of GW events are expected to be observed with sGRBs seen off-axis, resulting in prompt emission and afterglows too weak to be detected. Kilonovae from BNS mergers can have large solid angles but they are expected to be weak and hard to detect too (Metzger & Berger, 2012; Smartt et al., 2017).
The EM emission from GW events also depends on the nature of the post-merger remnant. It was proposed that some BNS mergers might produce a supramassive, highly magnetized, and rapidly spinning NS (i.e., magnetar) rather than a BH. In this case, Zhang (2013) argued that the afterglow powered by a rapidly spinning massive NS has a much wider solid angle than the solid angle of the sGRB jet, so that gamma-ray bursts (GRB)-less GW events can also have bright afterglows from a dissipating proto-magnetar wind with a large solid angle. Such afterglows can last for thousands of seconds. If this is the case, such unique signals can be used to search for the EM counterparts to GW events with jets viewed off-axis and can be used to probe massive millisecond magnetars and stiff equation-of-state for nuclear matter (Gao et al., 2013).
Recently, Xue et al. (2019, Xue19 hereafter) reported the discovery of a very special fast X-ray transient (FXT) from the Chandra Deep Field-South (CDF-S) Survey, CDF-S XT2. The FXT exhibited a fast rise ( s) to a plateau that last about 2 ks, followed by a steep decay (). It was not associated with a known GRB. It lies at the outskirts of a star-forming galaxy, as often seen in sGRBs but not in the long GRBs (lGRBs). Based on the properties of the light curve, spectral evolution, host galaxy, location, and event rate, Xue et al. (2019) argued CDF-S XT2 to be powered by a remnant stable magnetar from a BNS merger. The magnetar was inferred to have a magnetic field order of G and a spin period order of 1 ms (Xue19; Xiao et al., 2019; Sun et al., 2019).
There is another FXT also discovered in the CDF-S Survey, i.e., CDF-S XT1 (Bauer et al., 2017). It rose within 100 s to the peak and then decayed approximately as without a clear presence of a plateau in the peak like CDF-S XT2. It was also argued to be magnetar-powered, but viewed through ejecta (Sun et al., 2019). We note that for this FXT, which has a very faint host galaxy with unknown redshift, a very-high- GRB explanation cannot be ruled out.
It is important to discover more similar FXTs in order to confirm their astrophysical origin. We have been searching for important sources from Chandra X-ray archival data and have found three new FXTs very similar to CDF-S XT2 in many aspects111During the preparation for this paper, we have discovered a new FXT (Lin et al., 2021), which will be reported in a separate paper.. These three FXTs are denoted as X-Ray Transient (XRT) 170901, XRT 030511, and XRT 110919, following the dates on which they occurred. In Section 2, we describe the data analysis of X-ray and other multiwavelength data. In Section 3, we present the results of our analysis of the light curves and X-ray spectra of the FXTs and our search for their host galaxies. Our discussion of the nature of our sources is given in Section 4 and the conclusions of our study are given in Section 5.
2. DATA ANALYSIS
2.1. The Search Procedure
Our search for FXTs is part of our large program to investigate all the X-ray sources serendipitously detected by Chandra ACIS observations. In this program, we reduced each observation, carried out the source detection, performed multiwavelength cross-correlation, and classified the sources largely based on the method from Lin et al. (2012). The details of this program will be reported in a future paper. In order to find the magnetar-powered FXT candidates, we selected out sources that are variable according to the CIAO tool glvary (variability index 6) from data up to 2019. Then we visually checked the light curves to identify the sources that showed a clear single flare in an observation. Most of these flaring sources are stars with low X-ray-to-IR flux ratios (Lin et al., 2012) and can be ruled out securely. Only about a couple dozen were left at this step, and they included many interesting flaring sources that had been reported before (Jonker et al., 2013; Glennie et al., 2015; Irwin et al., 2016; Bauer et al., 2017, Xue19). We will focus on the three relatively bright FXTs that show similar properties (the flare has a fast rise and a peak plateau) to CDF-S XT2 and have not been studied yet.
2.2. The X-ray Observations
We analyzed not only the Chandra observations in which the three FXTs were discovered but also other archival Chandra, XMM-Newton, and Swift observations that happened to cover the fields of these FXTs (Table 2) in order to check whether flares were also detected in other observations and, if not, calculate the detection limit. We extracted the source and background light curves and spectra and created the corresponding response files for spectral fits with the latest calibration (as of May 2019 for Swift data, as of June 2020 for XMM-Newton observations and CALDB version 4.9.1 for Chandra observations). Table 2 lists the size of the source extraction region used for each observation; the background spectra and light curves were extracted from a larger (by a factor of 6–90) background region near the source. We used the software packages CIAO 4.12, SAS 19.0.0 and FTOOLS 6.25 for analysis.
For the flares, we created energy spectra from the whole flare, from the peak, and from the decay separately, and fitted them with an absorbed single powerlaw using the XSPEC fitting package (Arnaud, 1996). Due to the low counts, we rebinned the spectra to have at least one count in each bin (most bins have 1–3 counts after rebinning) and carried out the fits using the statistic.
We also carried out the fits to the flare light curves with XSPEC. In order to do this, we created the “fake” spectra corresponding to the source and background light curves. Due to the low counts, we also fitted the light curves with the statistic, with the light curves binned to have at least one count in each bin.
In order to search for the multiwavelength counterparts to the FXTs,
we carried out the absolute astrometric correction to the X-ray
positions. We adopted the method in Lin et al. (2016). The positions
of the X-ray sources were obtained with the CIAO tool
wavdetect, with the statistical errors calculated following
Kim et al. (2007). The relative astrometry of the X-ray sources is
corrected (about 0.5 arcsec for all cases) by matching with the IR sources from the VISTA Hemisphere
Survey (McMahon et al., 2013). In this step, we first identified candidate
matches and then searched for the translation and rotation of the
X-ray frame that minimize the total value ( is the
ratio of the X-ray-IR separation to the total positional error) for
90% of the candidate matches (we allowed 10% of matches that have
the largest values to be
spurious or bad). The systematic positional errors from such an
astrometric correction procedure were estimated based on 200
simulations. All the positional errors of the X-ray sources that we
will report are the
root sum squares of the statistical and systematic errors.
| CXO J234503.4423841 | CXO J050706.7315210 | CXO J010344.5214845 | |
|---|---|---|---|
| XRT 170901 | XRT 030511 | XRT 110919 | |
| X-ray position (J2000, astrometrically corrected): | |||
| R.A., Decl. | 23:45:03.44, 42:38:41.7 | 05:07:06.76, 31:52:10.8 | 01:03:44.59, 21:48:45.9 |
| 95% error (arcsec) | 0.24 | 1.05 | 0.78 |
| Detected Chandra Observation: | |||
| ObsID | 20635 | 4062 | 13454 |
| Observation Start Date | 2017-08-31 | 2003-05-10 | 2011-09-19 |
| Exposure (ks) | 74.2 | 46.2 | 91.8 |
| Source region radius (arcsec) | 2.1 | 13.7 | 6.9 |
| Off-axis angle (arcmin) | 2.8 | 10.7 | 7.2 |
| (UTC) | 2017-09-01 13:26:47 | 2003-05-11 04:38:06 | 2011-09-19 20:02:49 |
| Flare net countsaafootnotemark: | 16413 | 37420 | 88.29.6 |
| (ks)aafootnotemark: | 4.10.1 | 6.60.2 | 11.00.2 |
| Candidate host galaxy photometryaafootnotemark: : | |||
| Optical (AB mag) | F606W= | , , | , , |
| F814W= | , | , | |
| IR (AB mag) | F110W= | ||
| F160W= | |||
| Light curve fitsaafootnotemark: : | |||
| Broken powerlaw: | |||
| Initial index | |||
| Break (ks) | |||
| Second index | |||
| Magnetar model (free ): | |||
| (ks) | |||
| C-stat (dof) | 155.6 (161) | 319.8 (346) | 93.6 (88) |
| Magnetar model (, fixed): | |||
| (ks) | |||
| C-stat (dof) | 162.6 (162) | 379.0 (347) | 99.1 (89) |
| Magnetar model (, fixed): | |||
| (ks) | |||
| C-stat (dof) | 170.1 (162) | 508.6 (347) | 117.7 (89) |
| Fits to the whole flare spectrumbbfootnotemark: : | |||
| Exposure (ks) | 5.7 | 13.6 | 19.5 |
| Single powerlaw () | |||
| (1021 cm-2) | |||
| Single powerlaw () | |||
| (1021 cm-2) | |||
| Joint fits to the plateau and decay spectra: | |||
| Plateau/decay exposures (ks) | 2.0/3.7 | 1.7/11.9 | 2.2/17.3 |
| Plateau/decay net counts | 104/61 | 203/167 | 52/37 |
| Single powerlaw () | |||
| (1021 cm-2) | |||
| Plateau/decay | / | / | / |
| Single powerlaw () | |||
| (1021 cm-2) | |||
| Plateau/decay | / | / | / |
| High-energy emission upper limit: | |||
| sGRB Fluence ( erg cm-2) | 5.8 | 5.1 | 5.3 |
| lGRB peak flux ( erg cm-2 s-1) | 1.6 | 1.27 | 1.63 |
Note. — aErrors or limits are at the confidence level, except for the magnitude limits, which refer to the magnitude of the 90th faint source among the 100 nearest sources. bErrors are at the 90% confidence level.
| Obs. ID | Date | Detector | OAA | Expo | 0.5–7 keV count rate | 0.5–7 keV flux | |
|---|---|---|---|---|---|---|---|
| (ks) | ( counts s-1) | (erg s-1 cm-2) | |||||
| (1) | (2) | (3) | (4) | (5) | (6) | (7) | (8) |
| XRT 170901 | |||||||
| Swift: | |||||||
| 00038092001 | 2008-09-16 | XRT | 10.9 | 2.7 | 20 | 0.99 | 5.8e-14 |
| 00038092002 | 2008-09-17 | XRT | 10.9 | 4.5 | 20 | ||
| 00038092004 | 2008-11-06 | XRT | 11.2 | 0.1 | 20 | ||
| 00038092005 | 2008-11-09 | XRT | 9.8 | 0.6 | 20 | ||
| 00038092006 | 2009-03-29 | XRT | 7.2 | 0.3 | 20 | ||
| 00038092007 | 2009-03-31 | XRT | 6.1 | 1.2 | 20 | ||
| 00081309001 | 2020-05-04 | XRT | 7.9 | 1.5 | 20 | 1.32 | 6.8e-14 |
| 00081309002 | 2020-05-05 | XRT | 6.9 | 3.0 | 20 | ||
| XMM-Newton: | |||||||
| 0693661801 | 2012-05-28 | pn | 5.9 | 8.9 | 15 | 2.4 | 1.4e-14 |
| 0722700101 | 2013-11-22 | pn | 5.8 | 104.4 | 15 | 0.46 | 3.2e-15 |
| 0722700201 | 2013-11-13 | pn | 5.8 | 81.5 | 15 | 0.41 | 2.7e-15 |
| Chandra: | |||||||
| 13401 | 2011-09-19 | ACIS-I | 4.4 | 11.9 | 25 | 0.66 | 1.1e-14 |
| 16135 | 2014-08-18 | ACIS-I | 2.5 | 58.1 | 12 | 0.10 | 1.5e-15 |
| 16545 | 2014-08-20 | ACIS-I | 2.5 | 59.2 | 12 | 0.10 | 1.4e-15 |
| 19581 | 2017-08-23 | ACIS-I | 2.4 | 88.8 | 11 | 0.07 | 1.3e-15 |
| 19582 | 2017-08-28 | ACIS-I | 2.6 | 10.0 | 12 | 0.59 | 1.1e-14 |
| 19583 | 2017-09-14 | ACIS-I | 3.6 | 24.7 | 19 | 0.31 | 6.7e-15 |
| 20630 | 2017-08-21 | ACIS-I | 2.3 | 38.5 | 11 | 0.15 | 2.9e-15 |
| 20631 | 2017-08-27 | ACIS-I | 2.4 | 50.4 | 11 | 0.12 | 2.2e-15 |
| 20634 | 2017-08-29 | ACIS-I | 2.6 | 70.6 | 12 | 0.14 | 2.5e-15 |
| 20635 | 2017-08-31 | ACIS-I | 2.7 | 68.5 | 21 | 0.16 | 2.4e-15 |
| 20636 | 2017-09-04 | ACIS-I | 2.8 | 21.3 | 13 | 0.28 | 5.2e-15 |
| XRT 030511 | |||||||
| Swift: | |||||||
| 00084253001 | 2015-04-27 | XRT | 11.7 | 0.7 | 20 | 0.36 | 2.0e-14 |
| 00084253002 | 2015-05-18 | XRT | 10.3 | 2.0 | 20 | ||
| 00084253003 | 2015-05-19 | XRT | 10.2 | 1.3 | 20 | ||
| 00084253004 | 2015-05-23 | XRT | 10.8 | 0.7 | 20 | ||
| 00084253005 | 2015-05-25 | XRT | 7.8 | 3.4 | 20 | ||
| 00084253006 | 2015-05-27 | XRT | 7.4 | 0.6 | 20 | ||
| 00084253007 | 2015-05-28 | XRT | 7.8 | 0.5 | 20 | ||
| 00084253008 | 2015-06-02 | XRT | 9.4 | 0.5 | 20 | ||
| 00084253010 | 2015-06-07 | XRT | 9.0 | 2.9 | 20 | ||
| 00084254001 | 2015-05-06 | XRT | 11.6 | 0.6 | 20 | ||
| 00084254002 | 2015-05-25 | XRT | 8.7 | 0.2 | 20 | ||
| 00084254003 | 2015-06-07 | XRT | 9.0 | 5.0 | 20 | ||
| 00084254004 | 2015-06-09 | XRT | 8.5 | 4.8 | 20 | ||
| 00084254005 | 2015-06-12 | XRT | 9.5 | 1.2 | 20 | ||
| 00084254006 | 2015-06-17 | XRT | 11.4 | 1.4 | 20 | ||
| 00084254007 | 2015-06-19 | XRT | 10.8 | 0.9 | 20 | ||
| 00084254008 | 2015-06-21 | XRT | 11.3 | 0.9 | 20 | ||
| Chandra: | |||||||
| 4062 | 2003-05-10 | ACIS-S | 10.7 | 22.9 | 137 | 0.72 | 1.2e-14 |
| XRT 110919 | |||||||
| Chandra: | |||||||
| 13447 | 2011-09-08 | ACIS-I | 5.2 | 69.1 | 32 | 0.14 | 2.0e-15 |
| 13448 | 2011-09-13 | ACIS-I | 7.2 | 146.0 | 57 | 0.06 | 1.8e-15 |
| 13454 | 2011-09-19 | ACIS-I | 7.2 | 72.2 | 69 | 0.19 | 3.2e-15 |
| 13455 | 2011-10-19 | ACIS-I | 6.8 | 69.6 | 53 | 0.16 | 2.5e-15 |
| 14343 | 2011-09-12 | ACIS-I | 7.2 | 35.3 | 57 | 0.24 | 6.4e-15 |
| 14346 | 2011-09-21 | ACIS-I | 7.2 | 85.3 | 57 | 0.16 | 3.0e-15 |
Note. — Columns: (1) the observation ID, (2) the observation start date, (3) the detector, (4) the off-axis angle, (5) the clean exposure time of the data used in the final analysis after excluding periods of strong background flares, (6) the radius of the source circular extraction region, (7) the upper limit net count rate, (8) the upper limit of the 0.5–7 keV flux. The limits are either from individual Chandra and XMM-Newton observations or from combinations of Swift observations. The count rate upper limits were calculated with the CIAO task aprates, which uses the Bayesian approach. The flux upper limits were calculated, assuming an absorbed powerlaw spectrum inferred from the fit to the whole flare spectrum. For the three Chandra observations 20635, 4062, and 13454 in which the FXTs detected, the exposures, the count rate and flux upper limits refer to the persistent periods.
2.3. Optical and IR images
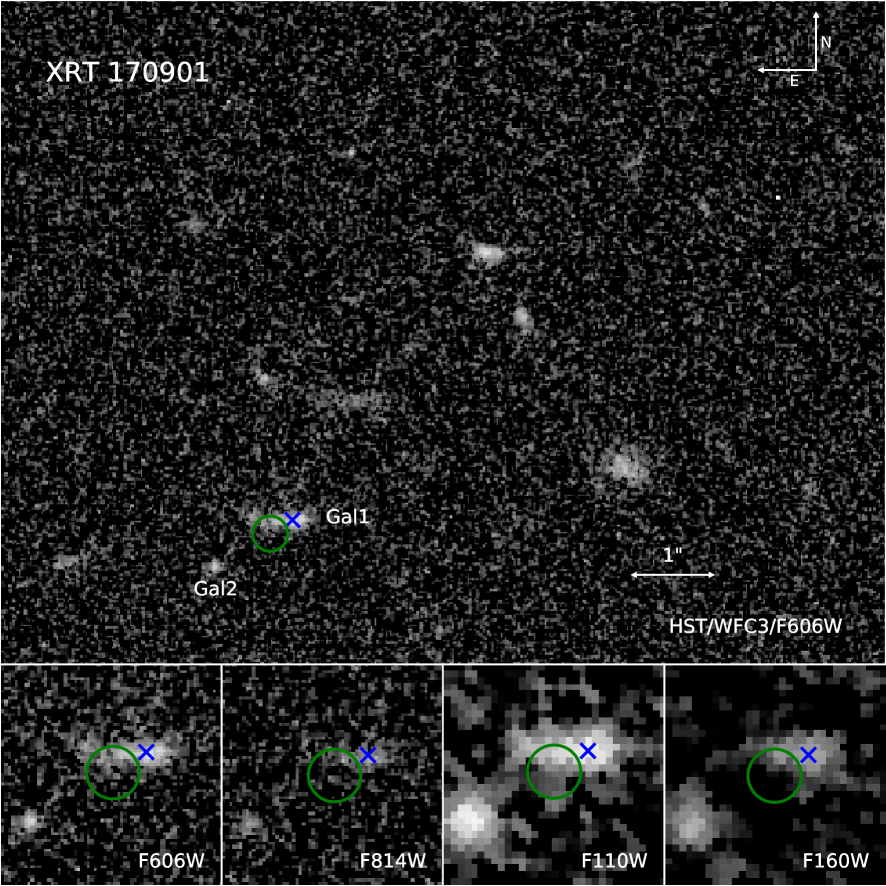
The field of XRT 170901 happened to be covered in the Hubble Space Telescope (HST) WFC3 Infrared Spectroscopic Parallel Survey (Atek et al., 2010), with two optical images (F606W and F814W, 2600 s each) taken on 2014 July 11 and two IR images (F110W and F160W, 1518 s and 759 s, respectively) taken on 2014 July 10. We produced the drizzled images with the DrizzlePac software package. The pixel size was set to be 0.03 arcsec for the optical images and 0.06 arcsec for the IR images. The astrometry of these HST images was aligned to that of the VISTA Hemisphere Survey by cross-matching the point sources detected in both frames.
We also obtained a deep Gemini Flamingos-2 image (Program ID GS-2019B-FT-208) around the field of XRT 030511 in order to search for the counterpart. The IR filter was adopted because the counterpart might be very red if the FXT is associated with a high-redshift passive galaxy or with a very late-type star. Due to weather constraints, individual exposures ranging from 12 s to 20 s were taken over several nights spanning about a month (2019-11-30 to 2020-01-01) under the best seeing conditions (average seeing 0.45 arcsec) at the Gemini South observatory. We reduced the images using the Gemini DRAGONS software. The final stacked image obtained has a total exposure of 1926 s. The astrometry of the Gemini image was also aligned with the VISTA survey.
3. RESULTS
3.1. The X-ray Flares
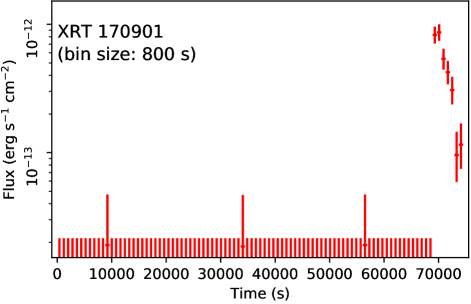
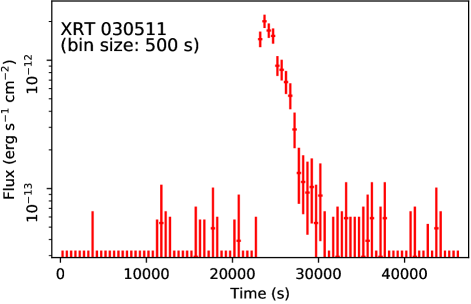
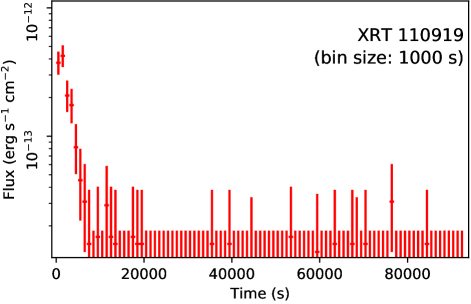
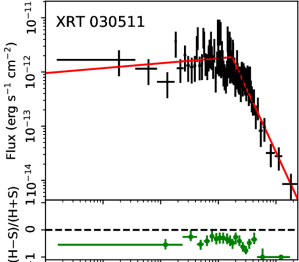
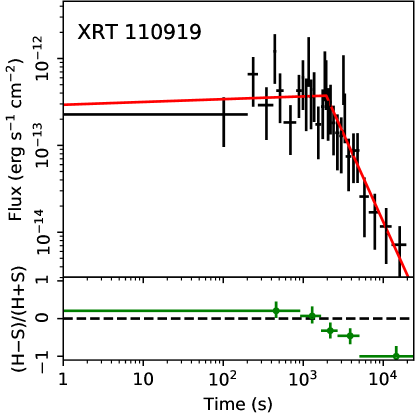
Table 1 lists the various properties of the three FXTs that we discovered. Figure 1 plots the background-subtracted light curves of the three FXTs from the Chandra observations in which they were detected. XRT 170901 was detected at 69 ks into the observation, and the observation was stopped before the flare ended. XRT 030511 was detected at the middle of the observation and seemed to end before the observation was stopped. XRT 110919 occurred at the beginning of the observation and probably began earlier than the observation. We calculated , the timespan from the 5%-th to 95%-th of the total detected counts and obtained ks, 6.6 ks and 11.0 ks for XRT 170901, XRT 030511, and XRT 110919, respectively (Table 1). The value for XRT 170901 should be a lower limit because we missed the long faint decay for this FXT, and the value for XRT 110919 is most likely an upper limit because we probably missed the early bright phase of this FXT. No clear rising phase was detected in XRT 170901 and XRT 030511. We estimated the upper limit of the rise time for these two FXTs following Xue19, which assumed a linear rise profile and the non-detection of the rising period. We obtained a upper limit on the rise time of 42 s and 19 s for XRT 170901 and XRT 030511, respectively.
Figure 2 zooms in on the flares. The time axis is on a logarithmic scale with the time zero set at the start of the flares. The start times of the flares were estimated as follows. We first identified the first photon detected from each flare, and then calculated the average waiting time of the next nine photons from the source region. We assumed the flare start time to be at before the first detection. We estimated the chance probability that the first flare photon that we identified is in fact from the background as , where is the background count rate in the source region. We obtained %, 1.6%, and 0.8% for XRT 170901, XRT 030511, and XRT 110919, respectively. In comparison, the time gap between the assumed first flare photon and the photon immediately before it (also from the source region) for each case is large, 12 ks and 430 s, with % and 35%, for XRT 170901 and XRT 030511, respectively. They are most likely from the background. The first flare photon that we identified for XRT 110919 is the first photon of the observation in the source region. Therefore, our identification of the first flare photon is fairely secure.
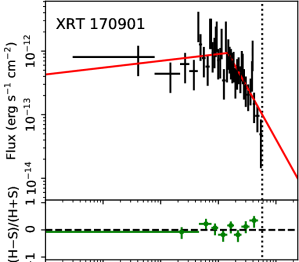
We first fitted the light curves with a broken powerlaw as was done in Xue19. The results are given in Table 1 and shown in Figure 2. The fits started from the beginning of the flares until the end of the observation (for XRT 170901) or the end of the flares (for XRT 030511 and XRT 110919, at around 20 ks). The initial index was inferred to be consistent with zero in all three XRTs. The breaks are all between 1.5–2.0 ks. The second indexes were all consistent with 2.0. We note that for XRT 030511, which occurred at the beginning of the observation, the break could occur at a later time than that we inferred in Table 1, which assumed the flare started at the beginning of the observation.
We also fitted the light curves with the magnetar model , in which is the braking index and is the spindown timescale of the magnetar. This model was commonly used to fit the X-ray afterglow of GRBs (e.g., Lü et al., 2019). The results are given in Table 1. For XRT 110919, we inferred and ks. However, for both XRT 170901 and XRT 030511, we obtained very close to 1.0 and very large, which is caused by the degeneracy of these two parameters when is very close to 1.0. In this case, the model becomes an exponential function . We are most concerned about whether good fits can be obtained with the standard magnetar models of (the magnetic dipole braking dominated) or (GW braking dominated). Therefore, we also fitted the models with and 5 and compared with the fits with free . The results are given in Table 1. The fits with are strongly disfavored, with the statistic values larger than those of the fits of free by 14.5, 188.8, and 24.1 for XRT 170901, XRT 030511, and XRT 110919, respectively. The fits with are much better, with the statistic values larger than those of the fits of free by 7.0, 59.2, and 5.5, respectively, but at least for the case of XRT 030511, the improvement is still not enough. Therefore all the three FXTs might prefer braking indexes smaller than , as was found in CDF-S XT2 (Xiao et al., 2019) and many GRBs (Stratta et al., 2018). This could imply the presence of other braking mechanisms such as fall-back accretion onto the magnetar (Metzger et al., 2018).
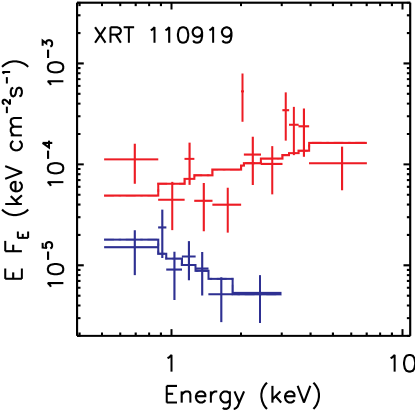
The fits to the whole flare spectra with an absorbed single powerlaw, assuming two cases of redshifts and , inferred a photon index of 2.0 in all the three FXTs (Table 1). While no significant absorption was inferred in XRT 030511 or XRT 110919, XRT 170901 seems to be heavily absorbed (intrinsic absorption column density cm-2 and cm-2 when and 1.0 was assumed, respectively). While the photon index inferred is fairly independent of the redshift assumed, the absorption column density inferred in XRT 170901 increased with the redshift assumed.
Figure 2 shows the temporal evolution of the hardness
ratio for all three FXTs. We followed Xue19 to define the hardness
ratio as , where and are the count rates from
the soft energy band 0.5–2.0 keV and the hard energy band
2.0–7.0 keV, respectively. In order to have enough statistics, the hardness ratios were calculated with
varying time bin size, requiring that each data point has at least 20 counts
from the source region. The uncertainties of the hardness ratios
were calculated with the Bayesian code BEHR
(Park et al., 2006), due to the low statistics. We found that the
hardness ratios in both XRT 030511 and XRT 110919 decreased
significantly, indicating spectral softening, in the decay in
these two FXTs. The hardness ratios in XRT 170901 seem to remain
constant over time when the flare was observed.
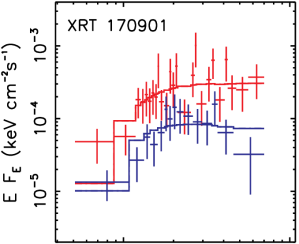
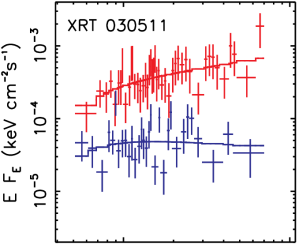
In order to characterize the spectral variation further, we fitted the plateau and decay spectra simultaneously with tied to be the same for each FXT. The fitting results are shown in Figure 3 and are given in Table 1. We note that the uncertainties on the photon indexes in the table were obtained after fixing at the best-fitting value, which allows for easy tracking of the spectral evolution. The fits confirmed that the plateau spectrum had a smaller value of the photon index, thus is harder, than the decay spectrum at the confidence levels of 2.5 and 3.2 in XRT 030511 and XRT 110919, respectively. In XRT 170901, the photon index of the plateau spectrum is consistent with that of the decay spectra within . We note that we could not rule out that the spectral softening might also be present in XRT 170901 but was missed due to the early termination of the observation before the flare ended.
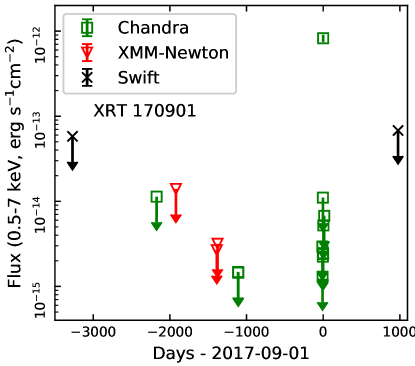
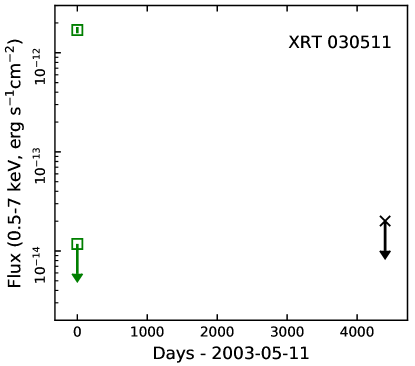
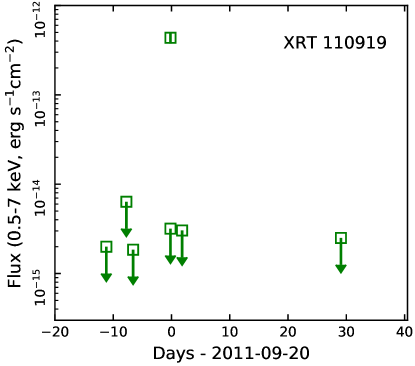
3.2. The Long-term X-ray Variability
Figure 4 plots the long-term X-ray flux curves of the three new FXTs from all the Chandra, XMM-Newton and Swift observations (Table 2). No extra flares were detected. There was no significant persistent emission seen in any observation in all the three XRTs either. Combining all available observations, we obtained the most stringent constraint on the 0.5–7.0 keV persistent emission to be erg s-1 cm-2, erg s-1 cm-2, and erg s-1 cm-2 ( upper limits) for XRT 170901, XRT 030511, and XRT 110919, respectively. Therefore, these FXTs have very large amplitudes, with the peak to the persistent X-ray flux ratio 1320, 170, 430, respectively. Because only one flare was detected in each FXT, we estimated the upper limit of the duty cycle roughly as , where is the total exposure time of all the Chandra, XMM-Newton and Swift X-ray observations. We obtained ks-1, ks-1, and ks-1, respectively.
3.3. The High-Energy Emission
Our three FXTs were not associated with a GRB in the catalog compiled by Jochen Greiner (https://www.mpe.mpg.de/~jcg/grb110918A.html).
The interplanetary network, which examines
high-energy data from a group of spacecraft equipped with -ray
burst detectors, such as INTEGRAL, Swift, and
Fermi, provided a rough fluence upper limit of
erg cm-2 for all the three FXTs (K. Hurley, private
communication).
There were Konus-Wind (KW) waiting mode data for all the three FXTs, and no high-energy counterparts were found from the 10 ks interval of each FXT (D. Svinkin, A. Ridnaia, D. Frederiks, private communication). Two upper limits were calculated following Kozlova et al. (2019) and Ridnaia et al. (2020): an upper limit on the fluence for a burst lasting less than 2.944 s and having a typical KW sGRB spectrum (an exponentially cut off power law with and keV) and a limiting peak flux (2.944 s scale) for a typical lGRB spectrum (the Band function with , , and keV). Both were calculated for the interval +/-100 s relative to the start time of each FXT and are in the 20–1500 keV band and at the 90% confidence level. The results are given in Table 1. The sGRB fluence upper limit was about erg cm-2 and the lGRB peak flux upper limt was about erg cm-2 s-1 for all the FXTs. The fluence upper limit is a factor of three more than the GRB 170817A ( erg cm-2; Goldstein et al., 2017). Therefore the KW limits can exclude the association of our FXTs with bright GRBs, but fail to exclude the association with faint GRBs or orphan afterglows (Yamazaki et al., 2002; Ghirlanda et al., 2015; Lazzati et al., 2017).
3.4. The Host Galaxies
Figure 5 shows the HST images in four broad bands, two in optical (F606W and F814W) and two in IR (F110W and F160W), around the field of XRT 170901. The 95% X-ray positional error of this FXT overlaps with a highly elongated galaxy (“Gal1” in Figure 5). The chance probability to find XRT 170901 so close to a galaxy brighter than Gal1 in F160W (24.64 AB mag) was estimated to be very low, only 0.5%. Therefore we consider it as a candidate host galaxy of XRT 170901. This galaxy might be irregular, with the emission peaking to the west and slightly outside the 95% positional error circle of XRT 170901. The optical and IR colors of this galaxy are somewhat blue (Table 1), indicating a late-type galaxy with possibly strong star-forming activity. The other closest galaxy is “Gal2” in Figure 5, 1 arcsec away from XRT 170901. Because it is well outside the 95% positional error circle of XRT 170901, it is very unlikely to host this FXT. We note that Figure 5 shows that there might be a cluster of galaxies, with both Gal1 and Gal2 being its members.
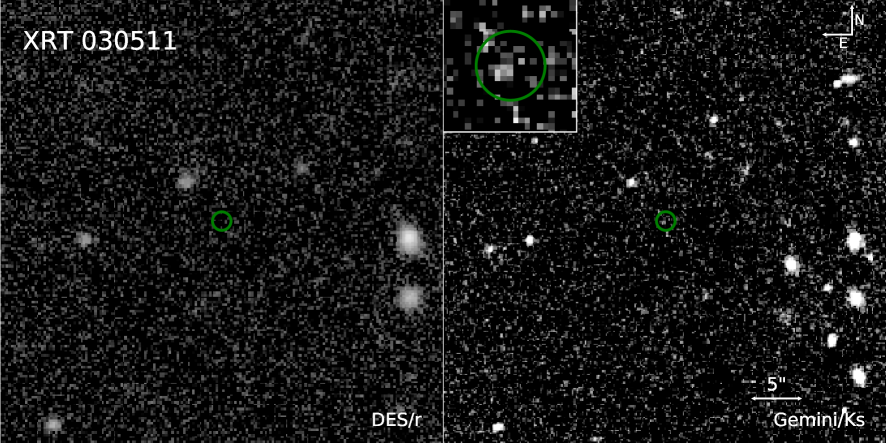
Figure 6 shows the Dark Energy Survey (DES, Abbott et al., 2018) -band and Gemini -band images around the field of XRT 030511. There are DES and VISTA images in other filters around this FXT, but we saw no clear host galaxy in any DES or VISTA image; Table 1 lists the detection limits of these images. In the very deep Gemini -band image, there might be a very weak source (a 1″-aperture magnitude of 24.50.2 AB mag) within the 95% positional uncertainty of XRT 030511. Deeper images are required to confirm this candidate counterpart.
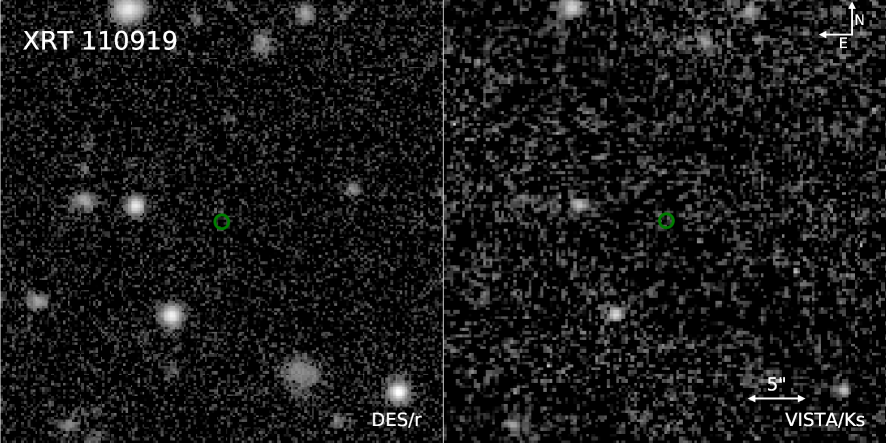
Figure 7 shows the DES -band and VISTA -band images around the field of XRT 110919, and no clear host galaxy are seen in them. There are also DES and VISTA images in other filters around the field of this FXT, without a clear host galaxy seen in them either. Table 1 lists the detection limits of various images. The ground-based images around the fields of XRT 030511 and XRT 110919 are not deep enough (e.g., AB mag, AB mag) to rule out faint hosts as seen in XRT 170901 and CDF-S XT2 ( AB mag, AB mag, Xue19).
4. DISCUSSION
4.1. Magnetar-powered X-ray transients
We have shown that the three new FXTs that we discovered also from the Chandra archival data are similar to CDF-S XT2 in many aspects, especially the flare light curve profile: a fast rise to a plateau lasting 1–2 ks, followed by a steep decay of approximately . Therefore these three new FXTs and CDF-S XT2 might have the same origin. The intriguing explanation that Xue19 proposed for CDF-S XT2, i.e., a magnetar-powered X-ray transient resulted from a BNS merger, could then be applied to our three FXTs. In the case of CDF-S XT2, the supporting evidence for the magnetar explanation includes not only the unique light curve profile but also the host properties. Xue19 found that the combined properties of the host galaxy of CDF-S XT2 (stellar mass, star-formation rate, metallicity, offset, and galaxy size) is much more commonly seen in sGRBs than in lGRBs. The redshift and thus the distance of its host galaxy is known (). Therefore Xue19 could obtain the peak X-ray luminosity of CDF-S XT2 to be erg s-1, much lower than those seen in the X-ray afterglows of sGRBs. Therefore CDF-S XT2 is consistent with an off-axis jet configuration. For our FXTs, only the host of XRT 170901 was detected, thanks to the deep HST images. Although its host might be a late-type galaxy of a modest star-formation rate, given the blue HST colors, this FXT is most likely not in the star-forming region, with a significant offset from the peak emission of the host. Therefore, this FXT is probably also of a compact star merger origin. Our three FXTs had similar peak fluxes as CDF-S XT2 ( erg s-1 cm-2). Therefore, they would have similar peak luminosity and are also more likely in an off-axis jet configuration if they are all at similar redshifts as CDF-S XT2.
The X-ray light curves of lGRBs and sGRBs typically include an initial very steep decay, which is most likely the tail of the prompt emission, and the long-lasting afterglow, which is caused by the forward shock from the interaction of the jet with the external medium (Nousek et al., 2006; Berger, 2014). However, they often also show many complicated features that can signify the presence of the magnetar central engine (e.g., Dai et al., 2006; Berger, 2014; Bernardini, 2015): a plateau phase, precursors, and flares. The plateau phase, following the initial steep decay, is very common in both lGRBs (up to 80%, e.g., Evans et al., 2009; Margutti et al., 2013; Melandri et al., 2014) and sGRBs (50%, e.g., Rowlinson et al., 2013; D’Avanzo et al., 2014). The main argument to attribute this phase to the spinning-down energy of a newly born magnetar instead of a forward shock is that the plateau in some cases in both lGRBs and sGRBs was followed by a sudden drop (Rowlinson et al., 2013), which is hard to explain with a forward shock model but can be naturally explained by the collapse of a supramassive magnetar to a BH (Lyons et al., 2010; Rowlinson et al., 2013). The magnetic field strength and the spin period inferred from the magnetar model for the plateaus seen in lGRBs and sGRBs are around G and ms (Rowlinson et al., 2014).
Our three FXTs and CDF-S XT2 are most similar to the plateau component in the X-ray light curves of GRBs. An alternative explanation for the low levels of the peak X-ray flux and the high-energy emission in these FXTs, compared with typical GRBs, is that they are distant GRBs, but this is very unlikely because an initial steep component associated with the prompt emission was not present in at least three of these four FXTs (except XRT 110919) whose early phases were fully covered by the X-ray observations.
If all these four FXTs are magnetar-powered, then there is a question of whether the newly born magnetars in these systems are stable or not. Because their decays were all consistent with within , as expected for the spindown luminosity of a stable NS, it is more likely that a stable NS was formed in these systems (see however Lü et al., 2021).
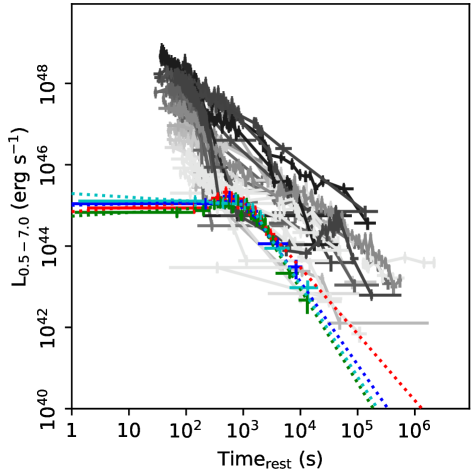
There is a correlation between the spindown luminosity and the spindown time scale: , where is the initial spin period in millisecond (Zhang, 2013). Then we can infer the redshift of 0.60, 0.39, and 0.82 and the luminosity distance of 3.6 Gpc, 2.14 Gpc, and 5.2 Gpc, for XRT 170901, XRT 030511, and XRT 110919, respectively, if we assumed that the magnetars in them have the same initial spin periods as in CDF-S XT2. The upper limit was obtained for XRT 110919 because we only obtained the lower limit on the spindown time scale (the start of this FXT was missed by the observation).
Based on these distances, we obtain the luminosity curves in Figure 8 for these magnetar-powered FXT candidates. They look remarkably similar to each other. Such a similarity indicates that the beginning of XRT 110919 might not be missed much by the observation. The plot also includes sGRBs that have redshifts and were followed up by the XRT obtained from the Swift Burst Analyser (Evans et al., 2010). It shows that if the distances that we inferred for our FXTs are correct, their initial luminosities would be much lower than seen in sGRBs, which would suggest the lack of the prompt emission and thus indicate an off-axis jet configuration.
We followed Bauer et al. (2017) to have a simple estimate of the event rate for these magnetar-powered FXT candidates. Because we considered only relatively bright FXTs, we assumed that they can be detected and identified in any CCD of any ACIS observation longer than 5 ks. With four magnetar-powered FXTs discovered in our search (including CDF-S XT2), we obtained a rate of events deg-2 yr-1 (the error is 1, following Gehrels, 1986). To convert it to a local volumetric rate density, we assumed the maximum redshift that the observations can reach is 1.0 and we obtained a rate density of Gpc-3 yr-1. This is roughly consistent with that obtained by Bauer et al. (2017) for “CDF-S XT1”-like events and that by Xue19 for “CDF-S XT2”-like events and is also broadly consistent with the BNS merger event rate density ( Gpc-3 yr-1, Abbott et al., 2017b), given the large uncertainties of these estimates.
A definite signature for the BNS merger nature of these FXTs would be the simultaneous detection of both GW events and such kind of FXTs. We consider whether such a source could be detected by the Burst Alert Telescope (BAT) onboard Swift. The BAT can reach a sensitivity (14–195 keV) of erg s-1 cm-2, where is the integration time (Baumgartner et al., 2013). The duration of the plateau phase in the rest frame is about 1000 s for all these FXTs if they are at the redshifts inferred above, so assuming an integration time of s, the BAT can reach a sensitivity of erg s-1 cm-2. The Advanced Ligo/Virgo can detect BNS mergers up to around 150 Mpc currently (Abbott et al., 2020). At this distance, CDF-S XT2 would have a peak flux around erg s-1 cm-2 in the soft X-rays. Assuming a photon index of 2.0 (all our three FXTs and CDF-S XT2 have photon index in the plateau phase consistent with this value), these FXTs would have a BAT flux of also around erg s-1 cm-2, which can be marginally detected if it is in the BAT field of the view. The BAT was not pointed toward GW170817 (Evans et al., 2017) or the second strong BNS GW event candidate GW190425 (at a distance of Mpc; Sakamoto et al., 2019) at the times when these GW events were triggered.
The XRT onboard Swift has also carried out a fast scan over the error regions of GW events that are good BNS merger candidates in order to search for the EM counterparts (Evans et al., 2016). The observations typically have an exposure time of 70 s each or sensitivity erg s-1 cm-2. Assuming a distance of Mpc for the GW events, our FXTs and CDF-S XT2 can stay above the detection limit of these XRT scans ( erg s-1) for up to 5 ks (rest-frame). Therefore, the XRT scans need to be carried out very quickly in order to detect magnetar-powered FXT signals from the BNS GW events. The XRT observed the EM counterpart to GW170817 at 0.62 days after the GW trigger, with the upper limit of erg s-1 (Evans et al., 2017). Based on Figure 8, our three FXTs and CDF-S XT2 can still be detected at the luminosity around erg s-1 at 0.62 days, marginally above the detection limit. The non-detection could be either because the magnetar had collapsed by 0.62 days, or the spectra were softened significantly and shifted out the X-ray bands, or a magnetar was simply not formed in this GW event.
4.2. Alternative Explanations
An alternative explanation for our three FXTs and CDF-S XT2 is the shock breakout (SBO) of a core-collapse supernova (Waxman & Katz, 2017; Levinson & Nakar, 2020). SBOs are expected to produce short-lived X-ray bursts lasting for a few minutes. The best known example of SBOs is SN2008D (Soderberg et al., 2008), which lasted for about 400 s and exhibited a fast-rise-and-exponential-decay profile. Dedicated search over XMM-Newton archival data found a dozen SBO candidates (Novara et al., 2020; Alp & Larsson, 2020). With very fast rise and a plateau in the X-ray light curves, our FXTs and CDF-S XT2 are distinct from these SBO candidates and should belong to a different class of objects.
Peng et al. (2019) considered CDF-S XT2 and CDF-S XT1 as accretion-driven flares from tidal disruption of white dwarfs by intermediate-mass BHs. For CDF-S XT2, Peng et al. (2019) inferred a viscous accretion time scale of 1.5 ks, which is rather long and requires a radiatively efficient and geometrically thin disk. However, CDF-S XT2 appeared highly super-Eddington at the peak, which then requires the presence of a significant beaming effect (a beaming factor of more than 1000) in the system, possibly in the form of a jet. Although it is hard to completely rule it out, we think this is very unlikely, given that we have discovered three more similar systems.
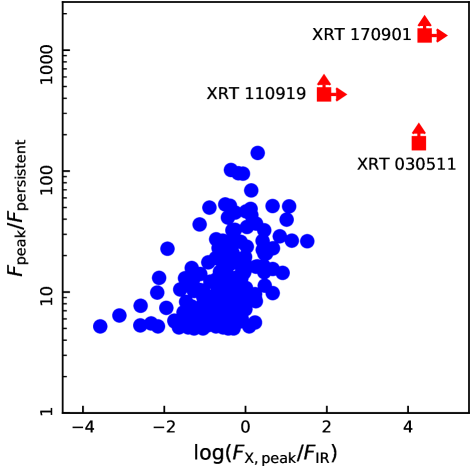
Finally, our three new FXTs are unlikely due to stellar flares. Figure 9 compares our FXTs with the stellar flares discovered in Lin et al. (2012) from the XMM-Newton catalog. These flares mostly have and the X-ray (peak) to IR flux ratio , while our FXTs have much higher amplitudes (170–1320) and much higher peak X-ray flux relative to the persistent IR flux, with , , , for XRT 170901 (the presumptive stellar IR flux was estimated from the detection limit due to the lack of a point-like counterpart in the HST images), XRT 030511 and XRT 110919, respectively. Besides, if they are stellar flares, they would have to be very far away, 31 kpc, kpc, and 5 kpc for XRT 170901, XRT 030511, and XRT 110919 even assuming a very faint, late-type star of M6 (Covey et al., 2007). This is very unlikely given their very high Galactic latitudes of , °, and °, respectively.
5. CONCLUSIONS
We have discovered three FXTs from the Chandra archival data. They share several similar properties.
-
•
The flares have a large amplitude, with the peak flux a factor of 170–1320 above the persistent level.
-
•
The rise phase was not clearly detected and should be very short ( s for XRT 170901 and s for XRT 110919; the rise of XRT 030511 was most likely missed by the observation).
-
•
The flare light curve profiles can be fitted with a broken powerlaw of the initial index consistent with and the second index . The initial plateau last 1.5–1.9 ks.
-
•
The X-ray spectra were hard in the plateau phase in all the three FXTs and seemed to soften in the decay at least in two of them whose decay phase was well covered (XRT 030511 and XRT 110919). The spectral softening is not obvious in XRT 170901, whose late decay phase was missed by the observation.
-
•
Persistent X-ray emission was not detected, with upper limits of erg s-1 cm-2 in XRT 170901 and XRT 110919 and erg s-1 cm-2 in XRT 030511.
-
•
Only a single flare was detected in all the three FXTs, though they are covered in many other observations. Therefore, these FXTs might be non-recurrent.
-
•
No GRBs were found to be associated with these FXTs.
-
•
The host galaxies are very faint, based on the detection of the host for XRT 170901 and the detection limits for XRT 030511 and XRT 110919.
These properties are similar to those seen in CDF-S XT2, which is a strong candidate for a magnetar-powered transient from a BNS merger. Such a magnetar-powered FXT signal could be detected by the Swift/BAT if it happens to point toward the GW events or by the Swift/XRT scans if they can be carried out quickly, optimally within 5 ks. We argue that these FXTs are very unlikely SBOs, tidal disruption events, or stellar flares.
References
- Abbott et al. (2020) Abbott, B. P., Abbott, R., Abbott, T. D., et al. 2020, ApJ, 892, L3
- Abbott et al. (2017a) —. 2017a, ApJ, 848, L13
- Abbott et al. (2017b) —. 2017b, Phys. Rev. Lett., 119, 161101
- Abbott et al. (2018) Abbott, T. M. C., Abdalla, F. B., Allam, S., et al. 2018, ApJS, 239, 18
- Alp & Larsson (2020) Alp, D. & Larsson, J. 2020, ApJ, 896, 39
- Arnaud (1996) Arnaud, K. A. 1996, in Astronomical Society of the Pacific Conference Series, Vol. 101, Astronomical Data Analysis Software and Systems V, ed. G. H. Jacoby & J. Barnes, 17–+
- Atek et al. (2010) Atek, H., Malkan, M., McCarthy, P., et al. 2010, ApJ, 723, 104
- Bauer et al. (2017) Bauer, F. E., Treister, E., Schawinski, K., et al. 2017, MNRAS, 467, 4841
- Baumgartner et al. (2013) Baumgartner, W. H., Tueller, J., Markwardt, C. B., et al. 2013, ApJS, 207, 19
- Berger (2014) Berger, E. 2014, ARA&A, 52, 43
- Bernardini (2015) Bernardini, M. G. 2015, Journal of High Energy Astrophysics, 7, 64
- Burrows et al. (2006) Burrows, D. N., Grupe, D., Capalbi, M., et al. 2006, ApJ, 653, 468
- Covey et al. (2007) Covey, K. R., Ivezić, Ž., Schlegel, D., et al. 2007, AJ, 134, 2398
- Dai et al. (2006) Dai, Z. G., Wang, X. Y., Wu, X. F., & Zhang, B. 2006, Science, 311, 1127
- D’Avanzo et al. (2014) D’Avanzo, P., Salvaterra, R., Bernardini, M. G., et al. 2014, MNRAS, 442, 2342
- Evans et al. (2009) Evans, P. A., Beardmore, A. P., Page, K. L., et al. 2009, MNRAS, 397, 1177
- Evans et al. (2017) Evans, P. A., Cenko, S. B., Kennea, J. A., et al. 2017, Science, 358, 1565
- Evans et al. (2016) Evans, P. A., Kennea, J. A., Palmer, D. M., et al. 2016, MNRAS, 462, 1591
- Evans et al. (2010) Evans, P. A., Willingale, R., Osborne, J. P., et al. 2010, A&A, 519, A102
- Fong et al. (2014) Fong, W., Berger, E., Metzger, B. D., et al. 2014, ApJ, 780, 118
- Gao et al. (2013) Gao, H., Ding, X., Wu, X.-F., Zhang, B., & Dai, Z.-G. 2013, ApJ, 771, 86
- Gehrels (1986) Gehrels, N. 1986, ApJ, 303, 336
- Ghirlanda et al. (2015) Ghirlanda, G., Salvaterra, R., Campana, S., et al. 2015, A&A, 578, A71
- Glennie et al. (2015) Glennie, A., Jonker, P. G., Fender, R. P., Nagayama, T., & Pretorius, M. L. 2015, MNRAS, 450, 3765
- Goldstein et al. (2017) Goldstein, A., Veres, P., Burns, E., et al. 2017, ApJ, 848, L14
- Irwin et al. (2016) Irwin, J. A., Maksym, W. P., Sivakoff, G. R., et al. 2016, Nature, 538, 356
- Jonker et al. (2013) Jonker, P. G., Glennie, A., Heida, M., et al. 2013, ApJ, 779, 14
- Kim et al. (2007) Kim, M., Kim, D.-W., Wilkes, B. J., et al. 2007, ApJS, 169, 401
- Kozlova et al. (2019) Kozlova, A. V., Svinkin, D. S., Lysenko, A. L., et al. 2019, in Journal of Physics Conference Series, Vol. 1400, Journal of Physics Conference Series, 022014
- Lazzati et al. (2017) Lazzati, D., Deich, A., Morsony, B. J., & Workman, J. C. 2017, MNRAS, 471, 1652
- Levinson & Nakar (2020) Levinson, A. & Nakar, E. 2020, Phys. Rep., 866, 1
- Lin et al. (2016) Lin, D., Carrasco, E. R., Webb, N. A., et al. 2016, ApJ, 821, 25
- Lin et al. (2021) Lin, D., Irwin, J. A., & Berger, E. 2021, The Astronomer’s Telegram, 14599, 1
- Lin et al. (2012) Lin, D., Webb, N. A., & Barret, D. 2012, ApJ, 756, 27
- Lü et al. (2019) Lü, H.-J., Lan, L., & Liang, E.-W. 2019, ApJ, 871, 54
- Lü et al. (2021) Lü, H.-J., Yuan, Y., Lan, L., et al. 2021, Research in Astronomy and Astrophysics, 21, 047
- Lyons et al. (2010) Lyons, N., O’Brien, P. T., Zhang, B., et al. 2010, MNRAS, 402, 705
- Margutti et al. (2013) Margutti, R., Zaninoni, E., Bernardini, M. G., et al. 2013, MNRAS, 428, 729
- McMahon et al. (2013) McMahon, R. G., Banerji, M., Gonzalez, E., et al. 2013, The Messenger, 154, 35
- Melandri et al. (2014) Melandri, A., Covino, S., Rogantini, D., et al. 2014, A&A, 565, A72
- Metzger et al. (2018) Metzger, B. D., Beniamini, P., & Giannios, D. 2018, ApJ, 857, 95
- Metzger & Berger (2012) Metzger, B. D. & Berger, E. 2012, ApJ, 746, 48
- Nousek et al. (2006) Nousek, J. A., Kouveliotou, C., Grupe, D., et al. 2006, ApJ, 642, 389
- Novara et al. (2020) Novara, G., Esposito, P., Tiengo, A., et al. 2020, ApJ, 898, 37
- Park et al. (2006) Park, T., Kashyap, V. L., Siemiginowska, A., et al. 2006, ApJ, 652, 610
- Peng et al. (2019) Peng, Z.-K., Yang, Y.-S., Shen, R.-F., et al. 2019, ApJ, 884, L34
- Ridnaia et al. (2020) Ridnaia, A., Svinkin, D., & Frederiks, D. 2020, in Journal of Physics Conference Series, Vol. 1697, Journal of Physics Conference Series, 012030
- Rowlinson et al. (2014) Rowlinson, A., Gompertz, B. P., Dainotti, M., et al. 2014, MNRAS, 443, 1779
- Rowlinson et al. (2013) Rowlinson, A., O’Brien, P. T., Metzger, B. D., Tanvir, N. R., & Levan, A. J. 2013, MNRAS, 430, 1061
- Sakamoto et al. (2019) Sakamoto, T., Barthelmy, S. D., Lien, A. Y., et al. 2019, GRB Coordinates Network, 24184, 1
- Smartt et al. (2017) Smartt, S. J., Chen, T. W., Jerkstrand, A., et al. 2017, Nature, 551, 75
- Soderberg et al. (2006) Soderberg, A. M., Berger, E., Kasliwal, M., et al. 2006, ApJ, 650, 261
- Soderberg et al. (2008) Soderberg, A. M., Berger, E., Page, K. L., et al. 2008, Nature, 453, 469
- Stratta et al. (2018) Stratta, G., Dainotti, M. G., Dall’Osso, S., Hernandez, X., & De Cesare, G. 2018, ApJ, 869, 155
- Sun et al. (2019) Sun, H., Li, Y., Zhang, B.-B., et al. 2019, ApJ, 886, 129
- Waxman & Katz (2017) Waxman, E. & Katz, B. 2017, Shock Breakout Theory, ed. A. W. Alsabti & P. Murdin, 967
- Xiao et al. (2019) Xiao, D., Zhang, B.-B., & Dai, Z.-G. 2019, ApJ, 879, L7
- Xue et al. (2019) Xue, Y. Q., Zheng, X. C., Li, Y., et al. 2019, Nature, 568, 198
- Yamazaki et al. (2002) Yamazaki, R., Ioka, K., & Nakamura, T. 2002, ApJ, 571, L31
- Zhang (2013) Zhang, B. 2013, ApJ, 763, L22