]These co-authors had equal contributions to this work. ]These co-authors had equal contributions to this work.
On-demand electric control of spin qubits
Abstract
Once called a “classically non-describable two-valuedness” by Pauli pauli1925uber , the electron spin is a natural resource for long-lived quantum information since it is mostly impervious to electric fluctuations and can be replicated in large qubit arrays in silicon, offering high-fidelity control yang2019silicon ; xue2022quantum ; noiri2022fast ; madzik2022precision ; mills2021twoqubit ; zwerver2021qubits . Paradoxically, one of the most convenient control strategies is the integration of nanoscale magnets to artificially enhance the coupling between spins and electric fields golovach2006electric ; pioro2008electrically ; yoneda2017quantumdot , which in turn hampers the spin’s noise immunity kha2015do and adds architectural complexity boter2021spiderweb . Here we demonstrate a technique that enables a switchable interaction between spins and orbital motion of electrons in silicon quantum dots, without the presence of a micromagnet. The naturally weak effects of the relativistic spin-orbit interaction in silicon are enhanced by more than three orders of magnitude by controlling the energy quantisation of electrons in the nanostructure, enhancing the orbital motion. Fast electrical control is demonstrated in multiple devices and electronic configurations, highlighting the utility of the technique. Using the electrical drive we achieve a coherence time µs, fast single-qubit gates with ns, and gate fidelities of 99.93% probed by randomised benchmarking. The higher gate speeds and better compatibility with CMOS manufacturing, enabled by on-demand electric control, improve the prospects for realising scalable silicon quantum processors.
The density of quantum dots in an array is set by the size of the electron wave functions and the consequent size and pitch of gate electrodes gonzalez2020scaling , but individualised high-fidelity control of electron spin qubits in silicon typically requires on-chip integration of much larger devices, such as micromagnets pioro2008electrically ; leon2020coherent or stripline antennae koppens2006driven . Other spin qubit implementations, such as electrons in InAs nanowires nadj2010spin and holes in silicon maurand2016cmos and germanium watzinger2018germanium ; scappucci2020germanium ; froning2021ultrafast , have sufficient intrinsic spin-orbit coupling to enable localised, all-electrical control employing only the gate electrodes that are already used to define the quantum dots. However, the same spin-orbit coupling that enables direct electrical control also exposes the qubits to decoherence from electrical noise kha2015do . Furthermore, while some semiconductor fabrication plants have the capability to integrate non-silicon materials, electrostatic quantum dots using silicon CMOS technology offer the strongest prospect of leveraging the full potential for integration and miniaturisation of the most advanced transistor fabrication nodes ieee2021irds .
.1 Controlling the electron energy spectrum
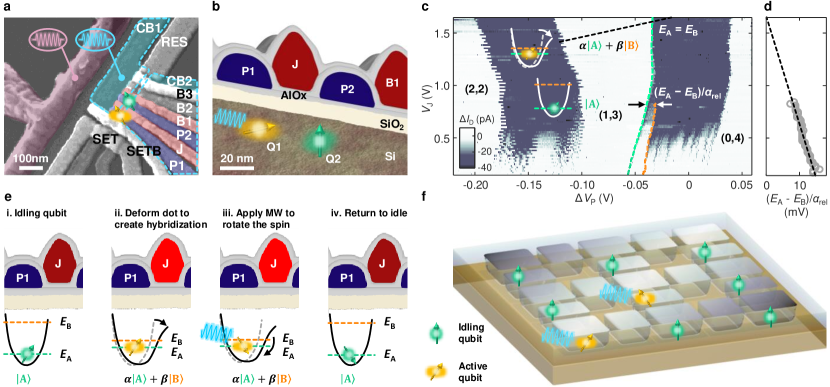
Spin-orbit effects for electrons in silicon quantum dots are typically small, meaning that direct electric driving is weak, however, these effects can become significant if the electron is allowed to move between orbital configurations within the quantum dot leon2021bell . These configurations are generally immutable due to the well quantised orbital energies of few-electron quantum dots. However, a dense arrangement of electrodes such as in Fig. 1a and b (nominally identical to all devices studied here) gives access to a level of control over the potential landscape that can be used to consistently form quantum dots that possess an energy spectrum with flexible controllability. Further technical details on strategies to achieve this controllability are discussed in the Extended Data. Fig. 1c shows how excited state spectroscopy may be used to infer the presence of electronic states that have a differential lever arm , and correspond to different charge density distributions and which therefore couple differently to the various electrostatic gates. We denote these orbital configurations A and B, and their energies and , respectively.
We instigate internal movement of the electron within the dot by biasing the gate voltages to reconfigure the quantum dot to a point where the two states have approximately the same energy. At this point, the quantum dot becomes highly polarisable, which leads to fast electrically-driven spin resonance (EDSR). This quasi-degeneracy point can be found by extracting the excitation energy (separation of fitted orange and green dotted lines in Fig. 1c) extrapolating the trend against the side gate voltage (J gate) to the point where it reaches zero (Fig. 1d). At that point, the A and B states hybridize, and the electron enters a superposition state . The exact values of and depend on the particular nature of the two states A and B, but they are controllable by exploiting the differential lever arm .
This controllability over the wavefunction hybridization is the key to on-demand exploitation of spin-orbit effects. In Fig. 1e we present a typical series of control steps, starting from an idling qubit (i) that is set to have minimal spin-orbit effects by setting the quantisation energy to be large ( and ). The dot is then deformed to create the hybrid state (ii) for a short amount of time, sufficient for the application of a microwave pulse (iii) that creates the spin rotation. The quantum dot is then reconfigured to the idling mode (iv), which restores the qubit resilience against spurious electric field fluctuations. This strategy allows for idling qubits to be protected for prolonged times while active qubits are being manipulated. The vision of a scalable qubit arrangement presented in Fig. 1f is based on a dense array of spins in a grid of quantum dots. Individualised control of a subset of the qubits can be performed by reconfiguring the electrostatic potential and applying microwave excitations, both achieved directly by the top gate that defines the quantum dot. This on-demand activation of spin-orbit effects would significantly simplify the design and operation of large scale quantum processors by removing the need for additional complex nanomagnet or antennae arrays boter2021spiderweb ; li2018crossbar .
.2 Pulsed electron spin-orbital spectroscopy
While the orbital spectroscopy technique presented in Fig. 1c is useful in narrowing the search range for a degeneracy point, ultimately it is the change in spin dynamics that will be the most reliable signature of the successful formation of a hybrid wavefunction. We show as a dashed black line in Fig. 1c the trend of points that are identified as having maximum spin-orbit driving. This identification is obtained by a technique we call pulsed electron spin-orbital spectroscopy (PESOS). It consists of applying a microwave pulse of fixed duration and power and measuring its effect on the spins as a function of the microwave frequency and gate voltages. Optimal visibility of the spin resonant frequency is obtained when the pulse duration and amplitude match with the condition for a spin flip.
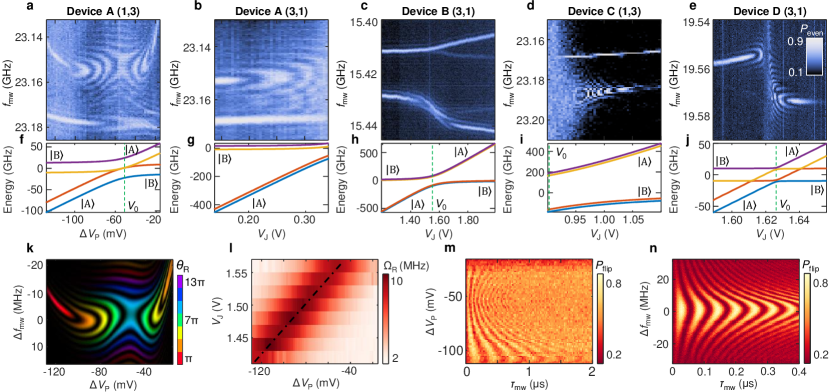
Fig. 2a-e show examples of PESOS maps generated by double quantum dots in which spins are initialised and measured using parity readout yang2019silicon ; seedhouse2021pauli . Where two peaks are observed at different frequencies, these correspond to spins in each of the two dots. All maps, taken from different devices and charge configurations, have identifiable hybridization points where the probability of a spin flip forms oscillations in at least one of the resonance lines. These oscillations are the result of an enhancement of the efficiency of the EDSR, which results in multiple spin flips with the same microwave power. Simulations of gate-dependent Rabi and Larmor frequencies, shown for example in Fig. 2k for the measurement from Fig. 2a, can be used to extract the magnitude of the speed-up and help interpret the PESOS maps.
By measuring PESOS maps for different biases and , we can extract the bias configuration that provides the largest speed-up in Rabi frequency, as shown in Fig. 2l. This allows us to completely reconstruct the line in the charge stability diagram in Fig. 1c that corresponds to a hybrid ground state. Fig. 2m shows the complete Rabi oscillations of the spin, confirming our interpretation of the PESOS maps. We also use this interpretation to guide the experimental search for the degeneracy point shown in Fig. 2b (see also Extended Data). The regularity with which we find these hybridisation points is encouraging for the prospects of scalability of this technology. Fig. 2a and b were taken using different charge configurations in the same device. Fig. 2c-e are three other devices, with different operation modes, material stacks and microwave excitation strategies, measured in two different cryogenic setups. Details of the differences between devices A, B, C and D are given in the Supplemental Material.
The taxonomy of the spin-orbit effects in Fig. 2a-e is related to the particularities of the orbital states A and B in each of the devices and dot configurations. The hybridization may involve states with different valley configurations (under a rough interface) hao2014electron ; bourdet2018all ; corna2018electrically , in-plane orbitals kyriakidis2007universal or even with interaction-induced charge transitions such as in Wigner molecules ercan2021strong ; abadillo2021wigner . For each of these transitions, the hybridization energy gap compares differently to the spin splitting energy, leading to significant qualitative differences as can be seen in the eigenvalues of the fitted four-level models, shown in Fig. 2f-j.
We note that device D is driven all-electrically by applying a microwave field directly to the CB1 gate (see Fig. 1a), while devices A to C are driven by the coplanar waveguide antenna, which creates both electric and magnetic fields dehollain2012nanoscale .
.3 Qubit performance
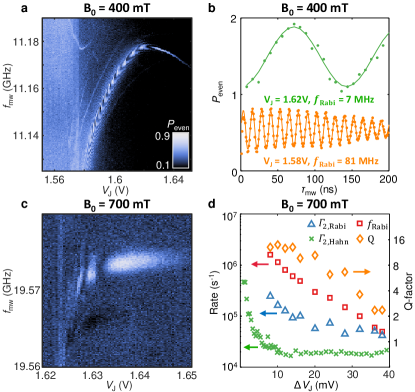
We turn our attention to the tunability of the hybridization characteristics, focusing on the device from Fig. 2e (namely, device D). This is the device with the most marked effects of the orbital degeneracy on spins among the devices studied here. We measure additional PESOS maps at two different magnetic fields, mT in Fig. 3a and mT in Fig. 3c (the latter is the same field as Fig. 2e, but adopting Gaussian pulses and focused near the degeneracy point). At 400 mT, we observe the largest enhancement in Rabi frequency across all experiments (see Fig. 3a). Reaching MHz close to the degeneracy point, we achieve the fastest qubit rotation in 3 ns (Fig. 3b, lower curve). The spin-orbit interaction continues to decrease for increasing , leading to Rabi frequencies kHz at V (data not shown and bias point out of range in Fig. 3a), recovering the regime of vanishingly small spin-orbit interactions. For comparison, we also show the measurement at the point where the Larmor frequency is in first order insensitive to noise in the J gate voltage ( V), in which the Rabi frequency is MHz (Fig. 3b, upper curve).
At 700 mT the qubit states become more convoluted, with poorer initialisation fidelity and the appearance of additional transitions, which pollute the two-level nature of the system. Indeed, the small hybridization gap extracted in Fig. 2j is indicative of susceptibility to the appearance of undesirable diabatic transitions and leakage to the excited orbital. However, with careful initialisation strategies and using Gaussian pulses to avoid the leakage of the qubit into undesired excited states, it is possible to achieve PESOS maps with good visibility (Fig. 3c) and coherent driving (Fig. 3d).
In Fig. 3d we characterise the impact of the orbital hybridization on the coherent spin driving. Near the degeneracy point V, the Stark shift becomes very large, leading to a faster damping rate of the Rabi oscillations . However, the Rabi frequency improvement outpaces the decoherence amplification, resulting in a higher Q-factor close to the degeneracy point.
We devise and perform a Hahn echo experiment where for the same microwave control point ( mV), the idle wait times are offset by to analyse the potential for performing fast control near the spin-orbit mixing point V, while idling at a bias point where the spin is decoupled from its orbital motion at large (see Fig. 3d). Interestingly, for mV the Hahn echo coherence time saturates, indicating that the residual spin-orbit coupling does not introduce any additional decoherence. As this is still a point of strong Rabi enhancement, it is possible to operate this particular qubit in a configuration that enjoys both fast control and long coherence times, granted that some dynamical decoupling steps are incorporated in the qubit operation.
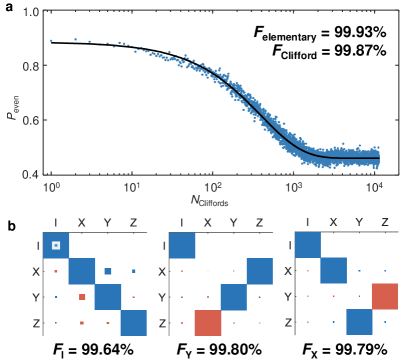
For the remaining experiment, we tune device D to an alternative bias point in the (1,3) charge configuration and apply the microwave drive to the J gate to probe spin-orbit coupling in line with the array of dots. This configuration yields a degeneracy point with strong spin-orbit coupling in a region with only a weak voltage dependence on the qubit Larmor and Rabi frequencies (see Extended Data), making the qubit substantially more resistant to noise. The single qubit gate fidelity is assessed in this configuration via randomised benchmarking on the Clifford set, achieving a 99.93% elementary gate fidelity as shown in Fig. 4a, well above the threshold for error corrected fault tolerance fowler2012surface . Additionally we assess the fidelity of the individual elementary gates using Gate Set Tomography nielsen2020gate shown in Fig. 4b resulting in average fidelities of 99.64%, 99.79% and 99.80% for the I, X, and Y gate, respectively.
.4 Outlook
Entering a new realm of ultra-fast single spin control creates new questions regarding the physics of these systems and their application for quantum information processing. For example, the dominant source of control errors for this resonance method are unknown. Pulse engineering for magnetically driven spin qubits in similar devices have led to significant improvements in control fidelity, achieving error rates below 0.05% yang2019silicon . However, these strategies can only be translated to the electric driving approach discussed here once the sources of error are well understood and characterised.
Another question left open in our analysis is in regard of the controllability of the hybridization gap. Comparison of the spin-orbit effect in all four devices investigated here creates confidence on the ubiquity of this phenomenon. Hence, its applicability as the main control strategy for qubit devices depends on the regularity of the resulting EDSR speed-up and dependability on being able to shape the orbital hybridization gap in accordance with one’s needs.
Switchability of the electrical dependency allows us to tackle one of the most cumbersome aspects of quantum information, which is that the addressability of a qubit often must be traded off against its noise resilience. This allows us to turn on the degeneracy for control and turn it off to harvest the long intrinsic coherence of Si qubits while idling. This prospect comes with the cost of an additional characterisation step for the quantum processor to achieve this degeneracy. Hence, from the scalability perspective it is crucial to further understand how to achieve this degeneracy in a consistent way in a given dot. We believe that the consistency of achieving this degeneracy in four different devices already in this first demonstration gives confidence that a consistent method is achievable and we anticipate more experiments and theoretical work in this direction in future.
We emphasise that enhanced electric driving of the spin is merely one consequence of the ability to controllably create hybridised wavefunctions with coherent spin states. Extensions of this result could lead to strategies to couple spins to photons yao2005theory ; mi2018coherent , as well as lead to long-range two-qubit gates via spin-dependent electric dipolar coupling, similar to strategies such as the Rydberg gates jaksch2000fast ; crane2021rydberg and Mølmer-Sørensen gates sorensen1999quantum , previously demonstrated in atomic qubits, or predicted for electron-nuclear flip-flop qubits in silicon tosi2017Silicon .
I Methods
I.1 Measurement Setup
Devices A & C were measured in an Oxford Kelvinox 400HA dilution refrigerator. DC bias voltages are generated from Stanford Research Systems SIM928 Isolated Voltage Sources. Gate pulse waveforms are generated from a Tektronix AWG5208 Arbitrary Waveform Generator (AWG) and combined with DC biases using custom linear bias-tees.
Devices B & D were measured in a Bluefors XLD400 dilution refrigerator. DC bias voltages are generated from Basel Precision Instruments SP927 DACs. Gate pulse waveforms are generated from a Quantum Machines OPX and combined with DC biases using custom linear bias-tees.
The SET current of devices A, B, & C are amplified using a room temperature I/V converter (Basel SP983c) and sampled by a digitiser (Gage Octopus CS8389 for devices A & B, QM OPX for device C). The SET of device D is connected to a tank circuit and measured via reflectometry, where the source tone is generated from the QM OPX, and the return signal amplified with a Cosmic Microwave Technology CITFL1 LNA at the 4K stage, and a Mini-circuits ZX60-P33ULN+ and Mini-circuits ZFL-1000LN+ at room temperature, before being digitised and demodulated with the QM OPX.
For all devices, microwave pulses are generated from a Keysight PSG8267D Vector Signal Generator, with I/Q and pulse modulation waveforms generated from the AWGs.
I.2 Theoretical Modeling and Fits
Here, we summarise the theoretical method involved in obtaining the four-level energy diagrams shown in Fig. 2f-j. The goal of this method is to obtain a description of our system based on the PESOS maps using an effective four-level model, consisting of two spin- systems, and . These quantum states can be either valley or orbital states, depending on the specific system, and are represented by and . The spin states are split by the Zeeman splitting in the presence of a magnetic field and thus, forming a total of four non-degenerate states. A full description of the Hamiltonian is contained in the Supplementary Information.
The four-level model is fitted to two different sets of information, one is the qubit frequency , and the other is the Rabi frequency given by . To obtain these information from the PESOS maps as shown in Fig. 2a-e, we extract vertical line traces of as a function of the driving frequency at each voltage value. We can then fit these traces to the Rabi equation given by:
| (1) |
where is the amplitude of the oscillations, is the Rabi frequency, is the driving frequency, is the resonant qubit frequency, is the total time of the driving pulse, and is amplitude offset of the oscillations. From this fit, we can extract both the Rabi frequency , and the qubit frequency, given by , as a function of the gate voltage (either or ). With these information, we are also able to obtain the simulated PESOS maps as shown in Fig. 2k by plotting the Rabi equation for each voltage value with the fitted parameters.
These extracted values of and as a function of gate voltage will be the target fit values of the four-level model. By varying the parameters of the four-level model Hamiltonian, we perform a non-linear least squares fit of both the Rabi frequencies and the qubit frequency simultaneously, minimizing the difference between the calculated values from the four-level model and target values obtained from fitting to the Rabi equation. The output of this least squares fit are the Hamiltonian parameters describing the system. More details on the fitting procedure and fitted values are contained in the Supplementary Information. Finally, these fitted parameters will enable us to calculate the eigen-energies of the Hamiltonian and obtain the energy diagrams as shown in Fig. 2f-j.
I.3 Randomised Benchmarking
The benchmarking sequences used in Fig. 4a are constructed from elementary gates X, Y, -X, -Y, gates [X,X], [Y,Y], and an I-gate which is implemented as a sequence of [X,X,-X,-X,-X,-X,X,X]. Each Clifford gate contains on average 1.875 elementary gates.
For each data point, an average probability is taken from 20 randomised sequences, each averaged over 100 shots. Due to a hardware memory limit, sequences longer than 1420 Cliffords are executed as repetitions of half, quarter, or eighth-length sequences as necessary. Repeated sections have a minimum length of 710 Cliffords.
II Data Availability
The datasets generated and/or analysed during this study are available from the corresponding authors on reasonable request.
III Code Availability
The analysis codes that support the findings of the study are available from the corresponding authors on reasonable request.
IV Acknowledgements
We acknowledge helpful conversations and technical support from A. Dickie. We acknowledge support from the Australian Research Council (FL190100167 and CE170100012), the US Army Research Office (W911NF-17-1-0198), and the NSW Node of the Australian National Fabrication Facility. The views and conclusions contained in this document are those of the authors and should not be interpreted as representing the official policies, either expressed or implied, of the Army Research Office or the US Government. The US Government is authorized to reproduce and distribute reprints for Government purposes notwithstanding any copyright notation herein. W.G., M.F., J.Y.H., J.D.C., and S.S. acknowledge support from Sydney Quantum Academy.
V Author information
V.1 Author Contributions
T.T. measured devices A and C first observing the enhanced SOI Rabi in A. W.G. measured devices B and D demonstrating the EDSR without a micromagnet in D. J.Y.H participated in qubit benchmarking in D, with M.F & W.G. participating in the analysis. W.H.L participated in the measurements with all devices. Experiments were done under A.L., A.S., A.S.D., and C.H.Y.’s supervision. W.H.L. and F.E.H. fabricated the devices, with A.S.D.’s supervision on enriched 28Si wafers supplied by K.M.I., N.V.A., H.-J.P., and M.L.W.T. S.S. designed the RF setup for devices B and D. A.S., C.H.Y., and R.C.C.L. developed control strategies for enhanced EDSR. P.Y.M., M.F., and J.D.C. developed models of spin-orbital degeneracy, with A.S. and C.E.’s supervision. W.G., A.S., M.F., T.T., W.H.L., J.Y.H, F.E.H., A.L., C.H.Y., A.M., and A.S.D. wrote the manuscript, with input from all co-authors.
V.2 Corresponding Authors
Correspondence to W. Gilbert, A. Saraiva, or A. S. Dzurak.
VI Competing Interests
T.T., W.H.L., R.C.C.L., A.L., C.H.Y., A.S. and A.S.D. are inventors on a patent related to this work (AU provisional application 2021901923) filed by the University of New South Wales with a priority date of 25th June 2021. All other authors declare they have no competing interests.
References
- (1) Pauli, W. Über den einfluß der geschwindigkeitsabhängigkeit der elektronenmasse auf den zeemaneffekt. Zeitschrift für Physik 21, 373–385 (1925).
- (2) Yang, C. H. et al. Silicon qubit fidelities approaching incoherent noise limits via pulse engineering. Nature Electronics 2, 151–158 (2019).
- (3) Xue, X. et al. Quantum logic with spin qubits crossing the surface code threshold. Nature 601, 343–347 (2022).
- (4) Noiri, A. et al. Fast universal quantum gate above the fault-tolerance threshold in silicon. Nature 601, 338–342 (2022).
- (5) Mądzik, M. T. et al. Precision tomography of a three-qubit donor quantum processor in silicon. Nature 601, 348–353 (2022).
- (6) Mills, A. R. et al. Two-qubit silicon quantum processor with operation fidelity exceeding 99%. Preprint at https://arxiv.org/abs/2111.11937 (2021).
- (7) Zwerver, A. M. J. et al. Qubits made by advanced semiconductor manufacturing. Preprint at https://arxiv.org/abs/2101.12650 (2021).
- (8) Golovach, V. N., Borhani, M. & Loss, D. Electric-dipole-induced spin resonance in quantum dots. Physical Review B 74, 165319 (2006).
- (9) Pioro-Ladriere, M. et al. Electrically driven single-electron spin resonance in a slanting zeeman field. Nature Physics 4, 776–779 (2008).
- (10) Yoneda, J. et al. A quantum-dot spin qubit with coherence limited by charge noise and fidelity higher than 99.9%. Nature Nanotechnology 13, 102–106 (2017).
- (11) Kha, A., Joynt, R. & Culcer, D. Do micromagnets expose spin qubits to charge and johnson noise? Applied Physics Letters 107, 172101 (2015).
- (12) Boter, J. M. et al. The spider-web array–a sparse spin qubit array. Preprint at https://arxiv.org/abs/2110.00189 (2021).
- (13) Gonzalez-Zalba, M. et al. Scaling silicon-based quantum computing using cmos technology. Nature Electronics 4, 872–884 (2021).
- (14) Leon, R. et al. Coherent spin control of s-, p-, d- and f-electrons in a silicon quantum dot. Nature Communications 11, 797 (2020).
- (15) Koppens, F. H. et al. Driven coherent oscillations of a single electron spin in a quantum dot. Nature 442, 766–771 (2006).
- (16) Nadj-Perge, S., Frolov, S., Bakkers, E. & Kouwenhoven, L. P. Spin–orbit qubit in a semiconductor nanowire. Nature 468, 1084–1087 (2010).
- (17) Maurand, R. et al. A CMOS silicon spin qubit. Nature Communications 7, 13575 (2016).
- (18) Watzinger, H. et al. A germanium hole spin qubit. Nature Communications 9, 3902 (2018).
- (19) Scappucci, G. et al. The germanium quantum information route. Nature Reviews Materials 6, 926–943 (2021).
- (20) Froning, F. N. et al. Ultrafast hole spin qubit with gate-tunable spin–orbit switch functionality. Nature Nanotechnology 16, 308–312 (2021).
- (21) IEEE International Roadmap for Devices and Systems - IEEE IRDS™ (2021). URL https://irds.ieee.org/.
- (22) Leon, R. C. et al. Bell-state tomography in a silicon many-electron artificial molecule. Nature Communications 12, 3228 (2021).
- (23) Li, R. et al. A crossbar network for silicon quantum dot qubits. Science Advances 4, eaar3960 (2018).
- (24) Seedhouse, A. E. et al. Pauli blockade in silicon quantum dots with spin-orbit control. PRX Quantum 2, 010303 (2021).
- (25) Hao, X., Ruskov, R., Xiao, M., Tahan, C. & Jiang, H. Electron spin resonance and spin–valley physics in a silicon double quantum dot. Nature Communications 5, 3860 (2014).
- (26) Bourdet, L. & Niquet, Y.-M. All-electrical manipulation of silicon spin qubits with tunable spin-valley mixing. Physical Review B 97, 155433 (2018).
- (27) Corna, A. et al. Electrically driven electron spin resonance mediated by spin–valley–orbit coupling in a silicon quantum dot. npj Quantum Information 4, 6 (2018).
- (28) Kyriakidis, J. & Burkard, G. Universal quantum computing with correlated spin-charge states. Physical Review B 75, 115324 (2007).
- (29) Ercan, H. E., Coppersmith, S. N. & Friesen, M. Strong electron-electron interactions in Si/SiGe quantum dots. Physical Review B 104, 235302 (2021).
- (30) Abadillo-Uriel, J. C., Martinez, B., Filippone, M. & Niquet, Y.-M. Two-body wigner molecularization in asymmetric quantum dot spin qubits. Phys. Rev. B 104, 195305 (2021).
- (31) Dehollain, J. et al. Nanoscale broadband transmission lines for spin qubit control. Nanotechnology 24, 015202 (2012).
- (32) Fowler, A. G., Mariantoni, M., Martinis, J. M. & Cleland, A. N. Surface codes: Towards practical large-scale quantum computation. Physical Review A 86, 032324 (2012).
- (33) Nielsen, E. et al. Gate Set Tomography. Quantum 5, 557 (2021).
- (34) Yao, W., Liu, R.-B. & Sham, L. Theory of control of the spin-photon interface for quantum networks. Physical Review Letters 95, 030504 (2005).
- (35) Mi, X. et al. A coherent spin–photon interface in silicon. Nature 555, 599–603 (2018).
- (36) Jaksch, D. et al. Fast quantum gates for neutral atoms. Phys. Rev. Lett. 85, 2208–2211 (2000).
- (37) Crane, E., Schuckert, A., Le, N. H. & Fisher, A. J. Rydberg entangling gates in silicon. Physical Review Research 3, 033086 (2021).
- (38) Sørensen, A. & Mølmer, K. Quantum computation with ions in thermal motion. Physical Review Letters 82, 1971–1974 (1999).
- (39) Tosi, G. et al. Silicon quantum processor with robust long-distance qubit couplings. Nature Communications 8, 450 (2017).
- (40) Becker, P., Pohl, H.-J., Riemann, H. & Abrosimov, N. Enrichment of silicon for a better kilogram. physica status solidi (a) 207, 49–66 (2010).
- (41) Itoh, K. M. & Watanabe, H. Isotope engineering of silicon and diamond for quantum computing and sensing applications. MRS Communications 4, 143–157 (2014).
- (42) Yang, C. H., Lim, W. H., Zwanenburg, F. A. & Dzurak, A. S. Dynamically controlled charge sensing of a few-electron silicon quantum dot. AIP Advances 1, 042111 (2011).
- (43) Yang, C. H. et al. Orbital and valley state spectra of a few-electron silicon quantum dot. Phys. Rev. B 86, 115319 (2012).
Device A was fabricated on an isotopically enriched silicon-28 substrate (50 ppm residual 29Si) becker2010enrichment . Devices B, C & D were fabricated on an epitaxially grown, isotopically purified 28Si epilayer with a residual 29Si concentration of 800 ppm itoh2014isotope .
| Device |
|
Gate Materials | Electron Occupancy |
|
|
Mode of Driving | ||||||
|---|---|---|---|---|---|---|---|---|---|---|---|---|
| A | 50 ppm | TiPd | (1,3) & (3,1) | 0.825 | 22.3 | antenna-based | ||||||
| B | 800 ppm | TiPd | (3,1) | 0.55 | 15.4 | antenna-based | ||||||
| C | 800 ppm | Al | (1,3) | 0.825 | 22.3 | antenna-based | ||||||
| D | 800 ppm | Al | (3,1) | 0.1 - 1.0 | 2.8 - 28 | gate-based |
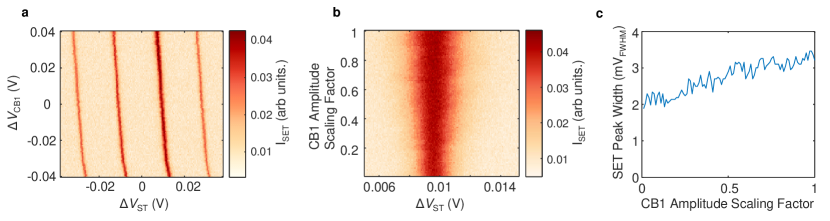
The microwave signal applied to the CB1 gate of Device D is delivered through a transmission line that is poorly characterised for frequencies above 6 GHz. a, Here the line transmission is calibrated by first measuring the slope of Coulomb oscillations relative to the voltages on the sensor top gate and the CB1 gate, which gives a relative lever arm of 14.8. Then, in b the width of a single Coulomb peak is measured against the microwave amplitude, scaled from a reference level of 0 dBm from the source. The fitted peak width trend in c gives a maximum amplitude at the CB1 gate of mV when multiplied by the relative lever arm.
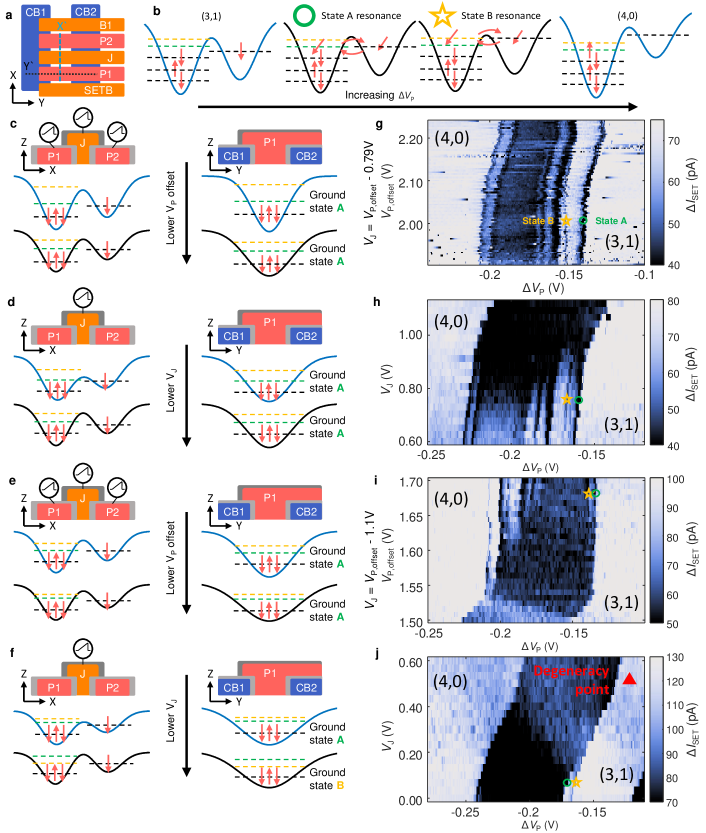
The protocol for tuning the energy spectrum of a new charge configuration to create a level degeneracy, resulting in a speed-up of the qubit Rabi frequency. The protocol utilises excited state spectroscopy, where a differential square wave excitation is applied to , with in-phase charge movements detected using double lock-in down-conversion yang2011dynamically . is swept across an interdot charge transition to observe changes in the interdot tunnel rate associated with the population of excited states yang2012orbital . a, Top-view schematic layout of the device gates. b, Schematic potential landscapes for increasing , progressing from deep in (3,1) to deep in (4,0), where in-between the ground state of the P2 dot crosses the level of multiple states for the 4th electron of the P1 dot. In g the two right-most features are designated as states A and B, representing the ground and 1st excited states of the P1 dot. To create a level degeneracy we observe the trend in the separation of states A and B whilst deforming the dots, and tune towards a point of zero separation. In g, , , and are varied and denoted as , with the expected potential deformation shown in c. The states A & B appear to converge for decreasing , so we set and in d & h re-tune to achieve desired tunnel rates. At the lower J value the excited states can be probed again. In e & i we further lower , and lose the visibility of the excited state due to high tunnel rates. In f & j we again attempt to re-tune the interdot tunnel rate and again observe the states A & B, here converging for higher , potentially a sign that states A & B have already crossed. Now we perform a PESOS map near the red triangle where we anticipate a degeneracy, with results shown in 2b in the main text. We note that the first PESOS map we took in the vicinity of the red triangle immediately showed a speed up of the qubit Rabi frequency.
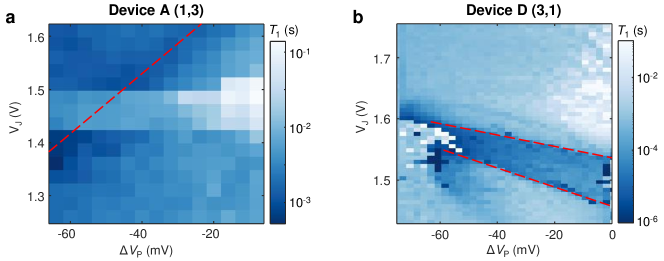
The spin relaxation time measuring across the full target charge configurations for Device A (a) and Device D (b) in and gate space. The locations of level crossings are indicated as red dashed lines. This shows an enhanced spin relaxation rate near the point of level degeneracy in the respective systems. Interestingly, there are two visible transitions in Device D, between which the spin relaxation is faster than the background, potentially indicating the population of an alternative ground state.
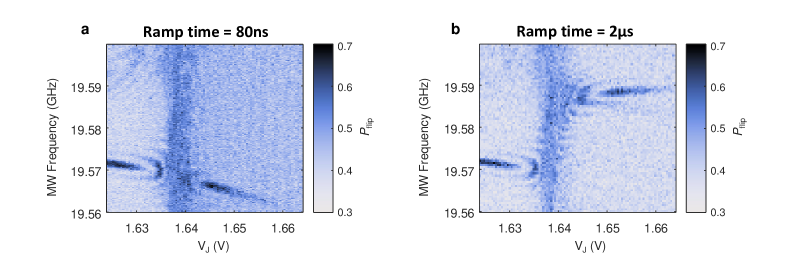
a, PESOS map in which the ramp time of the J-gate voltage is 80 ns. The resonance frequency continues on a linear trend, indicating that the orbital state is maintained when crossing the point of degeneracy at V. b, PESOS map in which the J-gate ramp time is increased to s. The resonance frequency jumps after the degeneracy point, indicating population of a new orbital state via adiabatic passage across the level-crossing.
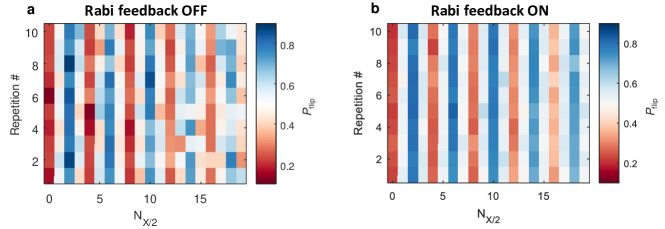
a and b show Rabi oscillations discretised into rotations and repeated 10 times to observe instability, with Rabi frequency feedback on, and off, respectively. The feedback protocol measures for 5, 7, 9, and 11 pulses, each of which should result in a 0.5 flip proportion in the ideal case. It then applies a correction to the microwave amplitude of , where is the measured spin flip proportion after rotations.
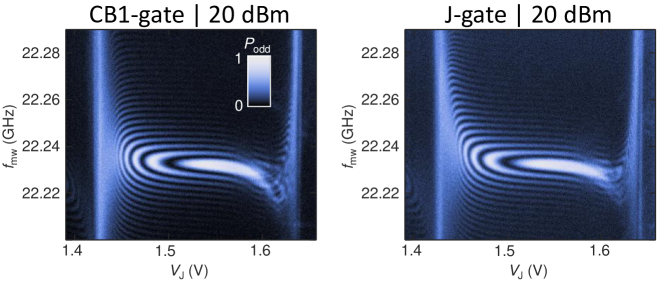
a, PESOS map acquired with microwave drive applied to the CB1 gate. b, A PESOS map acquired using the same configuration as for Fig. 4, with microwave drive applied to the J-gate. Both measurements use the same source power of 20 dBm, however variation in line losses due to different electronics may result in differences in electric field amplitude applied to the CB1- and J-gates.