New limits on double-beta decay of 190Pt and 198Pt
F.A. Danevicha,111Corresponding author. E-mail address: danevich@kinr.kiev.ua (F.A. Danevich)., M. Hultb, A. Junghansc, D.V. Kasperovycha, B.N. Kropivyanskya, G. Lutterd, G. Marissensb, O.G. Polischuka, M.V. Romaniuka, H. Strohb, S. Tessalinae, V.I. Tretyaka, B. Waree
aInstitute for Nuclear Research of NASU, 03028 Kyiv, Ukraine
bEuropean Commission, Joint Research Centre, Retieseweg 111, 2440 Geel, Belgium
cHelmholtz-Zentrum Dresden-Rossendorf, Bautzner Landstrasse 400 01328 Dresden, Germany
dDepartment of Environmental Engineering, Technical University of Denmark, DTU Risø Campus, 4000, Roskilde, Denmark
eJohn de Laeter Centre for Isotope Research, GPO Box U 1987, Curtin University, Bentley, WA, Australia
Abstract
A search for double-beta decay of 190Pt and 198Pt with emission of -ray quanta was realized at the HADES underground laboratory with a 148 g platinum sample measured by two ultralow-background HPGe detectors over 8946 h. The isotopic composition of the platinum sample has been measured with high precision using inductively coupled plasma mass spectrometry. New lower limits for the half-lives of 190Pt relative to different channels and modes of the decays were set on the level of yr. A possible exact resonant transition to the 1,2 1326.9 keV level of 190Os is limited for the first time as yr. A new lower limit on the double-beta decay of 198Pt to the first excited level of 198Hg was set as yr, one order of magnitude higher than the limit obtained in the previous experiment.
1 Introduction
Double-beta decay was considered for the first time by Goeppert-Mayer in 1935 [1]. The neutrino accompanied mode of the decay with emission of electrons (two-neutrino double-beta decay, ) is allowed in the Standard Model of particles and interactions (SM) and is already observed in eleven nuclei with measured half-lives in the range yr [2]. Another possibility could be decay without neutrino emission, neutrinoless double-beta decay (). However, this process violates the lepton number conservation and is only possible if neutrinos are massive Majorana particles [3]. Thus, the decay is the most sensitive test of the lepton number conservation law and one of the most promising tools to study properties of the neutrino and the weak interaction. In general, the neutrinoless process can be mediated by many effects beyond the SM and is considered as one of the most powerful probes of the SM [4, 5, 6, 7]. Despite the attempts, the decay is still not observed: the most sensitive experiments give upper half-life limits in the range yr. This allows to bound the effective Majorana neutrino mass at the level of eV (see, e.g., the reviews [6, 7, 8, 9] and the recent original works [10, 11, 12, 13, 14, 15, 16]).
Other channels of double-beta decay are “double-beta plus” decay processes: double-electron capture (), electron capture with positron emission (), and double-positron decay (). Although allowed in the SM, the two-neutrino mode of the process (theoretically the fastest decay channel due to the biggest values of the phase space factor) has yet to be indisputably discovered. There are indications of decay with yr in 130Ba [17, 18, 19] and 78Kr [20, 21]. However, the indications for 130Ba decay was obtained only in geochemical experiments by detection of an anomaly in the traces of xenon isotopic concentration in barite minerals. The results of the experiment [20, 21] with a proportional chamber need to be confirmed. Recently an observation of the decay of 124Xe with yr was claimed by the XENON collaboration by using the XENON1T dark-matter detector [22]. As for the neutrinoless double-beta plus decay processes, their mechanisms are the same as for the decay with electrons emission. Moreover, there are some additional arguments to develop experimental methods to search for the , and decays, taking into account the potential to investigate the possible contribution of the right-handed currents to the decay rate if observed [23], and an interesting possibility of a resonant process (see [24] and references therein).
Two platinum isotopes are potentially unstable relative to the double-beta decay: 190Pt with the decay energy keV [25] and the isotopic abundance [26], and 198Pt with the decay energy keV [25] and the isotopic abundance [26]. A simplified decay scheme of 190Pt is shown in Fig. 1.
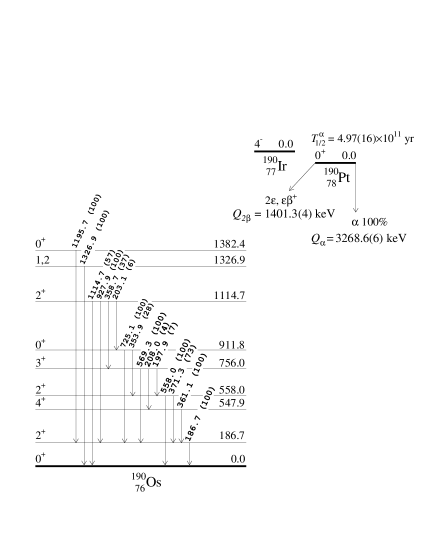
The nuclide remains one of few nuclides with a possibility of exact resonant decay. The resonant character of the process is expected in the transition to the 1,2 1326.9(10) keV excited level of the daughter [24]. It should be stressed that the decay channel was not considered in the previous work [28] due to a rather poor accuracy of the value at the time of the experiment (in 2011 the recommended was 1383(6) keV [29]). A status of the decay as a potential resonance can be characterized by the resonance parameter :
| (1) |
where is the de-excitation width of the electron shell of the daughter nuclide. The degeneracy parameter is equal to , where is the energy of the daughter nucleus excited level, are the binding energies of the captured electrons on the atomic shells of the daughter atom. Taking into account the presently recommended value [25] the resonance parameter for 190Pt (normalized on the value for the decay 54Fe 54Cr) can reach one of the biggest values among the possible resonant transitions [24]222Unfortunately, the 1326.9-keV level characteristics are known with a rather limited accuracy: the uncertainty of the level energy is keV, spin is 1 or 2, while parity of the level is unknown.. The method of ultralow-background HPGe -ray spectrometry was applied in the present study to search for different channels and modes of and processes in 190Pt, including the possible resonant transitions in the nuclide.
A simplified decay scheme of another possible unstable isotope of platinum, 198Pt, is presented in Fig. 2. The transition of 198Pt to the first 411.8 keV excited level of 198Hg is expected to be accompanied by emission of -ray quanta with energy 411.8 keV that can be detected by -spectrometry methods too.

In the next Section we describe the high-purity platinum sample, precise measurements of its isotopic composition, and the ultralow background HPGe detector system used in the experiment. The data analysis and obtained limits on the and processes in 190Pt and the decay of 198Pt to the first excited level of the daughter are presented in Section 3. A summary of the experiment is given in the Conclusions section.
2 Experiment
2.1 Platinum sample, isotopic composition of the material
A disk-shaped sample of metallic platinum with a diameter of 25.04(1) mm, a thickness of 14.07(2) mm, and with a mass of 148.122(1) g was used in the experiment. The purity grade of the platinum is 99.95%333In May 2016 the Pt disk was used as a neutron transmission target in the Institute of Radiation Physics of the Helmholtz-Zentrum (Dresden). It was m away from the electron beam (30 MeV) and the neutron producing radiator. The target was irradiated by a neutron flux of about neutrons per second for about one week. The neutron spectrum starts around keV and ends at around 10 MeV with a maximum around MeV.. The representative isotopic abundance of 190Pt in normal terrestrial materials has a rather big uncertainty [26]. Thus, special mass-spectrometry measurements of the sample were realized.
The Pt isotopic measurements were acquired using a sector field ICP-MS ELEMENT XR (ThermoScientific) at the John de Laeter Centre for Isotope Research, Curtin University. Measurements of masses 190Pt,192Pt, 194Pt, 195Pt, 196Pt, and 198Pt were performed in low resolution mode using electrostatic scanning (e-scan, i.e., peak jumping) from a set magnet mass at 190Pt. Due to the drastically different abundances of Pt isotopes, the ELEMENT XR’s triple detection mode is advantageous for such analyses as isotopes such as 190Pt and 192Pt can be measured in a pulse-counting detection mode, while the remaining masses can be analysed in analogue mode all within the same analytical session. Prior to the analysis of each sample, a blank solution of 2% HNO3 was measured to correct for background. A summary of the platinum isotopic composition, as well as numbers of nuclei of the isotopes in the sample are presented in Table 1.
| Isotope | (%) | Number of nuclei | |
|---|---|---|---|
| IUPAC [26] | this work | in the sample | |
| 190Pt | 0.012(2) | 0.0127(1) | |
| 192Pt | 0.782(24) | 0.7759(16) | |
| 194Pt | 32.864(410) | 32.6511(522) | |
| 195Pt | 33.775(240) | 33.6884(526) | |
| 196Pt | 25.211(340) | 25.5376(419) | |
| 198Pt | 7.356(130) | 7.3343(115) | |
2.2 Ultralow-level gamma-ray spectrometry measurements
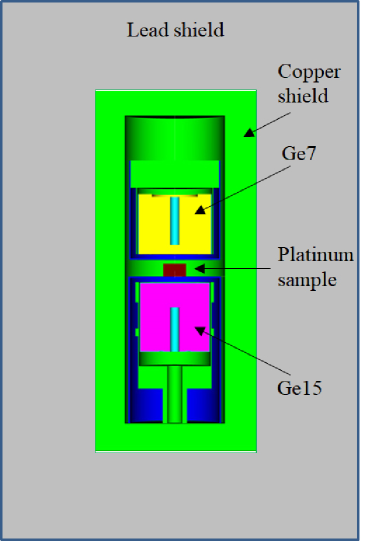
The platinum sample was measured in an ultralow-background HPGe-detector system located 225 m underground in the laboratory HADES (Belgium) [31, 32]. The detector system consists of two p-type Extended Range HPGe-detectors facing each other (see a schematic of the set-up in Fig. 3). Both the detectors were manufactured by Canberra semiconductor (Olen, Belgium). The detectors were shielded by 35 mm electrolytic copper (innermost) then 40 mm ultralow-level lead and on the outside 145 mm lead. The main characteristics of the HPGe detectors are presented in Table 2, more details of the detector system can be found in [33].
| Ge7 | Ge15 | |
| Energy resolution (FWHM) at 1333 keV | 2.2 keV | 1.8 keV |
| Relative efficiency | 90% | 85% |
| Crystal mass | 1778 g | 1840 g |
| Endcap / Window material | HPAl / HPAl | HPAl / HPAl |
| Dead layer (front) | 0.3 m | 0.3 m |
| HPAl = High Purity Aluminum | ||
The data with the Pt sample were collected starting from February 6th, 2018 over a period of 805 days in 6 runs covering a live time of 8946 h (373 d). The measurements of background without sample were carried out for 674 h (28 d). The energy calibration and stability check was performed using reference point sources containing 60Co, 137Cs and 241Am.
3 Results and discussion
3.1 Radionuclides detected in the platinum sample
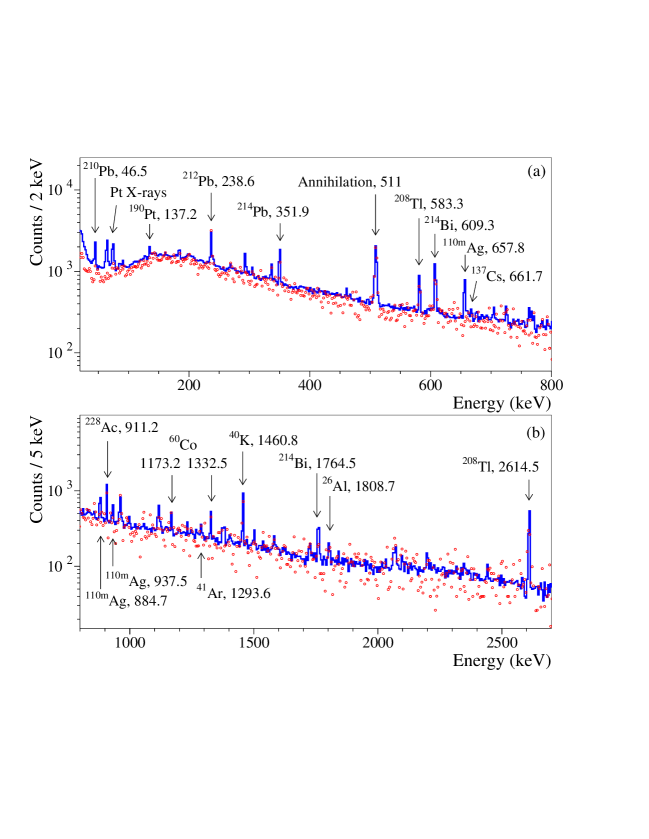
The sum energy spectra measured by the Ge7 and Ge15 detectors with the Pt sample and without sample (background) are shown in Fig. 4. The majority of the peaks can be assigned to 40K and nuclides of the 232Th, 235U and 238U decay families. There are also peaks of 22Na, 26Al, 54Mn, 60Co, 137Cs and 110mAg. The traces of 22Na, 26Al and 110mAg that were detected are presumingly reminiscence from neutron activation of minor impurities of the Pt-sample during the neutron experiment in Dresden and during air-transport. Radioactive 22Na and 26Al can be also cosmogenically generated in the aluminum details of the HPGe detectors [34]. 54Mn and 60Co are typical cosmogenic radionuclides that can be produced in Pt, copper and some other materials of the set-up. Presence of 137Cs can be a result of the set-up (sample) pollution after the Chernobyl or (and) Fukushima Daiichi nuclear disasters. In the Pt data there is a clear peak with energy 137.2 keV due to the decay of 190Pt to the 137.2 keV excited level of 186Os [35]444The results of the decay investigation will be presented in a separate report.. Also peaks due to neutron-gamma reactions on the materials of the set-up were observed: in particular, a 139.7-keV peak of 75mGe produced by neutron-gamma reaction on 74Ge, a 198.4-keV peak from 70Ge(n,)71mGe reaction, a 202.6-keV peak from 115In(n,)116In reaction. There is also a peak of 41Ar with energy 1293.6 keV due to operation of the BR-1 nuclear reactor of the Belgian nuclear research centre. The peak is present on few specific days (approximately 15 days in total) during the measurements when air blows from the reactor towards the inlet of the ventilation for the HADES laboratory. We have decided to do not exclude the data with the 41Ar peak taking into account a rather mild effect of the radioactivity in the energy intervals of interest.
The energy dependence of the energy resolution in the sum energy spectrum measured with the Pt sample by the detectors Ge7 and Ge15 was determined for the low energy region ( keV) by using intense X-ray and -ray peaks with energies 65.1 keV and 66.8 keV ( and X-ray of Pt), 137.2 keV (190Pt), 238.6 keV (212Pb), 295.2 keV and 351.9 keV (214Pb) as:
| (2) |
where is in keV. For the energies above 352 keV we use an approximation obtained by analysis of the peaks 238.6 keV (212Pb), 295.2 keV and 351.9 keV (214Pb), 583.2 keV (208Tl), 609.3 keV (214Bi), 1173.2 keV and 1332.5 keV (60Co) and 1460.8 keV (40K):
| (3) |
The specific activity555In this paper “specific activity” is the activity per unit mass of the sample and not to the mass of a certain isotope. of all detected radionuclides was calculated using the following formula:
| (4) |
where () is the area of a peak in the sample (background) spectrum; () is the time of the sample (background) measurement; is the -ray emission intensity of the corresponding transition; is the full energy peak efficiency; is the sample mass. The detection efficiencies were calculated with the EGSnrc simulation package [36, 37], the events were generated homogeneously in the Pt sample. The Monte Carlo models of the two detectors have being validated through several participations in proficiency tests and an additional validation measurement was done using a 57Co point source. The standard deviation of the relative difference between the simulations and the experimental data is for -ray peaks with energies 122.1 keV and 136.5 keV for the detectors Ge7 and Ge15. The estimated specific activities of radioactive impurities in the platinum are presented in Table 3.
| Chain | Nuclide | Specific activity (mBq/kg) |
|---|---|---|
| 22Na | ||
| 26Al | ||
| 40K | ||
| 54Mn | ||
| 60Co | ||
| 137Cs | ||
| 110mAg | ||
| 232Th | 228Ra | |
| 228Th | ||
| 235U | 235U | |
| 231Pa | ||
| 238U | 234Th | |
| 234mPa | ||
| 226Ra | ||
| 210Pb |
3.2 Limits on the double-beta decay processes in 190Pt
No peculiarity was observed in the experimental energy spectra that could be ascribed to the decay processes in 190Pt or 198Pt. Thus, we set limits on different modes and channels of the decays by using the following formula:
| (5) |
where is the number of nuclei of interest in the sample (see Table 1), is the detection efficiency for the -ray (X-ray) quanta searched for, is the measuring time, and is the number of events of the effect which can be excluded at a given C.L. In the present work all the values and the half-life limits are given with 90% C.L. The detection efficiencies of the detector system to the (X-ray) quanta expected in different modes and channels of the double-beta processes in 190Pt and 198Pt were simulated with the EGSnrc simulation package [36, 37], the decay events were generated by the DECAY0 events generator [38].
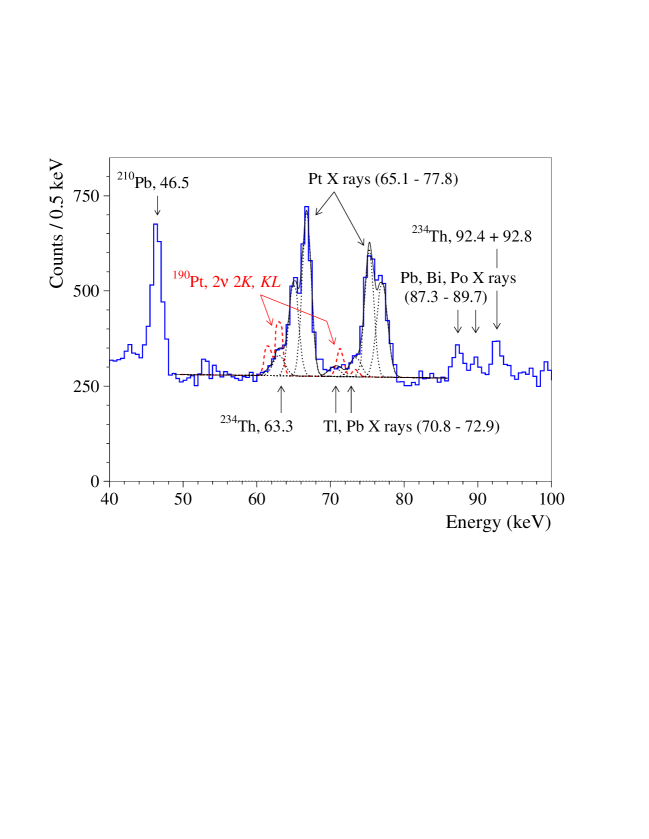
A cascade of X-rays and Auger electrons due to deexcitation of the Os electron shell with individual energies in the energy interval keV is expected in the and capture in 190Pt. However, the energies of the X-rays are very low, keV, and therefore heavily attenuated by the sample and also by the aluminium-windows of the HPGe-detectors. The Auger electrons avoid detection for the same reason. Thus, the response of the detector system to the and decays of 190Pt was built assuming the following energies and intensities of X-rays from the shell of the Os atom (only the X-rays with the intensities higher than 0.5% were considered): 61.5 keV (), 63.0 keV (), 71.1 keV (), 71.4 keV (), 73.4 keV () [39]. The detection efficiencies to the X-ray quanta were simulated by the EGSnrc code. To estimate values for the and decays, the energy spectrum taken with the Pt sample was fitted in the energy interval keV by the () distribution666The and distributions are almost similar in the region of fit. and a sum of several Gaussian functions to describe the 63.3-keV -ray peak of 234Th, X-ray peaks of Pt, Tl, Pb, Bi and Po present in the spectrum, plus a straight line to describe the continuous distribution. The result of the fit is shown in Fig. 5. Despite an empirical approach to build the background model, the quality of the fit is good: /n.d.f. (where n.d.f. is a number of degrees of freedom). The fit returned an area of the () distribution counts that indicates no evidence of the effect searched for. An excluded effect can be estimated by the simple Gaussian approach as counts at 90% C.L. Taking into account the Monte-Carlo simulated detection efficiency for the whole () effect (), the following half-life limits were obtained for the and capture in 190Pt:
Pt, g.s.g.s.) yr,
Pt, g.s.g.s.) yr.
The half-life limits, the energies of the X-ray quanta (), which were used to set the limits, the detection efficiencies () and values of are presented in Table 4777Only statistical errors originating from the data fluctuations were taken into account in the present study in the estimations of the half-life limits, systematic effects have not been included in the half-life limits evaluations., where also results of the previous experiment [28] are given for comparison. The limit for the decay half-life slightly exceeds the one reported in the previous work [28], while the limit for the capture is obtained for the first time.
| Transition | Level of | Experimental limit | ||||
| daughter | (keV) | (counts) | (yr) | |||
| nucleus (keV) | Present work | [28] | ||||
| 190Pt 190Os | ||||||
| g.s. | 0.0092 | 369 | ||||
| g.s. | 0.0047 | 369 | ||||
| 186.7 | 186.7 | 0.0093 | 39 | |||
| 558.0 | 558.0 | 0.0285 | 50 | |||
| 911.8 | 725.1 | 0.0393 | 31 | |||
| 1114.7 | 1114.7 | 0.0145 | 31 | |||
| 1,2 1326.9 | 1326.9 | 0.0491 | 81 | |||
| g.s. | 0.0500 | 44 | ||||
| g.s. | 0.0493 | 44 | ||||
| g.s. | 0.0484 | 62 | ||||
| 186.7 | 186.7 | 0.0072 | 39 | |||
| 558.0 | 558.0 | 0.0234 | 50 | |||
| 911.8 | 725.1 | 0.0361 | 31 | |||
| 1114.7 | 1114.7 | 0.0117 | 31 | |||
| Res. | 1,2 1326.9 | 1326.9 | 0.0488 | 81 | ||
| Res. | (0,1,2)+ 1382.4 | 1195.7 | 0.0497 | 42 | ||
| g.s. | 511 | 0.0953 | 134 | |||
| g.s. | 511 | 0.0942 | 134 | |||
| 186.7 | 511 | 0.0926 | 134 | |||
| 186.7 | 511 | 0.0922 | 134 | |||
| 198Pt 198Hg | ||||||
| () | 411.8 | 411.8 | 0.0414 | 31 | ||
| ∗ The limit in [28] was set for the transition to the 186.7 keV level of 190Os. | ||||||
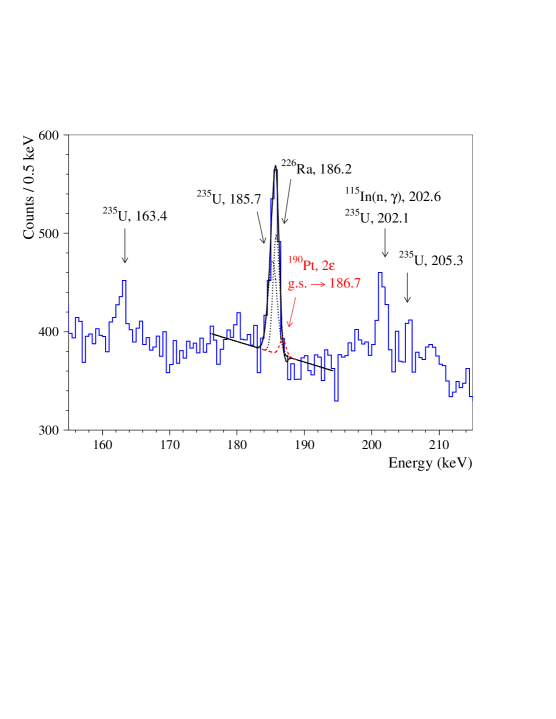
The double-electron capture in 190Pt can undergo to several excited levels of 190Os (see Fig. 1). In this case, in addition to X-rays cascade, -peaks at the energy of the excited level (in the transition to the first 186.7 keV excited level) and also at the energies of the transitions between the initial and final levels of the daughter are expected. To estimate value for a possible 186.7-keV peak area, the experimental spectrum was fitted in the energy interval keV by a model consisting of a straight line, peaks of 235U and 226Ra with energies 185.7 keV and 186.2 keV, respectively, and a Gaussian peak at 186.7 keV with the width fixed according to the formula (2) to describe the effect searched for. The fit returns a 186.7-keV peak area counts, that corresponds to counts following the recommendations [40]. A part of the energy spectrum gathered with the Pt sample in the vicinity of peak 186.7 keV expected in the decay of 190Pt to the 186.7 keV excited level of 190Os is presented in Fig. 6. The half-life limits for the transitions to higher excited levels of 190Os were obtained in a similar way. The limits are presented in Table 4.
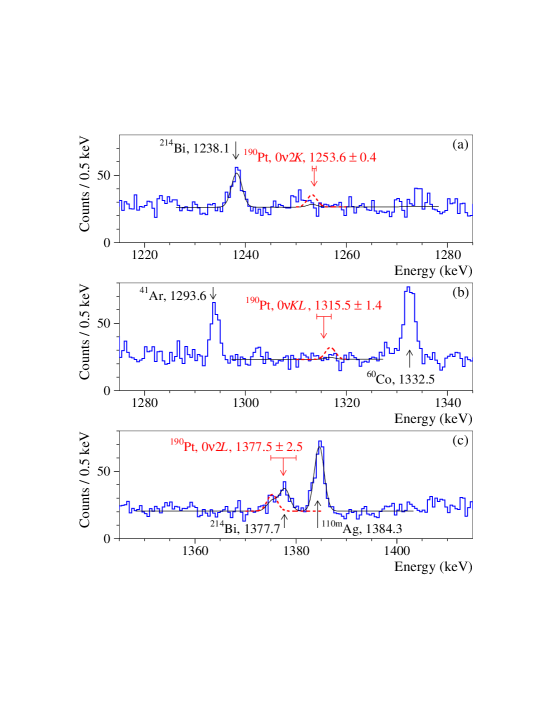
In the double-electron capture in 190Pt the energy excess is assumed to be emitted by bremsstrahlung -ray quanta with an energy . To estimate values of for the double-electron captures from and shells, the experimental spectrum was fitted in the regions of the expected peaks with energies (for the g.s. to g.s. transition) keV, keV and keV for the , , and captures, respectively. The variations of the expected peaks energy are due to the value uncertainty and different binding energies of the atomic shells. Thus, the energy of a peak searched for was free parameter of the fits within the variations. A straight line was taken to describe the continuous background. The background model included background peaks present in the energy intervals of the fits: 1238.1 keV of 214Bi (to estimate a for the decay), and 1377.7 keV of 214Bi plus 1384.3 keV of 110mAg (in the case of the capture). The results of the fits are shown in Fig. 7. The biggest peak areas were taken to derive the values for the peaks searched for (see Table 4).
Limits on the neutrinoless transitions to the excited levels of the daughter were set by using the values obtained to estimate the half-life limits for the two-neutrino processes. However, the detection efficiencies for the modes are slightly smaller due to the energy transfer to the bremsstrahlung -ray quanta (absent in the decay mode, where the energy is carried out by neutrinos).
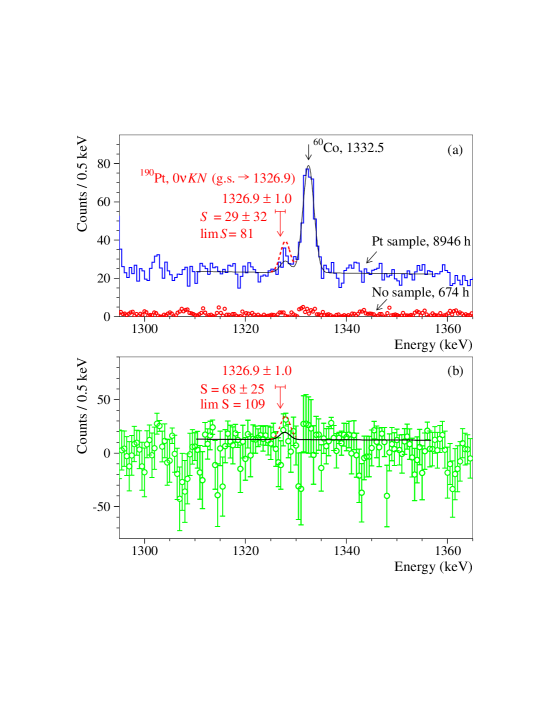
The transition in 190Pt to the 1,2 1326.9 keV excited level of 190Os is of special interest: the decay can be an exactly resonant, up to six orders of magnitude faster, if the degeneracy parameter eV. However, with the uncertainties of the decay energy ( keV [25]) and of the 1326.9-keV level energy ( keV [27]) the degeneracy parameter lies in the interval from keV to keV with a combined uncertainty keV, that is too big to make a clear conclusion about resonance enhancement of the transition. Nevertheless, development of experimental techniques to study the decay at, as much as possible, high sensitivity level is an important task. The energy spectrum gathered with the Pt sample was fitted in the energy interval keV to estimate a half-life limit on the decay. The background was described by a straight line and by a peak at 1332.5 keV (-peak of 60Co). The position of the peak searched for was bounded within keV, while the peak width was fixed as FWHM keV according to the formula (3). The fit (with n.d.f.) returned a peak area counts888If no bounds were set to the peak parameters, the energy of the peak was keV, the peak width FWHM keV, and the peak area counts.. Considering the peculiarity as a statistical fluctuation we have obtained counts. Taking into account the detection efficiency for -ray quanta with energy 1326.9 keV (), the resonant transition in 190Pt to the 1,2 1326.9 keV excited level of 190Os is limited as:
Pt, g.s. keV yr.
The energy spectrum in the region of interest, the result of the fit and excluded peak for the possible resonant transition in 190Pt to the 1,2 1326.9-keV excited level of 190Os is shown in Fig. 8 (a).
The bound on the transition to the 1326.9 keV level of 190Os is limited by 60Co background, that can be attributed entirely to the setup contamination (see Table 3) and not to the Pt sample. One can try to estimate a limit on the transition by analysis of the no-sample spectra subtracted from the data taken with the Pt sample, eliminating in such a way the 60Co background. A fit of the background-subtracted spectrum by a straight line (to describe the continuous background) plus a Gaussian peak with the bounded position and fixed width (the effect searched for) is shown in panel (b) of Fig. 8999A fit of the data with no bounds on the peak position and width returned the peak area counts and the peak position 1327.8(5) keV, however, with an abnormally small peak width FWHM keV.. However, statistical fluctuations in the background-subtracted spectrum are rather big due to a comparatively short time of the background measurement. As a result, the limit from the background-subtracted spectrum ( counts) is worse than the one from the sample-only spectrum. Nevertheless, the both approaches give comparable results providing a useful cross-check of the analysis.
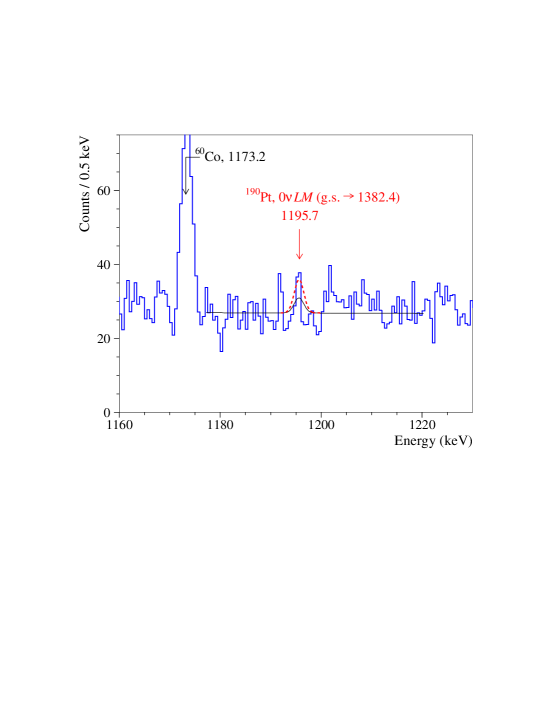
The transition of 190Pt to the 1382.4(2) keV level of 190Os can be characterized as “near” resonant one since the degeneracy parameter in this case is rather big keV. The estimation of half-life limit for the decay was performed by analysis of the experimental data in the vicinity of peak with energy 1195.7(2) keV emitted in the de-excitation of the 1382.4 keV level. The result of the data fit in the energy interval keV by a simple model constructed from a straight line and a Gaussian peak at 1195.7(2) keV with a fixed width is presented in Fig. 9.
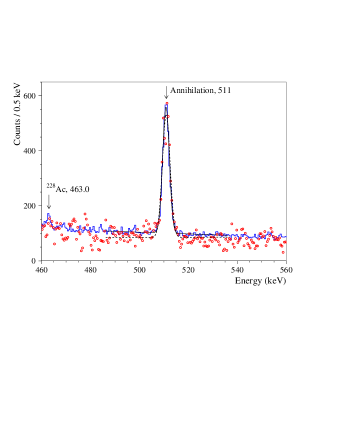
The annihilation peaks at 511 keV were analyzed in the data with (without) the Pt sample to estimate half-life limits for the electron capture with positron emission in 190Pt to the energetically allowed transitions to the ground state and to the excited 186.7 keV level of the daughter. A fit of the data with (without) the Pt sample gives the 511-keV peak area counts for measurement time 8946 h ( counts for 674 h) that leads to the difference: counts that results in counts. The energy spectrum taken with the Pt sample and the background spectrum in the vicinity of the 511 keV annihilation peak with the results of fits are shown in Fig. 10. The detection efficiencies are slightly different for the decays to the ground state and to the first 186.7 keV excited level of the daughter, as well as for the and modes of the decays. The obtained half-life limits are presented in Table 4.
The obtained limits on the possible double-beta processes in 190Pt are higher up to an order of magnitude than the limits set in the previous study [28]. Moreover, the expected peaks positions for the decays were far from the actual ones, taking into account a rather different value and much bigger uncertainty at the time when the experiment [28] was carried out. For this reason, the half-life limits for the , and captures can be considered as obtained for the first time.
However, the sensitivity of the present study is very far from theoretical estimations of the 190Pt decay probability. For instance, the calculations of the 190Pt half-life relative to the resonant transitions to the 1326.2 keV [1382.4 keV] level of 190Os are in the interval yr [ yr] (assuming the effective Majorana neutrino mass eV and the weak axial-vector coupling constant ) (see Table IV in [24]). Nevertheless, achievement of the sensitivity on the level of yr looks realistic taking into account the great progress in the ultralow-background HPGe [14] and low-temperature bolometers [13, 15, 16, 41] detection techniques, the experimental approaches that look the most promising for possible large-scale searches for the resonant decays.
3.3 Limit on the decay of 198Pt to the first excited level of 198Hg
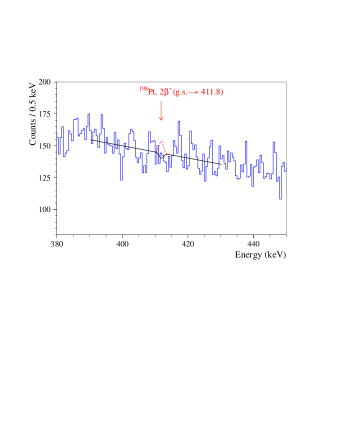
A limit on the transition of 198Pt to the 411.8 keV excited level of 198Hg was set by analysis of the energy spectrum measured with the Pt sample. The spectrum was fit in the energy interval keV by a straight line (to describe the continuous background) and a Gaussian function at 411.8 keV with the peak width determined by the formula (3) returning an effect area counts, that corresponds to counts (the energy spectrum in the region of the fit is presented in Fig. 11). Taking into account the detection efficiency ( both for the and modes of the decay), the following limit was obtained:
Pt, g.s. keV yr.
The limit is one order of magnitude higher than that set in the previous experiment [28]. Theoretical calculations for the decay of 198Pt to the ground state of the daughter are in the interval yr [42, 43]. Similar estimations give semiempirical formulae: yr [44] and yr [45]. A probability of the decay to the 411.8 keV excited level is expected to be several orders of magnitude lower due to a smaller value of the phase space factor and the spin change. The theoretical estimations of the decay of 198Pt to the ground state of 198Hg are much higher: yr [42, 46, 47, 48]101010The calculations were performed for the effective Majorana neutrino mass eV and ., while the transition to the 411.8 keV excited level of 198Hg is expected to be further suppressed. Thus, the sensitivity of the present experiment is rather far from the theoretical predictions for the two-neutrino mode of the decay, not to say for the neutrinoless process.
4 Summary and conclusions
A high-purity disk-shaped platinum sample with mass 148 g was measured in an ultralow background HPGe-detector -ray spectrometry system located 225 m underground at the HADES laboratory over 8946 hours aiming at searching for double-beta decay of 190Pt and 198Pt with emission of -ray quanta. The isotopic composition of the platinum sample has been measured with high precision using inductively coupled plasma mass spectrometry. No effect was observed but lower limits on the half-lives for the different channels and modes of the decays of 190Pt were set on the level of yr. A possible exact resonant transition to the 1,2 1326.9 keV level of 190Os is limited for the first time as yr. A new improved limit is set for the transition of 198Pt to the 411.8 keV excited level of 198Hg as yr. All the obtained limits exceed the previously obtained values up to one order of magnitude mainly thanks to a substantially bigger exposure ( kgday in the present work and kgday in [28]). However, the sample geometry was not optimised since it was an existing sample foreseen for another project. Thus, a further improvement of the present experiment sensitivity can be achieved by decrease of the sample thickness by production of thin disk with a diameter comparable to the detectors size.
The sensitivity of the experiment to the 190Pt decays, particularly to the potentially resonant transition to the 1326.9 keV level of 190Os, could be advanced by using platinum enriched in the isotope 190Pt, increasing the exposure and detection efficiency by utilization of thin samples and multi-crystal system of HPGe -ray detectors or low-temperature bolometers. However, such an experiment could be considered after more accurate determination of the 1326.9-keV level energy (presently known with a rather big uncertainty keV). Nevertheless, we realize that implementation of such an experiment is practically a rather difficult task, first of all due to the inaccessibility of methods for enrichment of platinum isotopes in the hundreds kilograms scale requested for a competitive experiment (in terms of the Majorana neutrino mass) even in a case of an exact resonant transition.
5 Acknowledgments
This work received support from the EC-JRC open access scheme EUFRAT under Horizon-2020, project number 2018-35375-4 (PLATOS). O.G. Polischuk and M.V. Romaniuk were supported in part by the project “Investigation of double-beta decay, rare alpha and beta decays” of the program of the National Academy of Sciences of Ukraine “Laboratory of young scientists” (the grant number 0120U101838). F.A. Danevich, D.V. Kasperovych and V.I. Tretyak were supported in part by the National Research Foundation of Ukraine Grant No. 2020.02/0011.
References
- [1] M. Goeppert-Mayer, Double Beta-Disintegration, Phys. Rev. 48 (1935) 512.
- [2] A. Barabash, Precise Half-Life Values for Two-Neutrino Double- Decay: 2020 Review, Universe 6 (2020) 159.
- [3] J. Schechter, J.W.F. Valle, Neutrinoless double- decay in SU(2)U(1) theories, Phys. Rev. D 25 (1982) 2951.
- [4] F.F. Deppisch, M. Hirsch, H. Päs, Neutrinoless double-beta decay and physics beyond the standard model, J. Phys. G 39 (2012) 124007.
- [5] S.M. Bilenky, C. Giunti, Neutrinoless double-beta decay: A probe of physics beyond the Standard Model, Int. J. Mod. Phys. A 30 (2015) 1530001.
- [6] S. Dell’Oro, S. Marcocci, M. Viel, F. Vissani, Neutrinoless Double Beta Decay: 2015 Review, Advances in High Energy Physics 2016 (2016) 2162659.
- [7] M.J. Dolinski, A.W.P. Poon, W. Rodejohann, Neutrinoless Double-Beta Decay: Status and Prospects, Annu. Rev. Nucl. Part. Sci. 69 (2019) 219.
- [8] A. Giuliani, A. Poves, Neutrinoless Double-Beta Decay, Advances in High Energy Physics 2012 (2012) 857016.
- [9] O. Cremonesi, M. Pavan, Challenges in Double Beta Decay, Advances in High Energy Physics 2014 (2014) 951432.
- [10] A. Gando et al. (KamLAND-Zen Collaboration), Search for Majorana Neutrinos Near the Inverted Mass Hierarchy Region with KamLAND-Zen, Phys. Rev. Lett. 117 (2016) 082503.
- [11] G. Anton et al. (EXO-200 Collaboration), Search for Neutrinoless Double- Decay with the Complete EXO-200 Dataset, Phys. Rev. Lett. 123 (2019) 161802.
- [12] S.I. Alvis et al. (Majorana Collaboration), Search for neutrinoless double- decay in 76Ge with 26 kg yr of exposure from the Majorana Demonstrator, Phys. Rev. C 100 (2019) 025501.
- [13] O. Azzolini et al., Final Result of CUPID-0 Phase-I in the Search for the 82Se Neutrinoless Double- Decay, Phys. Rev. Lett. 123 (2019) 032501.
- [14] M. Agostini et al. (GERDA Collaboration), Final Results of GERDA on the Search for Neutrinoless Double- Decay, Phys. Rev. Lett. 125 (2020) 252502.
- [15] D.Q. Adams et al. (CUORE Collaboration), Improved Limit on Neutrinoless Double-Beta Decay in 130Te with CUORE, Phys. Rev. Lett. 124 (2020) 122501.
- [16] E. Armengaud et al. (CUPID-Mo Collaboration), New Limit for Neutrinoless Double-Beta Decay of 100Mo from the CUPID-Mo Experiment, Phys. Rev. Lett. 126 (2021) 181802.
- [17] A.P. Meshik et al., Weak decay of 130Ba and 132Ba: Geochemical measurements, Phys. Rev. C 64 (2001) 035205.
- [18] M. Pujol et al., Xenon in Archean barite: Weak decay of 130Ba, mass-dependent isotopic fractionation and implication for barite formation, Geochim. Cosmochim. Acta 73 (2009) 6834.
- [19] A. Meshik et al., Weak Decay of Tellurium and Barium Isotopes in Geological Samples: Current Status, JPS Conf. Proc. 14 (2017) 020702.
- [20] Yu.M. Gavrilyuk et al., Indications of capture in 78Kr, Phys. Rev. C 87 (2013) 035501.
- [21] S.S. Ratkevich et al., Comparative study of the double-K-shell-vacancy production in single- and double-electron-capture decay, Phys. Rev. C 96 (2017) 065502.
- [22] XENON Collaboration, Observation of two-neutrino double electron capture in 124Xe with XENON1T, Nature 568 (2019) 532.
- [23] M. Hirsch et al., Nuclear structure calculation of , EC, and EC/EC decay matrix elements, Z. Phys. A 347 (1994) 151.
- [24] K. Blaum et al., Neutrinoless double-electron capture, Rev. Mod. Phys. 92 (2020) 045007.
- [25] M. Wang et al., The AME 2020 atomic mass evaluation (II). Tables, graphs and references, Chinese Phys. C 45 (2021) 030003.
- [26] J. Meija et al., Isotopic compositions of the elements 2013 (IUPAC Technical Report), Pure Appl. Chem. 88 (2016) 293.
- [27] B. Singh, J. Chen, Nuclear Data Sheets for A=190, Nucl. Data Sheets 169 (2020) 1.
- [28] P. Belli et al., First search for double- decay of platinum by ultra-low background HP Ge spectrometry, Eur. Phys. J. A 47 (2011) 91.
- [29] G. Audi, A.H. Wapstra, C. Thibault, The AME2003 atomic mass evaluation (II). Tables, graphs and references, Nucl. Phys. A 729 (2003) 337.
- [30] H. Xiaolong, K. Mengxiao, Nuclear Data Sheets for A=198, Nucl. Data Sheets 133 (2016) 221.
- [31] E. Andreotti et al., Status of underground radioactivity measurements in HADES (2011), Proceedings of 3rd International Conference on Current Problems in Nuclear Physics and Atomic Energy, Kyiv, 7-12 June 2010, Publishing Department of KINR, Ukraine. P. 601-605.
- [32] M. Hult, G. Lutter, G. Marissens, H. Stroh, JRC Serving policy and science at the HADES underground research facility - a casebook, EUR 30207 EN, Publications Office of the European Union, Luxembourg (2020). https://doi.org/10.2760/056079, JRC120311
- [33] J.S.E. Wieslander et al., The Sandwich spectrometer for ultralow-level -ray spectrometry, Appl. Radiat. Isot. 67 (2009) 731.
- [34] B. Majorovits, I. Abt, M. Laubenstein, O. Volynets, Aluminum as a source of background in low background experiments, Nucl. Instr. Meth. A 647 (2011) 39.
- [35] P. Belli et al., First observation of decay of 190Pt to the first excited level ( keV) of 186Os, Phys. Rev. C 83 (2011) 034603.
- [36] I. Kawrakow et al., The EGSnrc Code System: Monte Carlo simulation of electron and photon transport. Technical Report PIRS-701, National Research Council Canada (2017).
- [37] G. Lutter, M. Hult, G. Marissens, H. Stroh, F. Tzika, A gamma-ray spectrometry analysis software environment, Appl. Rad. Isot. 134 (2018) 200.
- [38] O.A. Ponkratenko et al., Event Generator DECAY4 for Simulating Double-Beta Processes and Decays of Radioactive Nuclei, Phys. At. Nucl. 63 (2000) 1282.
- [39] S.Y.F. Chu, L.P. Ekström and R.B. Firestone, WWW Table of Radioactive Isotopes, database version 1999-02-28 from URL http://nucleardata.nuclear.lu.se/toi/
- [40] G.J. Feldman, R.D. Cousins, Unified approach to the classical statistical analysis of small signals, Phys. Rev. D 57 (1998) 3873.
- [41] V. Alenkov et al., First results from the AMoRE-Pilot neutrinoless double beta decay experiment, Eur. Phys. J. C 79 (2019) 791.
- [42] A. Staudt et al., Calculation of and double-beta rates, Europhys. Lett. 13 (1990) 31.
- [43] M. Hirsch et al., Operator expansion method and nuclear decay, Phys. Rep. 242 (1994) 403.
- [44] B. Pritychenko, On Double-Beta Decay Half-Life Time Systematics, arXiv:1004.3280 [nucl-th].
- [45] X.J. Ren et al., Systematic law for half-lives of double- decay with two neutrinos, Phys. Rev. C 89 (2014) 064603.
- [46] J. Barea et al., Limits on Neutrino Masses from Neutrinoless Double- Decay, Phys. Rev. Lett. 109 (2012) 042501.
- [47] J. Barea et al., Nuclear matrix elements for double- decay, Phys. Rev. C 87 (2013) 014315.
- [48] F. Iachello et al., Recent results in double beta decay, Nucl. Part. Phys. Proc. 265 (2015) 25.