See pages 1-18 of PUSH_manuscript_arXiv.pdf

See pages 1 of SI.pdf
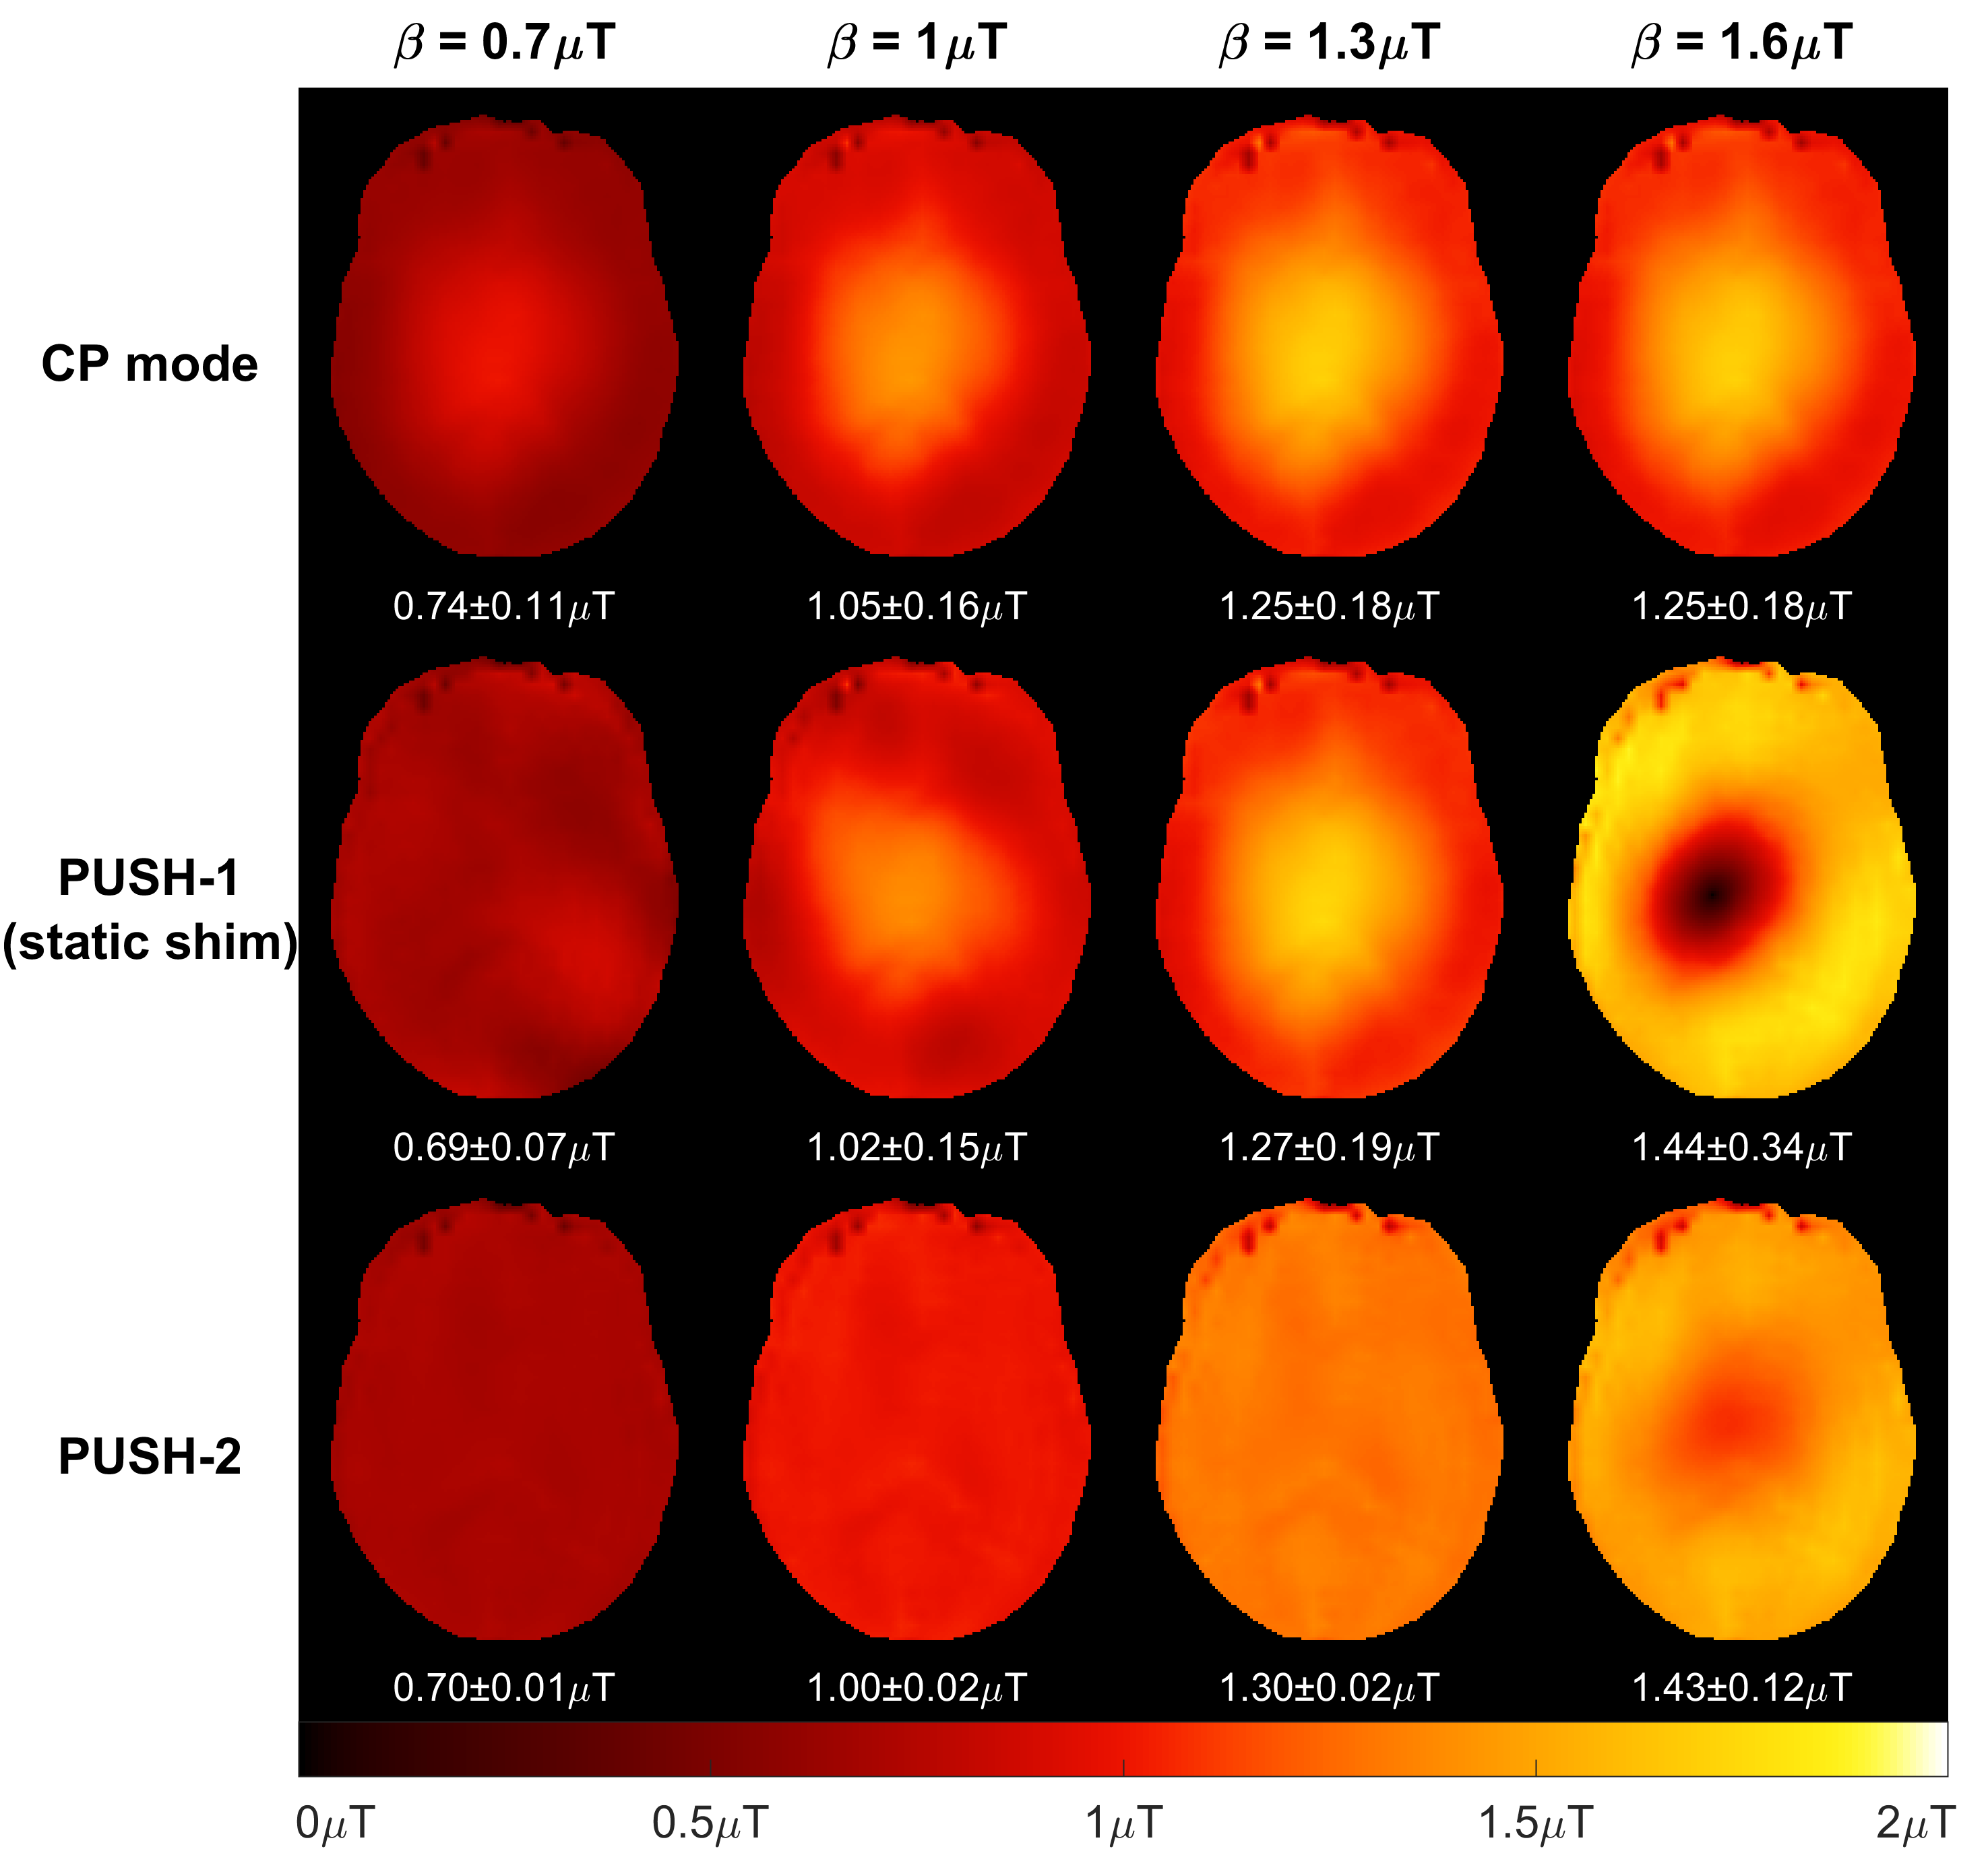
\animategraphics

[loop,controls=step,width=]1./B1rms_NRMSE_axial_slices-017

Supporting Information Figure S3: (A) NRMSE of B1rmssuperscriptsubscriptB1rms\mathrm{B_{1}^{rms}} for the axial slice positioned as indicated by the red line in the sagittal plane in (B), comparing CP mode with the optimized PUSH solutions using 1, 2 and 3 sub-pulses (curves for 2 and 3 sub-pulses are superimposed due to nearly identical performance). The gray area represents β𝛽\mathrm{\beta} where CP mode reached the local SAR limits and its voltage is capped. Slice 12 corresponds to the solution in Figure 2A. To navigate through different slices this document needs to be open on a JavaScript-supporting PDF viewer, such as Adobe Acrobat Reader.
Refer to caption
Supporting Information Figure S4: Corresponding 2D B1rmssuperscriptsubscriptB1rms\mathrm{B_{1}^{rms}} maps for the MTR maps in Figure 6. Different rows correspond to different pulses (top row: CP mode; middle row: PUSH-1; bottom row: PUSH-2) and columns correspond to different β𝛽\mathrm{\beta} (increasing from left to right). Below each is the mean ±plus-or-minus\pm standard deviation of B1rmssuperscriptsubscriptB1rms\mathrm{B_{1}^{rms}} over the white matter mask also used in Figure 6.

See pages 3-6 of SI.pdf