SN 2012ij: A low-luminosity type Ia supernova and evidence for continuous distribution from 91bg-like explosion to normal ones 111This paper includes data gathered with the 6.5 meter Magellan Telescopes located at Las Campanas Observatory, Chile.
Abstract
In this paper, we present photometric and spectroscopic observations of a subluminous type Ia supernova (SN Ia) 2012ij, which has an absolute -band peak magnitude = 17.95 0.15 mag. The -band light curve exhibits a fast post-peak decline with = 1.86 0.05 mag. All the and /-band light curves show a weak secondary peak/shoulder feature at about 3 weeks after the peak, like some transitional subclass of SNe Ia, which could result from an incomplete merger of near-infrared (NIR) double peaks. The spectra are characterized by Ti ii and strong Si ii 5972 absorption features that are usually seen in low-luminosity objects like SN 1999by. The NIR spectrum before maximum light reveals weak carbon absorption features, implying the existence of unburned materials. We compare the observed properties of SN 2012ij with those predicted by the sub-Chandrasekhar-mass and the Chandrasekhar-mass delayed-detonation models, and find that both optical and NIR spectral properties can be explained to some extent by these two models. By comparing the secondary maximum features in and bands, we suggest that SN 2012ij is a transitional object linking normal SNe Ia to typical 91bg-like ones. From the published sample of SNe Ia from the (CSP-II), we estimate that the fraction of SN 2012ij-like SNe Ia is not lower than 2%.
1 Introduction
Owing to high luminosities and relatively uniform light curves, SNe Ia have been used to estimate the Hubble constant (e.g., Hamuy et al. 1996; Sandage et al. 2006; Riess et al. 2007, 2016) and to determine the expansion history of the universe (Riess et al., 1998; Perlmutter et al., 1999; Betoule et al., 2014). Some empirical relations found between their peak luminosities and light/color-curve shapes (e.g., Phillips 1993; Guy et al. 2005; Wang et al. 2005, 2006; Jha et al. 2007) make them good distance indicators. It is widely accepted that SNe Ia arise from thermonuclear explosions of carbon-oxygen white dwarfs (C-O WDs) in close binary systems. Two popular scenarios have been proposed for the companion star of the exploding WD. Candidate companion stars could be a non-degenerate object (i.e., main sequence, red-giant, subgiant star, or helium star), dubbed as single degenerate (SD) system (Whelan & Iben, 1973), or another WD, dubbed as the double degenerate (DD) scenario (Iben & Tutukov, 1984; Webbink, 1984). Both SD (Patat et al., 2007; Sternberg et al., 2011; Dilday et al., 2012; Cao et al., 2015; Hosseinzadeh et al., 2017; Dimitriadis et al., 2019; Shappee et al., 2019; Li et al., 2019) and DD (Li et al., 2011a; Schaefer & Pagnotta, 2012; Edwards et al., 2012; Santander-García et al., 2015) systems are supported by some observations, and it seems that both models are required to explain the observed diversity among SNe Ia (Wang & Han, 2012; Wang et al., 2013b; Maoz et al., 2014; Wang, 2018).
Most of SNe Ia (70%) display relatively uniform properties in photometric and spectroscopic evolution, which have been called Branch-normal ones (Branch et al., 1993; Filippenko, 1997). In contrast to the Branch-normal SNe Ia, some SNe Ia are classified into different sub-classes due to different photometric or spectroscopic evolution. The over-luminous group like 91T SNe Ia are characterized by broad light curves, relatively weak Si ii 6355 Å and prominent Fe ii/iii absorption features around the maximum light (Filippenko et al., 1992a; Phillips et al., 1992; Ruiz-Lapuente et al., 1992). On the contrary, the sub-luminous SNe Ia like SN 1991bg showed fast-evolving light curves, prominent absorptions of intermediate-mass elements (Filippenko et al., 1992b; Leibundgut et al., 1993). The mass of of 56Ni created in explosion of 91bg-like SNe was much lower than that of normal events (Mazzali et al., 1997; Maoz et al., 2014). Due to their low luminosities, the 91bg-like subclass of SNe Ia was only 3% in a magnitude-limited SNe Ia sample (Li et al., 2011b). Transitional objects like SNe 1986G(Hough et al., 1987; Phillips et al., 1987, 1999) and 2011iv(Gall et al., 2018) show photometric and spectroscopic properties inbetween the normal and 91bg-like sub-classes of SNe Ia, which may appear at least as frequent as the 91bg-like objects (González-Gaitán et al., 2011), suggested a continuous distribution from normal to 91bg-like SNe Ia. There is another subclass of low luminosity SNe Ia like SN 2002es are similar to 91bg-like and 86G-like SNe Ia which share some common spectroscopic features as the 91bg-like objects but it has much wider light curves in comparison (Taubenberger, 2017). Several classification schemes, based on the velocity evolution (or gradient) of Si ii 6355 (Benetti et al., 2005), the pseudo-Equivalent Width (pEW) of Si ii 6355 and Si ii 5972 absorptions (Branch et al., 2006; Burrow et al., 2020) or the Si ii velocity measured at around the maximum light (Wang et al., 2009a), have been proposed for SNe Ia. The above three classifications partially overlap with each other. For example, the cool subclass (Branch et al., 2006), characterized by low temperature and strong Si ii 5972 absorption, has a significant overlap with the 91bg-like subclass.
Some observational characteristics were used to distinguish 91bg-like SNe. Photometrically, 91bg-like SNe Ia lack prominent secondary maximum features in near-infrared (NIR) bands, likely due to an early recombination of iron-group elements (IGE) (Taubenberger, 2017). Spectroscopically, 91bg-like SNe display strong Si ii 5972 and prominent Ti ii lines, suggestive of low photospheric temperatures (Nugent et al., 1995). The observed differences between 91bg-like SNe Ia and the normal ones could be attributed to different progenitor scenarios and/or explosion channels (Taubenberger, 2017; Polin et al., 2019). Some studies favored the sub- explosion model (Maeda & Terada, 2016), while some preferred the delayed-detonation model (Höflich et al., 2002).
Due to the lack of a large well-observed sample, the progenitor properties and explosion mechanisms of sub-luminous 91bg-like SNe Ia still remain controversial. One of the well-observed sample is SN 1999by, for which analysis of the NIR spectra suggests that the explosion is consistent with the delayed detonation model (Höflich et al., 2002). Polarization observations suggested that the explosion of SN 1999by had an axis of symmetry, which could be explained by rapid rotation of the progenitor WD or an explosion during the merger process of double WDs (Howell et al., 2001). Moreover, Blondin et al. (2018) also used a sub-Chandrasekhar-mass (sub-) model of pure central detonation of a C-O WD to successfully reproduce the observed properties of SN 1999by.
One probable explosion model for 91bg-like SNe Ia is the violent merger of WD binary. In this scenario, the lighter companion is disrupted during the merging process and accreted by the massive WD. During the merging process, the accretion stream hits the surface of the WD, causing a high temperature that triggers carbon detonation (Pakmor et al., 2010, 2012). This scenario should be recognized as a sub- explosion according to the density of the primary WD when it is ignited (Maeda & Terada, 2016), though the total mass exceeds the Chandrasekhar mass (Sato et al., 2015).
Another possible channel is the double detonation model in a binary system where the companion is a helium star or contains some helium. The primary C-O WD accretes the helium from the companion and ignites the helium shell, then the core explosion is triggered by the helium detonation on the surface. This channel does not require a Chandrasekhar mass for the exploding WD (Fink et al., 2010). It is also called as sub- helium detonation model. As a sub- explosion, the results predicted by double detonation model are consistent with the observations of sub-luminous SNe Ia with fast-evolving light curves (Woosley & Weaver, 1994; Höflich & Khokhlov, 1996; Ruiz-Lapuente et al., 1993).
Besides the sub- explosions, the delayed-detonation model is also a promising scenario. In this scenario, the initial deflagration transforms into a supersonic detonation at some point, when the explosion can produce suitable nucleosynthesis for most SNe Ia (Khokhlov, 1991; Woosley, 1990; Höflich & Khokhlov, 1996; Iwamoto et al., 1999; Höflich et al., 2002, 2017).
In this paper, we present photometric and spectroscopic observations of the subluminous, peculiar type Ia SN 2012ij. Observations and data reductions are described in section 2. In section 3, we present the light/color curve evolution as well as the reddening estimation. Section 4 describes the spectroscopic evolution in both optical and NIR bands. The origin of weak NIR secondary peak and the comparison with different models are discussed in section 5. We summarize in section 6.
2 Observations and Data reduction
SN 2012ij was discovered on December 29.78 UT 2012 by the 0.6-m Schmidt telescope in the course of the THU-NAOC222National Astronomical Observatories, Chinese Academy of Sciences Transient Survey (TNTS; Zhang et al. 2015), with an unfiltered magnitude of about 18.0 mag. The coordinates of this object are = 11h40m15s.84, = +17∘2722.2 (J2000.0), located 4.0 west and 4.0 south of the center of an S0/a galaxy CGCG 097-050 (Hakobyan et al., 2016). The spectrum of the host galaxy from Sloan Digital Sky Survey (SDSS) shows no significant H emission. Fitting the spectrum with Firefly (Wilkinson et al., 2017), we obtained the stellar mass as , the age as 3.73 Gyr, and the metallicity of the stellar populations as [Z/H] = 0.16, respectively. With the passive model for passive galaxies Maraston et al. (2009), the model fitting gave the stellar mass as and the age as 4.25 Gyr, respectively. Both model fittings indicate that the host galaxy of SN 2012ij is a passive galaxy, which is similar to host galaxies of most 91bg-like SNe Ia (Li et al., 2011b).
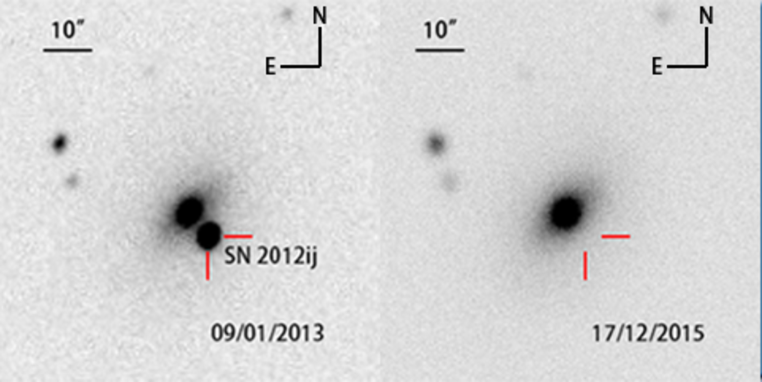
The finding chart of this SN is shown in Figure 1. The redshift of the host galaxy is = 0.011 (Lu et al., 1993), corresponding to a distance modulus of = 33.54 0.15 mag 333Given by NASA/IPAC Extragalactic Database (NASA/IPAC Extragalactic Database (2019), NED), assuming the cosmology parameters = 0.308 and H0 = 67.8 (Virgo Infall only).. A spectrum taken at a few days after the discovery revealed that SN 2012ij was a sub-luminous type Ia SN at about one week before the maximum light (Wang et al., 2013a), with Si II velocity being about 11,400 km s-1 inferred from Si ii 6355 absorption feature.
2.1 Photometry
The optical photometry () of SN 2012ij was mainly collected by the 0.8-m Tsinghua-NAOC Telescope (TNT444This telescope is co-operated by Tsinghua University and NAOC.) located at Xinglong Observatory of NAOC. This telescope is equipped with a 1340 1300 pixel back-illuminated CCD, with a field of view (FoV) of 11.5 11.2 (pixel size 0.52 pixel-1) (Wang et al., 2008; Huang et al., 2012). The TNT instrumental magnitudes were obtained using an ad hoc pipeline (based on the IRAF 555IRAF, the Image Reduction and Analysis Facility, is distributed by the National Optical Astronomy Observatories, which are operated by the Association of Universities for Research in Astronomy (AURA), Inc., under cooperative agreement with the National Science Foundation. DAOPHOT package; Stetson 1987). The instrumental magnitudes of TNT were calibrated by the Sloan catalogues converted to with the relation proposed by Chonis & Gaskell (2008). SN 2012ij were also monitored in bands by the CSP-II (Phillips et al., 2019; Hsiao et al., 2019)) with the Swope 1-m telescope at the Las Campanas Observatory (LCO). The data was reduced and converted into standard system following that described in Krisciunas et al. (2017) and Phillips et al. (2019). The final flux-calibrated magnitudes of SN 2012ij are presented in Table 1.
As the flux contamination caused by the host galaxy could not be neglected, the template images of SN 2012ij, taken at almost 3 years after the outburst, were used to perform the image subtraction before we conducted the photometry.
2.2 Spectroscopy
After the discovery, extensive optical and NIR follow-up observations were conducted for SN 2012ij on several facilities. A total of 14 spectra were obtained for SN 2012ij, including 4 optical spectra from the Xinglong 2.16-m Telescope (XLT; Fan et al. 2016), 3 optical spectra from Lijiang 2.4-m Telescope(LJT; Fan et al. 2015; Wang et al. 2019), 4 optical spectra from LCO du Pont and Nordic Optical Telescope (NOT), and 3 NIR spectra from Folded-port Infrared Echellette (FIRE) mounted on the Magellan Baade Telescope (CSP-II). A journal of spectroscopic observations is listed in Table 2.
We reduced our optical spectra using the standard IRAF routines, including corrections for bias, flat field, and removal of cosmic rays. The wavelength of the spectra was calibrated by arc lamp spectra, and the flux was calibrated by standard star, which were obtained on the same night. For all of the spectra, the atmospheric extinction was also corrected using mean extinction curves obtained at the corresponding observatories. The NIR spectra were reduced using the IDL pipeline firehose (Simcoe et al., 2013), which was specifically designed for the reduction of FIRE data and was described in Hsiao et al. (2019).
3 Photometric Properties
3.1 Optical Light Curves
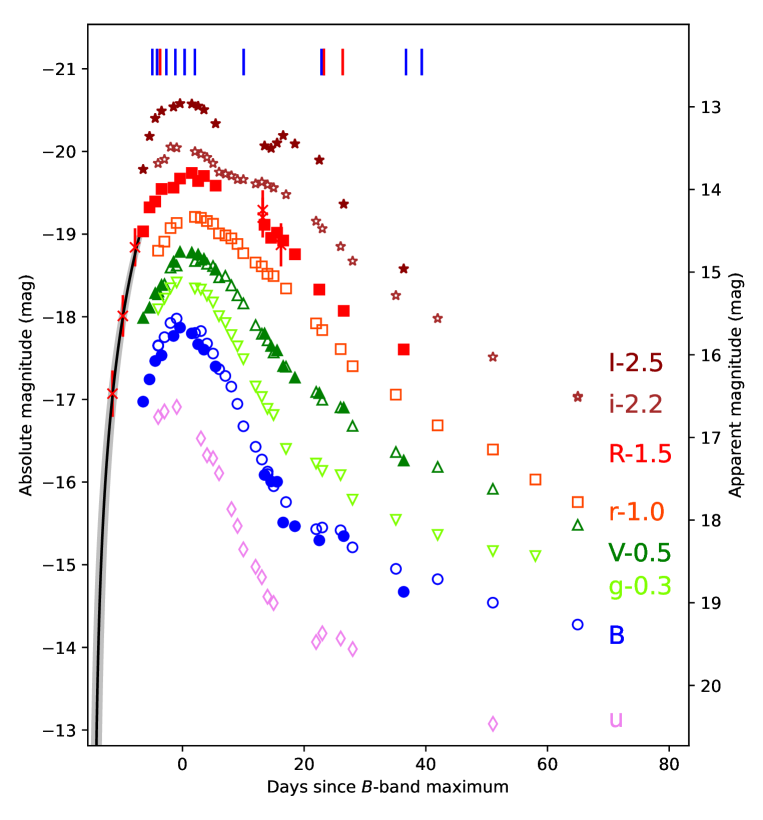
The light curves of SN 2012ij are shown in Figure 2. These multi-band light curves were used to determine the epoch of maximum light as well as other important light curve parameters by template fitting. We found that SN 2012ij reached the -band maximum light on MJD 56302.3 0.3, with = 15.67 0.02 mag and the post-maximum decline rate (Phillips, 1993) as 1.86 0.05 mag, which was estimated in the rest frame of the SN.
The unfiltered light curve of SN 2012ij obtained by the 0.6-m Schmidt telescope is also shown in Figure 2, and the corresponding magnitudes are listed in Table 3. The unfiltered magnitudes were calibrated by the -band magnitudes from the Positions and Proper Motions Star Catalogue Extended (PPMX; Röser et al. 2008), with a systematic uncertainty of about 0.2 - 0.3 mag (Li et al., 2003). The explosion date was estimated as MJD 56288.2 0.9 by fitting the first three unfiltered data points with the fireball (i.e., L t2) model (Riess et al., 1999), which gives the rise time as 14.6 0.9 days 666Given by Monto-Carlo simulation.. This rise time is comparable to that of some 91bg-like SNe Ia (i.e., 13 - 15 days; Taubenberger et al. 2008). The main photometric parameters of SNe 2012ij are listed in Table 4. For the subsequent discussions, the phases are referred with respect to the -band maximum.
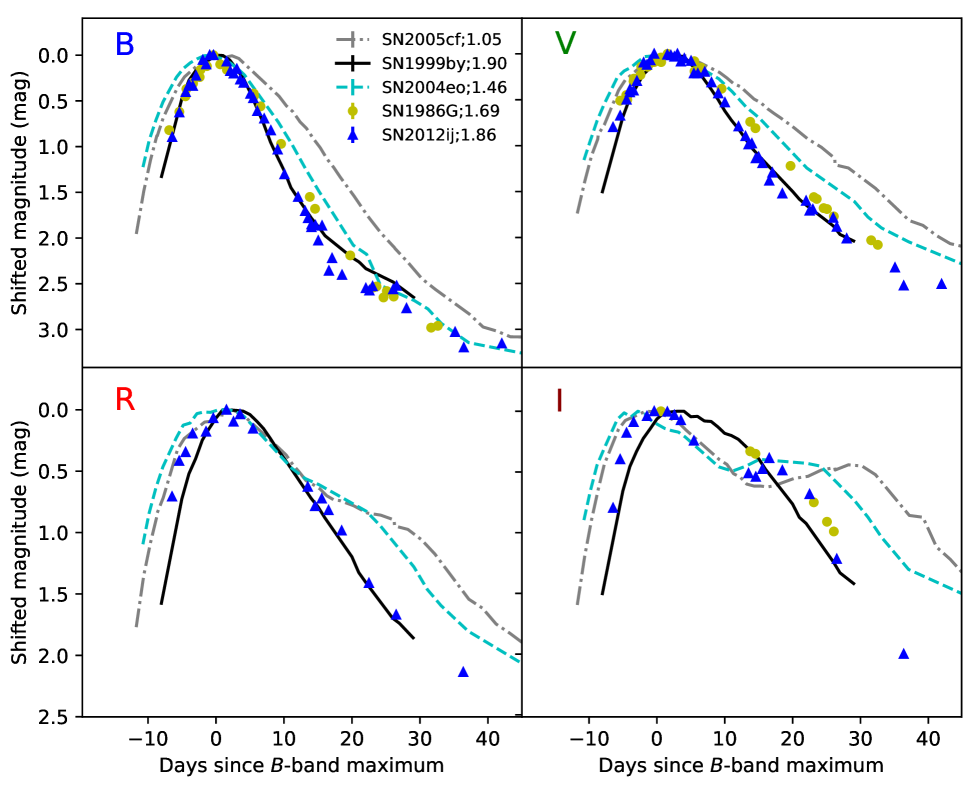
In Figure 3, we compare the light curves of SNe 2012ij with those of some normal and sub-luminous SNe Ia, including SNe 1986G (Hough et al., 1987; Phillips et al., 1987, 1999), 1999by (Garnavich et al., 2004; Ganeshalingam et al., 2010), 2004eo (Pastorello et al., 2007), and 2005cf (Wang et al., 2009b). One can see that the light curves of SN 2012ij are similar to those of some 91bg-like SNe in bands in terms of the morphology except in , where SN 2012ij clearly shows post-peak shoulder/bump feature, while such a feature is usually absent in 91bg-like objects (e.g., SNe 1999by, 2006mr, see Contreras et al. 2010). Moreover, SN 2012ij arrived at the - band primary peak 3 days earlier than SN 1999by relative to their - band peaks. We will discuss the NIR features in detail in section 5.1.
3.2 The Reddening and Color Curves
The Galactic reddening toward SN 2012ij was estimated as = 0.073 (Schlafly & Finkbeiner, 2011). Since this SN locates in the outer part of the host galaxy and the SN spectra did not show obvious absorption of Na i D, the host-galaxy reddening was thus assumed to be negligible. Taking the Galactic reddening into account and adopting RV = 3.1 (Cardelli et al., 1989; O’Donnell, 1994), the -band peak absolute magnitude of SN 2012ij was estimated as = 17.95 0.15 mag.
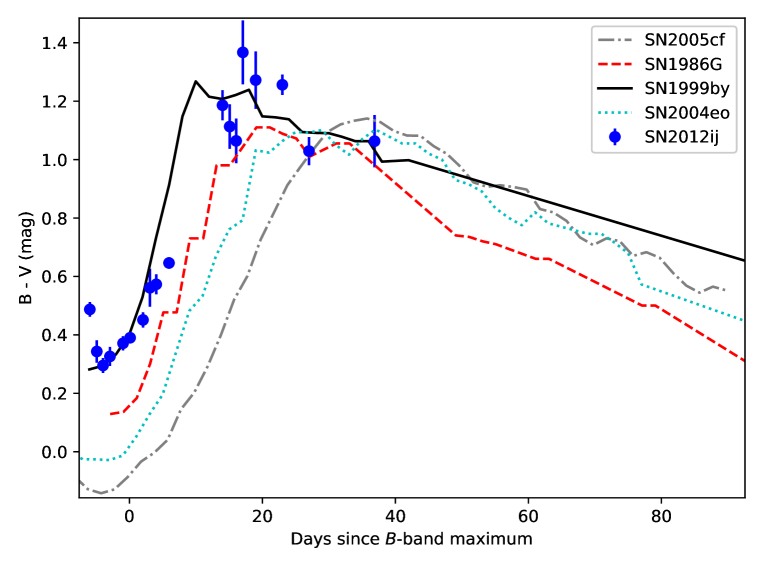
In Figure 4, we compare the color curve of SN 2012ij with those of 91bg-like and normal SNe Ia. One can find that SN 2012ij has systematically much redder colors than normal SNe Ia and it reached the reddest color at about 10 days earlier than the latter. After t 35 days from the maximum, their color curves became indistinguishable.
The color-stretch factor, defined as , is proportional to the epoch when the color reaches the reddest value. Burns et al. (2014) suggested that this factor was better than , especially when dealing with the fast-evolving 91bg-like SNe. The reason is that the -band light curves of fast decliners tend to flatten earlier than t +15 days. Adopting the color curve of SN 1999by as a template, we obtained = 0.53 for SN 2012ij.
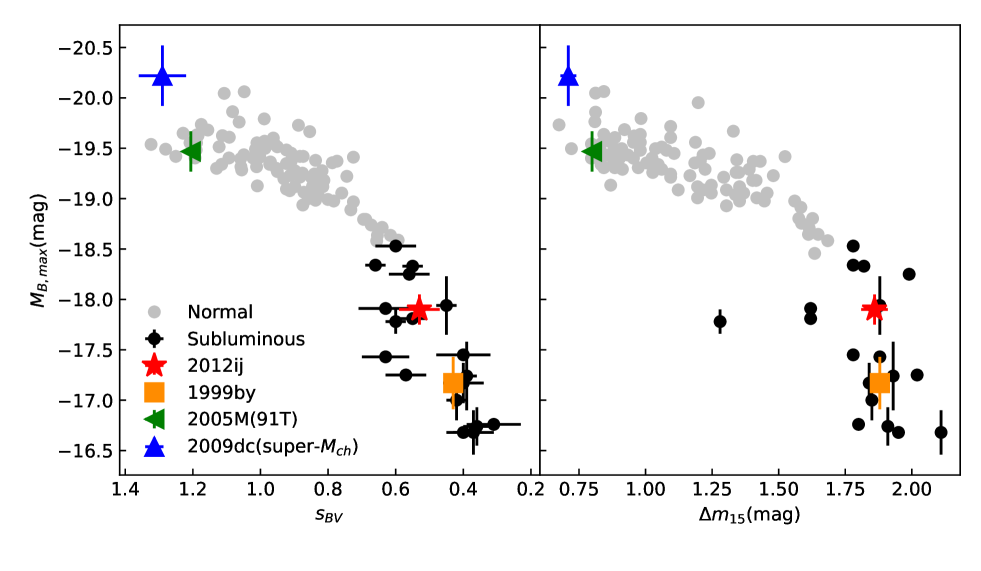
A larger sample, including sub-luminous and over-luminous SNe Ia collected through (shown in Table SN 2012ij: A low-luminosity type Ia supernova and evidence for continuous distribution from 91bg-like explosion to normal ones 111This paper includes data gathered with the 6.5 meter Magellan Telescopes located at Las Campanas Observatory, Chile.) and those released in Krisciunas et al. (2017), are used to study the distribution of color-stretch factors. In Figure 5, we present the correlations between their absolute -band peak magnitudes, stretch factors and decline rate . One can see that SN 2012ij locates inbetween normal SNe Ia and 91bg-like objects, favoring for a continuous distribution between normal and 91bg-like SNe Ia instead of two totally different populations.
3.3 Bolometric Light Curves
The quasi-bolometric light curves could be constructed by -band photometry. The quasi-bolometric flux was derived by trapezoidal integration of flux densities in bands according to response curves of different filters, which covers the emission from 3000Å to 9700Å, as shown in Figure 6.
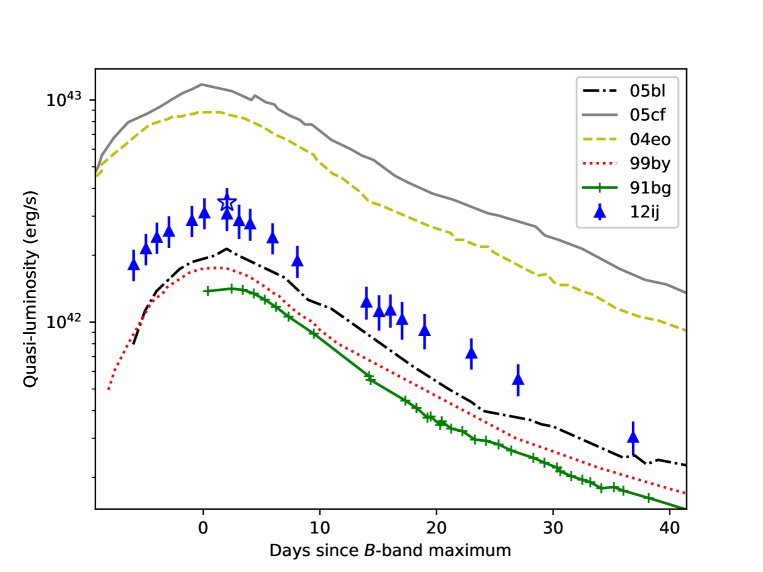
Comparing the quasi-bolometric light curves with those of sub-luminous SNe 1991bg (Leibundgut et al., 1993; Turatto et al., 1996), 1999by (Garnavich et al., 2004), 2005bl (Taubenberger et al., 2008), a transitional SN 2004eo (Pastorello et al., 2007) and a normal SN Ia 2005cf (Wang et al., 2009b), we find that SN 2012ij is quite similar to SN 2005bl. After taking into account the UV and NIR corrections, which are based on the swift UV photometry (, , ) from ‘ ’ Optical/Ultraviolet Supernova Archive (SOUSA; Brown et al. 2014) and NIR spectra taken near the maximum light, we estimate that SN 2012ij reached its maximum luminosity at = 3.46 ( 0.52) 1042 erg s-1. According to the radioactive decay law put forward by Arnett (1982), adopting the rise time tr = 14.6 days, and the ratio of bolometric to radioactive luminosities = 1.0 for SN 2012ij (Nugent et al., 1995; Höflich & Khokhlov, 1996; González-Gaitán et al., 2012), the nickel mass of SN 2012ij is estimated as = 0.14 0.03 , which is close to some 91bg-like SNe Ia ( 0.07 ; Mazzali et al. 1997).
4 Spectroscopic Properties
4.1 Evolution of the Spectra
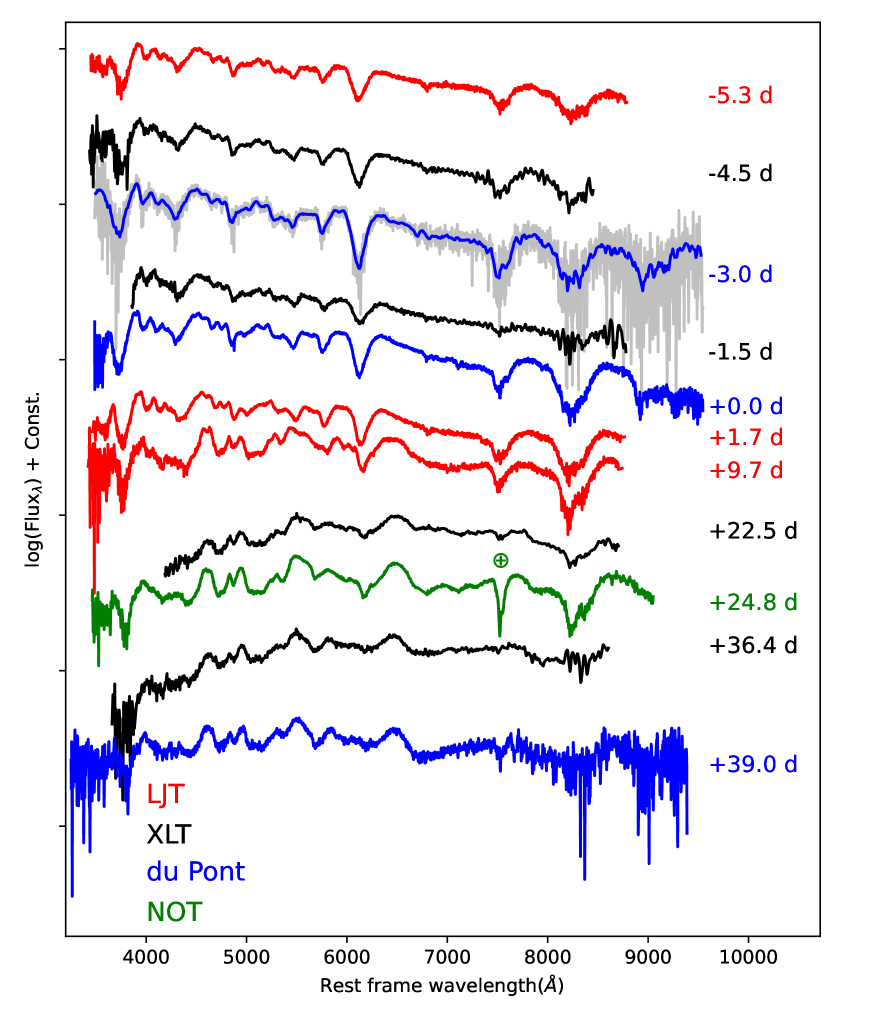
In Figure 7, a total of 11 optical spectra are shown for SN 2012ij, spanning the phases from t 5 days to t +39 days relative to the -band maximum light. One can see that SN 2012ij shares some common evolutionary features with the sub-class of 91bg-like SNe Ia. The pre-maximum spectra showed prominent P-Cygni features of intermediate-mass elements (IME), including Si ii, S ii, Ca ii and Mg ii. The Ti ii absorption feature, which is characteristic of the 91bg-like subclass, is also prominent in SN 2012ij, confirming its classification as a subluminous SN Ia. Moreover, the Si ii 5972 and the O i 7774 absorption features were found to be much stronger than normal SNe Ia at similar epochs. After the maximum light, the continuum became flat quickly, which is consistent with the color-curve evolution. The S ii lines almost disappeared at about one week after -band maximum, and the Si ii 5972 absorption feature became undetectable at t +20 days. The Si ii 6355 absorption line was still detectable in the t +25d spectrum, but it became invisible in the t +36d spectrum. On the contrary, some other spectral features like ‘Ti trough’ and IGE lines around 5000 Å tended to become stronger after the maximum light.
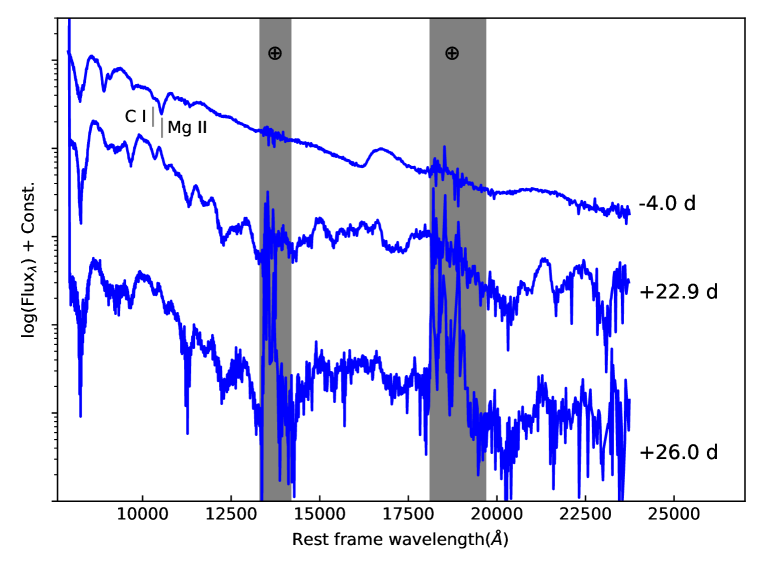
The NIR spectra of SN 2012ij, obtained at t 4, +23, and +26 days relative to the B-band maximum, are displayed in Figure 8. At t 4d, the spectrum was characterized by some absorption lines of intermediate-mass elements (IMEs) like Mg ii, C i, O i and Si ii; the velocity inferred from C i 1.0693 m absorption is about 10900 300 km s-1, which is significantly lower than that of SN 1999by ( 13000 km s-1). The strength of C i absorption is weaker than that of SN 1999by (Höflich et al., 2002) but a bit stronger than those of the transitional objects iPTF13ebh (Hsiao et al., 2015) and SN 2015bp (Wyatt et al., 2021). All these supernovae with C i 1.0693 m absorption features are subluminous, which could be due to that neutral carbon only exists in low-luminosity SNe Ia. The existence of C i 1.0693 m helps constrain the explosion models, which will be discussed in section 5.3. At t 3 weeks after the peak, the IME lines almost disappeared in the spectra of SN 2012ij and the features were dominated by Ca ii, Fe ii, Co ii and Ni ii lines with the cooling of the photosphere, SN 1999by displayed similar spectral evolution at this similar phase (Höflich et al., 2002). At t +23 days, prominent iron-peak emission in -band were detected, of which the blue-edge velocity can determine the outer location of Ni. Following the method described by Ashall et al. (2019a), we measured of SN 2012ij as 5400 400 km s-1 at t +23d, which is comparable to that of the transitional object iPTF13ebh at similar phase.
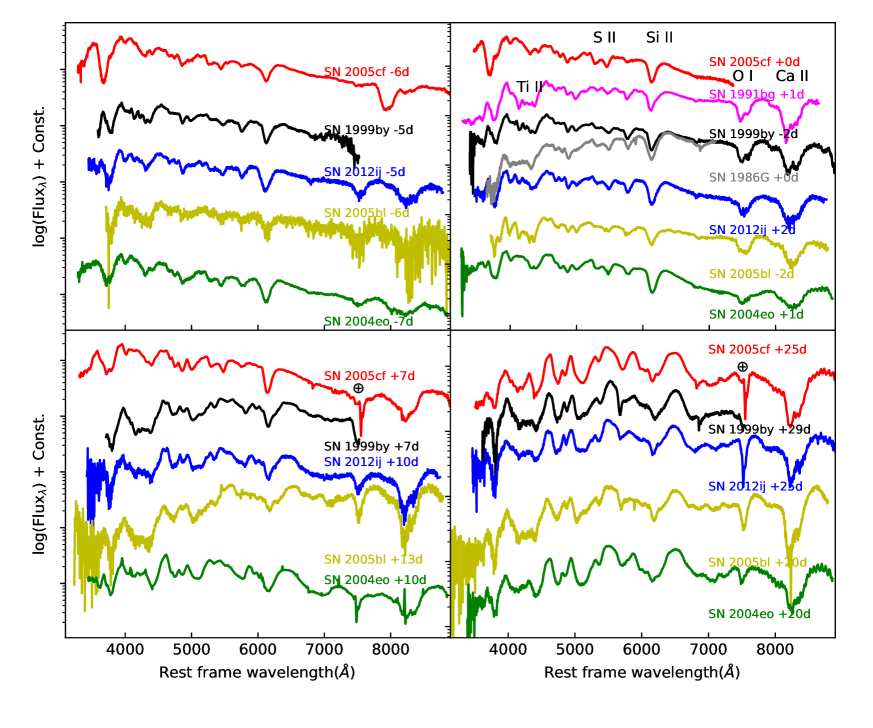
Figure 9 shows detailed comparisons of the optical spectra of SN 2012ij with other sub-luminous and normal SNe Ia at several epochs (i.e. at t 5d, +2d, +10d and +25days). The comparison sample include SNe 1986G (Hamuy et al., 2002), 1991bg (Leibundgut et al., 1993; Turatto et al., 1996), 1999by (Garnavich et al., 2004), 2004eo (Pastorello et al., 2007), 2005bl (Taubenberger et al., 2008) and 2005cf (Wang et al., 2009b). Like SNe 1986G and 1999by, SN 2012ij did not exhibit a strong Ti absorption trough near the maximum light. After t +10d, SN 2012ij showed significant absorption features of Ti ii and other IGE. At each epoch in comparison, one can see that SN 2012ij showed close resemblance to SN 1999by in both overall shapes and strength of characteristic spectral lines.
4.2 Optical Spectroscopic Properties
The pEWs of absorption features near 5750 Å and 6100 Å, attributed to the Si ii 5972 and the Si ii 6355, respectively, have been used to classify SNe Ia (Branch et al., 2006, 2009). For SN 2012ij, the pEWs of these two spectral features were measured as 54 3 Å and 109 4 Å, respectively. These two values are quite similar to those derived from SN 1999by (i.e., pEW(Si ii 5972) = 53 Å, pEW(Si ii 6355) = 107 Å; Blondin et al. 2012), suggesting that SN 2012ij belongs to the ‘cool’ subclass.
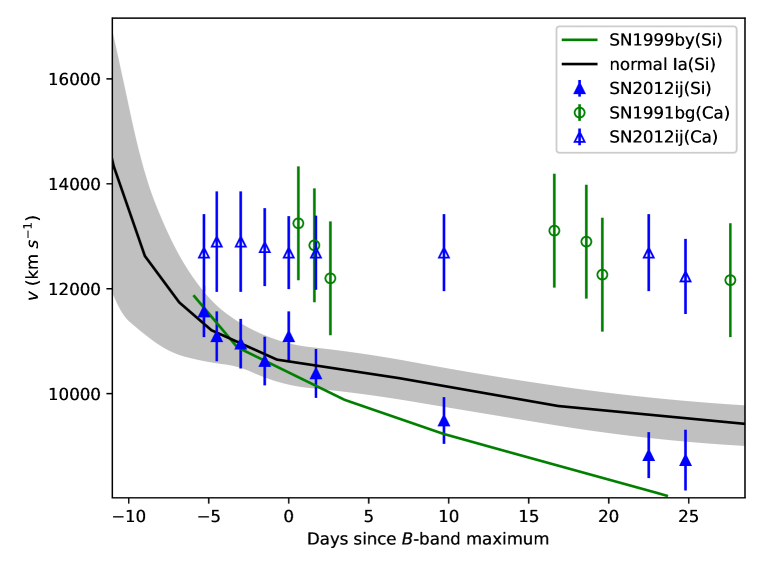
For SNe Ia, the Si ii 6355 absorption feature is often used to infer the photospheric velocity, which was measured as = 10,500 300 km s-1 for SN 2012ij around the -band maximum light. We show the velocity evolution of SN 2012ij and other SNe Ia in Figure 10, where one can see that SN 2012ij and SN 1999by share similar photospheric velocity near maximum light and velocity evolution until t 20 days. According to the definition by Benetti et al. (2005), the velocity gradient measured for SN 2012ij is 87 8 km s-1 d-1, which is close to other 91bg-like SNe (i.e., SN 1997cn; 83 10 km s-1 d-1 Benetti et al. 2005).
Besides Si ii 6355, we also used Ca ii triplet absorption feature near 8583 Å to estimate the ejecta velocity . The velocity inferred from Ca ii triplet of SNe 2012ij is higher than Si ii and it varies slowly with time since t 5 days, which is similar to that seen in other 91bg-like SNe (Folatelli et al., 2013). No detached high-velocity features of Si ii, Ca ii or O i, as described in Zhao et al. (2015, 2016), were detected in SN 2012ij.
5 Discussion
5.1 Transitional Light Curve Properties
SN 2012ij is a fast decliner with = 1.86 mag and its -band primary maximum occurred 0.06 days before the -band maximum, which matches properties of transitional SNe Ia (Hsiao et al., 2015). Unlike 91bg-like SNe, prominent secondary maximum features are found in the - band light curves of SN 2012ij , which has long been proposed as one of the most important criteria of distinguishing intrinsically peculiar 91bg-like SNe Ia and fast-declining (or cooler) SNe Ia (Dhawan et al., 2017). Stronger secondary maximum feature in NIR bands usually appears in normal SNe Ia, which is proposed to be related to the recombination of IGE (Kasen, 2006). Taubenberger (2017) suggested that this secondary maximum/shoulder feature usually appear earlier and weaker in cooler SNe, where the recombination of IGE would be earlier and the NIR double peaks could merge to form a delayed single peak as seen in some 91bg-like SNe. The transitional SNe Ia exhibit luminosity and temperature lying between normal and 91bg-like SNe Ia, and it is reasonable that their NIR-band light curves might form weak secondary maximum features.
We adopt three parameters to describe the properties of the NIR secondary peak. The first parameter is about the recombination time of IGE, which can be estimated by the time when the color curve shows a break (Wygoda et al., 2019). Here we use , a parameter similar to , to quantify the time of secondary peak. For subluminous SNe Ia, the primary peaks in band could be delayed due to merging with the secondary ones. Thus, the second parameter t, the time of -band maximum relative to that of the -band maximum, can be used to evaluate the degree of merging. To better quantify the intensity of the -band secondary maximum, we adopt the third parameter , which is calculated by dividing the flux integrated over interval from to days with the -band flux at the primary peak. This parameter is similar to those proposed by Krisciunas et al. (2001), Burns et al. (2014) and Papadogiannakis et al. (2019), but we have chosen a time interval relative to the -band maximum instead of -band maximum due to the large variation of t between normal and subluminous SNe Ia.
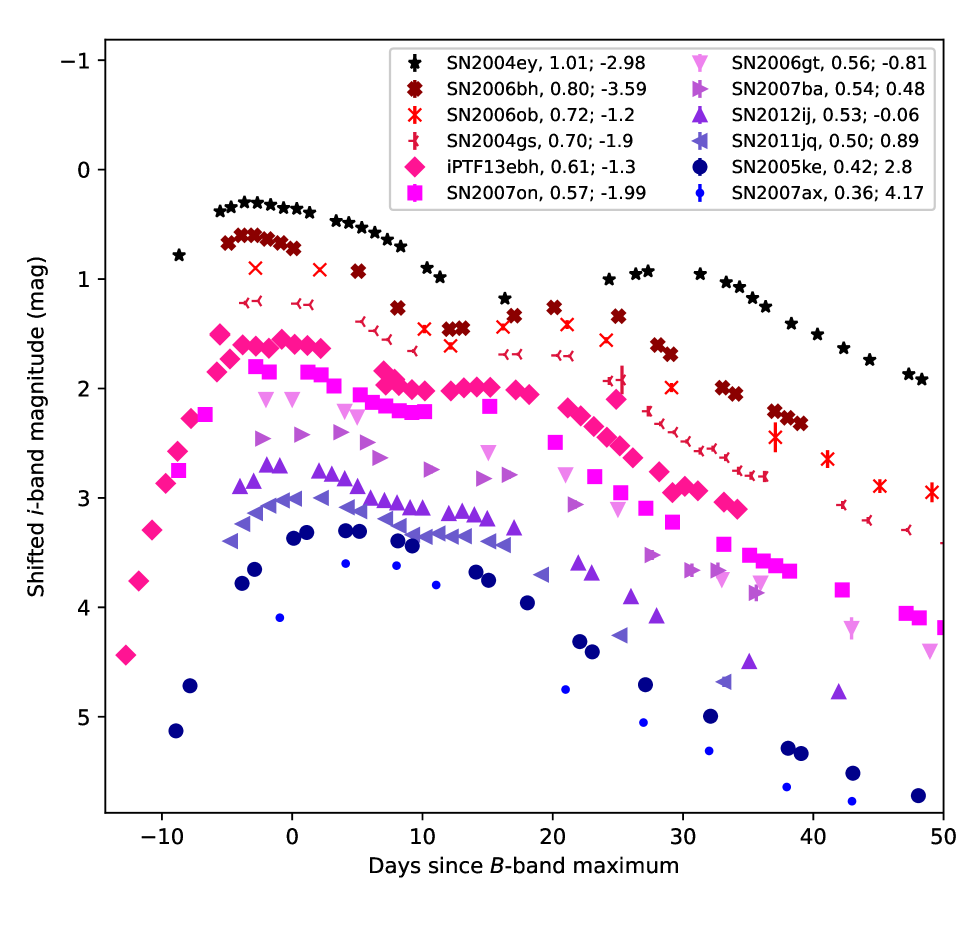
From the CSP sample analyzed by Ashall et al. (2020), we find that SNe 2006gt, 2007ba, 2011jq have similar and t with SN 2012ij. To match the CSP sample, we only discuss the features of secondary maximum in band. The -band light curves of three comparison SNe Ia (Contreras et al., 2010; Walker et al., 2015) are shown in Figure 11. The main parameters of these SNe Ia are shown in Table SN 2012ij: A low-luminosity type Ia supernova and evidence for continuous distribution from 91bg-like explosion to normal ones 111This paper includes data gathered with the 6.5 meter Magellan Telescopes located at Las Campanas Observatory, Chile.. We noticed that these SNe having similar and t as SN 2012ij also show similar light curve morphology.
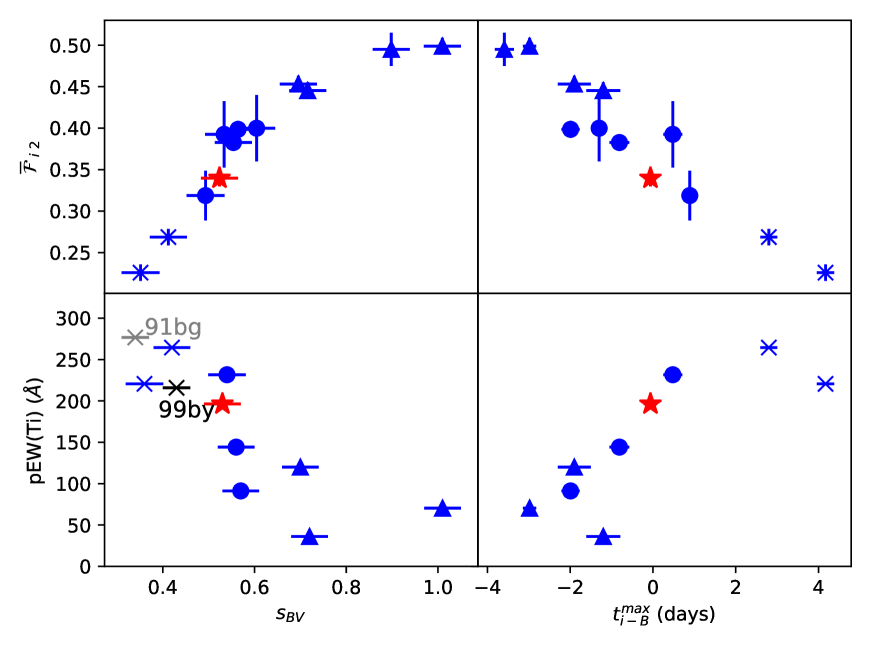
We plot against and t in the upper panel of Figure 12, where shows clear correlations with both and t. These correlations imply that the intensity of the secondary maximum should have a continuous distribution and be sensitive to the occurrence time of the secondary maximum as well as the merging degree of the -band double peaks. We also note that, the correlation of with t deviates from the correlation between and for normal SNe Ia. This deviation may be attributed to the fact that for normal SNe Ia, the double peaks are detached so that t is decoupled from the double-peak merging. The same phenomenon was also presented between t and . When 0.8, t shows a negative correlation with (see Figure 3 of Ashall et al. 2020), whereas for normal SNe Ia (i.e., 0.8), the correlation is not obvious.
5.2 Other Transitional Properties
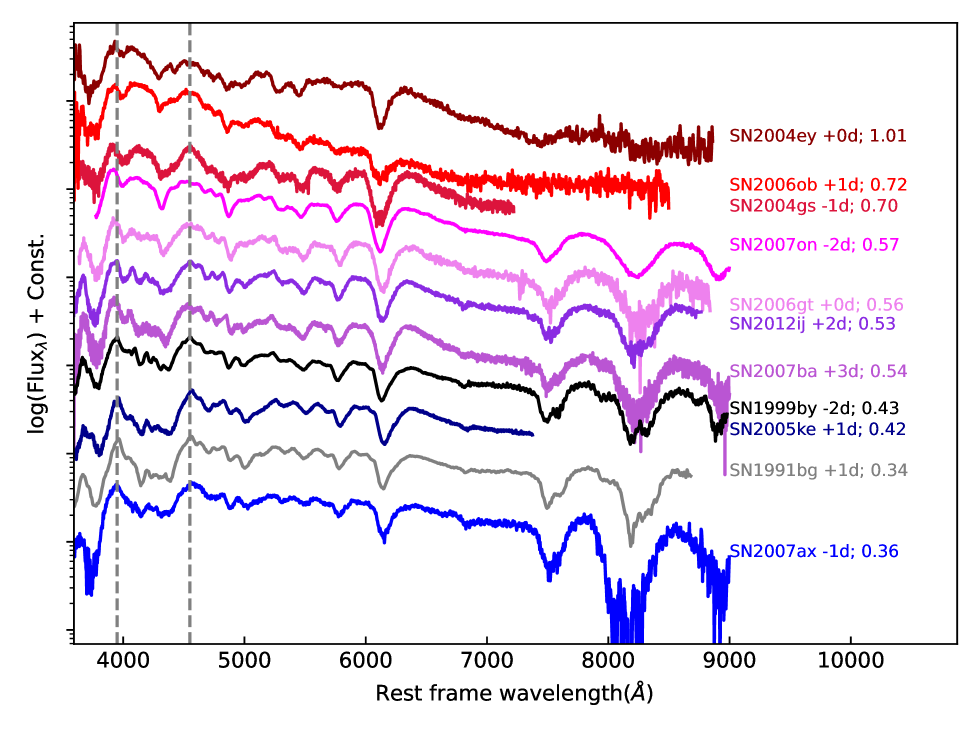
In Figure 13, we compare the near-maximum-light spectra of a larger SN Ia sample as listed in Table SN 2012ij: A low-luminosity type Ia supernova and evidence for continuous distribution from 91bg-like explosion to normal ones 111This paper includes data gathered with the 6.5 meter Magellan Telescopes located at Las Campanas Observatory, Chile.. We measured pEW of Ti ii absorption, corresponding to the equivalent width from 3950 to 4550Å, to quantify the intensity of characteristic Ti absorption features. Though this feature is strongly contaminated by other absorption lines (i.e., Si ii, Mg ii and Fe iii line features), it can still be an effective parameter roughly reflecting the strength of Ti ii trough. We plot the pEW(Ti ii) of all these spectra in the lower panel of Figure 12, and find that the strength of Ti ii absorption trough of these sub-luminous SNe Ia is also correlated with their and t, suggesting that the Ti ii trough is also sensitive to the secondary maximum and merging degree of the NIR double peaks.
We also noticed that SNe 2006gt, 2007ba and 2011jq with comparable (0.50 - 0.56) and t (0.81 - 0.89 days) to SN 2012ij show similar light curves and spectra. Here we call the SNe with ranging from 0.50 to 0.56 and t ranging from 0.81 to 0.89 days as 12ij-like SNe for convenience, but this in no way considers them to be a separate subclass. The percentage of 12ij-like SNe is about in the published sample of SNe Ia from the CSP-II (Ashall et al., 2020).
A widely recognized transitional SN 1986G, of which = 0.54 falls in the range of 0.50 - 0.56 but -band light curve is not obtained, also shows similar light curves and spectra to SN 2012ij. It implies that SN 1986G is also a member of 12ij-like SNe, and classification of 12ij-like SNe should partially overlap with previous classifications of transitional SNe Ia.
Besides, since the percentage and sample size of 12ij-like/transitional SNe are comparable to the 91bg-like subclass (see Figure 3 and Table 2 in Ashall et al. 2020), a continuous distribution is more reasonable. Moreover, in other statistical studies, continuous distribution in different parameter spaces have also been found between normal and 91bg-like SNe Ia (González-Gaitán et al., 2011; Blondin et al., 2012; Burns et al., 2014, 2018).
Note that all these four transitional SNe Ia in our sample are located in passive galaxies. The host galaxies of SNe 2007ba, 2011jq, 2012ij are S0/a galaxies, while SN 2006gt exploded in an elliptical galaxy. Li et al. (2011b) showed that only 91bg-like SNe Ia strongly prefer to occur in early-type galaxies, which implies these transitional SNe Ia are similar to 91bg-like SNe Ia instead of normal SNe Ia in terms of host-galaxy environments.
5.3 Model Comparison
To constrain the possible explosion mechanism of these transitional objects, we compare the observed spectra of SN 2012ij with synthetic spectra predicted from two promising models: the delayed-detonation model and the sub- model. The delayed-detonation model (hereafter called the DDT model; Höflich et al. 2017) gives good predictions of both light curves and spectra for normal SNe Ia, and this model has also been proposed to be able to produce light/color curves of 91bg-like SNe Ia. The sub- explosions, usually realized as violent mergers and double detonations, gives narrow, fast-evolving light curves, which can fit the observations of 91bg-like SNe Ia as well (Pakmor et al., 2013). Here we adopt the pure central detonation of sub- WD (hereafter called the SCH model; Blondin et al. 2017), which has similar properties to the sub- model with a thin He-shell. Both the DDT and the SCH models can predict explosions of SNe Ia with light curve properties ranging from normal to 91bg-like SNe Ia (Fink et al., 2010; Höflich et al., 2017; Blondin et al., 2017).
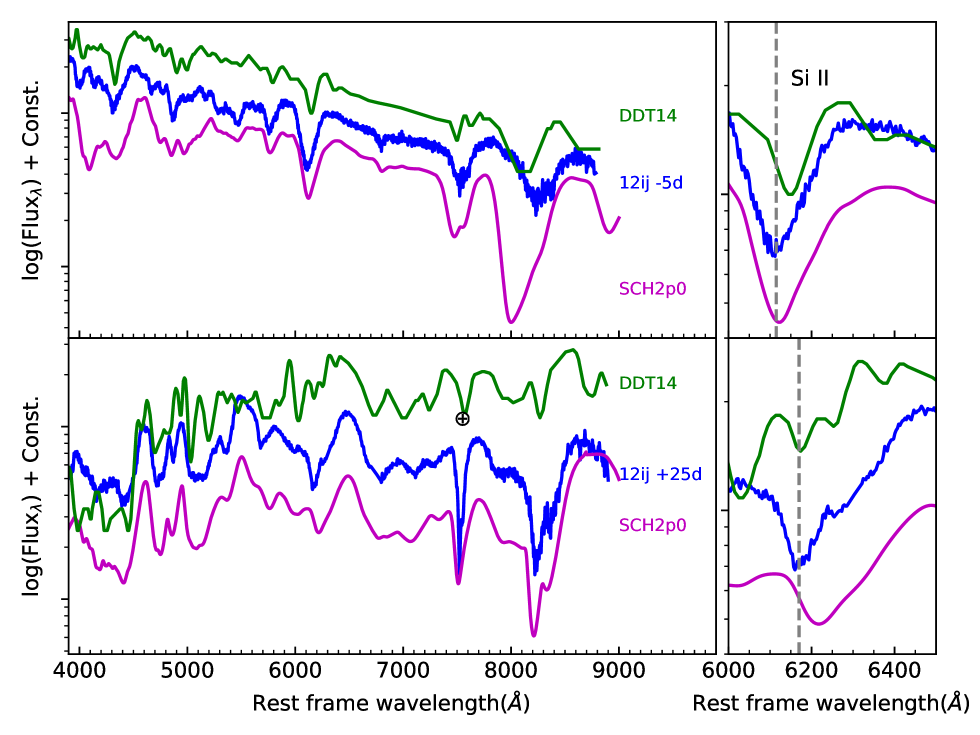
In Figures 14 and 15, we compare the optical and NIR spectra of SN 2012ij with the synthetic spectra yielded from model 14 of Höflich et al. (2017) (hereafter DDT14) and model SCH2p0 of Blondin et al. (2017). These two models are chosen due to that their light curve parameters are similar to those of SN 2012ij. The main parameters of these models are listed in Table SN 2012ij: A low-luminosity type Ia supernova and evidence for continuous distribution from 91bg-like explosion to normal ones 111This paper includes data gathered with the 6.5 meter Magellan Telescopes located at Las Campanas Observatory, Chile..
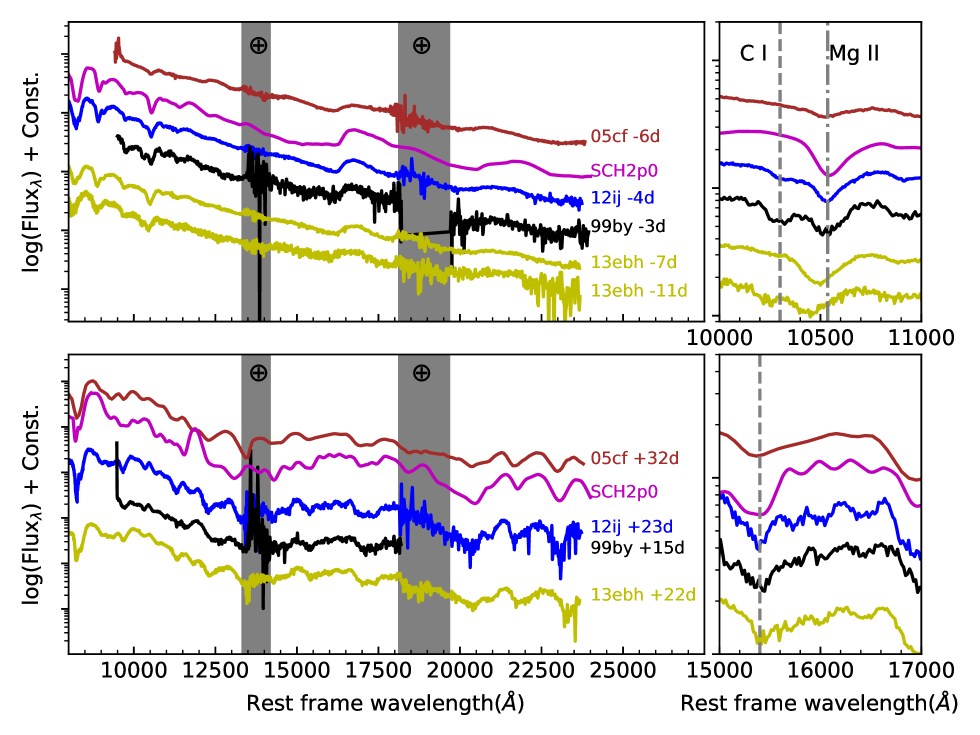
As shown in Figure 14, the synthetic spectrum from DDT14 model shows better conformation to that of SN 2012ij taken at t = 5 days, especially the Ti ii trough and the Ca NIR triplet. In comparison, the SCH2p0 model could better reproduce the Si ii profile. Moreover, the latter model seems to fit well the spectrum of SN 2012ij taken at t = +25 days. Figure 15 shows the comparison of NIR spectra of SN 2012ij with SNe 1999by, 2005cf, iPTF13ebh, and the model spectrum of SCH2p0. One can see that SN 2012ij is overall similar to SN 1999by. At t = 4 days, the NIR spectrum of SN 2012ij shows weak C i 1.0693 m absorption, which is similar to those seen in SN 1999by and iPTF13ebh. The DDT model can produce this carbon line (Höflich et al., 2002; Hsiao et al., 2015), but it is not detected in the spectrum yielded from model SCH2p0 at similar phases. However, the SCH model does not predict a lot amount of carbon in the outer ejecta because of surface detonation (Polin et al., 2019). However, Li et al. (2021) suggested that a small amount of residual carbon could be due to an orientation-dependent effect, resulted from an asymmetric explosion in helium detonation scenario. At t 3 weeks after the maximum light, the in t +23d spectrum of SN 2012ij is similar to that of SN 1999by, but slightly higher than that of SCH2p0. Ashall et al. (2019b) showed that the NIR spectra of SN 1999by match well with those produced by the model DDT08 (Höflich et al., 2002).
In comparison, the DDT model can predict reasonable NIR C i 1.0693 m feature and velocity of Ni edge in band, but the Si ii velocity is underestimated by this model, which might be eliminated by changing the central density (Höflich et al., 2017). On the other hand, the SCH model can also generate the optical spectra similar to those of SN 2012ij. However, whether this model can produce proper C i feature in the NIR spectra still remains controversial (Polin et al., 2019; Li et al., 2021).
In conclusion,the main portion of the spectral features ranging from normal to 91bg-like SNe Ia can be reproduced by the DDT and the SCH models. Therefore, some of the diversities observed between 91bg-like and normal SNe Ia may be attributed to different initial parameters rather than to different explosion models.
6 Conclusion
In this paper, we present and analyze the photometric and spectroscopic data of a peculiar, subluminous SN Ia 2012ij. This SN is found to be very similar to SN 1999by in many aspects, including the color-stretch factor , bolometric light curves, optical and NIR spectra, spectral parameter (e.g., pEW(Si ii 6355&5972), and velocities inferred from Si ii 6355 and Ca NIR triplet).
By comparing parameters of light curves and spectra, we found that 2% SNe in CSP-II SNe Ia sample can be identified as the subclass like SN 2012ij, which exhibit transitional light-curve features linking normal to 91bg-like SNe Ia. Through some quantitative analysis, we found that the time of NIR primary peak t, the relative intensity of NIR secondary peak , the time when IGEs recombine, and the color-stretch factor are all correlated with the extent of merging between two peaks in NIR bands, which may explain for the light-curve diversity of SNe Ia in NIR bands.
We show both the delayed-detonation model and the sub- model have the potential to re-produce the observations of SN 2012ij. Despite the DDT models could produce the entire observed range from normal to 91bg-like SNe Ia (Höflich et al., 2017), the SCH model also seems to work for most SNe Ia except for the fastest declining objects like SN 1991bg (Blondin et al., 2017). This reproducibility of a single model for various SNe Ia observations, together with clear correlations and continuous distributions in spectral and light curve parameters, suggest that the existence of a continuous transition from normal to 91bg-like SNe Ia.
With tons of multi-color light curves from the upcoming Rubin Observatory Legacy Survey Telescope (LSST; Ivezić et al. 2019), the subclass like SN 2012ij will be greatly enriched. This subclass could be recognized by similar photometric parameters to SN 2012ij in this work, allowing further identification of their association with normal and 91bg-like SNe Ia. Moreover, statistical studies of vast numbers of early light/color curves may be able to identify diversities that cannot be detected at a later stage. This will help us find more relations between their properties and hence better understand their progenitors and explosion mechanism.
References
- Arnett (1982) Arnett, W. D. 1982, ApJ, 253, 785, doi: 10.1086/159681
- Ashall et al. (2019a) Ashall, C., Hsiao, E. Y., Hoeflich, P., et al. 2019a, ApJ, 875, L14, doi: 10.3847/2041-8213/ab1654
- Ashall et al. (2019b) Ashall, C., Hoeflich, P., Hsiao, E. Y., et al. 2019b, ApJ, 878, 86, doi: 10.3847/1538-4357/ab204b
- Ashall et al. (2020) Ashall, C., Lu, J., Burns, C., et al. 2020, ApJ, 895, L3, doi: 10.3847/2041-8213/ab8e37
- Benetti et al. (2005) Benetti, S., Cappellaro, E., Mazzali, P. A., et al. 2005, ApJ, 623, 1011, doi: 10.1086/428608
- Bertin (2006) Bertin, E. 2006, in Astronomical Society of the Pacific Conference Series, Vol. 351, Astronomical Data Analysis Software and Systems XV, ed. C. Gabriel, C. Arviset, D. Ponz, & S. Enrique, 112
- Bertin & Arnouts (1996) Bertin, E., & Arnouts, S. 1996, A&AS, 117, 393, doi: 10.1051/aas:1996164
- Bertin et al. (2002) Bertin, E., Mellier, Y., Radovich, M., et al. 2002, in Astronomical Society of the Pacific Conference Series, Vol. 281, Astronomical Data Analysis Software and Systems XI, ed. D. A. Bohlender, D. Durand, & T. H. Handley, 228
- Betoule et al. (2014) Betoule, M., Kessler, R., Guy, J., et al. 2014, A&A, 568, A22, doi: 10.1051/0004-6361/201423413
- Blondin et al. (2018) Blondin, S., Dessart, L., & Hillier, D. J. 2018, MNRAS, 474, 3931, doi: 10.1093/mnras/stx3058
- Blondin et al. (2017) Blondin, S., Dessart, L., Hillier, D. J., & Khokhlov, A. M. 2017, MNRAS, 470, 157, doi: 10.1093/mnras/stw2492
- Blondin et al. (2012) Blondin, S., Matheson, T., Kirshner, R. P., et al. 2012, AJ, 143, 126, doi: 10.1088/0004-6256/143/5/126
- Branch et al. (2009) Branch, D., Chau Dang, L., & Baron, E. 2009, PASP, 121, 238, doi: 10.1086/597788
- Branch et al. (1993) Branch, D., Fisher, A., & Nugent, P. 1993, AJ, 106, 2383, doi: 10.1086/116810
- Branch et al. (2006) Branch, D., Dang, L. C., Hall, N., et al. 2006, PASP, 118, 560, doi: 10.1086/502778
- Brown et al. (2014) Brown, P. J., Breeveld, A. A., Holland, S., Kuin, P., & Pritchard, T. 2014, Ap&SS, 354, 89, doi: 10.1007/s10509-014-2059-8
- Burns et al. (2014) Burns, C. R., Stritzinger, M., Phillips, M. M., et al. 2014, ApJ, 789, 32, doi: 10.1088/0004-637X/789/1/32
- Burns et al. (2018) Burns, C. R., Parent, E., Phillips, M. M., et al. 2018, ApJ, 869, 56, doi: 10.3847/1538-4357/aae51c
- Burrow et al. (2020) Burrow, A., Baron, E., Ashall, C., et al. 2020, ApJ, 901, 154, doi: 10.3847/1538-4357/abafa2
- Cao et al. (2015) Cao, Y., Kulkarni, S. R., Howell, D. A., et al. 2015, Nature, 521, 328, doi: 10.1038/nature14440
- Cardelli et al. (1989) Cardelli, J. A., Clayton, G. C., & Mathis, J. S. 1989, ApJ, 345, 245, doi: 10.1086/167900
- Chonis & Gaskell (2008) Chonis, T. S., & Gaskell, C. M. 2008, AJ, 135, 264, doi: 10.1088/0004-6256/135/1/264
- Contreras et al. (2010) Contreras, C., Hamuy, M., Phillips, M. M., et al. 2010, AJ, 139, 519, doi: 10.1088/0004-6256/139/2/519
- Dhawan et al. (2017) Dhawan, S., Leibundgut, B., Spyromilio, J., & Blondin, S. 2017, A&A, 602, A118, doi: 10.1051/0004-6361/201629793
- Dilday et al. (2012) Dilday, B., Howell, D. A., Cenko, S. B., et al. 2012, Science, 337, 942, doi: 10.1126/science.1219164
- Dimitriadis et al. (2019) Dimitriadis, G., Foley, R. J., Rest, A., et al. 2019, ApJ, 870, L1, doi: 10.3847/2041-8213/aaedb0
- Edwards et al. (2012) Edwards, Z. I., Pagnotta, A., & Schaefer, B. E. 2012, ApJ, 747, L19, doi: 10.1088/2041-8205/747/2/L19
- Fan et al. (2015) Fan, Y.-F., Bai, J.-M., Zhang, J.-J., et al. 2015, Research in Astronomy and Astrophysics, 15, 918, doi: 10.1088/1674-4527/15/6/014
- Fan et al. (2016) Fan, Z., Wang, H., Jiang, X., et al. 2016, PASP, 128, 115005, doi: 10.1088/1538-3873/128/969/115005
- Filippenko (1997) Filippenko, A. V. 1997, ARA&A, 35, 309, doi: 10.1146/annurev.astro.35.1.309
- Filippenko et al. (1992a) Filippenko, A. V., Richmond, M. W., Matheson, T., et al. 1992a, ApJ, 384, L15, doi: 10.1086/186252
- Filippenko et al. (1992b) Filippenko, A. V., Richmond, M. W., Branch, D., et al. 1992b, AJ, 104, 1543, doi: 10.1086/116339
- Fink et al. (2010) Fink, M., Röpke, F. K., Hillebrandt, W., et al. 2010, A&A, 514, A53, doi: 10.1051/0004-6361/200913892
- Folatelli et al. (2013) Folatelli, G., Morrell, N., Phillips, M. M., et al. 2013, ApJ, 773, 53, doi: 10.1088/0004-637X/773/1/53
- Freedman et al. (2009) Freedman, W. L., Burns, C. R., Phillips, M. M., et al. 2009, ApJ, 704, 1036, doi: 10.1088/0004-637X/704/2/1036
- Galbany et al. (2019) Galbany, L., Ashall, C., Höflich, P., et al. 2019, A&A, 630, A76, doi: 10.1051/0004-6361/201935537
- Gall et al. (2018) Gall, C., Stritzinger, M. D., Ashall, C., et al. 2018, A&A, 611, A58, doi: 10.1051/0004-6361/201730886
- Ganeshalingam et al. (2010) Ganeshalingam, M., Li, W., Filippenko, A. V., et al. 2010, ApJS, 190, 418, doi: 10.1088/0067-0049/190/2/418
- Garnavich et al. (2004) Garnavich, P. M., Bonanos, A. Z., Krisciunas, K., et al. 2004, ApJ, 613, 1120, doi: 10.1086/422986
- González-Gaitán et al. (2011) González-Gaitán, S., Perrett, K., Sullivan, M., et al. 2011, ApJ, 727, 107, doi: 10.1088/0004-637X/727/2/107
- González-Gaitán et al. (2012) González-Gaitán, S., Conley, A., Bianco, F. B., et al. 2012, ApJ, 745, 44, doi: 10.1088/0004-637X/745/1/44
- Guillochon et al. (2017) Guillochon, J., Parrent, J., Kelley, L. Z., & Margutti, R. 2017, An Open Catalog for Supernova Data, doi: 10.3847/1538-4357/835/1/64
- Guy et al. (2005) Guy, J., Astier, P., Nobili, S., Regnault, N., & Pain, R. 2005, A&A, 443, 781, doi: 10.1051/0004-6361:20053025
- Hakobyan et al. (2016) Hakobyan, A. A., Karapetyan, A. G., Barkhudaryan, L. V., et al. 2016, MNRAS, 456, 2848, doi: 10.1093/mnras/stv2853
- Hamuy et al. (1996) Hamuy, M., Phillips, M. M., Suntzeff, N. B., et al. 1996, AJ, 112, 2391, doi: 10.1086/118190
- Hamuy et al. (2002) Hamuy, M., Maza, J., Pinto, P. A., et al. 2002, AJ, 124, 417, doi: 10.1086/340968
- Hicken et al. (2009) Hicken, M., Challis, P., Jha, S., et al. 2009, ApJ, 700, 331, doi: 10.1088/0004-637X/700/1/331
- Höflich et al. (2002) Höflich, P., Gerardy, C. L., Fesen, R. A., & Sakai, S. 2002, ApJ, 568, 791, doi: 10.1086/339063
- Höflich & Khokhlov (1996) Höflich, P., & Khokhlov, A. 1996, ApJ, 457, 500, doi: 10.1086/176748
- Höflich et al. (2017) Höflich, P., Hsiao, E. Y., Ashall, C., et al. 2017, ApJ, 846, 58, doi: 10.3847/1538-4357/aa84b2
- Hosseinzadeh et al. (2017) Hosseinzadeh, G., Sand, D. J., Valenti, S., et al. 2017, ApJ, 845, L11, doi: 10.3847/2041-8213/aa8402
- Hough et al. (1987) Hough, J. H., Bailey, J. A., Rouse, M. F., & Whittet, D. C. B. 1987, MNRAS, 227, 1P, doi: 10.1093/mnras/227.1.1P
- Howell et al. (2001) Howell, D. A., Höflich, P., Wang, L., & Wheeler, J. C. 2001, ApJ, 556, 302, doi: 10.1086/321584
- Hsiao et al. (2015) Hsiao, E. Y., Burns, C. R., Contreras, C., et al. 2015, A&A, 578, A9, doi: 10.1051/0004-6361/201425297
- Hsiao et al. (2019) Hsiao, E. Y., Phillips, M. M., Marion, G. H., et al. 2019, PASP, 131, 014002, doi: 10.1088/1538-3873/aae961
- Huang et al. (2012) Huang, F., Li, J.-Z., Wang, X.-F., et al. 2012, Research in Astronomy and Astrophysics, 12, 1585, doi: 10.1088/1674-4527/12/11/012
- Hunter (2007) Hunter, J. D. 2007, Computing in Science and Engineering, 9, 90, doi: 10.1109/MCSE.2007.55
- Iben & Tutukov (1984) Iben, I., J., & Tutukov, A. V. 1984, ApJS, 54, 335, doi: 10.1086/190932
- Ivezić et al. (2019) Ivezić, Ž., Kahn, S. M., Tyson, J. A., et al. 2019, ApJ, 873, 111, doi: 10.3847/1538-4357/ab042c
- Iwamoto et al. (1999) Iwamoto, K., Brachwitz, F., Nomoto, K., et al. 1999, ApJS, 125, 439, doi: 10.1086/313278
- Jha et al. (2007) Jha, S., Riess, A. G., & Kirshner, R. P. 2007, ApJ, 659, 122, doi: 10.1086/512054
- Kasen (2006) Kasen, D. 2006, ApJ, 649, 939, doi: 10.1086/506588
- Khokhlov (1991) Khokhlov, A. M. 1991, A&A, 245, 114
- Krisciunas et al. (2001) Krisciunas, K., Phillips, M. M., Stubbs, C., et al. 2001, AJ, 122, 1616, doi: 10.1086/322120
- Krisciunas et al. (2009) Krisciunas, K., Marion, G. H., Suntzeff, N. B., et al. 2009, AJ, 138, 1584, doi: 10.1088/0004-6256/138/6/1584
- Krisciunas et al. (2017) Krisciunas, K., Contreras, C., Burns, C. R., et al. 2017, AJ, 154, 211, doi: 10.3847/1538-3881/aa8df0
- Leibundgut et al. (1993) Leibundgut, B., Kirshner, R. P., Phillips, M. M., et al. 1993, AJ, 105, 301, doi: 10.1086/116427
- Li et al. (2003) Li, W., Filippenko, A. V., Chornock, R., et al. 2003, PASP, 115, 453, doi: 10.1086/374200
- Li et al. (2011a) Li, W., Bloom, J. S., Podsiadlowski, P., et al. 2011a, Nature, 480, 348, doi: 10.1038/nature10646
- Li et al. (2011b) Li, W., Leaman, J., Chornock, R., et al. 2011b, MNRAS, 412, 1441, doi: 10.1111/j.1365-2966.2011.18160.x
- Li et al. (2019) Li, W., Wang, X., Vinkó, J., et al. 2019, ApJ, 870, 12, doi: 10.3847/1538-4357/aaec74
- Li et al. (2021) Li, W., Wang, X., Bulla, M., et al. 2021, ApJ, 906, 99, doi: 10.3847/1538-4357/abc9b5
- Lu et al. (1993) Lu, N. Y., Hoffman, G. L., Groff, T., Roos, T., & Lamphier, C. 1993, ApJS, 88, 383, doi: 10.1086/191826
- Maeda & Terada (2016) Maeda, K., & Terada, Y. 2016, International Journal of Modern Physics D, 25, 1630024, doi: 10.1142/s021827181630024x
- Maoz et al. (2014) Maoz, D., Mannucci, F., & Nelemans, G. 2014, ARA&A, 52, 107, doi: 10.1146/annurev-astro-082812-141031
- Maraston et al. (2009) Maraston, C., Strömbäck, G., Thomas, D., Wake, D. A., & Nichol, R. C. 2009, MNRAS, 394, L107, doi: 10.1111/j.1745-3933.2009.00621.x
- Mazzali et al. (1997) Mazzali, P. A., Chugai, N., Turatto, M., et al. 1997, MNRAS, 284, 151, doi: 10.1093/mnras/284.1.151
- Modjaz et al. (2001) Modjaz, M., Li, W., Filippenko, A. V., et al. 2001, PASP, 113, 308, doi: 10.1086/319338
- NASA/IPAC Extragalactic Database (2019) (NED) NASA/IPAC Extragalactic Database (NED). 2019, NED Gravitational Wave Follow-up (GWF) Service, IPAC, doi: 10.26132/NED3
- Nugent et al. (1995) Nugent, P., Phillips, M., Baron, E., Branch, D., & Hauschildt, P. 1995, ApJ, 455, L147, doi: 10.1086/309846
- O’Donnell (1994) O’Donnell, J. E. 1994, ApJ, 422, 158, doi: 10.1086/173713
- Oliphant (2007) Oliphant, T. E. 2007, Computing in Science and Engineering, 9, 10, doi: 10.1109/MCSE.2007.58
- Pakmor et al. (2010) Pakmor, R., Kromer, M., Röpke, F. K., et al. 2010, Nature, 463, 61, doi: 10.1038/nature08642
- Pakmor et al. (2012) Pakmor, R., Kromer, M., Taubenberger, S., et al. 2012, ApJ, 747, L10, doi: 10.1088/2041-8205/747/1/L10
- Pakmor et al. (2013) Pakmor, R., Kromer, M., Taubenberger, S., & Springel, V. 2013, ApJ, 770, L8, doi: 10.1088/2041-8205/770/1/L8
- Papadogiannakis et al. (2019) Papadogiannakis, S., Dhawan, S., Morosin, R., & Goobar, A. 2019, MNRAS, 485, 2343, doi: 10.1093/mnras/stz493
- Pastorello et al. (2007) Pastorello, A., Mazzali, P. A., Pignata, G., et al. 2007, MNRAS, 377, 1531, doi: 10.1111/j.1365-2966.2007.11700.x
- Patat et al. (2007) Patat, F., Chandra, P., Chevalier, R., et al. 2007, Science, 317, 924, doi: 10.1126/science.1143005
- Perlmutter et al. (1999) Perlmutter, S., Aldering, G., Goldhaber, G., et al. 1999, ApJ, 517, 565, doi: 10.1086/307221
- Phillips (1993) Phillips, M. M. 1993, ApJ, 413, L105, doi: 10.1086/186970
- Phillips et al. (1999) Phillips, M. M., Lira, P., Suntzeff, N. B., et al. 1999, AJ, 118, 1766, doi: 10.1086/301032
- Phillips et al. (1992) Phillips, M. M., Wells, L. A., Suntzeff, N. B., et al. 1992, AJ, 103, 1632, doi: 10.1086/116177
- Phillips et al. (1987) Phillips, M. M., Phillips, A. C., Heathcote, S. R., et al. 1987, PASP, 99, 592, doi: 10.1086/132020
- Phillips et al. (2019) Phillips, M. M., Contreras, C., Hsiao, E. Y., et al. 2019, PASP, 131, 014001, doi: 10.1088/1538-3873/aae8bd
- Polin et al. (2019) Polin, A., Nugent, P., & Kasen, D. 2019, ApJ, 873, 84, doi: 10.3847/1538-4357/aafb6a
- Riess et al. (1999) Riess, A. G., Filippenko, A. V., Li, W., & Schmidt, B. P. 1999, AJ, 118, 2668, doi: 10.1086/301144
- Riess et al. (1998) Riess, A. G., Filippenko, A. V., Challis, P., et al. 1998, AJ, 116, 1009, doi: 10.1086/300499
- Riess et al. (2007) Riess, A. G., Strolger, L.-G., Casertano, S., et al. 2007, ApJ, 659, 98, doi: 10.1086/510378
- Riess et al. (2016) Riess, A. G., Macri, L. M., Hoffmann, S. L., et al. 2016, ApJ, 826, 56, doi: 10.3847/0004-637X/826/1/56
- Röser et al. (2008) Röser, S., Schilbach, E., Schwan, H., et al. 2008, A&A, 488, 401, doi: 10.1051/0004-6361:200809775
- Ruiz-Lapuente et al. (1992) Ruiz-Lapuente, P., Cappellaro, E., Turatto, M., et al. 1992, ApJ, 387, L33, doi: 10.1086/186299
- Ruiz-Lapuente et al. (1993) Ruiz-Lapuente, P., Jeffery, D. J., Challis, P. M., et al. 1993, Nature, 365, 728, doi: 10.1038/365728a0
- Sandage et al. (2006) Sandage, A., Tammann, G. A., Saha, A., et al. 2006, ApJ, 653, 843, doi: 10.1086/508853
- Santander-García et al. (2015) Santander-García, M., Rodríguez-Gil, P., Corradi, R. L. M., et al. 2015, Nature, 519, 63, doi: 10.1038/nature14124
- Sato et al. (2015) Sato, Y., Nakasato, N., Tanikawa, A., et al. 2015, ApJ, 807, 105, doi: 10.1088/0004-637X/807/1/105
- Schaefer & Pagnotta (2012) Schaefer, B. E., & Pagnotta, A. 2012, Nature, 481, 164, doi: 10.1038/nature10692
- Schlafly & Finkbeiner (2011) Schlafly, E. F., & Finkbeiner, D. P. 2011, ApJ, 737, 103, doi: 10.1088/0004-637X/737/2/103
- Shappee et al. (2019) Shappee, B. J., Holoien, T. W. S., Drout, M. R., et al. 2019, ApJ, 870, 13, doi: 10.3847/1538-4357/aaec79
- Silverman et al. (2012) Silverman, J. M., Foley, R. J., Filippenko, A. V., et al. 2012, MNRAS, 425, 1789, doi: 10.1111/j.1365-2966.2012.21270.x
- Simcoe et al. (2013) Simcoe, R. A., Burgasser, A. J., Schechter, P. L., et al. 2013, PASP, 125, 270, doi: 10.1086/670241
- Sternberg et al. (2011) Sternberg, A., Gal-Yam, A., Simon, J. D., et al. 2011, Science, 333, 856, doi: 10.1126/science.1203836
- Stetson (1987) Stetson, P. B. 1987, PASP, 99, 191, doi: 10.1086/131977
- Taubenberger (2017) Taubenberger, S. 2017, in Handbook of Supernovae (Springer International Publishing), 317–373, doi: 10.1007/978-3-319-21846-5_37
- Taubenberger et al. (2008) Taubenberger, S., Hachinger, S., Pignata, G., et al. 2008, MNRAS, 385, 75, doi: 10.1111/j.1365-2966.2008.12843.x
- Taubenberger et al. (2011) Taubenberger, S., Benetti, S., Childress, M., et al. 2011, MNRAS, 412, 2735, doi: 10.1111/j.1365-2966.2010.18107.x
- Turatto et al. (1996) Turatto, M., Benetti, S., Cappellaro, E., et al. 1996, MNRAS, 283, 1, doi: 10.1093/mnras/283.1.1
- Turatto et al. (1998) Turatto, M., Piemonte, A., Benetti, S., et al. 1998, AJ, 116, 2431, doi: 10.1086/300622
- van der Walt et al. (2011) van der Walt, S., Colbert, S. C., & Varoquaux, G. 2011, Computing in Science and Engineering, 13, 22, doi: 10.1109/MCSE.2011.37
- Walker et al. (2015) Walker, E. S., Baltay, C., Campillay, A., et al. 2015, ApJS, 219, 13, doi: 10.1088/0067-0049/219/1/13
- Wang (2018) Wang, B. 2018, Research in Astronomy and Astrophysics, 18, 049, doi: 10.1088/1674-4527/18/5/49
- Wang & Han (2012) Wang, B., & Han, Z. 2012, New A Rev., 56, 122, doi: 10.1016/j.newar.2012.04.001
- Wang et al. (2019) Wang, C.-J., Bai, J.-M., Fan, Y.-F., et al. 2019, Research in Astronomy and Astrophysics, 19, 149, doi: 10.1088/1674-4527/19/10/149
- Wang et al. (2013a) Wang, X., Chen, J., Zhang, T., et al. 2013a, Central Bureau Electronic Telegrams, 3370, 1
- Wang et al. (2013b) Wang, X., Wang, L., Filippenko, A. V., Zhang, T., & Zhao, X. 2013b, Science, 340, 170, doi: 10.1126/science.1231502
- Wang et al. (2006) Wang, X., Wang, L., Pain, R., Zhou, X., & Li, Z. 2006, ApJ, 645, 488, doi: 10.1086/504312
- Wang et al. (2005) Wang, X., Wang, L., Zhou, X., Lou, Y.-Q., & Li, Z. 2005, ApJ, 620, L87, doi: 10.1086/428774
- Wang et al. (2008) Wang, X., Li, W., Filippenko, A. V., et al. 2008, ApJ, 675, 626, doi: 10.1086/526413
- Wang et al. (2009a) Wang, X., Filippenko, A. V., Ganeshalingam, M., et al. 2009a, ApJ, 699, L139, doi: 10.1088/0004-637X/699/2/L139
- Wang et al. (2009b) Wang, X., Li, W., Filippenko, A. V., et al. 2009b, ApJ, 697, 380, doi: 10.1088/0004-637X/697/1/380
- Webbink (1984) Webbink, R. F. 1984, ApJ, 277, 355, doi: 10.1086/161701
- Whelan & Iben (1973) Whelan, J., & Iben, Icko, J. 1973, ApJ, 186, 1007, doi: 10.1086/152565
- Wilkinson et al. (2017) Wilkinson, D. M., Maraston, C., Goddard, D., Thomas, D., & Parikh, T. 2017, MNRAS, 472, 4297, doi: 10.1093/mnras/stx2215
- Woosley (1990) Woosley, S. E. 1990, in Supernovae, 182–212
- Woosley & Weaver (1994) Woosley, S. E., & Weaver, T. A. 1994, ApJ, 423, 371, doi: 10.1086/173813
- Wyatt et al. (2021) Wyatt, S. D., Sand, D. J., Hsiao, E. Y., et al. 2021, ApJ, 914, 57, doi: 10.3847/1538-4357/abf7c3
- Wygoda et al. (2019) Wygoda, N., Elbaz, Y., & Katz, B. 2019, MNRAS, 484, 3951, doi: 10.1093/mnras/stz146
- Zhang et al. (2015) Zhang, T.-M., Wang, X.-F., Chen, J.-C., et al. 2015, Research in Astronomy and Astrophysics, 15, 215, doi: 10.1088/1674-4527/15/2/006
- Zhao et al. (2015) Zhao, X., Wang, X., Maeda, K., et al. 2015, ApJS, 220, 20, doi: 10.1088/0067-0049/220/1/20
- Zhao et al. (2016) Zhao, X., Maeda, K., Wang, X., et al. 2016, ApJ, 826, 211, doi: 10.3847/0004-637X/826/2/211
| UT Date | MJD | PhaseaaRelative to the epoch of -band maximum (MJD = 56302.3) in the frame of the observer. | Telescope | ||||||||
|---|---|---|---|---|---|---|---|---|---|---|---|
| 2013 Jan. 4 | 56295.84 | 6.5 | 16.57(0.01) | 16.06(0.02) | 16.01(0.04) | 16.26(0.02) | TNT | ||||
| 2013 Jan. 5 | 56296.89 | 5.4 | 16.30(0.03) | 15.93(0.03) | 15.72(0.02) | 15.86(0.02) | TNT | ||||
| 2013 Jan. 6 | 56297.83 | 4.5 | 16.08(0.01) | 15.76(0.02) | 15.64(0.03) | 15.64(0.02) | TNT | ||||
| 2013 Jan. 6 | 56298.32 | 4.0 | 15.90(0.01) | 15.74(0.01) | 16.80(0.04) | 15.75(0.01) | 15.74(0.01) | 15.88(0.01) | Swope | ||
| 2013 Jan. 7 | 56298.86 | 3.4 | 16.00(0.01) | 15.66(0.03) | 15.49(0.03) | 15.55(0.02) | TNT | ||||
| 2013 Jan. 7 | 56299.35 | 3.0 | 15.79(0.01) | 15.66(0.01) | 16.74(0.04) | 15.62(0.01) | 15.63(0.02) | 15.84(0.02) | Swope | ||
| 2013 Jan. 8 | 56300.33 | 2.0 | 15.62(0.02) | 15.46(0.03) | 15.49(0.02) | 15.47(0.02) | 15.69(0.02) | Swope | |||
| 2013 Jan. 9 | 56300.83 | 1.5 | 15.77(0.01) | 15.38(0.02) | 15.48(0.02) | 15.50(0.02) | TNT | ||||
| 2013 Jan. 9 | 56301.34 | 1.0 | 15.56(0.02) | 15.44(0.03) | 16.69(0.04) | 15.42(0.02) | 15.41(0.02) | 15.70(0.02) | Swope | ||
| 2013 Jan. 10 | 56301.90 | 0.4 | 15.67(0.01) | 15.26(0.02) | 15.37(0.02) | 15.46(0.01) | TNT | ||||
| 2013 Jan. 12 | 56303.84 | 1.5 | 15.74(0.01) | 15.26(0.02) | 15.30(0.04) | 15.47(0.03) | TNT | ||||
| 2013 Jan. 12 | 56304.37 | 2.0 | 15.76(0.03) | 15.39(0.03) | 15.49(0.02) | 15.34(0.02) | 15.74(0.02) | Swope | |||
| 2013 Jan. 13 | 56304.88 | 2.6 | 15.87(0.04) | 15.29(0.05) | 15.40(0.05) | 15.49(0.08) | TNT | ||||
| 2013 Jan. 13 | 56305.33 | 3.0 | 15.74(0.02) | 15.37(0.02) | 17.08(0.04) | 15.51(0.02) | 15.35(0.02) | 15.77(0.02) | Swope | ||
| 2013 Jan. 14 | 56305.83 | 3.5 | 15.94(0.02) | 15.34(0.03) | 15.34(0.03) | 15.54(0.02) | TNT | ||||
| 2013 Jan. 14 | 56306.34 | 4.0 | 15.89(0.02) | 15.42(0.02) | 17.29(0.04) | 15.58(0.02) | 15.39(0.02) | 15.81(0.02) | Swope | ||
| 2013 Jan. 15 | 56307.33 | 5.0 | 16.01(0.03) | 15.45(0.02) | 17.33(0.03) | 15.66(0.02) | 15.42(0.02) | 15.88(0.02) | Swope | ||
| 2013 Jan. 16 | 56307.75 | 5.4 | 16.14(0.02) | 15.47(0.01) | 15.45(0.02) | 15.70(0.02) | TNT | ||||
| 2013 Jan. 16 | 56308.33 | 6.0 | 16.21(0.01) | 15.59(0.01) | 17.51(0.02) | 15.83(0.01) | 15.54(0.02) | 15.99(0.01) | Swope | ||
| 2013 Jan. 17 | 56309.35 | 7.0 | 16.30(0.03) | 15.57(0.02) | 15.91(0.02) | 15.56(0.02) | 16.01(0.02) | Swope | |||
| 2013 Jan. 18 | 56309.88 | 7.6 | 16.55(0.02) | 15.66(0.02) | 15.55(0.04) | 15.96(0.02) | TNT | ||||
| 2013 Jan. 18 | 56310.33 | 8.0 | 16.43(0.03) | 15.68(0.02) | 17.96(0.02) | 16.05(0.02) | 15.60(0.02) | 16.03(0.02) | Swope | ||
| 2013 Jan. 19 | 56311.33 | 9.0 | 16.64(0.03) | 15.80(0.02) | 18.16(0.04) | 16.19(0.02) | 15.66(0.02) | 16.08(0.02) | Swope | ||
| 2013 Jan. 20 | 56312.32 | 10.0 | 16.93(0.04) | 15.89(0.03) | 18.45(0.09) | 16.34(0.03) | 15.78(0.02) | 16.08(0.03) | Swope | ||
| 2013 Jan. 22 | 56314.33 | 12.0 | 17.18(0.03) | 16.14(0.03) | 18.66(0.02) | 16.67(0.02) | 15.89(0.02) | 16.13(0.02) | Swope | ||
| 2013 Jan. 23 | 56315.36 | 13.0 | 17.33(0.03) | 16.24(0.04) | 18.78(0.02) | 16.80(0.02) | 15.93(0.02) | 16.11(0.02) | Swope | ||
| 2013 Jan. 24 | 56315.80 | 13.5 | 17.45(0.02) | 16.24(0.04) | 15.93(0.01) | 15.97(0.02) | TNT | ||||
| 2013 Jan. 24 | 56316.30 | 14.0 | 17.48(0.03) | 16.32(0.02) | 19.02(0.06) | 16.94(0.02) | 16.02(0.02) | 16.14(0.02) | Swope | ||
| 2013 Jan. 25 | 56316.87 | 14.6 | 17.53(0.02) | 16.39(0.07) | 16.08(0.04) | 16.00(0.05) | TNT | ||||
| 2013 Jan. 25 | 56317.29 | 15.0 | 17.66(0.03) | 16.46(0.03) | 19.10(0.07) | 17.02(0.03) | 16.05(0.02) | 16.18(0.02) | Swope | ||
| 2013 Jan. 26 | 56317.85 | 15.6 | 17.54(0.06) | 16.45(0.05) | 16.02(0.02) | 15.94(0.03) | TNT | ||||
| 2013 Jan. 27 | 56318.85 | 16.6 | 18.03(0.03) | 16.64(0.10) | 16.12(0.07) | 15.85(0.04) | TNT | ||||
| 2013 Jan. 27 | 56319.32 | 17.0 | 17.86(0.04) | 16.62(0.03) | 19.21(0.10) | 17.42(0.04) | 16.20(0.02) | 16.26(0.02) | Swope | ||
| 2013 Jan. 29 | 56320.78 | 18.5 | 18.07(0.04) | 16.78(0.09) | 16.28(0.03) | 15.95(0.02) | TNT | ||||
| 2013 Feb. 1 | 56324.28 | 22.0 | 18.19(0.03) | 16.93(0.03) | 19.57(0.09) | 17.60(0.03) | 16.62(0.02) | 16.58(0.02) | Swope | ||
| 2013 Feb. 2 | 56324.80 | 22.5 | 18.24(0.03) | 16.96(0.02) | 16.71(0.02) | 16.14(0.02) | TNT | ||||
| 2013 Feb. 2 | 56325.27 | 23.0 | 18.16(0.03) | 17.02(0.02) | 19.45(0.05) | 17.69(0.02) | 16.70(0.02) | 16.67(0.02) | Swope | ||
| 2013 Feb. 5 | 56328.29 | 26.0 | 18.19(0.03) | 17.12(0.02) | 19.51(0.06) | 17.74(0.02) | 16.93(0.02) | 16.89(0.02) | Swope | ||
| 2013 Feb. 6 | 56328.80 | 26.5 | 18.14(0.04) | 17.14(0.02) | 16.97(0.03) | 16.68(0.02) | TNT | ||||
| 2013 Feb. 7 | 56330.25 | 28.0 | 18.39(0.02) | 17.34(0.02) | 19.63(0.17) | 18.04(0.03) | 17.14(0.02) | 17.07(0.01) | Swope | ||
| 2013 Feb. 14 | 56337.39 | 35.0 | 18.65(0.03) | 17.67(0.03) | 18.28(0.03) | 17.48(0.02) | 17.48(0.02) | Swope | |||
| 2013 Feb. 16 | 56338.66 | 36.4 | 18.87(0.07) | 17.78(0.05) | 17.44(0.02) | 17.46(0.02) | TNT | ||||
| 2013 Feb. 21 | 56344.25 | 42.0 | 18.77(0.03) | 17.85(0.03) | 18.47(0.03) | 17.85(0.02) | 17.76(0.02) | Swope | |||
| 2013 Mar. 2 | 56353.32 | 51.0 | 19.06(0.04) | 18.13(0.03) | 20.55(0.26) | 18.67(0.03) | 18.15(0.02) | 18.23(0.02) | Swope | ||
| 2013 Mar. 9 | 56360.30 | 58.0 | 18.51(0.02) | Swope | |||||||
| 2013 Mar. 16 | 56367.26 | 65.0 | 19.31(0.03) | 18.57(0.03) | 18.74(0.02) | 18.78(0.03) | 18.71(0.03) | Swope |
| UT Date | MJD | PhaseaaRelative to the epoch of -band maximum (MJD = 56302.3) in the frame of the observer. | Range(Å) | Resolution(Å)bbApproximate spectral resolution (FWHM intensity). | Instrument |
|---|---|---|---|---|---|
| 2013 Jan. 5 | 56297.0 | 5.3 | 3500-8800 | 3 | LJT YFOSC |
| 2013 Jan. 5 | 56297.8 | 4.5 | 3500-8500 | 5 | XLT BFOSC |
| 2013 Jan. 6 | 56298.3 | 4.0 | 8000-25800 | 4-16 | Magellan Baade Telescope FIRE |
| 2013 Jan. 7 | 56299.3 | 3.0 | 3500-9500 | 2 | du Pont WF |
| 2013 Jan. 8 | 56300.8 | 1.5 | 3400-8700 | 5 | XLT BFOSC |
| 2013 Jan. 10 | 56302.3 | 0.0 | 3500-9500 | 2 | du Pont WF |
| 2013 Jan. 12 | 56304.0 | 1.7 | 3500-8800 | 3 | LJT YFOSC |
| 2013 Jan. 20 | 56312.0 | 9.7 | 3500-8800 | 3 | LJT YFOSC |
| 2013 Feb. 1 | 56324.8 | 22.5 | 4200-8800 | 5 | XLT BFOSC |
| 2013 Feb. 2 | 56325.2 | 22.9 | 8000-25800 | 4-16 | Magellan Baade Telescope FIRE |
| 2013 Feb. 3 | 56327.1 | 24.8 | 3500-9000 | 3 | NOT ALFOSC |
| 2013 Feb. 5 | 56328.3 | 26.0 | 8000-25800 | 4-16 | Magellan Baade Telescope FIRE |
| 2013 Feb. 15 | 56338.7 | 36.4 | 3700-8700 | 5 | XLT BFOSC |
| 2013 Feb. 18 | 56341.3 | 39.0 | 3300-9500 | 3 | du Pont BC |
| UT Date | MJD | PhaseaaRelative to the epoch of -band maximum (MJD = 56302.3) in the frame of the observer. | Magnitude | Error |
|---|---|---|---|---|
| 2012 Dec. 30 | 56290.80 | 11.5 | 17.97 | 0.24 |
| 2013 Jan. 1 | 56292.80 | 9.5 | 17.03 | 0.20 |
| 2013 Jan. 3 | 56294.50 | 7.8 | 16.20 | 0.18 |
| 2013 Jan. 24 | 56315.50 | 13.2 | 15.75 | 0.19 |
| 2013 Jan. 24 | 56315.50 | 13.2 | 15.84 | 0.19 |
| 2013 Jan. 27 | 56318.50 | 16.2 | 16.17 | 0.21 |
| SN 2012ij | ||
|---|---|---|
| RA(J2000) | 11h40m15s.84 | |
| Dec(J2000) | +17∘2722.2 | |
| Date of (MJD) | 56302.3 0.3 | |
| 0.0235 | ||
| 1.86 0.05 (mag) | ||
| 0.53 0.06 | ||
| Redshift | 0.011 | |
| Distance modulus | 33.54 0.15 (mag) | |
| 15.67 0.01 (mag) | ||
| 17.95 0.15 (mag) | ||
| pEW(Si ii 5972) | 54 3 (Å) | |
| pEW(Si ii 6355) | 109 4 (Å) | |
| Host mophology | S0/a |
| name | (mag) | (mag) | host morphology | Ref.aa91T-like SN. | |
|---|---|---|---|---|---|
| SN1986G | 0.54 | 17.76 0.32 | 1.69 | S0 | 4 |
| SN1991bg | 0.34 | 16.85 0.34 | 1.92 | E1 | 5,6 |
| SN1997cn | 0.40 | 17.17 0.2 | 1.84 | E | 7 |
| SN1998de | 0.36 | 16.74 0.19 | 1.91 | S0/a | 9,10 |
| SN1999by | 0.43 | 17.17 0.26 | 1.88 | Sb | 8,10,11 |
| SN1999da | 0.37 | 16.68 0.22 | 2.11 | E | 10,11 |
| SN2002cf | 0.40 | 17.46 | 1.78 | E/S0 | 10 |
| SN2002dl | 0.55 | 18.33 | 1.82 | Sbc | 11 |
| SN2002es | 0.60 | 17.78 0.12 | 1.28 | S0 | 11 |
| SN2002fb | 0.57 | 17.24 | 2.02 | E | 11 |
| SN2003gs | 0.45 | 17.94 0.29 | 1.88 | SB0 | 10,11,12 |
| SN2003Y | 0.40 | 16.7 | 1.95 | S0 | 10,11 |
| SN2005Maa91T-like SN. | 1.21 | 19.5 | 0.799 | S? | 1,19 |
| SN2005bl | 0.39 | 17.24 0.34 | 1.93 | E | 1 |
| SN2005ke | 0.42 | 17.0 0.2 | 1.85 | Sa | 1 |
| SN2006em | 0.31 | 16.8 | 1.80 | E | 10 |
| SN2006gt | 0.56 | 18.2 | 1.99 | E | 1 |
| SN2006H | 0.60 | 16.6 | 2.28 | S0 | 13 |
| SN2006hb | 0.66 | 18.3 | 1.78 | E | 1 |
| SN2007ba | 0.55 | 17.8 | 1.91 | S0/a | 1 |
| SN2008R | 0.60 | 18.5 | 1.78 | SA0 | 1 |
| SN2009dcbbsuper-Chandrasekhar SN. | 1.29 | 20.22 0.3 | 0.71 | S0 | 2 |
| SN2015bp | 0.63 | 17.9 | 1.62 | E | 3 |
| SN2017fzw | 0.63 | 17.4 | 1.88 | SB0 | 3 |
References. — 1 - Burns et al. (2014); 2 - Ashall et al. (2020); 3 - Brown et al. (2014); 4 - Phillips et al. (1987); 5 - Leibundgut et al. (1993); 6 - Turatto et al. (1996); 7 - Turatto et al. (1998); 8 - Garnavich et al. (2004); 9 - Modjaz et al. (2001); 10 - Silverman et al. (2012); 11 - Ganeshalingam et al. (2010); 12 - Krisciunas et al. (2009); 13 - Hicken et al. (2009). Some data are obtained through the Open Supernova Catalog (Guillochon et al., 2017).
| Object | t(days) | pEW(Ti ii)(Å) | ||
|---|---|---|---|---|
| SN2007ax | 0.36(0.041) | 4.17(0.21) | 221 | 0.22(0.01) |
| SN2005ke | 0.42(0.040) | 2.8(0.205) | 264 | 0.27(0.01) |
| SN2011jq | 0.5(0.041) | 0.89(0.178) | 0.32(0.03) | |
| SN2012ij | 0.53(0.04) | 0.06(0.16) | 196 | 0.34(0.01) |
| SN2007ba | 0.54(0.041) | 0.48(0.23) | 232 | 0.39(0.04) |
| SN2006gt | 0.56(0.04) | 0.81(0.24) | 144 | 0.38(0.01) |
| SN2007on | 0.57(0.04) | 1.99(0.22) | 91 | 0.40(0.01) |
| iPTF13ebh | 0.61(0.04) | 1.3(0.11) | 0.40(0.04) | |
| SN2004gs | 0.70(0.04) | 1.9(0.40) | 120 | 0.45(0.01) |
| SN2006ob | 0.72(0.04) | 1.2(0.41) | 36 | 0.45(0.01) |
| SN2006bh | 0.80(0.04) | 3.59(0.23) | 0.50(0.01) | |
| SN2004ey | 1.01(0.04) | 2.98(0.16) | 70 | 0.50(0.01) |
References. — The and t are obtained from Ashall et al. (2020)
.