PETS-SWINF: A regression method that considers images with metadata based Neural Network for pawpularity prediction on 2021 Kaggle Competition "PetFinder.my"
Abstract
Millions of stray animals suffer on the streets or are euthanized in shelters every day around the world. In order to better adopt stray animals, scoring the pawpularity (cuteness) of stray animals is very important, but evaluating the pawpularity of animals is a very labor-intensive thing. Consequently, there has been an urgent surge of interest to develop an algorithm that scores pawpularity of animals. However, the dataset in Kaggle not only has images, but also metadata describing images. Most methods basically focus on the most advanced image regression methods in recent years, but there is no good method to deal with the metadata of images. To address the above challenges, the paper proposes an image regression model called PETS-SWINF that considers metadata of the images. Our results based on a dataset of Kaggle competition, "PetFinder.my", show that PETS-SWINF has an advantage over only based images models. Our results shows that the RMSE loss of the proposed model on the test dataset is 17.71876 but 17.76449 without metadata. The advantage of the proposed method is that PETS-SWINF can consider both low-order and high-order features of metadata, and adaptively adjust the weights of the image model and the metadata model. The performance is promising as our leadboard score is ranked 18 out of 3537 teams for 2021 Kaggle competition on the challenge "PetFinder.my".
keywords:
Deep learning, Factorization machines , Recommender systems , Fusion , Image regression , Metadata1 Introduction
With the development of computers and the application of machine learning, computer vision is one of the hottest research fields in the data science world [1]. Image regression [2] is different from image classification in that it requires the model to give a continuous predicted value rather than a discrete value. There are few researches on image regression, but in recent years the problem of "facial beauty prediction" (FBP) has been attracting a lot of interest in the pattern recognition and machining learning communities [3, 4, 5, 6], and its basic research has contributed to the rapid development of the plastic surgery and cosmetic industry, such as cosmetic recommendations, aesthetic surgical planning, facial postural analysis, and facial beautification [7, 8].
But apart from human faces, cute animals also attract people’s attention, which is why more and more people like to keep pets. At the same time, millions of stray animals suffer on the streets or are euthanized in shelters every day around the world [9, 10]. It would be great if more stray animals can be adopted by caring people as their pets. So if there is an algorithm that scores images of animals based on “facial beauty predictions”, we are able to accurately determine a pet photo’s attraction and suggest improvements to give these rescued animals a higher chance of loving homes.
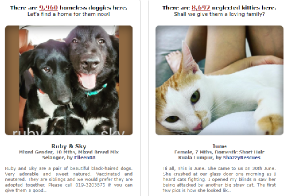
The objective of Pawpularity Contest111https://www.kaggle.com/c/petfinder-pawpularity-score/ is to help us better understand, analyze, and enhance the pet photos. This would not only help the animals find loving homes faster, but also free up shelter and rescuer resources to assist more needy animals. The situation has become more dire due to the Coronavirus disease, as shelters are overwhelmed with animals and resources are limited. In this competition, we analyze raw images and metadata to predict the “Pawpularity” (cuteness, related to click-through rate) of stray animals. We train and test our model on PetFinder.my’s222https://www.petfinder.my/ thousands of pet profiles, as shown in Fig. 1.
Literature Review: Image regression differs from image recognition models as a continuous predictive output is requires, instead of a discrete one. This category of tasks are rare, where most of them target at "human facial beauty prediction" such as [8] and [11]. L Xu et al. proposed a new network framework, Classification and Regression Network (CRNet) [12], which uses different branches to handle classification and regression tasks simultaneously. Adapting rich deep features to facial beauty prediction has been applied as feature extraction techniques reported in [13] and [14]. A residue-in-residual (RIR) structure is proposed to make gradient flow pass deeper and establish a better path for information transmission in “ Deep Learning for Facial Beauty Prediction” [15]. J Gan et al. propose a lighted deep convolution neural network (LDCNN) based on the Inception model of Google-net and max-feature-max activation Layer can extract multi-scale features of images, obtain compressed representation, and reduce parameters [16]. Moreover, score-level fusion methods are proved feasible in recognizing and evaluating animal facial characteristics [17].
Most methods focus on the most advanced image regression methods in recent years, such as Swin-Transformer [18], EfficientNet [19]. but there is few good methods to deal with the metadata of images (some abstract features to describe images, details in A). To address the above challenges, we made two heads for the model, one was predicting pawpularity through images while the other auxiliary head tried to predict pawpularity through metadata. Through the performance on the the validation set to perform the fusion of the two models, we found that the fusion of the metadata model can improve accuracy of prediction. The main contributions of this article are two-fold: (i) We propose an image regression model called PETS-SWINF that considers metadata of the images. (ii) The model we propose can consider both low-order and high-order features of metadata, and adaptively adjust the weights of the image and the metadata model. The proposed method win the in Kaggle competition called 2021 PetFinder.my (currently ranked 18/3537).
The rest of the manuscript is organized as follows: Section 2 briefly introduces the proposed PETS-SWINF. The data analysis is presented in Section 3. Results and disussion of the proposed PETS-SWINF are presented in Section 4. Finally, Section 5 concludes the work.
2 Method
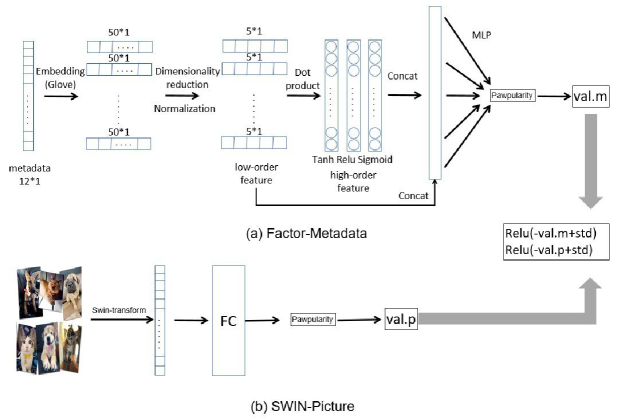
This problem is essentially a regression problem through images and metadata. Here we use two single-task learning to regress the images and metadata separately, and then give the both models weights to integrate the model. We use Swin Transformer to model the image regression [18]. Metadata model is inspired by the idea of DeepFM [20] for regression. Then the weights of the two models are obtained based on the loss of the validation set, and the fusion is carried out. There are three fundamental steps involved in the proposed regression system- images regression, metadata regression and parallelly fusion. These steps are shown in Fig. 2.
2.1 Metadata regression
The flowchart of the metadata model is as shown in Fig. 2 (a). We aim to learn both low-order and high-order features of the metadata. Since metadata have semantic information, we use NLP trained model embedding (here we use Glove [21]) instead of processing the original metadata directly. The reason is that the original metadata (0 or 1) are not sufficient resulting in the failure to restore the real input information well if dealing with original metadata. Given the sparsity of the original data and in order to reduce the latter computational cost, MLP is used for dimensionality reduction, and each feature is normalized to obtain low-level features. Next, each low-level feature is dotted product with all other low-level features,
| (1) |
where is the representation of the lower-order features ( is the number of the metadata, is the reduced dimensionality). Then we flatten the high-order features , and multiple nonlinear activation functions are applied to the high-order features. At last the high-order features and low-order features are concatenated together.
The reason for concatenation is that it’s not clear whether low-level features or high-level features determine the final regression value. This depends on the target problem. One of the advantages of this network is that model can learn high-order features and low-order features based on the characteristics of the dataset. If the two low-order features are very similiar, then the corresponding high-order feature is close to 1. The similarity here takes into account the cosine similarity of the Glove model. The high-order features are acted by the activation function and can have the ability to the stronger non-linear expression. After the high-order features and low-order features are concatenated, MLP is used for regression at last. Finally the RMSE loss of the validation set is obtained. Here, the loss functions of the validation set and the training set both use RMSE.
2.2 Images regression
Swin-Transformer [18] is adopted as the backbone network for pawpularity regression. The flowchart of the images model is as shown in Fig. 2 (b). We put images into Swin-Transformer, and then use MLP for regression. After our experiment, we found that the loss function of BCE is better than RMSE, so here we use BCE loss as the training loss and RMSE loss as the validation loss. The BCE loss formula is as follows,
| (2) |
where is the number of the data, and and is the model prediction and the label of the data.
Label of the data is normalized to 0 to 1, although the origin label of the data is integer 0 to 100. Pretrained model of Swin-transformer is used before training. The configuration of Swin-Transformer will be introduced in the Section 4.
2.3 Parallelly fusion
Since two single models are used, we need to assign weights to each single model. We use the performance of the two models on the validation set to determine the weight distribution. The weight distribution adopts the following method,
| (3) |
| (4) |
where and are the RMSE loss of the validation on the metadata and the image respectively. selected as the standard is the deviation of the training data. The reason why std is used as a standard value is that if the mean of the label on training dataset is used as the prediction, then the RMSE will equal to ,
where is the number of the training data, and is the mean pawpularity of the training data. Therefore, if we use the mean value as a prediction, the RMSE loss of this model that does not require training is actually when is enough. So we take as the worst model performance. If RMSE loss function on the validation set is smaller than , the more weight is given. If the loss function is greater than , we set the weight of this model to zero, because this model will bring negative effects.
3 Data analysis
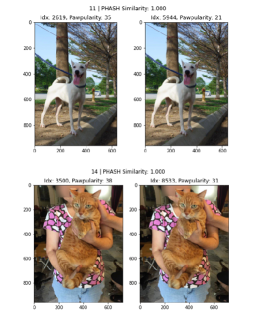
There are 9912 images with metadata in the training set. The details of metadata will be introduced in A. We find there are duplicate images in the training set, and the label of the duplicate image are different. We find the duplicate image by image perceptual hashing (perceptual hashes are "close" to one another if the images are similar). Because the number of the duplicate image is 54 as shown in Fig. 3 (the total number of the images is 9912, a small proportion of the total image), we keep the duplicate images, in order to better make the model learn the noise of the data. Our experiments show that keeping duplicate images performs better on the test set than deleting them 333Data analysis is inspired by https://www.kaggle.com/markwijkhuizen/petfinder-eda-yolov5-obj-detection-tfrecords.
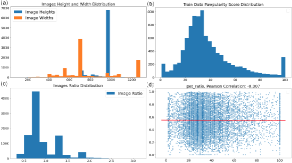
The statistical characteristics of the images are analyzed. We analyzed image height and width distribution, ratio distribution (), and pawpularity distribution on the train data. Fig. 4 (a) and (c) show the size distribution of the images, we can find that most of the images are taken by mobile phones. Fig. 4 (b) shows that the distribution of the pawpularity is similar to the gauss distribution, and the amount of the data pawpularity at both ends is particularly large due to the upper and lower limit. Experiments show that keeping extreme images (pawpularity 100 or 0) is better than deleting them. Fig. 4 (d) shows there is a few correlations between the image ratio and pawpularity.
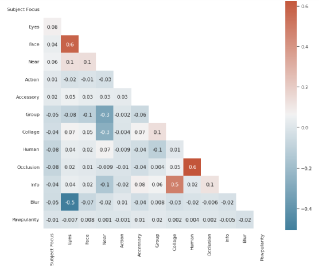
There are 12 features in the metadata detailed in A. We use Correlation Matrix between the meta features and the pawpularity as shown in Fig. 5. We can find that there are a few relations between all the meta-features and particularity. Although the linear correlation between metadata and pawpularity is low, there may exist a nonlinear relationship. Therefore, it is important to design nonlinearities in metadata networks. This is the reason for the design of high-order features.
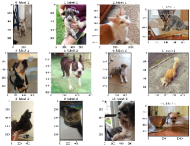
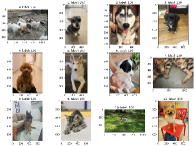
The pawpularity label is derived from each pet profile’s page view statistics at the listing pages, using an algorithm that normalizes the traffic data across different pages, platforms (web & mobile) and various metrics. We visualize the extreme cases as shown in Fig. 6 and Fig. 7. We can find that there is a big difference between the pawpularity and our cognitive loveliness (the image 2 in Fig. 6 should have more pawpularity than its label and the image 8 in Fig. 7 is too average to deserve a full score of 100). The pawpularity score is related to the time the animal started to be shown in web, because the derivation of the pawpularity is strongly related to the traffic.
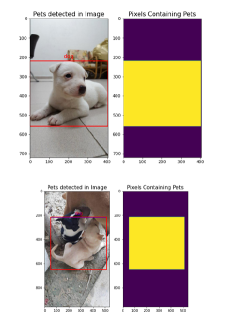
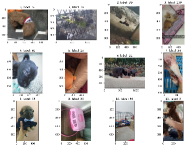
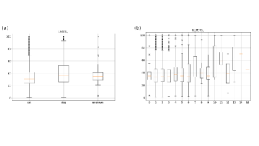
There are only two kinds of animals (dog and cat) in the dataset. It is reasonable that dogs and cats are judged differently. There is no classified information in the dataset, so we use the yolov5 (yolov5x6) in object detection to classify the images. Fig. 8 shows the results of the yolov5 only about cats and dogs and Fig. 9 shows the unknown results of the yolov5. Fig. 10 shows that the boxplot of classifications of the image and the number of the animals in one image both are different.
4 Results and discussion
To conduct our experiments, the proposed PETS-SWINF architecture achieved RMSE 17.71876 with data augmentations on the test dataset, and win the gold medal (currently ranked 12/3393). As shown in Table 1, we compare our results without data augmentations and without metadata.
| Val accuracy | Test accuracy | |
|---|---|---|
| PETS-SWINF without data augmentaions | 17.68121 | 17.88243 |
| PETS-SWINF without metadata | 17.48691 | 17.76449 |
| PETS-SWINF | 17.42164 | 17.71876 |
We use RandomErasing, Rotate, Brightness, Flip, Contrast, Saturation as the data augmentation configuration. Batch size is 40; KFLOD is 10; Learning rate is 2e-5. Swin_large_patch4_window7_224 is adopted as the backbone network for the image regression. TTA (Test-Time Data Augmentation ) as the training data augmentation configuration is used in the inference period.
It can be found from Table 1 that data augmentations and the rational use of metadata improve the accuracy of the validation set and the test set. This is because there are not enough data in the training set, so the data augmentations can have a good effect. In addition, these augmentation techniques have a certain intersection with the nature of the pawpularity prediction problem. Although it can be seen from Fig. 5 that independent metadata have little effect on pawpularity, it cannot be ruled out that some nonlinear combinations of metadata are independent to pawpularity. Therefore, The metadata processing of PETS-SWINF establishes the correlation between nonlinear features (low-order features and high-order features) through the neural network and the cuteness. The model uses the loss of the validation set to perform the weighting fusion, which shows that the weighting method of model fusion is useful from the result of PETS-SWINF without metadata and PETS-SWINF.
5 Conclusion
Millions of stray animals around the world suffer in the streets or are euthanized in shelters every day. If more stray animals can be adopted by caring people as their own pets, it will greatly reduce the number of stray animals. In order to better adopt stray animals, it is nessary to score the pawpularity of stray animals, but evaluating the pawpularity of animals is a very labor-intensive thing. In this study, we proposed a PETS-SWINF architecture, for prediction of the pawpularity from pets images with metadata. The proposed method win the gold medal in Kaggle competition called 2021 PetFinder.my (currently ranked 18/3537 ).
The proposed method is a regression model, which can combines images with metadata. The way of assigning weight can adaptively use images or metadata. In addition, the metadata model can fuse low-order features and high-order features. The proposed PETS-SWINF model is available publicly for open access at https://github.com/yizheng-wang/PETS-SWINF.
The proposed method can be widely used in image regression tasks with metadata, such as CTR (click-through rate prediction). As more and more stray animals are being labeled all around the world, larger datasets are being generated. We will continue to further modify the architecture of the proposed PETS-SWINF and incorporate new available datasets. New versions of the PETS-SWINF will be released upon development through the aforementioned link.
Acknowledgements
The proposed method was inspired by Professor Zhu and Professor Tang in machine learning class 2021. The study was supported by the Major Project of the National Natural Science Foundation of China (12090030). The authors would like to thank Chenxing Li and Yanxi Zhang for helpful discussions.
Appendix A Metadata
-
1.
Focus - Pet stands out against uncluttered background, not too close / far.
-
2.
Eyes - Both eyes are facing front or near-front, with at least 1 eye / pupil decently clear.
-
3.
Face - Decently clear face, facing front or near-front. \item Near - Single pet taking up significant portion of photo (roughly over 50% of photo width or height).
-
4.
Action - Pet in the middle of an action (e.g., jumping).
-
5.
Accessory - Accompanying physical or digital accessory / prop (i.e. toy, digital sticker), excluding collar and leash.
-
6.
Group - More than 1 pet in the photo.
-
7.
Collage - Digitally-retouched photo (i.e. with digital photo frame, combination of multiple photos).
-
8.
Human - Human in the photo. \item Occlusion - Specific undesirable objects blocking part of the pet (i.e. human, cage or fence). Note that not all blocking objects are considered occlusion.
-
9.
Info - Custom-added text or labels (i.e. pet name, description).
-
10.
Blur - Noticeably out of focus or noisy, especially for the pet’s eyes and face. For Blur entries, “Eyes” column is always set to 0.
References
- [1] A. Voulodimos, N. Doulamis, A. Doulamis, E. Protopapadakis, Deep learning for computer vision: A brief review, Computational intelligence and neuroscience 2018 (2018).
- [2] H. Jiang, Y. Gu, Y. Xie, R. Yang, Y. Zhang, Solar irradiance capturing in cloudy sky days–a convolutional neural network based image regression approach, IEEE Access 8 (2020) 22235–22248.
- [3] J. Saeed, A. M. Abdulazeez, Facial beauty prediction and analysis based on deep convolutional neural network: A review, Journal of Soft Computing and Data Mining 2 (1) (2021) 1–12.
- [4] H. Gunes, A survey of perception and computation of human beauty, in: Proceedings of the 2011 joint ACM workshop on Human gesture and behavior understanding, 2011, pp. 19–24.
- [5] A. Laurentini, A. Bottino, Computer analysis of face beauty: A survey, Computer Vision and Image Understanding 125 (2014) 184–199.
- [6] D. Zhang, F. Chen, Y. Xu, et al., Computer models for facial beauty analysis, Springer, 2016.
- [7] F. Chen, X. Xiao, D. Zhang, Data-driven facial beauty analysis: prediction, retrieval and manipulation, IEEE Transactions on Affective Computing 9 (2) (2016) 205–216.
- [8] T. J Iyer, R. Nersisson, Z. Zhuang, A. N. Joseph Raj, I. Refayee, et al., Machine learning-based facial beauty prediction and analysis of frontal facial images using facial landmarks and traditional image descriptors, Computational Intelligence and Neuroscience 2021 (2021).
- [9] K. A. Anderson, J. C. Brandt, L. K. Lord, E. A. Miles, Euthanasia in animal shelters: Management’s perspective on staff reactions and support programs, Anthrozoös 26 (4) (2013) 569–578.
- [10] A. YİĞİT, G. ASLIM, C. Hilal, Evaluation on shelter medicine and stray animal shelters in turkey, Kafkas Üniversitesi Veteriner Fakültesi Dergisi 26 (1) (2020).
- [11] L. Štěpánek, P. Kasal, J. Mestak, Evaluation of facial attractiveness for purposes of plastic surgery using machine-learning methods and image analysis, in: 2018 IEEE 20th International Conference on e-Health Networking, Applications and Services (Healthcom), IEEE, 2018, pp. 1–6.
- [12] L. Xu, J. Xiang, X. Yuan, Crnet: Classification and regression neural network for facial beauty prediction, in: Pacific Rim Conference on Multimedia, Springer, 2018, pp. 661–671.
- [13] L. Xu, J. Xiang, X. Yuan, Transferring rich deep features for facial beauty prediction, arXiv preprint arXiv:1803.07253 (2018).
- [14] I. Lebedeva, Y. Guo, F. Ying, Deep facial features for personalized attractiveness prediction, in: Thirteenth international conference on digital image processing (ICDIP 2021), Vol. 11878, International Society for Optics and Photonics, 2021, p. 118780A.
- [15] K. Cao, K.-n. Choi, H. Jung, L. Duan, Deep learning for facial beauty prediction, Information 11 (8) (2020) 391.
- [16] J. Gan, K. Jiang, H. Tan, G. He, Facial beauty prediction based on lighted deep convolution neural network with feature extraction strengthened, Chinese Journal of Electronics 29 (2) (2020) 312–321.
- [17] S. Taheri, Ö. Toygar, Animal classification using facial images with score-level fusion, IET computer vision 12 (5) (2018) 679–685.
- [18] Z. Liu, Y. Lin, Y. Cao, H. Hu, Y. Wei, Z. Zhang, S. Lin, B. Guo, Swin transformer: Hierarchical vision transformer using shifted windows, arXiv preprint arXiv:2103.14030 (2021).
- [19] M. Tan, Q. Le, Efficientnet: Rethinking model scaling for convolutional neural networks, in: International Conference on Machine Learning, PMLR, 2019, pp. 6105–6114.
- [20] H. Guo, R. Tang, Y. Ye, Z. Li, X. J. a. p. a. He, Deepfm: a factorization-machine based neural network for ctr prediction (2017).
- [21] J. Pennington, R. Socher, C. D. Manning, Glove: Global vectors for word representation, in: Proceedings of the 2014 conference on empirical methods in natural language processing (EMNLP), 2014, pp. 1532–1543.