[1]Priyanka Nanayakkara
Visualizing Privacy-Utility Trade-Offs in Differentially Private Data Releases
Abstract
Organizations often collect private data and release aggregate statistics for the public’s benefit. If no steps toward preserving privacy are taken, adversaries may use released statistics to deduce unauthorized information about the individuals described in the private dataset. Differentially private algorithms address this challenge by slightly perturbing underlying statistics with noise, thereby mathematically limiting the amount of information that may be deduced from each data release. Properly calibrating these algorithms—and in turn the disclosure risk for people described in the dataset—requires a data curator to choose a value for a privacy budget parameter, . However, there is little formal guidance for choosing , a task that requires reasoning about the probabilistic privacy–utility trade-off. Furthermore, choosing in the context of statistical inference requires reasoning about accuracy trade-offs in the presence of both measurement error and differential privacy (DP) noise.
We present Visualizing Privacy (ViP), an interactive interface that visualizes relationships between , accuracy, and disclosure risk to support setting and splitting among queries. As a user adjusts , ViP dynamically updates visualizations depicting expected accuracy and risk. ViP also has an inference setting, allowing a user to reason about the impact of DP noise on statistical inferences. Finally, we present results of a study where 16 research practitioners with little to no DP background completed a set of tasks related to setting using both ViP and a control. We find that ViP helps participants more correctly answer questions related to judging the probability of where a DP-noised release is likely to fall and comparing between DP-noised and non-private confidence intervals.
1 Introduction
Preserving people’s privacy is often necessary when releasing statistics about sensitive data. For example, many data curators currently seeking to de-identify patient data rely on anonymization techniques like -anonymity Sweeney (\APACyear2002), which requires that information for each person in the released dataset cannot be distinguished from at least individuals whose information also appear in the release. This property is usually achieved by suppressing some sensitive record values or generalizing these values to a broader category, and can be easily implemented by specifying a value for . can then be applied to any dataset release. However, -anonymity has been shown to perform poorly Almasi \BOthers. (\APACyear2016) and may allow adversaries to gain unauthorized information about sensitive patient records Ganta \BOthers. (\APACyear2008); Wong \BOthers. (\APACyear2007).
Alternatively, releasing statistics under differential privacy (DP) Dwork \BOthers. (\APACyear2006); Dwork \BBA Roth (\APACyear2014) makes it possible to provide strong privacy guarantees for individuals whose information resides in a dataset while still gleaning meaningful insights about the data. In particular, differentially private mechanisms for simple summary statistics (e.g., the mean of a quantitative variable) typically add a calibrated amount of random noise to the underlying statistic (the “query result”), reducing the disclosure risk of individuals in the dataset while making it possible to learn about the group in aggregate. Importantly, DP achieves security in the face of an attacker that has access to a portion of the data and has strong composition properties that allow for unlimited post-processing, along with strict bounds on multiple releases. As such, DP has become the gold standard of privacy-preserving data releases, and has been deployed by government (e.g., the U.S. Census Bureau Machanavajjhala \BOthers. (\APACyear2008); Abowd (\APACyear2018); Hawes (\APACyear2020)) and tech companies when publishing or otherwise using user data Messing \BOthers. (\APACyear2020); Herdağdelen \BOthers. (\APACyear2020); Bavadekar \BOthers. (\APACyear2020); Aktay \BOthers. (\APACyear2020); Bavadekar \BOthers. (\APACyear2021); Rogers \BOthers. (\APACyear2020); \APACcitebtitleAssistive AI Makes Replying Easier (\APACyear2020). There are also multiple open-source software projects Gaboardi \BOthers. (\APACyear2020); \APACcitebtitleEnabling developers and organizations to use differential privacy (\APACyear2019); Holohan \BOthers. (\APACyear2019) aimed at making it easier to conduct differentially private analyses.
However, applying differentially private algorithms is challenging. Even with support from DP experts, there are numerous ways that such algorithms can be misused and result in unintentional data leaks Haeberlen \BOthers. (\APACyear2011); Kifer \BBA Machanavajjhala (\APACyear2011); Mironov (\APACyear2012); Tang \BOthers. (\APACyear2017). One of the primary requirements of differentially private algorithms is setting a value for an abstract “privacy budget” parameter , which calibrates the amount of expected noise added to a query result. is inversely related to expected noise, and therefore directly related to accuracy (used interchangeably with utility in this work). Increased values also correspond to weaker privacy guarantees. In sum, setting is a challenging task, for which there is no widely accepted solution Dwork \BOthers. (\APACyear2019).
To select a value for for a given data release, a data curator must negotiate two mutually antagonistic goals: producing highly accurate results and providing strong privacy guarantees. Because the impacts on accuracy and disclosure risk for different values are probabilistic, they must consider distributions of possible releases. Moreover, while many DP tools have treated the un-noised query result as a point value, in many settings data are used to support statistical inference, e.g., to make extrapolations from a query result on a sample to a population. Hence, the data curator may also want to release a privacy-preserving confidence interval (CI) for a population parameter. In such cases, when selecting , the data curator must consider the implications of added DP noise along with the impacts of measurement (e.g., sampling) error on the target inference.
Prior work has explored methods for setting based on accuracy requirements Ge \BOthers. (\APACyear2019) and maximum disclosure risk requirements Lee \BBA Clifton (\APACyear2011). However, with a few exceptions (e.g., Gaboardi \BOthers. (\APACyear2018); Hay \BOthers. (\APACyear2016); Thaker \BOthers. (\APACyear2020); Bittner \BOthers. (\APACyear2020); St. John \BOthers. (\APACyear2021)), research on DP has largely overlooked the importance of providing easy-to-interpret interfaces for differentially private algorithms. As DP becomes more common among organizational data releases, the design and evaluation of graphical user interfaces for making decisions about privacy budgets will likely be critical to its popular success. In particular, for DP to be adopted across domains, and by smaller organizations that lack resources to hire DP experts, data curators are likely to benefit from tools that help them reason about key probabilistic relationships in DP (e.g., between , accuracy, and disclosure risk) so that they can effectively choose . For broad use, such tools should also support scenarios that involve using DP in the context of statistical inference, since data are often treated as a proxy for estimating unseen real world phenomena.
To this end, we introduce Visualizing Privacy (ViP), an interactive visualization tool for choosing targeted toward clinical health researchers releasing aggregate statistics on sensitive data. We focus on the clinical research use case due to its strict privacy needs, strong statistical background of practitioners, and lack of experience with DP by practitioners in this area. However, we expect this use case to generalize to other settings with similar distributions of responsibility across stakeholder roles and requirements.
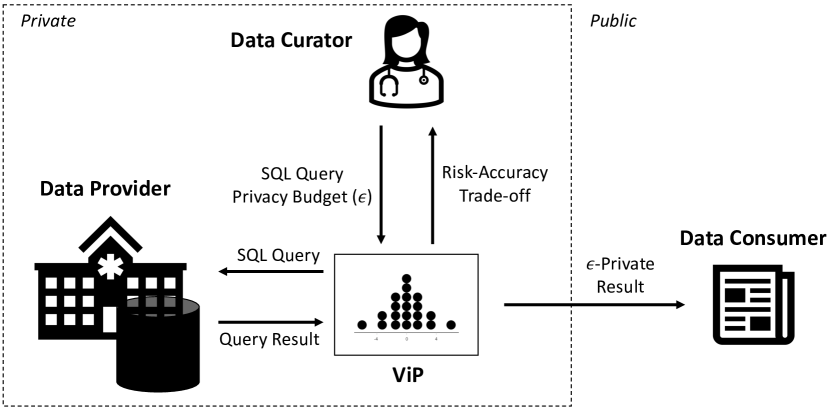
Figure 1 depicts the user roles and workflow of a privacy-preserving data release. The data provider refers to a hospital that collects and stores private patient records. The data curator refers to a clinical health researcher who writes queries to be executed over the data provider’s data. The data curator is responsible for selecting values for these queries. They may lack specific DP knowledge but are experienced with analyzing sensitive data, including those where specific regulations apply (e.g., HIPAA111Health Insurance Portability and Accountability Act compliance). Finally, the data consumer is a medical journal or publication (alternatively, members of the public who may read the publication). They receive the privacy-preserving release, and unlike the data provider and data curator, are not permitted to access private patient records.
The workflow begins with the data curator providing a SQL query to ViP for analysis. ViP passes the query to the data provider who executes the query over their private data and returns a precise query result. Using the result, ViP generates visualizations for the data curator, who then interactively sets different values for to understand the resulting privacy–utility trade-off. When the data curator chooses an appropriate privacy budget, ViP uses it to generate the privacy-preserving data release ready for public consumption.
Contributions. In this work we introduce ViP, an interface aimed at helping users make decisions about by visualizing key probabilistic relationships in DP. Our first contribution is a novel interactive visualization interface for privacy budget selection that decomposes and expresses probabilistic DP guarantees using discrete visualizations of distributions Hullman \BOthers. (\APACyear2015); Kale \BOthers. (\APACyear2018); Kay \BOthers. (\APACyear2016); Fernandes \BOthers. (\APACyear2018) to help data curators reason about the accuracy and risk associated with hypothetical noised query outputs. ViP also presents the impact of different values on CIs constructed under DP (with non-private CIs shown for reference) to support the –selection task when statistical inference is required. We further contribute the results of an evaluative user study of the interface with 16 research practitioners with little to no DP experience. We find that the interface helps participants give more correct answers to questions related to judging where a privacy-preserving release is likely to fall and comparing between privacy-preserving and non-private CIs.
2 Background
We introduce a motivating example for ViP based in the context of clinical research. Next, we describe the main features of DP used in this paper. Last, we describe prior research in considering sampling error in a DP context.
2.1 Motivating Scenario
We developed a motivating scenario as part of an ongoing collaboration with colleagues at Northwestern University Feinberg School of Medicine. Our use case is grounded in the current practices of professionals in clinical research who query electronic health records in many of their studies and release aggregate statistics derived from private data. To publish their findings, these experts must complete strict de-identification procedures using techniques such as HIPAA Safe Harbor or -anonymity via expert determination. If they fail to follow these procedures, they may be subject to repercussions including fines and loss of access to data.
The scenario we consider has three roles: 1) data provider, 2) data curator, and 3) data consumer. As seen in Figure 1, the data provider is a hospital that maintains a dataset containing private health records describing their patients. The data curator is a clinical researcher with access to the private dataset. They write queries and intend to publish their results in a medical journal. Finally, the data consumer is an outside party, such as a research journal, and does not have access to private health records but receives the results published by the data curator.
In this setting, the data provider and data curator have access to private records, while the data consumer is a limited adversary. This means that the data consumer will not maliciously interfere with the data computation or release, but may attempt to re-identify private records using the released query result.
When conducting clinical health research, the data curator writes aggregate SQL queries of the form:
  SELECT AGGREGATE([DISTINCT] *)
  FROM <table>
  [GROUP BY <attribute>]
  [WHERE <condition>]
In this work, we focus on COUNT aggregate queries, but can generalize to other aggregate functions such as SUM or AVG by adapting the methods accordingly. The data curator may also combine multiple aggregate queries to determine results such as top– or probability of superiority. They then run these queries over the data stored in the database. The hospital database schema may contain both protected health information (PHI) and non-PHI Kho \BOthers. (\APACyear2014).
After receiving query results, the data curator wishes to release them to the data consumer. The data curator must satisfy two competing goals. First, the query results must not reveal any information that can be used to deduce with too high a probability whether any individual patient’s sensitive information was included in the computation. Second, the query results must be specific enough to be useful to the data consumer. In order to satisfy both goals, the data curator must balance accuracy of the release against disclosure risk. ViP is intended to be used by a data curator in choosing an appropriate balance.
2.2 Differential Privacy
Mechanisms that satisfy DP provide a stability guarantee on the output of a function based on changes in the input. Database systems that implement DP leverage this guarantee to release statistics about sensitive data while providing privacy for individuals in the database.
In this work, we use -DP. Formally, its guarantees are as follows:
Definition 1 (-DP).
[-Differential Privacy Dwork \BOthers. (\APACyear2006)] A randomized mechanism satisfies -differential privacy (DP) if for any pair of neighboring databases and that differ by adding or removing one record, and for any , where is the set of all possible outputs, it satisfies:
Note that controls the amount of information leaked about the source data from . Say that is a database that contains a private record and is identical to , except with removed. An adversary sees the released result of , but does not know if or was used as the input. If is very small, then and are almost indistinguishable from each other. This means that it is very difficult for the adversary to learn whether contributed to the released result based on the output of . If is large, then and are easily distinguishable from each other based on the output of . Here, the adversary can easily learn whether contributed to the released result.
As previously described, choosing a value for is a complex task tied to the specific query and data used. Ideally, this decision relies on careful reasoning about the desired balance between risk and accuracy. As later described in Section 4, we use the Laplace mechanism to generate privacy-preserving releases. This mechanism is widely-used for DP and satisfies -DP Dwork \BBA Roth (\APACyear2014) when releasing a function . We use to denote the -sensitivity of the function , that is, the maximum difference in the function output between any pairs of neighboring databases. The difference is measured in terms of the -norm. The Laplace mechanism is defined as follows:
Definition 2 (Laplace Mechanism).
Given a function with -sensitivity , the Laplace mechanism adds to the true answer a vector of independent noise drawn from the Laplace distribution .
A noisy count produced by a Laplace mechanism is centered at the true count and has an -sensitivity of 1. Its possible values are defined by the probability density function (PDF) of the Laplace distribution. (For example, a count query has an -sensitivity of 1. The noisy output of a Laplace mechanism with = 1 for this query follows a Laplace distribution centered at the true count with variance of 2.) As a result, the noisy count can be either smaller or larger than the true count.
When invoking the DP guarantee multiple times over disjoint data, each invocation has access to the full privacy budget McSherry (\APACyear2009). This gives a privacy guarantee that is constant in relation to the number of groups in the query. Hence, as shown in Section 4, the privacy budget does not need to be divided between subgroups in a query in ViP.
Theorem 1 (Parallel Composition).
If are each -DP algorithms and are disjoint subsets of the input domain , then the sequence satisfies -DP.
When processing a result released under DP, no additional privacy loss is incurred. This means that any post-processing step does not consume additional privacy budget. ViP uses this property in Algorithm 1 (described in Section 4.2.2) to calculate privacy-preserving CIs without requiring additional privacy budget to what is used to calculate the privacy-preserving release.
Theorem 2 (Post-Processing Property Dwork \BBA Roth (\APACyear2014)).
Let be an -DP algorithm and let be an arbitrary randomized mapping. Then is -DP.
2.3 Disclosure Risk Under DP
The privacy budget measures the stability of an algorithm, i.e., the smaller the privacy budget, the more stable the algorithm is with respect to a change of a record, and hence a better privacy guarantee. However, the practical implication of the disclosure risk depends on the attack model including the attacker’s prior knowledge about the sensitive information and the measure on the disclosure risk Lee \BBA Clifton (\APACyear2011); Wasserman \BBA Zhou (\APACyear2010); Liu \BOthers. (\APACyear2019); Kifer \BBA Machanavajjhala (\APACyear2012).
In this work, we consider an attack model proposed by Lee \BBA Clifton (\APACyear2011). Their attack model assumes that an adversary knows a database of records and considers a scenario in which one of the records is not used for a computation due to its sensitive value. Before looking at the result of the computation, the adversary has a prior belief that all records have the same probability of being absent from the computation. Then, the disclosure risk is measured by the upper bound on the probability of the adversary correctly guessing the absence/presence of a record in the computation after seeing the computation result. In this model, all records are assumed to be independent.
We consider all possible computation results and database instances of size . The disclosure risk can be computed as such:
Definition 3 (Disclosure Risk).
Given a database of records and an -DP mechanism for a function for this database, the disclosure risk by Lee \BBA Clifton (\APACyear2011) is equal to
We build upon Lee \BBA Clifton (\APACyear2011)’s work by visualizing how this risk varies with changing values for a given query.
2.4 Statistical Inference Under DP
In a non-private setting, uncertainty intervals are used to summarize what values of a target population parameter are consistent with observed data.
Definition 4 (Confidence Interval).
We say that is a -level CI for population parameter if Karwa \BBA Vadhan (\APACyear2017).
In a DP setting, CIs must take into account error from data collection in the form of sampling error while also incorporating DP noise. Karwa \BBA Vadhan (\APACyear2017) introduce mechanisms for calculating a CI under DP for a population mean where the data come from a normal distribution. Biswas \BOthers. (\APACyear2020) extend this work by proposing methods for differentially private mean and covariance calculations for sub-Gaussian data (see Rivasplata (\APACyear2012) for more on sub-Gaussian data).
Brawner \BBA Honaker (\APACyear2018) and Ferrando \BOthers. (\APACyear2020) introduce mechanisms for calculating CIs under DP using statistical bootstrapping methods. Brawner \BBA Honaker (\APACyear2018)’s method calculates standard errors through post-processing, meaning that no additional privacy budget is consumed when determining the CIs. Ferrando \BOthers. (\APACyear2020)’s method, which we use in ViP, generates bootstrapped replicates and uses the and quantiles of the replicates as the respective lower and upper limits of the -CI. Their method is based on the parametric bootstrap and performs post-processing on a DP-noised release.
In contrast to the previous two methods, Du \BOthers. (\APACyear2020)’s methods for calculating CIs under DP require an additional privacy budget cost when calculating standard error. Lastly, Evans \BOthers. (\APACyear2020) consider how to correct inferences after post-processing noisy answers based on public constraints such as non-negative counts or that percentiles must be between 0 and 1. We leave incorporating such approaches into ViP as future work.
2.5 Uncertainty Visualization
Research has found that framing probability as frequency can improve Bayesian reasoning Gigerenzer \BBA Hoffrage (\APACyear1995), including in a visualization context Hullman \BOthers. (\APACyear2015); Kale \BOthers. (\APACyear2018); Kay \BOthers. (\APACyear2016), while research in statistical cognition and pedagogy suggests simulation of probabilistic processes helps people build statistical intuitions Chance \BOthers. (\APACyear2000); Cumming \BBA Thomason (\APACyear1998); delMas \BOthers. (\APACyear1999); Schwarz \BBA Sutherland (\APACyear1997). ViP applies both approaches. Inspired by icon arrays for binary variables, quantile dotplots (see Figure 2) use discrete representations of continuous probability distributions and have been shown to help laypeople make more consistent probability estimates Kay \BOthers. (\APACyear2016) and utility-optimal decisions Fernandes \BOthers. (\APACyear2018). The quantile dotplot shown in Figure 2 is . In particular, quantile dotplots enable quick calculations of the cumulative distribution function (CDF). For the distribution in Figure 2, since only one dot is to the left of and there are dots total.
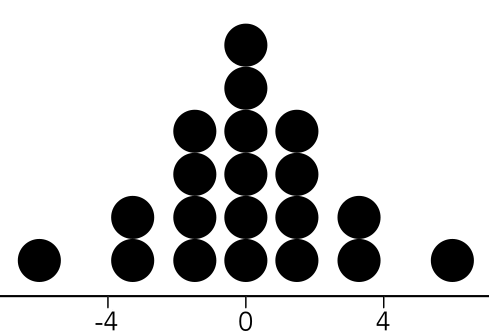
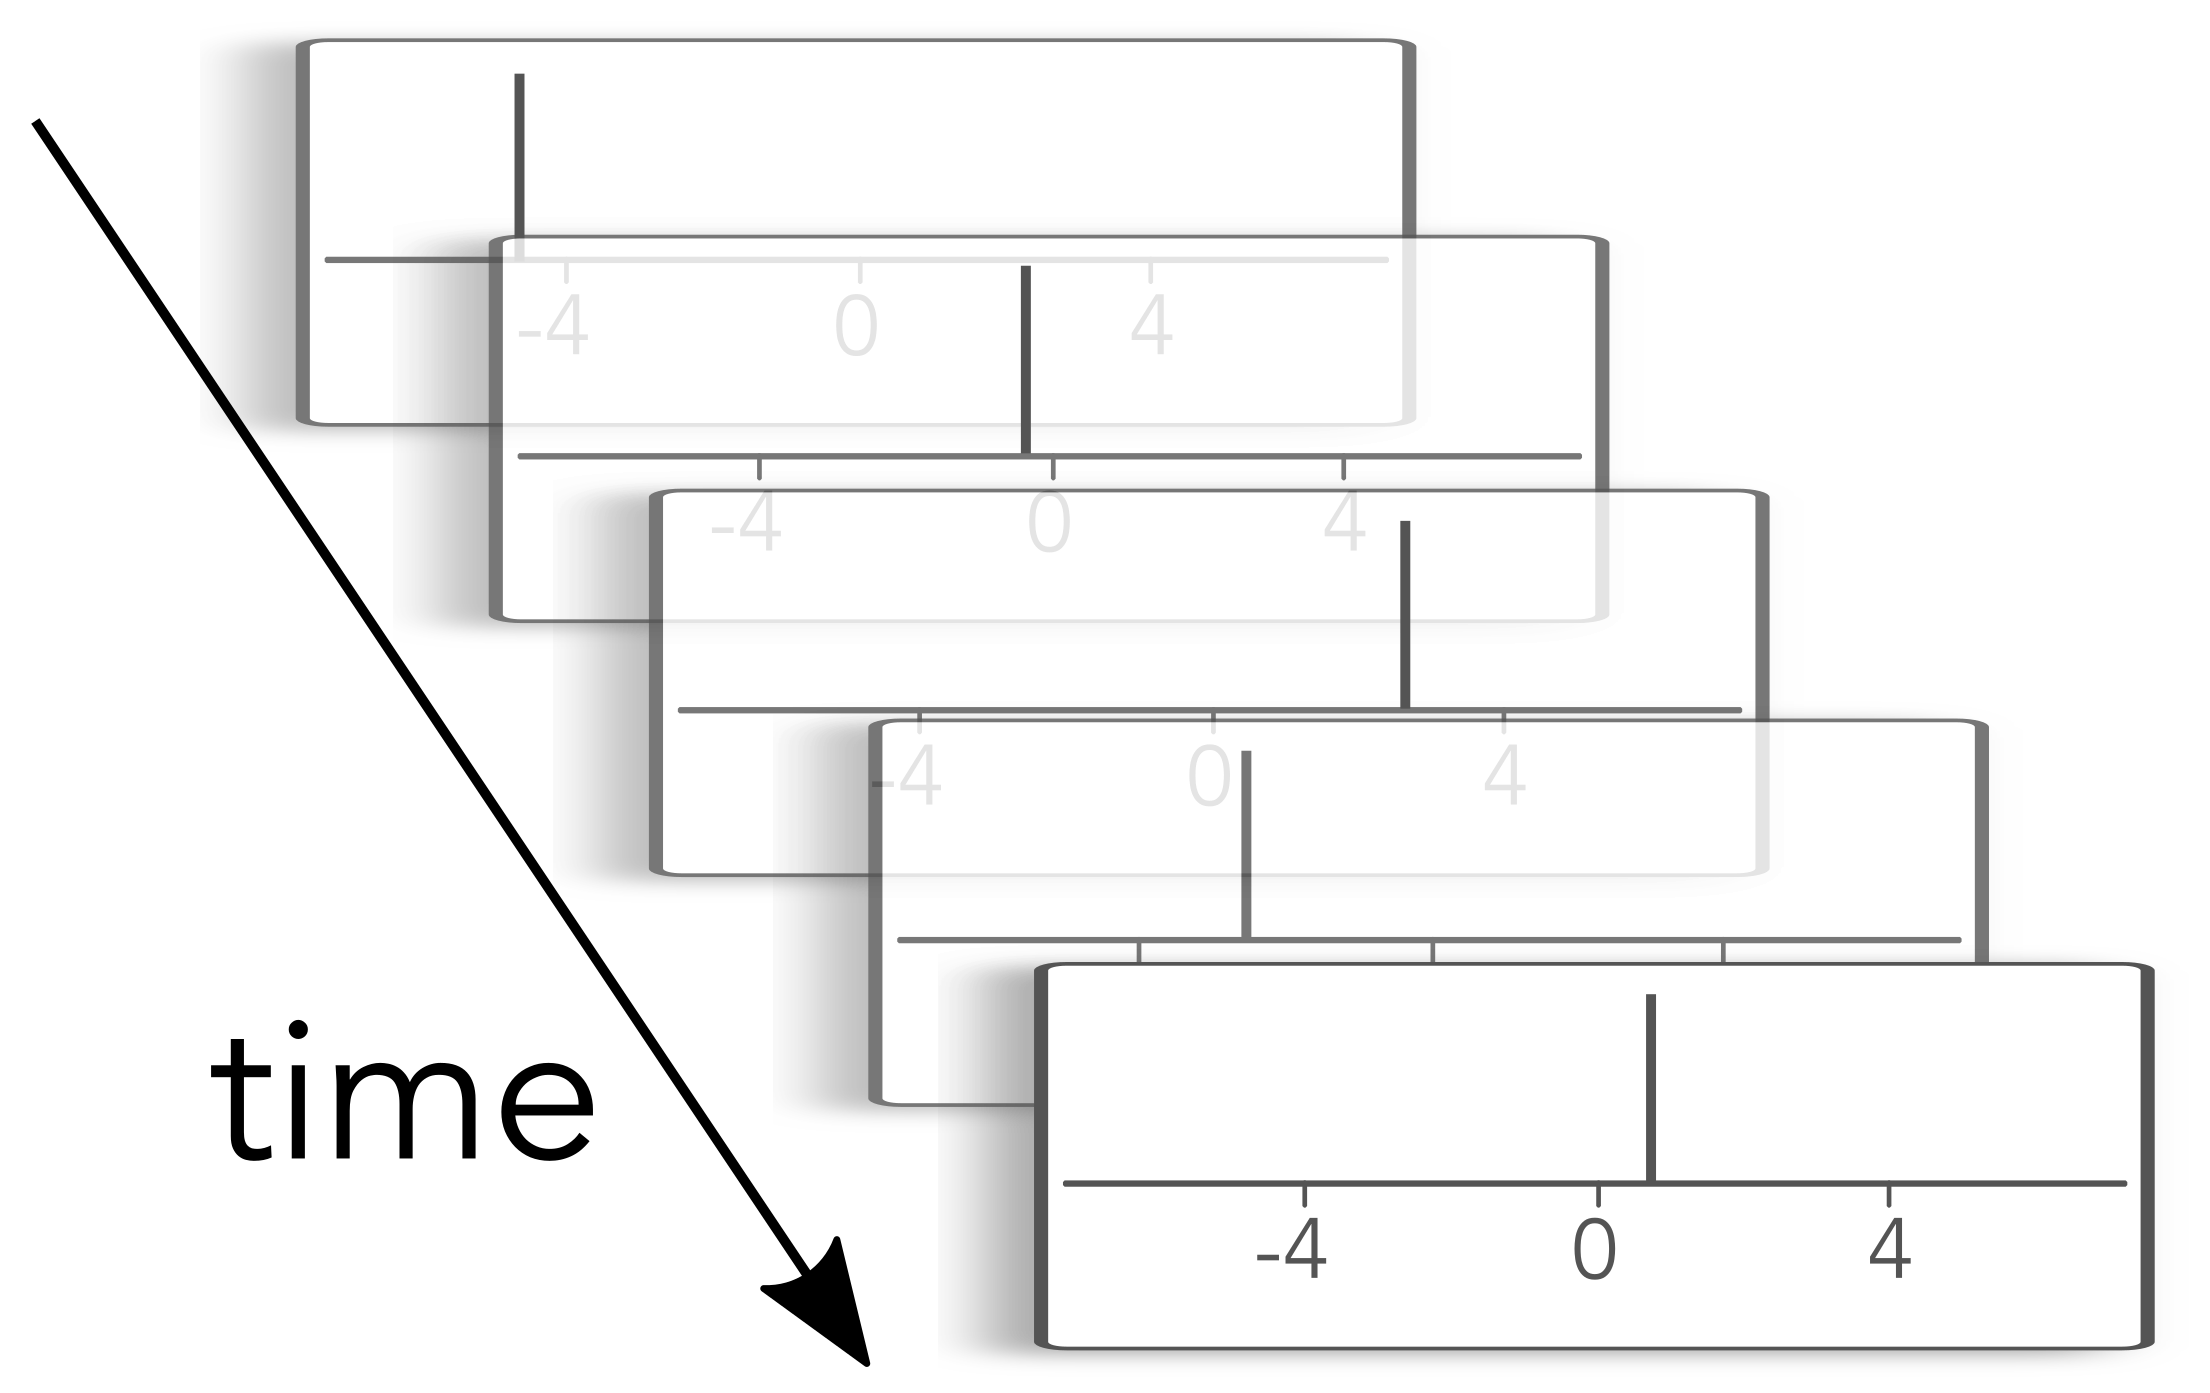
Hypothetical outcome plots (HOPs) Hullman \BOthers. (\APACyear2015) (see Figure 2) present a probability distribution more viscerally by rapidly animating random draws from a distribution one at a time. HOPs avoid the requirement of most uncertainty visualizations of adding an additional visual encoding, and particularly in multivariate probability judgments have been shown to improve probability and effect size estimates over error bars Hofman \BOthers. (\APACyear2020); Hullman \BOthers. (\APACyear2015); Kale \BOthers. (\APACyear2018). The vertical line in each frame in Figure 2 displays a random draw from the distribution shown in Figure 2.
3 Related Work
Existing interface tools for DP, such as DPComp Hay \BOthers. (\APACyear2016), PSI () Gaboardi \BOthers. (\APACyear2018), Bittner \BOthers. (\APACyear2020), Overlook Thaker \BOthers. (\APACyear2020), and DPP St. John \BOthers. (\APACyear2021) provide interfaces for interacting with DP. These systems provide extensive support for many types of queries and provide transformations between DP guarantees and statistical measures of accuracy. DPComp Hay \BOthers. (\APACyear2016) visually compares various differentially private algorithms under a selected privacy budget level for lower-dimensional statistics. Bittner \BOthers. (\APACyear2020)’s interface focuses on showing performance of differentially private versus non-private machine learning applications. Overlook Thaker \BOthers. (\APACyear2020) shows users their query error owing to DP as a function of the selected privacy budget using error bars Thaker \BOthers. (\APACyear2020). PSI () Gaboardi \BOthers. (\APACyear2018) does not have any visualizations, but allows users to select and split a privacy budget across multiple queries for a desired accuracy guarantee based on metadata, a chosen confidence level, and a desired release statistic. DPP St. John \BOthers. (\APACyear2021) visualizes relationships between “risk of data sharing”—a measure that accounts for disclosure risk, level of trust in parties with whom the data are shared, and the damage that may be incurred due to a confidentiality breach—and percent added noise.
We summarize the differences between ViP and related work in Table 1. First, other than DPP, which was developed concurrently as ViP, these systems do not have risk visualization components, and thus do not explicitly visually communicate the privacy–utility trade-off (though they may communicate the relationship between and utility non-visually). Without a visual representation of this trade-off, users cannot see how their privacy budget choices affect disclosure risk and may focus only on optimizing accuracy. Furthermore, providing more immediate visual feedback on how privacy and utility trade off may help make the trade-off more salient Jarvenpaa (\APACyear1990). ViP presents users with a risk visualization linked to an accuracy visualization, allowing them to visually compare and interact with the privacy–utility trade-off.
| Utility | Risk | Uncertainty | Stat. | Budget | |
| Interface | Vis | Vis | Vis | Inference | Splitting |
| DPComp Hay \BOthers. (\APACyear2016) | ✔ | ||||
| Overlook Thaker \BOthers. (\APACyear2020) | ✔ | ✔ | |||
| PSI () Gaboardi \BOthers. (\APACyear2018) | ✔ | ||||
| Bittner \BOthers. (\APACyear2020) | ✔ | ||||
| DPP St. John \BOthers. (\APACyear2021) | ✔ | ✔ | |||
| ViP | ✔ | ✔ | ✔ | ✔ | ✔ |
Second, systems tend not to provide an explicit visualization of the inherent uncertainty in DP mechanisms (e.g., running a mechanism twice with the same inputs can yield different outputs). ViP helps a user reason about hypothetical values a release can take by using discrete representations of distributions that research in uncertainty visualization has found to be effective in supporting probabilistic reasoning Hullman \BOthers. (\APACyear2015); Kale \BOthers. (\APACyear2018); Kay \BOthers. (\APACyear2016).
Third, no existing user interface systems aim to support statistical inference settings (parameter estimation), making ViP novel in its integration of dynamic privacy-preserving CIs to aid in these tasks. Providing CIs enables users to reflect on how reliable differences in query results are and more generally encourages reflecting on the privacy-preserving release as a composition of different types of error.
4 ViP Interface for Selection
ViP (shown in Figure 3) is an interactive visualization interface that allows a user to experiment with setting different values of for multiple queries, each with multiple subgroups, to see changes in potential privacy-preserving releases, potential privacy-preserving CIs, and disclosure risk. Below we describe our design goals (DGs) and process in developing ViP, and detail interface components. A demo version222https://priyakalot.github.io/ViP-demo of the interface with synthetic data is also available.
4.1 ViP Design Goals and Process
We developed three design goals (DGs) for an interactive visualization interface for choosing . These DGs are based on our knowledge of DP as well as conversations with our collaborators in health who are working to bring DP into the healthcare research domain.
-
–
DG1: –Accuracy Relationship. The interface should help a data curator understand the expected accuracy of a privacy-preserving data release with a given privacy budget, and how it changes in response to varying . The interface should help a data curator understand and make decisions based on the relationship, including the important observation that expected accuracy does not increase linearly as increases.
-
–
DG2: –Privacy Relationship. The interface should help a data curator understand how much privacy (in terms of disclosure risk) is guaranteed under a given privacy budget, and how privacy guarantees change as changes. Similar to DG1, the interface should help a data curator develop an understanding that disclosure risk and are not directly proportional.
-
–
DG3: Statistical Inference in the DP Setting. The interface should help a data curator understand the impact of the privacy budget in an inference setting, particularly the propagation of sampling error and DP noise in CIs constructed under DP.
-
–
DG4: Privacy Budget Splitting. The interface should help a data curator split a total privacy budget across queries taking into account accuracy and risk considerations.
The first two goals (DG1, DG2) focus on supporting the data curator in developing intuitions about relationships between accuracy, risk, and in order to grasp the privacy–utility trade-off so that they may make more informed decisions around setting and splitting (DG4). DG3 bridges the gap between DP and real-world use of statistics, where making inferences about the population is often the goal.
We developed ViP using an iterative design process with periodic feedback from our collaborators in clinical research. We brainstormed target concepts each visualization should communicate, created low-fidelity digital mock-ups of visualizations, and finally created working prototypes with animation in D3.js Bostock (\APACyear2012) for selected ideas.
We also conducted a preliminary exploratory user study using an early version of the interface that displayed just one query (the budget splitting task was not supported yet). We recruited six clinical health research professionals based in the U.S. who had experience working with health data (e.g., patient data), but little to no experience with DP. Participants were recruited through our network of clinical health research professionals, but did not necessarily have direct collaboration relationships with the authors. We used a think-aloud protocol Wright \BBA Monk (\APACyear1991), instructing participants to verbalize their thought-processes while working through the questions. Feedback from this preliminary study, which we report on later in Section 4.3, led to an additional design iteration.
IRB Details. The study was approved by Northwestern University’s IRB. Upon completing the study, each participant received a $50 gift card. Each participant gave verbal consent to having their session’s video call recorded and were told they could withdraw consent at any time. Participants were not asked any personal questions and were notified that recordings will be deleted within a year of the study’s publication.
4.2 Interface Components
We describe components in ViP’s query panels, Privacy Use panel, and Disclosure Risk panel shown in Figure 3. ViP is implemented in Javascript (including D3.js Bostock (\APACyear2012)), HTML, and CSS.
4.2.1 Query, Metadata, Extrapolation Tabs
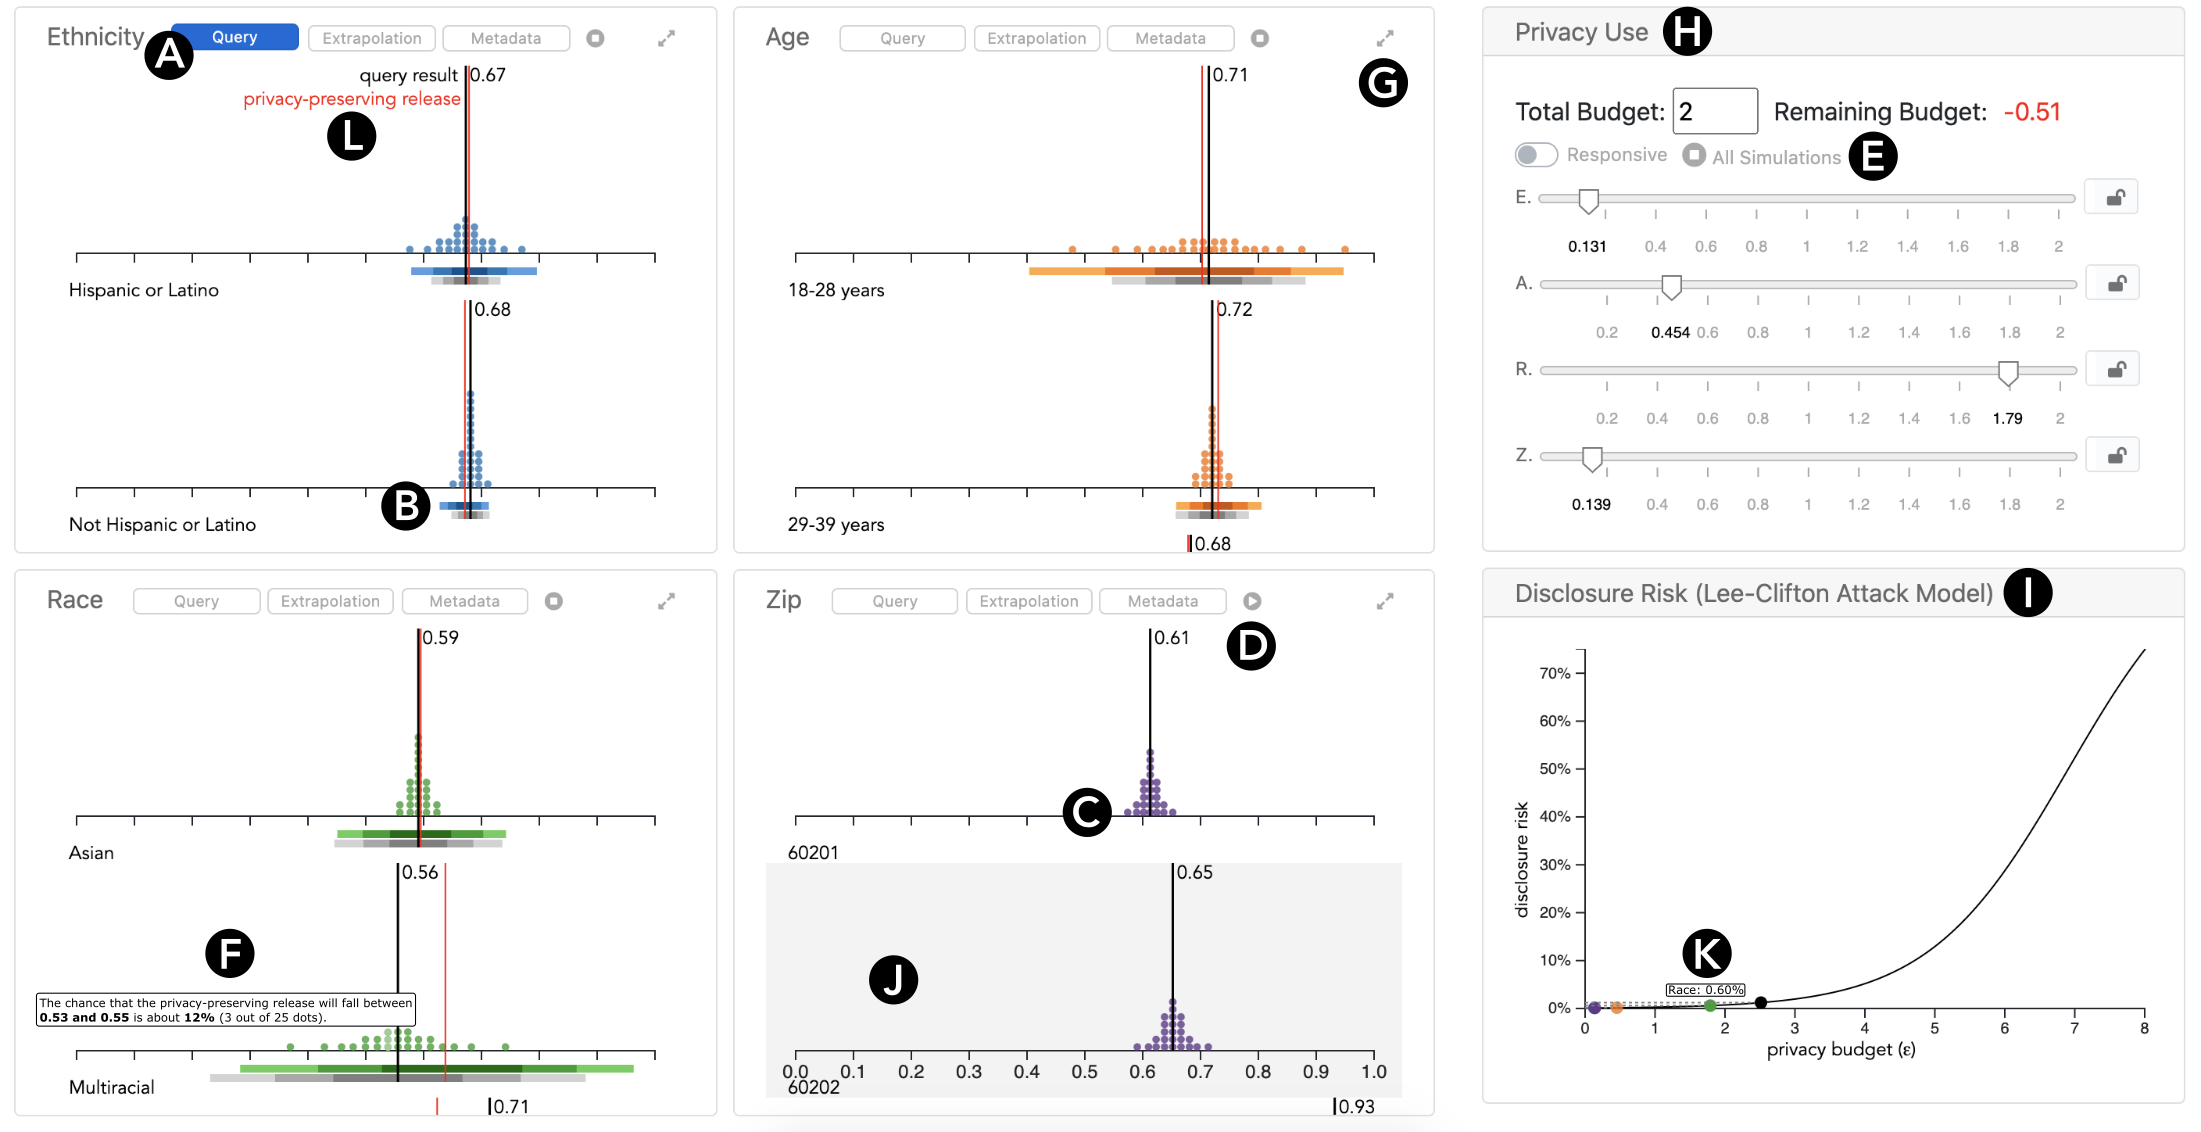
Given multiple queries of interest, the system accesses the private database to return query results. Each query’s results are shown in a separate panel, labeled by a shortened version of the query name (in Figure 3, the query labels are “Ethnicity,” “Age,” etc.). The top of each query panel has tabs labeled “Query,” “Metadata,” and “Extrapolation” (see Figure 3A). When clicked, the Metadata tab shows the data source, number of records over which the query is executed (broken down by subgroup), and whether any sensitive variables are accessed upon query execution. For simplicity, we assume the number of records to be public information, so displaying them under the Metadata tab requires no additional privacy considerations. We show sensitive variables since privacy requirements differ across types of patient data and may impact privacy budget decisions. Note that all queries shown in Figure 3 are about the proportion of people in each subgroup (by ethnicity, age, etc.) in a patient cohort diagnosed with hypertension (unspecified333“Unspecified” indicates that the diagnosis was not specified as either benign or malignant.).
The Extrapolation tab allows the user to indicate through a checkbox whether the data queried represent a sample from a larger population. If a user indicates the data are a sample, ViP assumes that the user is interested in performing statistical inference on the privacy-preserving releases to make claims about the population. The interface then displays CIs in the query panel’s visualizations (see Figure 3B). When the checkbox is unchecked, CIs are not displayed (such as in the Zip Code query shown in Figure 3C).
4.2.2 Query Panels
At a high-level, each query’s panel conveys the expected accuracy of privacy-preserving releases under a given privacy budget (per DG1). Figure 4 shows an up-close illustration of the visualization for the Hispanic or Latino group’s data in the Ethnicity query panel.
Privacy-Preserving Release HOP. The vertical black line labeled “query result” remains static and shows the un-noised query result. The vertical red line, denoted “privacy-preserving release,” displays random draws from the DP output distribution in an animation at 2.5 frames per second (explained in the HOPs box in Figure 4). This is consistent with the frame rate used in prior uncertainty visualization research Hullman \BOthers. (\APACyear2015); Kale \BOthers. (\APACyear2018). Users may play/stop HOPs by using play/stop simulation buttons at the top of each query panel (see Figure 3D) or in the Privacy Use panel (see Figure 3E). Hypothetical privacy-preserving release lines do not appear when simulations are stopped. Note that the button in the Privacy Use panel stops/starts simulations for all queries.
Quantile Dotplot. The quantile dotplot Kay \BOthers. (\APACyear2016); Wilkinson (\APACyear1999) beneath the un-noised query result and privacy-preserving release line displays a distribution from which potential privacy-preserving releases are drawn (see Figure 4). In this work, we use the Laplace mechanism (see Definition 2 in Section 2.2), and therefore display the appropriately parameterized Laplace distribution. A key parameter of the quantile dotplot is how many dots are used to represent the distribution: more dots more faithfully represent the density function, but in the limit, area perception will dominate, defeating the point of the discrete representation. When the number of dots is relatively small, users can rely on subitizing—the human visual system’s ability to automatically (i.e., without counting) recognize small counts like four or fewer—to estimate tail or other probabilities. We use 25 dots, 4% chance per dot, to achieve a balance between precision and ease of interpretation. When hovering over a dot, a tooltip appears (see Figure 4 or Figure 3F), displaying the bin lower and upper limits and approximate probability that the privacy-preserving release falls in the bin. Without the tooltip, a user can divide the number of dots in a bin by the total number of dots to determine the chance that a privacy-preserving release falls into a given bin.
We note that dot sizes stay the same regardless of . It is beneficial for dot sizes to remain constant across dotplots because users may rely on area judgments to make comparisons between them. If a user wants to see a larger version of a query’s dotplots, they may expand the query panel (see Figure 3G). When expanded, the dot sizes are enlarged, but are still consistent for all dotplots in the query panel.
Confidence Intervals. Finally, when the data are treated as a sample from a population (specified by the user in the Extrapolation tab), the user sees two sets of CIs as gradients below each quantile dotplot (labeled in Figure 4 and Figure 3B). The bottom CIs are gray, and their shades convey 50, 80, and 95% binomial CIs for the population proportion. Specifically, we use the normal approximation to the binomial distribution to construct an -level CI for a population proportion , where is the sample proportion (i.e., the query result) and is the sample size:
Directly above the non-private CIs, the colored intervals represent potential (50, 80, and 95%) privacy-preserving CIs for the population proportion, and animate at the same frame rate as the line for privacy-preserving releases. The previously mentioned stop/start buttons controlling whether simulations are shown also applies to privacy-preserving CIs (see Figure 3D). As mentioned in Section 2.4, we calculate these intervals using Ferrando \BOthers. (\APACyear2020)’s algorithm using a bootstrap method for constructing CIs under DP; their method does not require additional privacy budget since intervals are calculated as a post-processing step described in Theorem 2. Algorithm 1 presents how we calculate replicates, where input is a potential privacy-preserving release, is the sensitivity of the query, is the group sample size, and the number of replicates is set to . We find the and quantiles of the replicates to obtain the limits of the privacy-preserving -CI. In the queries shown in Figure 3, we use as , where is an additionally noised version of a potential privacy-preserving release , a proportion. Since the queries are count aggregates, is 1. Broadly, the algorithm generates draws from the Binomial distribution and adds DP noise to these draws to create replicates.
Displaying the privacy-preserving CIs with the non-private CIs as reference shows how the privacy-preserving CIs are typically wider or as wide as the non-private CIs due to additional uncertainty introduced by the DP mechanism, indicating two sources of error for the latter (helping achieve DG3).
Each query panel can be expanded (see Figure 3G) to take up the entire height of the screen and the width up until the start of the Privacy Use/Disclosure Risk panels (see Figure 3H/I); expanding a query panel expands its visualizations accordingly. Additionally, if a query has more than two subgroups, these subgroups’ visualizations can be seen by scrolling down within the query panel. Panel heights are fixed such that the third subgroup’s visualization is slightly visible by default (such as in the Age, Race, and Zip query panels in Figure 3) so that users are more likely to realize that a given query has more than two subgroups. Each subgroup’s visualization is draggable so that subgroup visualizations can be reordered (see Figure 3J). To further associate each query’s information on the interface, we assign colors according to query for the query panel visualizations (dotplot, CIs, etc.) and risk dots. We assign colors for each query according to the Tableau 10 color palette Tableau Software (\APACyear\bibnodate) and use chroma.js \APACcitebtitlechroma.js (\APACyear\bibnodate) to help determine color scales for the CIs.
4.2.3 Disclosure Risk
In the Disclosure Risk panel (see Figure 3I), we plot disclosure risk as an upper bound on the probability that a person’s sensitive attribute (e.g., hypertension diagnosis) will be correctly guessed by an adversary given the query’s output(s). In line with Definition 3 (see Section 2.3), we plot the following for all values on the privacy budget slider, where is the size of the dataset, and is sensitivity of queries:
Thus, the curve for disclosure risk shows the upper bound on the probability that the adversary guesses the absence/presence of a record in the computation correctly across values of . Note that when considering the budget allocation problem, where different queries receive potentially different portions of the privacy budget, ViP shows multiple risk values, each represented as a dot on the risk curve. When interacting with the visualization, users may hover over a specific dot to display a tooltip that provides the exact risk value of that dot (see Figure 3K). Each dot in the panel corresponds to either a single query or to all queries. For example, the black dot shown in the Disclosure Risk panel represents the overall risk computed using the sum of the budgets allocated to each query as set in the Privacy Use panel. Conversely, the colored dots each correspond to a specific query, where the dot’s value equals the risk if only that query’s results are released. The magnitude of risk for each query’s dot is computed using Definition 3, where the privacy budget is the budget allocated for that query and the size is the total number of records in the database.
The disclosure risk curve directly conveys the non-linear relationship between and risk (DG2) and illustrates how different queries have different risks according to their allocated privacy budgets. Note that since all queries are over the same database, if two queries have the same privacy budget, their corresponding dots will overlap in the visualization. For an alternative attack model where all queries are over disjoint parts of the database, each query would receive the entire privacy budget due to parallel composition and their risk would be computed accordingly.
4.2.4 Privacy Use
The Privacy Use panel (see Figure 3H) contains sliders, each of which corresponds to a different query. Each slider’s minimum value is 0.001 (since ) while the maximum value is 2 (resulting from equally dividing the maximum total budget a user can set across all queries).
As the user updates on a particular slider, the corresponding visualization panel and point on the risk curve dynamically update. This allows the user to see not only how accuracy and risk vary according to , but also how they vary in relation to one another (thus conveying the privacy–utility trade-off). Figure 5 shows how the dotplot for the Hispanic or Latino group in the Ethnicity query changes at increasing values of . Each query’s dotplots/HOPs and point on the risk curve are linked to always reflect accuracy and privacy under the same value of as currently set on the slider.
At the top of the Privacy Use panel, the user who has an idea of an appropriate overall budget can specify a total budget to split among queries. Remaining budget (to the right of the total budget) displays the total budget minus the values set for the sliders below. When remaining budget is negative, this value appears in red (as opposed to black). By default, the sliders operate under the “manual” mode, where the user can set the sliders so that the sum of their values exceed the total budget. If the user toggles on the “responsive” mode, ViP will assist the user in staying under the total budget by responsively equally dividing the remaining budget across queries whenever the user adjusts one query’s slider. For instance, if the user increases for a given query such that the remaining budget is negative, ViP will automatically reduce the values set for the remaining sliders to stay under budget. The user can lock queries (using the unlock/lock toggle to the right of each slider) so that their values remain fixed upon further slider interactions in responsive mode (similar to Gaboardi \BOthers. (\APACyear2018)’s hold feature). In the default manual mode, all sliders are unlocked and unlock/lock toggles are disabled.
4.3 Feedback from Preliminary User Study
As described in Section 4.1, our iterative design process involved a preliminary user study with six health professionals accustomed to working with sensitive data. The interface444Note that participants saw a version of the interface where “disclosure risk” was referred to as “re-identification risk.” Throughout this section we refer only to “risk” for clarity. for this study supported just one query at a time. The single query panel’s visualization was the same, except the number of dots in each dotplot was slightly higher and the dot sizes decreased as the dotplot’s underlying Laplace distribution’s peak became taller/narrower (i.e., when was increased) to fit the dotplot within its maximum fixed height. We asked questions to see how well participants could describe relationships between , accuracy, and risk and how easily they could satisfy accuracy/risk requirements.
Overall, all participants (P1–P6) articulated key DP relationships and made more nuanced observations about these relationships (e.g., that expected accuracy does not increase linearly as increases), particularly when prompted. Additionally, all participants (P1–P6) easily met risk requirements but only half (P1, P4, P5) satisfied the accuracy requirements, perhaps owing to confusion around representations of the DP output distributions.
In particular, two participants (P3, P6) expressed confusion over how to interpret the quantile dotplot, specifically misinterpreting the meaning of each dot (e.g., one participant thought each dot represented a dataset). We concluded that in addition to keeping dot sizes constant across dotplots, dotplots may require further up front explanation before users interact with them since they are not commonly used.
Finally, participants had mixed reactions to the HOPs. P2 and P6 thought they were “distracting” while P4 found it to be one of the most helpful parts of the interface. As a result, we added the play/stop simulation feature (see Figure 3D).
We observed some heterogeneity in strategies for using the interface, and we observed some common challenges to interpretation across participants. First, we found that participants employed different strategies when choosing values for for a given query/dataset. Two participants (P1, P4) described primarily risk considerations. P1 explained how they would consider “some of the non-mathematical features of the population” including whether the data describe sensitive topics such as “illegal activities, sexual practices” in order to determine acceptable risk levels. Four participants (P2, P3, P5, P6) described taking into account both risk and accuracy, though with differing strategies. P6, for example, said they would be more concerned with accuracy since at very low values, it would be possible to release a privacy-preserving value that “represents almost a different outcome than what you’re trying to show,” but followed this concern up with the need to consider “the consequences of not setting the privacy stringently enough.” P2 said they would focus on accuracy (but briefly mentioned risk concerns) and wondered whether a privacy-preserving release would impact statistical significance, particularly in health where “it’s so often you barely find any significance in the first place.” Additionally, most participants (P2, P3, P5, P6) said that their general approach and/or recommendations would not change whether privacy-preserving CIs were released alongside privacy-preserving point estimates. One participant (P4) was “puzzled” about the impact of the privacy-preserving CI on risk, indicating that they may have been expecting the risk to change since the CI appeared to reveal additional information about the data. Note that since privacy-preserving CIs are constructed through post-processing, no additional information is revealed. When describing their approach when releasing only a point estimate, the remaining participant (P1) was primarily concerned with risk. When asked about also releasing privacy-preserving CIs, they went into detail about taking level of necessary accuracy into account, for instance as it relates to clinical action thresholds.
Second, participants commented on challenges that may occur when using DP or how tools can better support their needs. Half of the participants (P1, P3, P4) expressed either confusion or concern over the meaning or practical significance of the risk. P1 seemed to have concerns over whether risk could be taken at face value, since they felt “like it’s putting an absolute number on something that’s hard to quantify.” P4 noted that the risk visualization was clear, but that interpreting the risk in practice might pose challenges. Two participants (P1, P4) said that a tool that could assist with sample size calculations in contexts where DP will be applied would be useful in practice to help assist in a priori reasoning about how much data are needed to achieve desired accuracy under DP. Last, three participants (P1, P2, P6) mentioned the importance of making inferences to a larger population in their work, indicating that it may be useful for future tools to continue supporting the release of privacy-preserving CIs.
5 Evaluative User Study
We conducted a within-subjects user study to assess how well ViP helps users complete tasks related to setting/splitting a privacy budget. Our study compares users’ performance between ViP 555 Note that participants saw a version of the interface where “disclosure risk” was referred to as “re-identification risk.” We have edited task questions referring to risk in the paper to maintain consistency. and a baseline non-visualization spreadsheet equipped with basic capabilities seen in other user interface tools for DP decision making. We recruited 16 U.S.-based participants with experience analyzing private or sensitive data but who were unfamiliar with DP. We recruited participants through email lists with people likely to be using sensitive data (e.g., health data) in their work. The study was conducted under the same IRB approval as the preliminary study; details are in Section 4.1.
Spreadsheet (“Control”) Condition. We designed the spreadsheet to reflect the tools that a practitioner looking to use differentially private mechanisms might have available. The spreadsheet allowed participants to change for each query and see numerical updates for disclosure risk and error estimates describing likely privacy-preserving releases. The spreadsheet contained query results, error estimates for privacy-preserving releases that adapted with changes to , disclosure risk associated with each query and the overall disclosure risk (all of which adapted with changes to ), 95% CI lower and upper bounds, and error estimates for privacy-preserving 95% CI lower and upper bounds that also adapted with changes to . The error estimate for each privacy-preserving release was the maximum distance from the query result that the release would be with 95% probability (based on the error estimate provided by Gaboardi \BOthers. (\APACyear2018)). Error estimates for the privacy-preserving CI bounds were the maximum distances the bounds would be from their respective 95% traditional CI bounds 95% of the time. The equation for the PDF of the Laplace distribution was provided as reference. The spreadsheet also allowed participants to set a total privacy budget and observe a remaining budget based on what they were spending on the queries. To enable comparison with ViP’s inference mode, we created two sheets (or versions) of the spreadsheet, one without CIs (non-inference setting) and one with (inference setting). When completing tasks using either ViP or the control, we told participants whether to use the extrapolation version/mode.
Tasks. We designed tasks to reflect judgments and decisions that might arise in real-world privacy budget splitting contexts. Task types are below:
-
1.
Accuracy Comparison
-
–
At = for the query, which subgroup in the query do we expect to have the most accurate privacy-preserving release?
-
–
-
2.
CDF Judgment
-
–
At = for the query, what is the probability that the privacy-preserving release for the subgroup will be greater than ?
-
–
-
3.
Risk Requirement
-
–
Set for the query such that its corresponding disclosure risk is %.
-
–
-
4.
CI Comparison
-
–
Set for the query to . For the subgroup, estimate how many times wider we expect the privacy-preserving 95% CI to be compared to the traditional 95% CI.
-
–
-
5.
Equalize Accuracy
-
–
Find the smallest values for each query () where the privacy-preserving releases for the subgroups , , , and are within of their query results (i.e., ).
-
–
-
6.
Budget Splitting
-
–
Suppose that you have a total budget of that you want to allocate across queries. The risk corresponding to each query should be no more than % and the release should be guaranteed to be within of the query result for , , , and subgroups with roughly 90% probability.
-
–
-
7.
Probability of Superiority
-
–
Estimate the probability that the release for the subgroup will be greater than the release for the subgroup when the query’s .
-
–
We designed two sets of eight questions corresponding to the above question types, which we refer to as versions A and B. There were two CDF Judgment questions and one of each of the other question types in each set.
Evaluation Metrics. For tasks under types 2–7, we calculated the absolute error from ground truth for participants’ responses. For tasks where participants had to give multiple responses (i.e., multiple values), we scored answers by the sum of absolute errors from ground truth over responses. We also timed how long participants took to complete each task, and asked participants their confidence in their answers (on a scale from 0–10, where 0 indicates answers were no better than random and 10 indicates full confidence in answers) once after using ViP and once after the spreadsheet.
Protocol. The first author led the 90 minute study sessions while the second author took notes. To provide an initial, gentle introduction to DP, we first required that participants view a four-minute introductory video to DP explaining, at a high level, that differentially private mechanisms often inject a calibrated amount of random noise to a query result to calculate a privacy-preserving release. Next, participants completed tasks using both ViP and the spreadsheet. We counterbalanced the order of ViP/spreadsheet and sets of tasks. As in the preliminary study, we used a think-aloud protocol Wright \BBA Monk (\APACyear1991). After completing the tasks, participants answered a set of follow-up questions.
5.1 Results
Data Preliminaries. Participants took an average of 19.4 minutes (95% CI: ]) to complete tasks using ViP, and 23.1 minutes using the spreadsheet (95% CI: ). We observed no reliable difference in total time between interface conditions (95% CI around the difference in mean times between ViP and spreadsheet: ). Participants were given eight questions to answer per interface; on average they were able to answer 7.8 questions with ViP (95% CI: [7.6,8.0]) and 6.4 questions (95% CI: ) with the spreadsheet.
Accuracy of Responses. We measure accuracy by absolute error () or sum of absolute errors for questions eliciting multiple responses. Figure 6 shows absolute error with 95% CIs, by question version and whether the question was answered using the spreadsheet or ViP.
All task types are shown in Figure 6 except for Accuracy Comparison—all participants answered these questions correctly, when using both ViP and the spreadsheet, and these questions elicited categorical responses, so we omit them from the figure.
Participants gave more correct answers for CDF Judgment questions when using ViP. On average, absolute error for these questions was 13 percentage points lower (95% CI around the difference in means: ). Participants counted the number of dots in the requested range and multiplied by each dot’s value (4%) to find an answer. On the other hand, participants often made guesses using the privacy-preserving release error in the spreadsheet, leading not only to more inaccurate, but also more variable answers.
Participants also performed considerably better using ViP for comparing expected width of the privacy-preserving CI with the width of the traditional CI (CI Comparison). Absolute error for these questions was, on average, 1.36 lower using ViP (95% CI around the difference in means: ). For example, participants using the spreadsheet for the task’s version A question gave answers with errors of 1.69 on average (where the ground truth answer was that we expect the privacy-preserving CI to be 2.1 times as wide as the non-private CI); using ViP, participants were off by only 0.1 on average. Participants were able to get estimates of the expected width by viewing multiple privacy-preserving CIs (animated as a HOP) and easily compare the width to that of the traditional CI directly below. In addition to bias, we observed higher variance in responses made using the spreadsheet interface.
The mean sum of absolute errors (of allocation across queries) is only slightly lower for responses given using ViP versus the spreadsheet for Equalize Accuracy questions (0.42 and 0.45, respectively; 95% CI around the difference in means: ). However, the difference in means is greater for the Budget Splitting questions (0.11 for ViP to 0.18 for the spreadsheet; 95% CI around the difference in means: ), suggesting that ViP may improve the ability to split across queries when requirements are more complex. Last, we find that using either ViP or the spreadsheet, participants performed similarly in setting for the Risk Requirement tasks (95% CI around the difference in means between ViP and the spreadsheet: ), and worse (by 3 percentage points, on average) for the Probability of Superiority tasks using ViP (95% CI around the difference in means: ). When using ViP for the Probability of Superiority tasks, participants often incorrectly counted the number of dots in the first dotplot above (on the -axis) the second dotplot’s maximal dot. Had participants instead focused on the privacy-preserving HOP, they may have performed better, as HOPs are designed for this type of probability judgment.
Self-Reported Confidence. Participants reported feeling an average of 2.3 points (on a scale from 0 to 10) more confident in their answers using ViP compared to the spreadsheet (95% CI around the difference: ). Only one participant was more confident in their answers using the spreadsheet, and one participant was equally confident with the spreadsheet and ViP. When describing why ViP was helpful, 7 participants described how ViP helped them understand or keep track of DP relationships.
Timing of Responses. Average time to answer each question ranged from 29 seconds (Version A, CDF Judgment) to about 8 minutes (Version B, Budget Splitting). Participants answered CDF judgment questions more quickly with ViP (average time: 34 seconds) compared with the spreadsheet (average time: 1.8 minutes) (95% CI around the difference in means, in minutes: ). Participants took slightly longer to answer the Risk Requirement questions using ViP (average time of 1.6 minutes compared with 1 minute; 95% CI around the difference in means: ) and longer to answer CI Comparison questions with the spreadsheet (average time of 53 seconds compared with about 1 minute; 95% CI around the difference of means, in minutes: ). Otherwise, we did not observe other clear patterns in difference in response times across the spreadsheet and ViP.
Current Practices. Participants primarily described three practices for protecting privacy in their current workflows. Eleven participants described de-identifying data, seven participants mentioned using some combination of passwords, secure servers or systems, and encrypted folders. Finally, four participants described aggregating data. These findings suggest that DP may represent a significant enough departure from current practices that tools explaining DP may be useful.
6 Discussion
Despite significant progress made in research toward formal privacy guarantees for data releases, DP presents challenges to understand and use. Our work underlines the need to think critically about what users of DP require in practice and to design tools that support decisions and understanding among different types of stakeholders. We discuss high-level takeaways from this work, including opportunities for further human-centered work in DP.
6.1 Toward Interpretable User Interfaces
6.1.1 Interactive Visualizations and DP Relationships
In contrast to previous work (e.g., Gaboardi \BOthers. (\APACyear2018); Hay \BOthers. (\APACyear2016); Thaker \BOthers. (\APACyear2020)), ViP presents users with separate risk and accuracy visualizations within the same interface, where moving privacy budget sliders dynamically updates risk and accuracy visualizations to reflect implications of the current choices of . In our first qualitative study, we found that participants performed well on tasks designed to compare different privacy budget values and their effect on a privacy-preserving data release, as evidenced by their ability to reflect on the privacy–utility trade-off and explain their reasoning for choosing specific values. Our second study provides evidence that visualizations may help users understand DP more intuitively by helping them keep track of relationships between , accuracy, and risk, and make quick calculations relevant to setting (e.g., CDF of a DP output distribution). While users may bring domain expertise to the budget setting/splitting task, they may need additional guidance in what constitutes, for example, appropriate disclosure risk for a given context. Looking forward, one idea to support judgments about appropriate risk is to integrate anchor points into the interface that provide guidance around acceptable values of in a given context. For example, we might indicate on ViP’s privacy budget slider(s) points that correspond to organizational or legal requirements around maximum disclosure risk. This will involve incorporating ways of mapping current requirements (e.g., specified by -anonymity) to guarantees offered by DP, which would further allow practitioners to combine their domain knowledge with previously set standards.
6.1.2 Additional Attack Models
Definition 3 details how ViP presents disclosure risk. One future research direction is to incorporate and evaluate alternative attack models with this interface.
For example, hypothesis testing for differentially private mechanisms Wasserman \BBA Zhou (\APACyear2010); Liu \BOthers. (\APACyear2019) quantifies risk in terms of an adversary rejecting or failing to reject the null hypothesis dependent on an individual’s record being present in the database. These attack models start with a decision criteria Greig \BOthers. (\APACyear1989); Shepp \BBA Vardi (\APACyear1982); Neyman \BBA Pearson (\APACyear2020) that models how an adversary rejects the null hypothesis for a given privacy budget. The disclosure risk is measured by the probability that the adversary correctly rejects/fails to reject the null hypothesis. The failure rate is usually measured by two types of errors in hypothesis testing: the rejection of when is true and the failure to reject when is true. Hence, visualizing these two errors will involve more complex visualizations or a post-processing of the errors.
Another attack model uses Bayesian DP to convey risk Kasiviswanathan \BBA Smith (\APACyear2014); Yang \BOthers. (\APACyear2015) when considering correlated data. As our setting centers around DP for tables with independent rows, visualizing the risk of correlated data does not apply.
6.1.3 Visualizations for More Complex Mechanisms
Our approach to visualizing DP noise generalizes to other more complex mechanisms that rely primarily on one statistical distribution, as quantile dotplots and HOPs can be generated for any distribution.
For more complex mechanisms, such as median estimation using smooth sensitivity Nissim \BOthers. (\APACyear2007), that do not have an explicit PDF, we can run these mechanisms on datasets of interest many times for a given privacy budget parameter to obtain estimates of the DP output distribution. We can then use these sampled estimates to compute quantiles and construct a quantile dotplot, where the more sample estimates we have, the closer the visualized distribution will be to the true output distribution. Similarly, this visualization technique applies to complex mechanisms for high-dimensional queries Li \BOthers. (\APACyear2015); McKenna \BOthers. (\APACyear2018). Note that some algorithms (e.g., smooth sensitivity algorithm) have output distributions dependent on the input, and hence the output distribution should not be directly released to the data consumer.
Additionally, we note that future work may include expanding ViP to support ()–DP. Supporting approximate DP would require a user-provided value, where is typically very small, and a modified dotplot that reflects an approximate DP mechanism, such as the Gaussian mechanism. In addition, the risk curve must be modified to account for , but we note that the general trend of higher privacy budget corresponding to higher risk remains. Additionally, advanced composition theorems, such as Rényi DP Mironov (\APACyear2017), must be used to determine the used privacy budget. We leave specifics of the computation of this modified risk and privacy budget as future work.
6.1.4 Domain- and Context-Specific Considerations
Our collaboration with colleagues in a medical school allowed us to develop ViP with feedback from potential users. In general, for interactive interfaces for DP to be effective, it will be important to employ user-centered design techniques to ensure that contextual considerations around use of DP in an organization are acknowledged. For example, our understanding of clinical health workflows helped us establish the importance of supporting statistical inference tasks and the statistics background that a likely user of the interface would have. Similarly, we recognize the need to bridge currently-used procedures such as -anonymity with DP. Mappings between and for a given query/dataset, and integrating such mappings into interfaces for DP, could help clinical researchers more easily adopt DP.
Additionally, more work is needed to create tools aimed at people who are contributing (or deciding whether to contribute) their data. Prior work has explored this topic for local DP Xiong \BOthers. (\APACyear2020), proposed an economic framework for potential participants determining whether to take part in a study Hsu \BOthers. (\APACyear2014), and investigated how end users interpret DP guarantees Cummings \BOthers. (\APACyear2021). Interfaces that help potential data contributors make decisions around data sharing could help to increase people’s agency around their own data. For example, interfaces might explain disclosure risk in ways that emphasize the individual’s cost of disclosure (versus, for instance, the cost that an organization might incur for a data leak). Such interfaces could help to fill a glaring omission in the DP pipeline—systems cannot release data that people do not consent to having collected and shared.
6.1.5 Leakage from Experimentation
In theory, seeing the un-noised query result may factor into the data curator’s chosen level of as they experiment with different values, thus leaking information about the data. However, counting experimentation of parameter values toward the total privacy budget has been argued to make DP unusable for real-world purposes Desfontaines (\APACyear2020). To ameliorate the impacts of such leakage, one option may be to spend a higher privacy budget than what is actually allocated to a query. However, this leads to less accurate releases/higher privacy costs. In other instances, the leakage may be acceptable, such as when the data curator is highly trusted and known not to collude with others, and when the privacy budget is limited.
6.2 Toward Evaluative Frameworks
An important step for future work is to identify normative frameworks for evaluating DP interfaces; that is, well-defined approaches in which the quality of a privacy budget decision can be measured. Without a clear normative standard for decisions, it is difficult to know for sure whether a given interface helps an organization use DP more effectively. For example, economic and decision-theoretic approaches have been employed in evaluating uncertainty visualizations (e.g., Fernandes \BOthers. (\APACyear2018); Hullman \BOthers. (\APACyear2018); Kale \BOthers. (\APACyear2020)). In a DP setting, we might ask people to split a pre-specified total privacy budget over a set of analysis-decision tasks where decision tasks are of varying stakes (e.g., measured by cost of disclosure and inaccurate results). Comparing outcomes of decisions made with and without an interface to decisions that would have been made using results from non-private analyses (signifying ground truth) within a decision-theoretic (expected utility) framework Morgenstern \BBA Von Neumann (\APACyear1953); Savage (\APACyear1954) will help further pinpoint aspects of interfaces that people find useful in decision-making around DP.
7 Conclusion
In this work, we present ViP, a novel interactive visualization interface designed to help users understand the privacy–utility trade-off within DP in order to make informed privacy budget decisions. ViP presents accuracy and disclosure risk visualizations that leverage techniques from uncertainty visualization research to aid user understanding. Through an evaluative user study with research practitioners, we examine how well ViP helps users more accurately complete tasks related to setting and splitting privacy budgets. We find that the interface helps users make more accurate judgments about how likely it is to see a privacy-preserving release in a given range and more accurate assessments when comparing privacy-preserving CIs to traditional CIs.
Acknowledgements
We thank Abel Kho and the reviewers. We received support from the NSERC Discovery Grant, NSF CAREER Award #1846447, and Northwestern University’s Advanced Cognitive Science Fellowship.
References
- Abowd (\APACyear2018) \APACinsertmetastarabowd2018us{APACrefauthors}Abowd, J\BPBIM. \APACrefYearMonthDay2018. \BBOQ\APACrefatitleThe US Census Bureau adopts differential privacy The US Census Bureau adopts differential privacy.\BBCQ \BIn \APACrefbtitleProceedings of the 24th ACM SIGKDD International Conference on Knowledge Discovery & Data Mining Proceedings of the 24th ACM SIGKDD International Conference on Knowledge Discovery & Data Mining (\BPGS 2867–2867). \PrintBackRefs\CurrentBib
- Aktay \BOthers. (\APACyear2020) \APACinsertmetastaraktay2020google{APACrefauthors}Aktay, A., Bavadekar, S., Cossoul, G., Davis, J., Desfontaines, D., Fabrikant, A.\BDBLothers \APACrefYearMonthDay2020. \BBOQ\APACrefatitleGoogle COVID-19 Community Mobility Reports: anonymization process description (version 1.1) Google COVID-19 Community Mobility Reports: anonymization process description (version 1.1).\BBCQ \APACjournalVolNumPagesarXiv preprint arXiv:2004.04145. \PrintBackRefs\CurrentBib
- Almasi \BOthers. (\APACyear2016) \APACinsertmetastaralmasi2016risk{APACrefauthors}Almasi, M\BPBIM., Siddiqui, T\BPBIR., Mohammed, N.\BCBL \BBA Hemmati, H. \APACrefYearMonthDay2016. \BBOQ\APACrefatitleThe risk-utility tradeoff for data privacy models The risk-utility tradeoff for data privacy models.\BBCQ \BIn \APACrefbtitle2016 8th IFIP International Conference on New Technologies, Mobility and Security (NTMS) 2016 8th IFIP International Conference on New Technologies, Mobility and Security (NTMS) (\BPGS 1–5). \PrintBackRefs\CurrentBib
- \APACcitebtitleAssistive AI Makes Replying Easier (\APACyear2020) \APACinsertmetastarmicrosoft_DP\APACrefbtitleAssistive AI Makes Replying Easier. Assistive AI Makes Replying Easier. \APACrefYearMonthDay2020. {APACrefURL} https://www.microsoft.com/en-us/research/group/msai/articles/assistive-ai-makes-replying-easier-2/ \PrintBackRefs\CurrentBib
- Bavadekar \BOthers. (\APACyear2021) \APACinsertmetastarbavadekar2021google{APACrefauthors}Bavadekar, S., Boulanger, A., Davis, J., Desfontaines, D., Gabrilovich, E., Gadepalli, K.\BDBLothers \APACrefYearMonthDay2021. \BBOQ\APACrefatitleGoogle COVID-19 Vaccination Search Insights: Anonymization Process Description Google COVID-19 Vaccination Search Insights: Anonymization Process Description.\BBCQ \APACjournalVolNumPagesarXiv preprint arXiv:2107.01179. \PrintBackRefs\CurrentBib
- Bavadekar \BOthers. (\APACyear2020) \APACinsertmetastarbavadekar2020google{APACrefauthors}Bavadekar, S., Dai, A., Davis, J., Desfontaines, D., Eckstein, I., Everett, K.\BDBLothers \APACrefYearMonthDay2020. \BBOQ\APACrefatitleGoogle COVID-19 Search Trends Symptoms Dataset: Anonymization Process Description (version 1.0) Google COVID-19 Search Trends Symptoms Dataset: Anonymization Process Description (version 1.0).\BBCQ \APACjournalVolNumPagesarXiv preprint arXiv:2009.01265. \PrintBackRefs\CurrentBib
- Biswas \BOthers. (\APACyear2020) \APACinsertmetastarbiswas2020coinpress{APACrefauthors}Biswas, S., Dong, Y., Kamath, G.\BCBL \BBA Ullman, J. \APACrefYearMonthDay2020. \BBOQ\APACrefatitleCoinpress: Practical private mean and covariance estimation Coinpress: Practical private mean and covariance estimation.\BBCQ \APACjournalVolNumPagesarXiv preprint arXiv:2006.06618. \PrintBackRefs\CurrentBib
- Bittner \BOthers. (\APACyear2020) \APACinsertmetastarbittner2020understanding{APACrefauthors}Bittner, D\BPBIM., Brito, A\BPBIE., Ghassemi, M., Rane, S., Sarwate, A\BPBID.\BCBL \BBA Wright, R\BPBIN. \APACrefYearMonthDay2020. \BBOQ\APACrefatitleUnderstanding Privacy-Utility Tradeoffs in Differentially Private Online Active Learning Understanding Privacy-Utility Tradeoffs in Differentially Private Online Active Learning.\BBCQ \APACjournalVolNumPagesJournal of Privacy and Confidentiality102. \PrintBackRefs\CurrentBib
- Bostock (\APACyear2012) \APACinsertmetastard3js{APACrefauthors}Bostock, M. \APACrefYearMonthDay2012. \APACrefbtitleD3.js - Data-Driven Documents. D3.js - Data-Driven Documents. {APACrefURL} http://d3js.org/ \PrintBackRefs\CurrentBib
- Brawner \BBA Honaker (\APACyear2018) \APACinsertmetastarbrawner2018bootstrap{APACrefauthors}Brawner, T.\BCBT \BBA Honaker, J. \APACrefYearMonthDay2018. \BBOQ\APACrefatitleBootstrap inference and differential privacy: Standard errors for free Bootstrap inference and differential privacy: Standard errors for free.\BBCQ \APACjournalVolNumPagesUnpublished Manuscript. \PrintBackRefs\CurrentBib
- Chance \BOthers. (\APACyear2000) \APACinsertmetastarchance2000developing{APACrefauthors}Chance, B., Garfield, J.\BCBL \BBA delMas, R. \APACrefYearMonthDay2000. \BBOQ\APACrefatitleDeveloping Simulation Activities To Improve Students’ Statistical Reasoning. Developing Simulation Activities To Improve Students’ Statistical Reasoning.\BBCQ \PrintBackRefs\CurrentBib
- \APACcitebtitlechroma.js (\APACyear\bibnodate) \APACinsertmetastarchromajs\APACrefbtitlechroma.js. chroma.js. \APACrefYearMonthDay\bibnodate. {APACrefURL} https://gka.github.io/chroma.js/ \PrintBackRefs\CurrentBib
- Cumming \BBA Thomason (\APACyear1998) \APACinsertmetastarcumming1998{APACrefauthors}Cumming, G.\BCBT \BBA Thomason, N. \APACrefYearMonthDay1998. \BBOQ\APACrefatitleStatplay: Multimedia for statistical understanding, in Pereira-Mendoza (ed Statplay: Multimedia for statistical understanding, in Pereira-Mendoza (ed.\BBCQ \BIn \APACrefbtitleProceedings of the Fifth International Conference on Teaching Statistics, ISI. Proceedings of the Fifth International Conference on Teaching Statistics, ISI. \PrintBackRefs\CurrentBib
- Cummings \BOthers. (\APACyear2021) \APACinsertmetastarcummings2021need{APACrefauthors}Cummings, R., Kaptchuk, G.\BCBL \BBA Redmiles, E\BPBIM. \APACrefYearMonthDay2021. \BBOQ\APACrefatitle“I need a better description”: An Investigation Into User Expectations For Differential Privacy “I need a better description”: An Investigation Into User Expectations For Differential Privacy.\BBCQ \APACjournalVolNumPagesACM CCS. \PrintBackRefs\CurrentBib
- delMas \BOthers. (\APACyear1999) \APACinsertmetastardelmas1999{APACrefauthors}delMas, R\BPBIC., Garfield, J.\BCBL \BBA Chance, B. \APACrefYearMonthDay1999. \BBOQ\APACrefatitleA model of classroom research in action: Developing simulation activities to improve students’ statistical reasoning A model of classroom research in action: Developing simulation activities to improve students’ statistical reasoning.\BBCQ \APACjournalVolNumPagesJournal of Statistics Education73. \PrintBackRefs\CurrentBib
- Desfontaines (\APACyear2020) \APACinsertmetastardesfontaines2020lowering{APACrefauthors}Desfontaines, D. \APACrefYear2020. \APACrefbtitleLowering the cost of anonymization Lowering the cost of anonymization \APACtypeAddressSchool\BUPhD. \APACaddressSchoolETH Zurich. \PrintBackRefs\CurrentBib
- Du \BOthers. (\APACyear2020) \APACinsertmetastardu2020differentially{APACrefauthors}Du, W., Foot, C., Moniot, M., Bray, A.\BCBL \BBA Groce, A. \APACrefYearMonthDay2020. \BBOQ\APACrefatitleDifferentially private confidence intervals Differentially private confidence intervals.\BBCQ \APACjournalVolNumPagesarXiv preprint arXiv:2001.02285. \PrintBackRefs\CurrentBib
- Dwork \BOthers. (\APACyear2019) \APACinsertmetastardwork2019differential{APACrefauthors}Dwork, C., Kohli, N.\BCBL \BBA Mulligan, D. \APACrefYearMonthDay2019. \BBOQ\APACrefatitleDifferential Privacy in Practice: Expose Your Epsilons! Differential Privacy in Practice: Expose Your Epsilons!\BBCQ \APACjournalVolNumPagesJournal of Privacy and Confidentiality92. \PrintBackRefs\CurrentBib
- Dwork \BOthers. (\APACyear2006) \APACinsertmetastardwork2006calibrating{APACrefauthors}Dwork, C., McSherry, F., Nissim, K.\BCBL \BBA Smith, A. \APACrefYearMonthDay2006. \BBOQ\APACrefatitleCalibrating noise to sensitivity in private data analysis Calibrating noise to sensitivity in private data analysis.\BBCQ \BIn \APACrefbtitleTheory of Cryptography Conference Theory of Cryptography Conference (\BPGS 265–284). \PrintBackRefs\CurrentBib
- Dwork \BBA Roth (\APACyear2014) \APACinsertmetastarpdtextbook14{APACrefauthors}Dwork, C.\BCBT \BBA Roth, A. \APACrefYearMonthDay2014. \BBOQ\APACrefatitleThe Algorithmic Foundations of Differential Privacy The Algorithmic Foundations of Differential Privacy.\BBCQ \APACjournalVolNumPagesFound. Trends Theor. Comput. Sci.. \PrintBackRefs\CurrentBib
- \APACcitebtitleEnabling developers and organizations to use differential privacy (\APACyear2019) \APACinsertmetastargoogle_openSource\APACrefbtitleEnabling developers and organizations to use differential privacy. Enabling developers and organizations to use differential privacy. \APACrefYearMonthDay2019. {APACrefURL} https://developers.googleblog.com/2019/09/enabling-developers-and-organizations.html \PrintBackRefs\CurrentBib
- Evans \BOthers. (\APACyear2020) \APACinsertmetastarevans2020statistically{APACrefauthors}Evans, G., King, G., Schwenzfeier, M.\BCBL \BBA Thakurta, A. \APACrefYearMonthDay2020. \BBOQ\APACrefatitleStatistically valid inferences from privacy protected data Statistically valid inferences from privacy protected data.\BBCQ \APACjournalVolNumPagesURL: GaryKing. org/dp. \PrintBackRefs\CurrentBib
- Fernandes \BOthers. (\APACyear2018) \APACinsertmetastarfernandes2018uncertainty{APACrefauthors}Fernandes, M., Walls, L., Munson, S., Hullman, J.\BCBL \BBA Kay, M. \APACrefYearMonthDay2018. \BBOQ\APACrefatitleUncertainty displays using quantile dotplots or cdfs improve transit decision-making Uncertainty displays using quantile dotplots or cdfs improve transit decision-making.\BBCQ \BIn \APACrefbtitleProceedings of the 2018 CHI Conference on Human Factors in Computing Systems Proceedings of the 2018 CHI Conference on Human Factors in Computing Systems (\BPGS 1–12). \PrintBackRefs\CurrentBib
- Ferrando \BOthers. (\APACyear2020) \APACinsertmetastarferrando2020general{APACrefauthors}Ferrando, C., Wang, S.\BCBL \BBA Sheldon, D. \APACrefYearMonthDay2020. \BBOQ\APACrefatitleGeneral-Purpose Differentially-Private Confidence Intervals General-Purpose Differentially-Private Confidence Intervals.\BBCQ \APACjournalVolNumPagesarXiv preprint arXiv:2006.07749. \PrintBackRefs\CurrentBib
- Gaboardi \BOthers. (\APACyear2020) \APACinsertmetastargaboardi2020programming{APACrefauthors}Gaboardi, M., Hay, M.\BCBL \BBA Vadhan, S. \APACrefYearMonthDay2020. \BBOQ\APACrefatitleA programming framework for opendp A programming framework for opendp.\BBCQ \APACjournalVolNumPagesManuscript, May. \PrintBackRefs\CurrentBib
- Gaboardi \BOthers. (\APACyear2018) \APACinsertmetastargaboardi2018psi{APACrefauthors}Gaboardi, M., Honaker, J., King, G., Murtagh, J., Nissim, K., Ullman, J.\BCBL \BBA Vadhan, S. \APACrefYearMonthDay2018. \APACrefbtitlePSI (): a Private data Sharing Interface. PSI (): a Private data Sharing Interface. \PrintBackRefs\CurrentBib
- Ganta \BOthers. (\APACyear2008) \APACinsertmetastarganta2008composition{APACrefauthors}Ganta, S\BPBIR., Kasiviswanathan, S\BPBIP.\BCBL \BBA Smith, A. \APACrefYearMonthDay2008. \BBOQ\APACrefatitleComposition attacks and auxiliary information in data privacy Composition attacks and auxiliary information in data privacy.\BBCQ \BIn \APACrefbtitleProceedings of the 14th ACM SIGKDD International Conference on Knowledge Discovery and Data Mining Proceedings of the 14th ACM SIGKDD International Conference on Knowledge Discovery and Data Mining (\BPGS 265–273). \PrintBackRefs\CurrentBib
- Ge \BOthers. (\APACyear2019) \APACinsertmetastarge2019apex{APACrefauthors}Ge, C., He, X., Ilyas, I\BPBIF.\BCBL \BBA Machanavajjhala, A. \APACrefYearMonthDay2019. \BBOQ\APACrefatitleApex: Accuracy-aware differentially private data exploration Apex: Accuracy-aware differentially private data exploration.\BBCQ \BIn \APACrefbtitleProceedings of the 2019 International Conference on Management of Data Proceedings of the 2019 International Conference on Management of Data (\BPGS 177–194). \PrintBackRefs\CurrentBib
- Gigerenzer \BBA Hoffrage (\APACyear1995) \APACinsertmetastargigerenzer1995improve{APACrefauthors}Gigerenzer, G.\BCBT \BBA Hoffrage, U. \APACrefYearMonthDay1995. \BBOQ\APACrefatitleHow to improve Bayesian reasoning without instruction: frequency formats. How to improve bayesian reasoning without instruction: frequency formats.\BBCQ \APACjournalVolNumPagesPsychological Review1024684. \PrintBackRefs\CurrentBib
- Greig \BOthers. (\APACyear1989) \APACinsertmetastargreig1989exact{APACrefauthors}Greig, D\BPBIM., Porteous, B\BPBIT.\BCBL \BBA Seheult, A\BPBIH. \APACrefYearMonthDay1989. \BBOQ\APACrefatitleExact maximum a posteriori estimation for binary images Exact maximum a posteriori estimation for binary images.\BBCQ \APACjournalVolNumPagesJournal of the Royal Statistical Society: Series B (Methodological)512271–279. \PrintBackRefs\CurrentBib
- Haeberlen \BOthers. (\APACyear2011) \APACinsertmetastarhaeberlen2011differential{APACrefauthors}Haeberlen, A., Pierce, B\BPBIC.\BCBL \BBA Narayan, A. \APACrefYearMonthDay2011. \BBOQ\APACrefatitleDifferential Privacy Under Fire. Differential Privacy Under Fire.\BBCQ \BIn \APACrefbtitleUSENIX Security Symposium USENIX Security Symposium (\BVOL 33). \PrintBackRefs\CurrentBib
- Hawes (\APACyear2020) \APACinsertmetastarhawes2020census{APACrefauthors}Hawes, M. \APACrefYearMonthDay2020. \APACrefbtitleDifferential Privacy and the 2020 Decennial Census. Differential Privacy and the 2020 Decennial Census. \APAChowpublishedWebinar. \PrintBackRefs\CurrentBib
- Hay \BOthers. (\APACyear2016) \APACinsertmetastarhay2016exploring{APACrefauthors}Hay, M., Machanavajjhala, A., Miklau, G., Chen, Y., Zhang, D.\BCBL \BBA Bissias, G. \APACrefYearMonthDay2016. \BBOQ\APACrefatitleExploring privacy-accuracy tradeoffs using dpcomp Exploring privacy-accuracy tradeoffs using dpcomp.\BBCQ \BIn \APACrefbtitleProceedings of the 2016 International Conference on Management of Data Proceedings of the 2016 International Conference on Management of Data (\BPGS 2101–2104). \PrintBackRefs\CurrentBib
- Herdağdelen \BOthers. (\APACyear2020) \APACinsertmetastarfb_mobility_data{APACrefauthors}Herdağdelen, A., Dow, A., State, B., Mohassel, P.\BCBL \BBA Pompe, A. \APACrefYearMonthDay2020. \APACrefbtitleProtecting privacy in Facebook mobility data during the COVID-19 response. Protecting privacy in Facebook mobility data during the COVID-19 response. {APACrefURL} https://research.fb.com/blog/2020/06/protecting-privacy-in-facebook-mobility-data-during-the-covid-19-response/ \PrintBackRefs\CurrentBib
- Hofman \BOthers. (\APACyear2020) \APACinsertmetastarhofman2020visualizing{APACrefauthors}Hofman, J\BPBIM., Goldstein, D\BPBIG.\BCBL \BBA Hullman, J. \APACrefYearMonthDay2020. \BBOQ\APACrefatitleHow visualizing inferential uncertainty can mislead readers about treatment effects in scientific results How visualizing inferential uncertainty can mislead readers about treatment effects in scientific results.\BBCQ \BIn \APACrefbtitleProceedings of the 2020 CHI Conference on Human Factors in Computing Systems Proceedings of the 2020 CHI Conference on Human Factors in Computing Systems (\BPGS 1–12). \PrintBackRefs\CurrentBib
- Holohan \BOthers. (\APACyear2019) \APACinsertmetastarholohan2019diffprivlib{APACrefauthors}Holohan, N., Braghin, S., Mac Aonghusa, P.\BCBL \BBA Levacher, K. \APACrefYearMonthDay2019. \BBOQ\APACrefatitleDiffprivlib: the IBM differential privacy library Diffprivlib: the IBM differential privacy library.\BBCQ \APACjournalVolNumPagesarXiv preprint arXiv:1907.02444. \PrintBackRefs\CurrentBib
- Hsu \BOthers. (\APACyear2014) \APACinsertmetastarhsu2014differential{APACrefauthors}Hsu, J., Gaboardi, M., Haeberlen, A., Khanna, S., Narayan, A., Pierce, B\BPBIC.\BCBL \BBA Roth, A. \APACrefYearMonthDay2014. \BBOQ\APACrefatitleDifferential privacy: An economic method for choosing epsilon Differential privacy: An economic method for choosing epsilon.\BBCQ \BIn \APACrefbtitle2014 IEEE 27th Computer Security Foundations Symposium 2014 IEEE 27th Computer Security Foundations Symposium (\BPGS 398–410). \PrintBackRefs\CurrentBib
- Hullman \BOthers. (\APACyear2018) \APACinsertmetastarhullman2018pursuit{APACrefauthors}Hullman, J., Qiao, X., Correll, M., Kale, A.\BCBL \BBA Kay, M. \APACrefYearMonthDay2018. \BBOQ\APACrefatitleIn pursuit of error: A survey of uncertainty visualization evaluation In pursuit of error: A survey of uncertainty visualization evaluation.\BBCQ \APACjournalVolNumPagesIEEE Transactions on Visualization and Computer Graphics251903–913. \PrintBackRefs\CurrentBib
- Hullman \BOthers. (\APACyear2015) \APACinsertmetastarhullman2015hypothetical{APACrefauthors}Hullman, J., Resnick, P.\BCBL \BBA Adar, E. \APACrefYearMonthDay2015. \BBOQ\APACrefatitleHypothetical outcome plots outperform error bars and violin plots for inferences about reliability of variable ordering Hypothetical outcome plots outperform error bars and violin plots for inferences about reliability of variable ordering.\BBCQ \APACjournalVolNumPagesPloS One1011e0142444. \PrintBackRefs\CurrentBib
- Jarvenpaa (\APACyear1990) \APACinsertmetastarjarvenpaa1990graphic{APACrefauthors}Jarvenpaa, S\BPBIL. \APACrefYearMonthDay1990. \BBOQ\APACrefatitleGraphic displays in decision making—the visual salience effect Graphic displays in decision making—the visual salience effect.\BBCQ \APACjournalVolNumPagesJournal of Behavioral Decision Making34247–262. \PrintBackRefs\CurrentBib
- Kale \BOthers. (\APACyear2020) \APACinsertmetastarkale2020visual{APACrefauthors}Kale, A., Kay, M.\BCBL \BBA Hullman, J. \APACrefYearMonthDay2020. \BBOQ\APACrefatitleVisual reasoning strategies for effect size judgments and decisions Visual reasoning strategies for effect size judgments and decisions.\BBCQ \APACjournalVolNumPagesIEEE Transactions on Visualization and Computer Graphics. \PrintBackRefs\CurrentBib
- Kale \BOthers. (\APACyear2018) \APACinsertmetastarkale2018hypothetical{APACrefauthors}Kale, A., Nguyen, F., Kay, M.\BCBL \BBA Hullman, J. \APACrefYearMonthDay2018. \BBOQ\APACrefatitleHypothetical outcome plots help untrained observers judge trends in ambiguous data Hypothetical outcome plots help untrained observers judge trends in ambiguous data.\BBCQ \APACjournalVolNumPagesIEEE Transactions on Visualization and Computer Graphics251892–902. \PrintBackRefs\CurrentBib
- Karwa \BBA Vadhan (\APACyear2017) \APACinsertmetastarkarwa2017finite{APACrefauthors}Karwa, V.\BCBT \BBA Vadhan, S. \APACrefYearMonthDay2017. \BBOQ\APACrefatitleFinite sample differentially private confidence intervals Finite sample differentially private confidence intervals.\BBCQ \APACjournalVolNumPagesarXiv preprint arXiv:1711.03908. \PrintBackRefs\CurrentBib
- Kasiviswanathan \BBA Smith (\APACyear2014) \APACinsertmetastarkasiviswanathan2014semantics{APACrefauthors}Kasiviswanathan, S\BPBIP.\BCBT \BBA Smith, A. \APACrefYearMonthDay2014. \BBOQ\APACrefatitleOn the ’semantics’ of differential privacy: A bayesian formulation On the ’semantics’ of differential privacy: A bayesian formulation.\BBCQ \APACjournalVolNumPagesJournal of Privacy and Confidentiality61. \PrintBackRefs\CurrentBib
- Kay \BOthers. (\APACyear2016) \APACinsertmetastarkay2016ish{APACrefauthors}Kay, M., Kola, T., Hullman, J\BPBIR.\BCBL \BBA Munson, S\BPBIA. \APACrefYearMonthDay2016. \BBOQ\APACrefatitleWhen (ish) is my bus? user-centered visualizations of uncertainty in everyday, mobile predictive systems When (ish) is my bus? user-centered visualizations of uncertainty in everyday, mobile predictive systems.\BBCQ \BIn \APACrefbtitleProceedings of the 2016 CHI Conference on Human Factors in Computing Systems Proceedings of the 2016 CHI Conference on Human Factors in Computing Systems (\BPGS 5092–5103). \PrintBackRefs\CurrentBib
- Kho \BOthers. (\APACyear2014) \APACinsertmetastarkho2014capricorn{APACrefauthors}Kho, A\BPBIN., Hynes, D\BPBIM\BPBID., Goel, S., Solomonides, A\BPBIE., Price, R., Hota, B.\BDBLOthers \APACrefYearMonthDay2014. \BBOQ\APACrefatitleCAPriCORN: Chicago Area Patient-Centered Outcomes Research Network CAPriCORN: Chicago Area Patient-Centered Outcomes Research Network.\BBCQ \APACjournalVolNumPagesJournal of the American Medical Informatics Association214607–611. {APACrefURL} http://jamia.oxfordjournals.org/content/21/4/607.short \PrintBackRefs\CurrentBib
- Kifer \BBA Machanavajjhala (\APACyear2011) \APACinsertmetastarkifer2011no{APACrefauthors}Kifer, D.\BCBT \BBA Machanavajjhala, A. \APACrefYearMonthDay2011. \BBOQ\APACrefatitleNo free lunch in data privacy No free lunch in data privacy.\BBCQ \BIn \APACrefbtitleProceedings of the 2011 ACM SIGMOD International Conference on Management of data Proceedings of the 2011 ACM SIGMOD International Conference on Management of data (\BPGS 193–204). \PrintBackRefs\CurrentBib
- Kifer \BBA Machanavajjhala (\APACyear2012) \APACinsertmetastarkifer2012rigorous{APACrefauthors}Kifer, D.\BCBT \BBA Machanavajjhala, A. \APACrefYearMonthDay2012. \BBOQ\APACrefatitleA rigorous and customizable framework for privacy A rigorous and customizable framework for privacy.\BBCQ \BIn \APACrefbtitleProceedings of the 31st ACM SIGMOD-SIGACT-SIGAI symposium on Principles of Database Systems Proceedings of the 31st ACM SIGMOD-SIGACT-SIGAI symposium on Principles of Database Systems (\BPGS 77–88). \PrintBackRefs\CurrentBib
- Lee \BBA Clifton (\APACyear2011) \APACinsertmetastarlee2011much{APACrefauthors}Lee, J.\BCBT \BBA Clifton, C. \APACrefYearMonthDay2011. \BBOQ\APACrefatitleHow Much is Enough? Choosing for Differential Privacy How Much is Enough? Choosing for Differential Privacy.\BBCQ \BIn \APACrefbtitleInternational Conference on Information Security International Conference on Information Security (\BPGS 325–340). \PrintBackRefs\CurrentBib
- Li \BOthers. (\APACyear2015) \APACinsertmetastarli2015matrix{APACrefauthors}Li, C., Miklau, G., Hay, M., McGregor, A.\BCBL \BBA Rastogi, V. \APACrefYearMonthDay2015. \BBOQ\APACrefatitleThe matrix mechanism: optimizing linear counting queries under differential privacy The matrix mechanism: optimizing linear counting queries under differential privacy.\BBCQ \APACjournalVolNumPagesThe VLDB journal246757–781. \PrintBackRefs\CurrentBib
- Liu \BOthers. (\APACyear2019) \APACinsertmetastarliu2019investigating{APACrefauthors}Liu, C., He, X., Chanyaswad, T., Wang, S.\BCBL \BBA Mittal, P. \APACrefYearMonthDay2019. \BBOQ\APACrefatitleInvestigating Statistical Privacy Frameworks from the Perspective of Hypothesis Testing. Investigating Statistical Privacy Frameworks from the Perspective of Hypothesis Testing.\BBCQ \APACjournalVolNumPagesProc. Priv. Enhancing Technol.20193233–254. \PrintBackRefs\CurrentBib
- Machanavajjhala \BOthers. (\APACyear2008) \APACinsertmetastarmachanavajjhala2008privacy{APACrefauthors}Machanavajjhala, A., Kifer, D., Abowd, J., Gehrke, J.\BCBL \BBA Vilhuber, L. \APACrefYearMonthDay2008. \BBOQ\APACrefatitlePrivacy: Theory meets practice on the map Privacy: Theory meets practice on the map.\BBCQ \BIn \APACrefbtitle2008 IEEE 24th International Conference on Data Engineering 2008 IEEE 24th International Conference on Data Engineering (\BPGS 277–286). \PrintBackRefs\CurrentBib
- McKenna \BOthers. (\APACyear2018) \APACinsertmetastarmckenna2018optimizing{APACrefauthors}McKenna, R., Miklau, G., Hay, M.\BCBL \BBA Machanavajjhala, A. \APACrefYearMonthDay2018. \BBOQ\APACrefatitleOptimizing error of high-dimensional statistical queries under differential privacy Optimizing error of high-dimensional statistical queries under differential privacy.\BBCQ \APACjournalVolNumPagesProceedings of the VLDB Endowment11101206–1219. \PrintBackRefs\CurrentBib
- McSherry (\APACyear2009) \APACinsertmetastarpinq09{APACrefauthors}McSherry, F\BPBID. \APACrefYearMonthDay2009. \BBOQ\APACrefatitlePrivacy Integrated Queries: An Extensible Platform for Privacy-preserving Data Analysis Privacy Integrated Queries: An Extensible Platform for Privacy-preserving Data Analysis.\BBCQ \BIn \APACrefbtitleProceedings of the 2009 ACM SIGMOD International Conference on Management of Data, series = SIGMOD ’09 Proceedings of the 2009 ACM SIGMOD International Conference on Management of Data, series = SIGMOD ’09 (\BPGS 19–30). \APACaddressPublisherNew York, NY, USAACM. {APACrefURL} http://doi.acm.org/10.1145/1559845.1559850 {APACrefDOI} 10.1145/1559845.1559850 \PrintBackRefs\CurrentBib
- Messing \BOthers. (\APACyear2020) \APACinsertmetastarfb_urls{APACrefauthors}Messing, S., DeGregorio, C., Hillenbrand, B., King, G., Mahanti, S., Mukerjee, Z.\BDBLWilkins, A. \APACrefYearMonthDay2020. \BBOQ\APACrefatitleURLs-v3.pdf Urls-v3.pdf.\BBCQ \BIn \APACrefbtitleFacebook Privacy-Protected Full URLs Data Set. Facebook Privacy-Protected Full URLs Data Set. \APACaddressPublisherHarvard Dataverse. {APACrefURL} https://doi.org/10.7910/DVN/TDOAPG/DGSAMS {APACrefDOI} 10.7910/DVN/TDOAPG/DGSAMS \PrintBackRefs\CurrentBib
- Mironov (\APACyear2012) \APACinsertmetastarmironov2012significance{APACrefauthors}Mironov, I. \APACrefYearMonthDay2012. \BBOQ\APACrefatitleOn significance of the least significant bits for differential privacy On significance of the least significant bits for differential privacy.\BBCQ \BIn \APACrefbtitleProceedings of the 2012 ACM Conference on Computer and Communications Security Proceedings of the 2012 ACM Conference on Computer and Communications Security (\BPGS 650–661). \PrintBackRefs\CurrentBib
- Mironov (\APACyear2017) \APACinsertmetastarmironov2017renyi{APACrefauthors}Mironov, I. \APACrefYearMonthDay2017. \BBOQ\APACrefatitleRényi differential privacy Rényi differential privacy.\BBCQ \BIn \APACrefbtitle2017 IEEE 30th Computer Security Foundations Symposium (CSF) 2017 IEEE 30th Computer Security Foundations Symposium (CSF) (\BPGS 263–275). \PrintBackRefs\CurrentBib
- Morgenstern \BBA Von Neumann (\APACyear1953) \APACinsertmetastarmorgenstern1953theory{APACrefauthors}Morgenstern, O.\BCBT \BBA Von Neumann, J. \APACrefYear1953. \APACrefbtitleTheory of games and economic behavior Theory of games and economic behavior. \APACaddressPublisherPrinceton University Press. \PrintBackRefs\CurrentBib
- Neyman \BBA Pearson (\APACyear2020) \APACinsertmetastarneyman2020use{APACrefauthors}Neyman, J.\BCBT \BBA Pearson, E\BPBIS. \APACrefYear2020. \APACrefbtitleOn the use and interpretation of certain test criteria for purposes of statistical inference. Part I. On the use and interpretation of certain test criteria for purposes of statistical inference. Part I. \APACaddressPublisherUniversity of California Press. \PrintBackRefs\CurrentBib
- Nissim \BOthers. (\APACyear2007) \APACinsertmetastarnissim2007smooth{APACrefauthors}Nissim, K., Raskhodnikova, S.\BCBL \BBA Smith, A. \APACrefYearMonthDay2007. \BBOQ\APACrefatitleSmooth sensitivity and sampling in private data analysis Smooth sensitivity and sampling in private data analysis.\BBCQ \BIn \APACrefbtitleProceedings of the Thirty-Ninth Annual ACM Symposium on Theory of Computing Proceedings of the Thirty-Ninth Annual ACM Symposium on Theory of Computing (\BPGS 75–84). \PrintBackRefs\CurrentBib
- Rivasplata (\APACyear2012) \APACinsertmetastarrivasplata2012subgaussian{APACrefauthors}Rivasplata, O. \APACrefYearMonthDay2012. \BBOQ\APACrefatitleSubgaussian random variables: An expository note Subgaussian random variables: An expository note.\BBCQ \APACjournalVolNumPagesInternet publication, PDF. \PrintBackRefs\CurrentBib
- Rogers \BOthers. (\APACyear2020) \APACinsertmetastarrogers2020members{APACrefauthors}Rogers, R., Cardoso, A\BPBIR., Mancuhan, K., Kaura, A., Gahlawat, N., Jain, N.\BDBLAhammad, P. \APACrefYearMonthDay2020. \BBOQ\APACrefatitleA Members First Approach to Enabling LinkedIn’s Labor Market Insights at Scale A Members First Approach to Enabling LinkedIn’s Labor Market Insights at Scale.\BBCQ \APACjournalVolNumPagesarXiv preprint arXiv:2010.13981. \PrintBackRefs\CurrentBib
- Savage (\APACyear1954) \APACinsertmetastarsavage1954foundations{APACrefauthors}Savage, L\BPBIJ. \APACrefYear1954. \APACrefbtitleThe foundations of statistics The foundations of statistics. \APACaddressPublisherWiley. \PrintBackRefs\CurrentBib
- Schwarz \BBA Sutherland (\APACyear1997) \APACinsertmetastarschwarz1997{APACrefauthors}Schwarz, C\BPBIJ.\BCBT \BBA Sutherland, J. \APACrefYearMonthDay1997. \BBOQ\APACrefatitleAn on-line workshop using a simple capture-recapture experiment to illustrate the concepts of a sampling distribution An on-line workshop using a simple capture-recapture experiment to illustrate the concepts of a sampling distribution.\BBCQ \APACjournalVolNumPagesJournal of Statistics Education51. \PrintBackRefs\CurrentBib
- Shepp \BBA Vardi (\APACyear1982) \APACinsertmetastarshepp1982maximum{APACrefauthors}Shepp, L\BPBIA.\BCBT \BBA Vardi, Y. \APACrefYearMonthDay1982. \BBOQ\APACrefatitleMaximum likelihood reconstruction for emission tomography Maximum likelihood reconstruction for emission tomography.\BBCQ \APACjournalVolNumPagesIEEE Transactions on Medical Imaging12113–122. \PrintBackRefs\CurrentBib
- St. John \BOthers. (\APACyear2021) \APACinsertmetastarjohn2021decision{APACrefauthors}St. John, M\BPBIF., Denker, G., Laud, P., Martiny, K.\BCBL \BBA Pankova, A. \APACrefYearMonthDay2021. \BBOQ\APACrefatitleDecision Support for Sharing Data Using Differential Privacy Decision Support for Sharing Data Using Differential Privacy.\BBCQ \APACjournalVolNumPagesIEEE Transactions on Visualization and Computer Graphics26–35. \PrintBackRefs\CurrentBib
- Sweeney (\APACyear2002) \APACinsertmetastarsweeney2002k{APACrefauthors}Sweeney, L. \APACrefYearMonthDay2002. \BBOQ\APACrefatitlek-anonymity: A model for protecting privacy k-anonymity: A model for protecting privacy.\BBCQ \APACjournalVolNumPagesInternational Journal of Uncertainty, Fuzziness and Knowledge-Based Systems1005557–570. \PrintBackRefs\CurrentBib
- Tableau Software (\APACyear\bibnodate) \APACinsertmetastartableau10{APACrefauthors}Tableau Software. \APACrefYearMonthDay\bibnodate. \APACrefbtitleColor Palettes with RGB Values. Color Palettes with RGB Values. \PrintBackRefs\CurrentBib
- Tang \BOthers. (\APACyear2017) \APACinsertmetastartang2017privacy{APACrefauthors}Tang, J., Korolova, A., Bai, X., Wang, X.\BCBL \BBA Wang, X. \APACrefYearMonthDay2017. \BBOQ\APACrefatitlePrivacy loss in apple’s implementation of differential privacy on macos 10.12 Privacy loss in apple’s implementation of differential privacy on macos 10.12.\BBCQ \APACjournalVolNumPagesarXiv preprint arXiv:1709.02753. \PrintBackRefs\CurrentBib
- Thaker \BOthers. (\APACyear2020) \APACinsertmetastarthaker2020overlook{APACrefauthors}Thaker, P., Budiu, M., Gopalan, P., Wieder, U.\BCBL \BBA Zaharia, M. \APACrefYearMonthDay2020. \BBOQ\APACrefatitleOverlook: Differentially Private Exploratory Visualization for Big Data Overlook: Differentially Private Exploratory Visualization for Big Data.\BBCQ \APACjournalVolNumPagesarXiv preprint arXiv:2006.12018. \PrintBackRefs\CurrentBib
- Wasserman \BBA Zhou (\APACyear2010) \APACinsertmetastarwasserman2010statistical{APACrefauthors}Wasserman, L.\BCBT \BBA Zhou, S. \APACrefYearMonthDay2010. \BBOQ\APACrefatitleA statistical framework for differential privacy A statistical framework for differential privacy.\BBCQ \APACjournalVolNumPagesJournal of the American Statistical Association105489375–389. \PrintBackRefs\CurrentBib
- Wilkinson (\APACyear1999) \APACinsertmetastarwilkinson1999dot{APACrefauthors}Wilkinson, L. \APACrefYearMonthDay1999. \BBOQ\APACrefatitleDot plots Dot plots.\BBCQ \APACjournalVolNumPagesThe American Statistician533276–281. \PrintBackRefs\CurrentBib
- Wong \BOthers. (\APACyear2007) \APACinsertmetastarwong2007minimality{APACrefauthors}Wong, R\BPBIC\BHBIW., Fu, A\BPBIW\BHBIC., Wang, K.\BCBL \BBA Pei, J. \APACrefYearMonthDay2007. \BBOQ\APACrefatitleMinimality attack in privacy preserving data publishing Minimality attack in privacy preserving data publishing.\BBCQ \BIn \APACrefbtitleProceedings of the 33rd International Conference on Very Large Data Bases Proceedings of the 33rd International Conference on Very Large Data Bases (\BPGS 543–554). \PrintBackRefs\CurrentBib
- Wright \BBA Monk (\APACyear1991) \APACinsertmetastarwright1991use{APACrefauthors}Wright, P\BPBIC.\BCBT \BBA Monk, A\BPBIF. \APACrefYearMonthDay1991. \BBOQ\APACrefatitleThe use of think-aloud evaluation methods in design The use of think-aloud evaluation methods in design.\BBCQ \APACjournalVolNumPagesACM SIGCHI Bulletin23155–57. \PrintBackRefs\CurrentBib
- Xiong \BOthers. (\APACyear2020) \APACinsertmetastarxiong2020towards{APACrefauthors}Xiong, A., Wang, T., Li, N.\BCBL \BBA Jha, S. \APACrefYearMonthDay2020. \BBOQ\APACrefatitleTowards Effective Differential Privacy Communication for Users’ Data Sharing Decision and Comprehension Towards Effective Differential Privacy Communication for Users’ Data Sharing Decision and Comprehension.\BBCQ \BIn \APACrefbtitle2020 IEEE Symposium on Security and Privacy (SP) 2020 IEEE Symposium on Security and Privacy (SP) (\BPGS 392–410). \PrintBackRefs\CurrentBib
- Yang \BOthers. (\APACyear2015) \APACinsertmetastaryang2015bayesian{APACrefauthors}Yang, B., Sato, I.\BCBL \BBA Nakagawa, H. \APACrefYearMonthDay2015. \BBOQ\APACrefatitleBayesian differential privacy on correlated data Bayesian differential privacy on correlated data.\BBCQ \BIn \APACrefbtitleProceedings of the 2015 ACM SIGMOD International Conference on Management of Data Proceedings of the 2015 ACM SIGMOD International Conference on Management of Data (\BPGS 747–762). \PrintBackRefs\CurrentBib