CLUE: Contextualised Unified Explainable Learning of User Engagement in Video Lectures
Abstract.
Predicting contextualised engagement in videos is a long-standing problem that has been popularly attempted by exploiting the number of views or the associated likes using different computational methods. The recent decade has seen a boom in online learning resources, and during the pandemic, there has been an exponential rise of online teaching videos without much quality control. The quality of the content could be improved if the creators could get constructive feedback on their content. Employing an army of domain expert volunteers to provide feedback on the videos might not scale. As a result, there has been a steep rise in developing computational methods to predict a user engagement score that is indicative of some form of possible user engagement, i.e., to what level a user would tend to engage with the content. A drawback in current methods is that they model various features separately, in a cascaded approach, that is prone to error propagation. Besides, most of them do not provide crucial explanations on how the creator could improve their content. In this paper, we have proposed a new unified model, CLUE for the educational domain, which learns from the features extracted from freely available public online teaching videos and provides explainable feedback on the video along with a user engagement score. Given the complexity of the task, our unified framework employs different pre-trained models working together as an ensemble of classifiers. Our model exploits various multi-modal features to model the complexity of language, context agnostic information, textual emotion of the delivered content, animation, speaker’s pitch and speech emotions. Under a transfer learning setup, the overall model, in the unified space, is fine-tuned for downstream applications. Our results show that our model can detect engagement reliably with 85% accuracy and the explainability component helps give feedback to the creator where the content needs further improvement.
1. Introduction
The ongoing pandemic has resulted in various teaching and research organizations resorting to online lectures. What is predominantly seen today is that different academicians across the globe are creating teaching materials and have started to share them online with students as Open Educational Resources (OERs) (Ehlers et al., 2018) such as Massive Online Open Courses (MOOCs) to boost the online learning. Users are now overwhelmed by the amount of data, for instance, on YouTube alone, searching for “Deep Learning Lectures” retrieves hundreds of results ranging from content created by various individuals to organisations worldwide. The ideal option for any user is to select the one that they could engage with reliably. While beliefs and biases (White, 2013) do surround the choice of the videos, e.g., videos from a popular academician in a well-known organisation could be regarded as more interesting than others, this may not always be true. Simply relying on user ratings or modelling text extracted from the video recordings alone might not lead to desirable results because these features do not capture the overall quality of the content. Given the extensive and discrete number of educational materials, new and automated management ways are being devised where mostly cascaded models are used to predict the engagement score (Bulathwela et al., 2020a). Regarding the OERs, this means to scale down the learners’ efforts of finding the material without compromising its quality. Such objectives are usually accomplished after studying the personalization factor (Bulathwela et al., 2020c) that is defined as contextual engagement which determines the extent of learners’ context about a particular learning source.
Utilising user feedback (e.g., the video is too one-sided or monotonous) is becoming an important and time-sensitive challenge for successfully leveraging intelligent and user-centric systems in various applications. In the domain of online educational resources, it is imperative to provide timely feedback of user engagement over a population. The feedback can not only make it easier for content creators to create suitable videos as per the target audience, but also it will be more effective in the online teaching tools. There has been growing interest in the domain of contextualised engagement in OER Bulathwela et al.. We argue that only a context agnostic model (Bulathwela et al., 2020a) cannot provide true user engagement, instead, we need an adaptive model, which utilises the features of a video lecture extensively and gives feedback for the engagement. Additionally, we put forward a crucial explainability approach, that can assimilate the information to improve the engagement with the target population.
The problem of automatically studying engagement is important because educators can create content that will optimize the engagement levels on their content. Besides, manual techniques, such as employing an army of domain-expert volunteers to view long videos and providing feedback is too time-consuming. In our model, the automated system provides feedback to an educator that the engagement quality of the teaching content is not faithful. While it can be argued that personalisation is more appropriate in such problem scenarios, personalisation exploits users’ historical data and many users might not be willing to share their data such as their location, their click-through patterns, among others. Therefore, works such as (Bulathwela et al., 2020a) have largely focused on non-personalised prediction problems. What is interesting in our work is that we provide feedback to the content creator to help understand which areas they need to improve, e.g., should they add more animations. One key advantage of our model is that it is crucial to a user who might end up wasting plenty of time searching for ideal content suited to their learning behaviour, e.g., some users prefer more animations in their videos.
There has been a growing interest in the contextualised engagement (Bulathwela et al., 2020b) in recent years which model text and likes associated with videos. We argue that there are other features of the video delivery mechanism, which can increase or decrease user engagement. The categorical model assumes that there are discrete emotional categories such as Ekman’s six basic emotions – anger, disgust, fear, joy, sadness, and surprise (Ekman, 1992). Emotion recognition has been explored considerably (Li et al., 2016; Wang et al., 2016; Baziotis et al., 2018; Meisheri and Dey, 2018; Du and Nie, 2018; Alswaidan and Menai, 2020). In our model, we have modelled the emotional variation of the speaker to time. There have been previous attempts at predicting emotions from speech (Lugger et al., 2009; Schuller et al., 2005; Nicholson et al., 2000; Engberg and Hansen, 1996; Burkhardt et al., 2005; Nwe et al., 2003) where the average classification accuracy of speaker-independent speech emotion recognition systems is less than 70% in most of these proposed techniques. For example, it is 50% in (Nicholson et al., 2000), 67% in (Engberg and Hansen, 1996), 80% in (Burkhardt et al., 2005), and 65% in (Nwe et al., 2003). We go beyond these existing methods and develop our speaker-independent emotion recognition model unified with an ensemble of learners to model the user engagement problem reliably.
Our hypothesis is that engagement cannot be directly exploited using text alone in lecture videos as it has been done in some of the past works (Bulathwela et al., 2020a). There is various complementary information that we could exploit from online lecture videos such as speaker intonation, speaker’s use of animations, emotions, among others that have not been explored in prior works. We develop a novel unified framework that goes beyond the current techniques that measure user engagement. We expect that over time, our research would have a significant impact in the education domain, where users could find a plethora of engaging free materials online. It will lead to a significant positive step towards achieving the global development goals. To the best of our knowledge, this is the first work in the area of contextualized engagement, where we exploit other features beyond just text extracted from video lectures.
Our key contributions include:
-
•
A novel unified model that learns to fine-tune its parameters by exploiting the predictive error of several pre-trained models in an ensemble setup.
-
•
The model not only predicts an engagement score but also provides explainable feedback to the content creator.
-
•
We have conducted experiments on publicly available free videos and the dataset will be shared with the community given the lack of freely available public benchmark datasets in this problem domain.
-
•
Given the importance of low-resource data modelling, we demonstrate that our model is reliable under low-resource settings, i.e., settings when we have fewer data.
2. Related Work
Bulathwela et al. in (Bulathwela et al., 2020a) developed a technique to learn text feature vectors from video lectures. They obtained a proprietary dataset from VideoLecture.net, which is not publicly available. They extracted different features from the videos in this dataset and trained a regression model to determine the overall prediction score. While the work is closely related to ours, there are some key differences. We have developed a novel unified approach to model various multi-modalities present in the videos which (Bulathwela et al., 2020a) have not done. We have argued that only textual features might not suffice when predicting the overall engagement score. While our results cannot be directly compared with theirs because of the non-availability of their dataset, our model is superior in a variety of ways, mainly in how it models the problem in a unified setup modelling different multi-modalities including modelling explainability. Zhou and Bhat in (Zhou and Bhat, 2021) developed a novel unsupervised model sequence mining and information retrieval coupled with a clustering algorithm to extract engagement patterns of learners. Their goal is to mainly extract consistent patterns in learning behaviour. As a result, this work is fundamentally different from ours in various ways, where our goal is not to learn consistency levels.
Chen et al. in (Chen et al., 2020) have developed a technique to model automated disengagement that detects learners’ maladaptive behaviours, e.g. mind-wandering and impetuous responding. While their work does not develop a novel computational model as ours, our framework is both novel and fundamentally different from this work where our goal is to model user engagement and provide feedback to the user through its explainability model. Recently, Bulathwela et al. in (Bulathwela et al., 2020c) developed a novel recommendation framework that considers several background information of a user, for instance, learner’s knowledge of the topic. While they extend their prior work in (Bulathwela et al., 2020a), their main focus in this work is to develop a recommender system for predicting the engagement score as in our work. In Bulathwela et al. (Bulathwela et al., 2020d), the authors have created a new dataset of video lectures. However, they have not shared the videos, hence other researchers are unable to extract new features from them.
We have exploited different features, which could help to improve the engagement score of our model, for instance, we have exploited emotions from text and speech to model engagement. We have also exploited object detection techniques to further improve our results. As a result, our model can learn from various key representative features which are crucial towards determining the overall engagement score including modelling explainability. For instance, by modelling different objects in the videos during teaching, we can model that the teacher is using different teaching methods. The importance of emotions has been highlighted in many other works, for instance, Nias; Nias studied the emotional aspects of teachers in the UK. The authors conclude that the emotions of the instructor play a vital role in teaching since it helps improve engagement of the subject. Recently, in (Jimenez-Liso et al., 2021), Jimenez-Liso et al. studied the important question, “What is the nature of preservice teachers’ emotions throughout their engagement in the sequence?” They concluded that “emotions in science education as they illustrate the importance of providing preservice teachers with opportunities to explore their emotions especially in relation to self-regulation when engaging in teaching sequences in teacher preparation.”
3. CLUE: Our Novel Framework
In this section, we describe our full framework which models the engagement score along with providing explanations to help the content creator improve their videos. The engagement score measures how likely the user will engage with the content. The explanations provided by the model will help the content creator in understanding the key shortcomings in the content which will help improve the quality. The key design principle of our model is to exploit the advantages of different existing pre-trained complementary models. These models are combined, as an ensemble of models, working as a unified machine learning model where they make predictions jointly rather than as a cascaded model which will result in error propagation. This design paradigm gives us a direct advantage that we can model multi-modal features using the most suitable computational model for the feature-type, for instance, frame representations can most ideally be learned using a Convolutional Neural Network (CNN) model than a random forest model which is most ideally designed to model text in our problem setup, and subsequently make predictions in a unified way. While all individual pre-trained models play a key role in the overall predictive performance, some can be further fine-tuned based on the data characteristic leading to more faithful results, for instance, the pre-trained BERT (Devlin et al., 2018) model can be fine-tuned given the data than using the original fine-tuned BERT alone. Similarly, we can fine-tune the CNN model on our data in an iterative way. As a result, we exploit the key advantage of transfer learning.
We model emotion-based features from text and speech followed by object detection. Emotion in teaching has received plenty of attention in literature (Nias, 1996). Emotions in the classroom are not only a private matter but also a political space in which students and teachers interact with implications in larger political and cultural struggles (Zembylas, 2007). Besides, automatic object detection can help the model understand what else a teacher uses while teaching, e.g., are there some classroom activities organised. In our model, these complementary models contribute towards our overall goal of engagement prediction and explainability. To extract and learn different features from publicly available datasets, we have used a variety of state-of-the-art models which we apply in the predictive analysis tasks. Our overall framework comprises of, 1) text-based context agnostics, 2) text-based emotions, 3) speech-based emotions and 4) object detection, which we show to play a significant role towards our overall goal. There are certain key tasks that we need to do, for instance, extraction of features, learning those features using relevant models and using our unified machinery on these individual complementary pre-trained models to derive their weights leading to a prediction score.
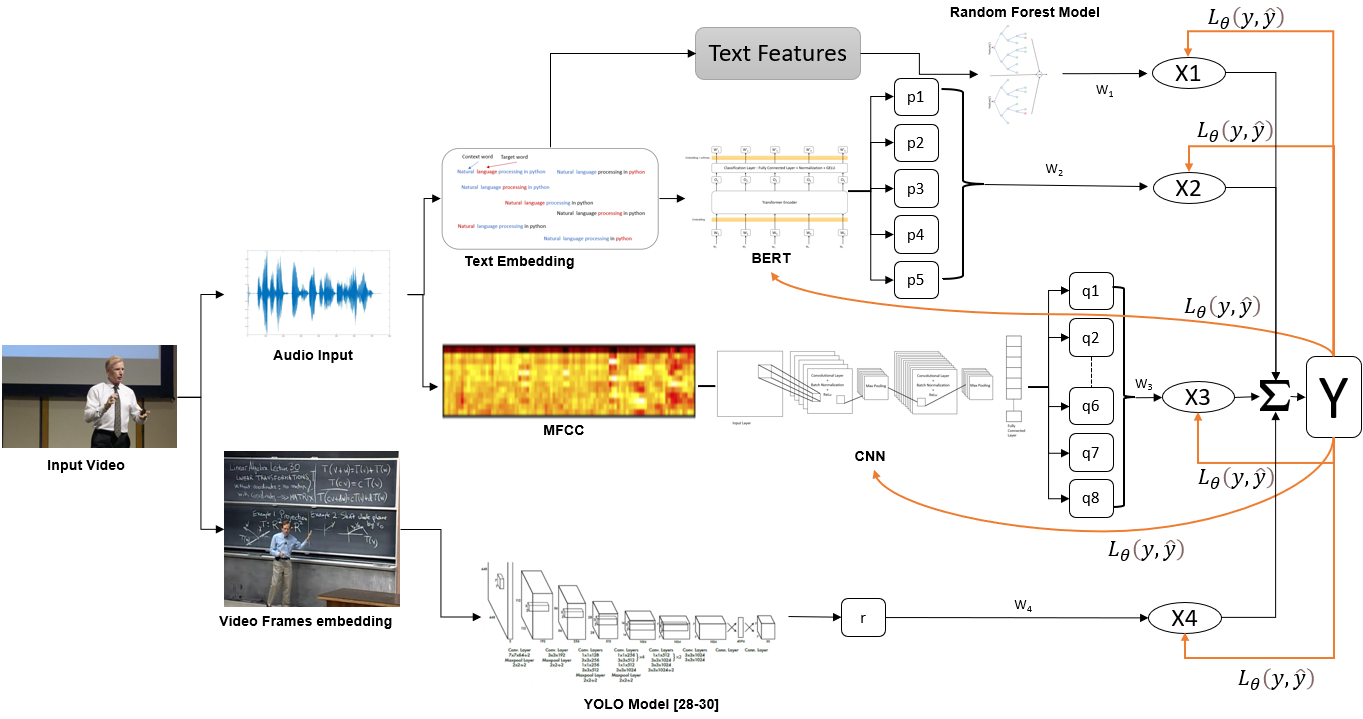
In our novel modelling architecture depicted in Figure 1, from the text transcript, we predict by random forest and by BERT model, where , , , , is the output of text-based emotion. Using the audio feature we predict based on the probability of , , …, which represents speech-based emotion. Finally, is the count of objects that appeared in the video. We then combine these output of models and predict where the parameter training of our model and the fine-tuning of the pre-trained BERT and CNN models take place simultaneously based on the feedback of .
| Feature | |
|---|---|
| Conjugate_rate | Count of conjunctions used by the speaker in a particular video |
| Pronoun_rate | Count of pronouns used by the speaker in a particular video. |
| preposition_rate | Count of prepositions used by the speaker in a particular video. |
| tobe_verb_rate | Count of times the speaker used (“be”, “being”, “was”, “were”, “been”, “are”, “is”) in a video lecture. |
| auxiliary_rate | Count of times speakers used auxiliary verbs in a video. |
| normalization_rate | Count of words used by the speaker which were ended with suffixes (“tion”, “ment”, “ence”, “ance”) |
| fraction_stopword_coverage | It is the ratio of stopwords used by the speaker to the total stopwords |
| Fraction_stopword_presence | It is the ratio of stopwords used by the speaker to the total number of words used by the speaker in a particular video |
| Easiness | It will give the readability level of the text of a video. |
| Document_entrophy | Entropy of words for a particular video. |
| word_count | Total count of words used by a speaker in a particular video. |
| title_word_count | Count of title words for a particular video. |
| Duration | Length (Time) of video file. |
| Speaker speed | Count of words used by a speaker per minute. |
3.0.1. Text based Context Agnostics
We have used VideoLecturesNet (VLN) dataset (Bulathwela et al., 2020a) which has been categorized into 21 different subjects, such as Computer Science, Physics, Philosophy, etc. To extract the context engagement model we extracted features from the VLN dataset, which are, ‘duration’, ‘conjugate rate’, ‘normalization rate’, ‘tobe verb rate’, ‘auxiliary rate’, ‘preposition rate’, ‘pronoun rate’, ‘document entropy’, ‘easiness’, ‘fraction stopword coverage’, ‘fraction stopword presence’, ‘title word count’, ‘word count’, ‘speaker speed’, ‘median engagement rate’. The subset of cross-modal and language-based features were selected from the VLN dataset. The 14 extracted features can be seen in Table 1. The description of the features is also shown in table 1 which are our novel features to suit our problem task. We split the data in 67% for training and 33% for the test. The random forest regressor was used to train as the model with median engagement rate as a prediction variable ranging from 0-1 and was stored as X1 in CLUE. This model gave us better results in our case than the support vector-based model. Mean squared error was calculated from the predicted variable. The median engagement rate was calculated based on user feedback, star rating of videos, number of views, and likes for the videos.
3.0.2. Text based Emotions
For evaluating emotions in a text we have used the International Survey on Emotion Antecedents and Reactions (ISEAR) and Dailydialogue publicly available datasets. The ISEAR dataset (Scherer and Wallbott, 1994) contains the emotional statement that helped us to further train the model using the textual data. It contains 7666 sentences which are further divided into 6 emotional categories.
The dailydialogue dataset (Li et al., 2017) is a high-quality multi-turn dialog dataset. The dataset is constituted of human written statements which makes them less noisy. The dataset contains information that reflects our daily conversations and consists of a variety of topics about our daily lives. The dataset is also manually annotated in similar emotional categories to the aforementioned datasets. This dataset contains a total of 13,118 dialogues which are then split into 11,118 training dialogues and 1000 dialogues of validation and test set each.
The emotions were characterised into 5 categories, i.e. Joy, sadness, anger, fear, and neutral. The training size of the dataset was 27,261 and validation was 3,393. The model used for training the dataset was K-train based text BERT model. The maximum length of the unigrams is 35000 and the tokens are 350. We run the model for 5 epochs with a batch size equal to 12. The learning rate was kept . The output of the model was treated as an array with the probability of all the emotions, shown as p1, p2, p3, p4, p5 and was stored as X2 in CLUE.
3.0.3. Speech based Emotions
Emotions play an important role in teaching (Sutton and Wheatley, 2003). A monotonous video without any emotions will be relatively less engaging than those videos where the teacher exploits emotions. Besides emotion detection in the text, we also conduct emotion detection in speech which would lead to a more reliable understanding of the engagement factors in videos.
| Layers | Output Shape | Param | Activation |
| Input | [B, 180] | ||
| conv1D_1 | [B, 161, 128] | 2688 | ReLU |
| batch normalisation | [B, 161, 128] | 512 | |
| conv1D_2 | [B, 152, 64] | 81984 | ReLU |
| batch normalisation | [B, 152, 64] | 256 | |
| flatten | [B,4864] | ||
| dense_1 | [B,520] | 5059080 | |
| dense_2 | [B,8] | 4168 | Softmax |
| Total params : 5,148,688 | |||
| Trainable params : 5,148,304 | |||
| Non-trainable params : 384 | |||
To calculate Speech-based emotions three features, i.e., Mel-frequency cepstral coefficients (MFCC), chroma, and Mel spectrogram frequency were extracted from the speech waveform from the RAVDESS dataset. Ryerson Audio-Visual Database for Emotional Speech and Song (RAVDESS) dataset (Livingstone and Russo, 2018) consists of speech and song, audio and video files. For our analysis, we focused on the emotional speech and song files. There are 1440 files in the RAVDESS dataset that assist in analyzing the emotions from the speech. The RAVDESS dataset contains 24 actors (12 male and 12 female), who record the speech in lexically similar statements in a neutral North American accent. The speech dataset is further categorized into seven different emotions namely, “Calm”, “Happy”, “Sad”, “Angry”, “Fearful”, “Surprise” and “Disgust”. There are mainly two different levels of emotional intensities (Normal and Strong). There is also an additional third neutral expression.
The speech was classified into 8 categories, which are, “Angry”, “Sad”, “Happy”, “Neutral”, “Fear”, “Disgust”, “Surprise” and “Calm”. MFCC: Mel Frequency Cepstrum (MFC) is a representation of linear cosine transform of a short-term log power spectrum of a speech signal on a non-linear Mel scale of frequency. Mel-frequency cepstral coefficients (MFCCs) are together make up an MFC. MFCC extraction is of the type where all the characteristics of the speech signal are concentrated in the first few coefficients (Muda et al., 2010). Chroma-based features are used for identifying pitch-based information or they can also be referred to as pitch class profiles. The chroma representation is used for intensities of 12 distinct musical chromas of the octave at each time frame. By using chroma we generated a chromagram based on 12 pitch classes. The pitch classes in the particular order are as follows C, C#, D, D#, E, F, F#, G, G#, A, A#, B.
The total number of training samples was 1152 and validation samples were 288. We used 1D CNN for training the data. For the input layer, we extracted all the features and combined them horizontally, where the length of the input vector was 180. The length of the MFCC feature was 40, Mel was 128 and chroma was 12. After the input layer, we used 1D CNN layer with 128 filter sizes of 20 and a stride of 1. Post the CNN layer we used the batch normalization layer and the activation function was ReLU. We used another layer of 1D CNN with 64 filter sizes of 10. Another batch normalisation layer was used and the activation function was ReLU. We further used a dense layer of size 520 and then another dense layer of size 8 with softmax as an activation function. The training batch size was 16, the learning rate was , the loss was categorical cross-entropy and Adam was used as a training optimizer. Table 2 describes the model architecture and parameters. The output of the model was treated as an array with the probability of all the speech-based emotions, shown as , ,, and was stored as in CLUE.
3.0.4. Object Detection
Our motivation to include object detection is primarily to capture different objects in the videos (Sieber, 2001; Kay and Knaack, 2008), for instance, if there are animations in the videos, it would result in more objects than just the teacher and the students. Other use cases include if the teacher uses a variety of objects in a class to teach students in addition to traditional objects already found in the classrooms, for instance, a Physics teacher using a range of real-world objects to explain a concept. YOLO v3 uses logistic regression to compute the target score. It gives the score for all targets in each boundary box. YOLO v3 can give the multilabel classification because it uses a logistic classifier for each class in place of the softmax layer used in YOLO v2. YOLO v3 uses darknet 53. It has fifty-three layers of convolution. These layers are more in-depth compared to darknet 19 used in YOLO v2. Darknet-53 contains mainly 3x3 and 1x1 filters along with bypass links (Redmon and Farhadi, 1804; Redmon et al., 2015; Redmon and Farhadi, 2018). The output of the model was r where it counted the objects and animations that appeared in the video with respect to time and was stored as X4 in CLUE.
3.1. CLUE: Our Unified Engagement Score Model
We have used four different pre-trained models, giving complementary knowledge, to decode different features present in video lectures. While these models are pre-trained on specific tasks, our goal is to exploit these model parameters and develop an end-to-end novel unified deep learning framework. Out of these pre-trained models, CNN and BERT can be simultaneously fine-tuned while the unified model training is underway. In fine-tuning, we freeze some of the layers and fine-tune only specific layers which are needed for our task, for instance, in the pre-trained text language model, we only fine-tune the contextual layers, mainly, layer 12. Our framework is depicted in Figure 1 where we extract audio from video, and audio extraction of the speech to text is performed using the IBM Watson speech to text platform. After a speech to text, we have extracted 13 features based on their continued use in studies (Dalip et al., 2011; Warncke-Wang et al., 2013; Ntoulas et al., 2006; Guo et al., 2014; Bulathwela et al., 2020a). Table 1 depicts these extracted features, and apart from these features, we also trained the model to extract emotions from the text data. For training, the Emotion ISEAR, DAILYDIALOG, and KAGGLE Datasets were used. The model was trained on 27,261 sentences considering five classes, namely, “Joy”, “Sad”, “Fear”, “Anger”, “Neutral”. For emotion classification, the BERT model has been used. Mathematically, our model formulation is shown in Equation 1 where we linearly combine (convex combination) different models using four parameters. While these parameters could be arbitrarily assigned or given the same weights, we have trained these model parameters based on the data. To this end, we have used the backpropagation model to update these model parameters in each iteration, and simultaneously fine-tuned the individual models.
In Equation 1, is based on contextual engagement provided with contextual engagement score ranging from 0-1 based on 14 textual features. This is the regression-based model. provides the overall emotional distribution over 5 classes for the lecture transcript. This is the text-based model which exploits representation vectors obtained from the BERT language model. provides the emotion feedback with reference to time, based on the speaker’s tone and delivery speech which mainly exploits the speech data. detects the number of animation and objects with reference to time, which is the object detection model.
| (1) |
where is the prediction score. The individual weight parameters are the coefficients. Initially, will be initialised with random weights. After every watched video, we are collecting the user rating for the video (out of 5) and positive and negative comments. This user feedback is the real truth and is denoted by . To minimise the error we use the Huber loss (Huber, 1965) given by:
| (2) |
where is the normalised user feedback truth, is the predicted output and is the hyperparameter for a large or small error. Our objective is to minimize based on . The loss will be backpropagated for the individual model as well as the coefficients. Since it is a linear equation, the coefficients can also be optimised by the Gaussian process, but it would be highly unlikely that there will be a unique solution. Therefore, by using backpropagation we are aiming to optimise the model as well as the coefficients for the prediction of engagements. We run the backpropagation model for a certain number of iterations until the model parameters converge. In the end, we obtain the converged weight parameters followed by fine-tuned models learned in a unified way. The advantage that we get is that these parameters are trained in a consolidated parameter space which leads to more reliable results than approaches that use cascaded techniques where the output of one or more is fed as input to the next model. We found that, in our case, the results obtained from cascading models were too poor and that it was difficult to engineer the pipeline framework because there is no such pre-defined sequence rule for the models that we could engineer, e.g., should come before or vice-versa. In contrast, in our CLUE, all models work simultaneously. For initialising, the coefficients are , , and .
4. Experiments and Results
We have presented our experiments in two units where we first report results from the individual models to showcase that they contribute reliably. We then present results from our overall architecture to showcase how these pre-trained models contribute in a unified way when used under a transfer learning setup. Note that individual model results are treated as baseline results demonstrating that individually these models are not suitable to address the problem reliably.
4.1. Individual Model Performance
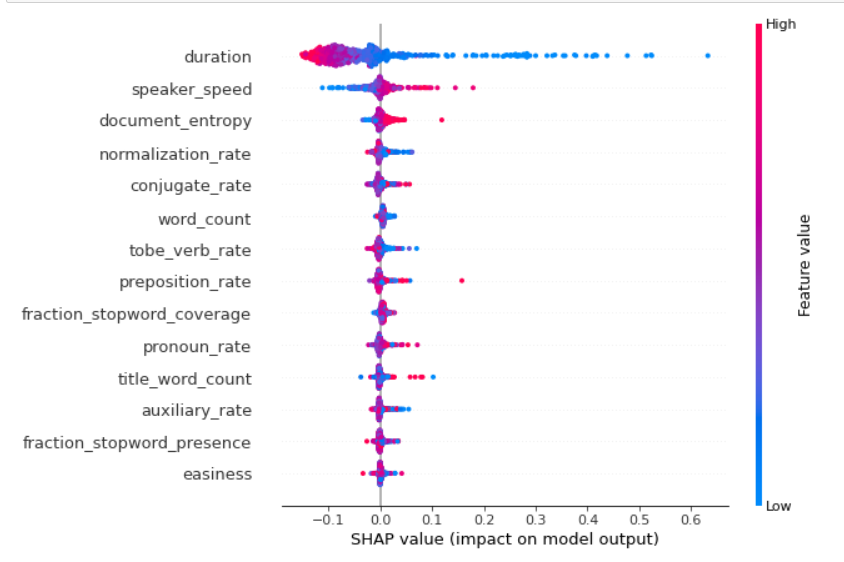
Using random forest regressor for contextualised engagement we obtained a mean squared error of 0.0173. Figure 2 shows the shap summary plot of different features for deciding by random forest regressor. The summary plot combines feature importance with feature effects. Each point on the summary plot is a Shapley value for a feature and an instance. The position on the y-axis is determined by the feature and on the x-axis by the Shapley value. The colour represents the value of the feature from low to high. The features are ordered according to their importance. We can see that the length of the video is the most important feature and longer lengths of videos have less impact on the model. Preposition_rate has a low effect on the model. Similarly, tobe_verb_rate has major effect on model but the used rate should be ¡0.03% (“be”, “being”, “was”, “were”, “been”, “are”, “is”). Auxilary_rate (“will”, “shall”, “cannot”, “may”, “need to”, “would”, “should”, “could”, “might”, “must”, “ought”, “ought to”,“can’t”, “can”) will provide with positive effect if the used rate is ¡0.025%. Speaker speed has more importance to the model and speed contributing positively to engagement is 115-120 words per minute. It should not be very low or very high. The easiness level determined should be more than 83 to have a positive impact on the model. A normalisation rate greater than 0.1 has a positive effect on the engagement score. Preposition_rate has a very minor effect on the model.
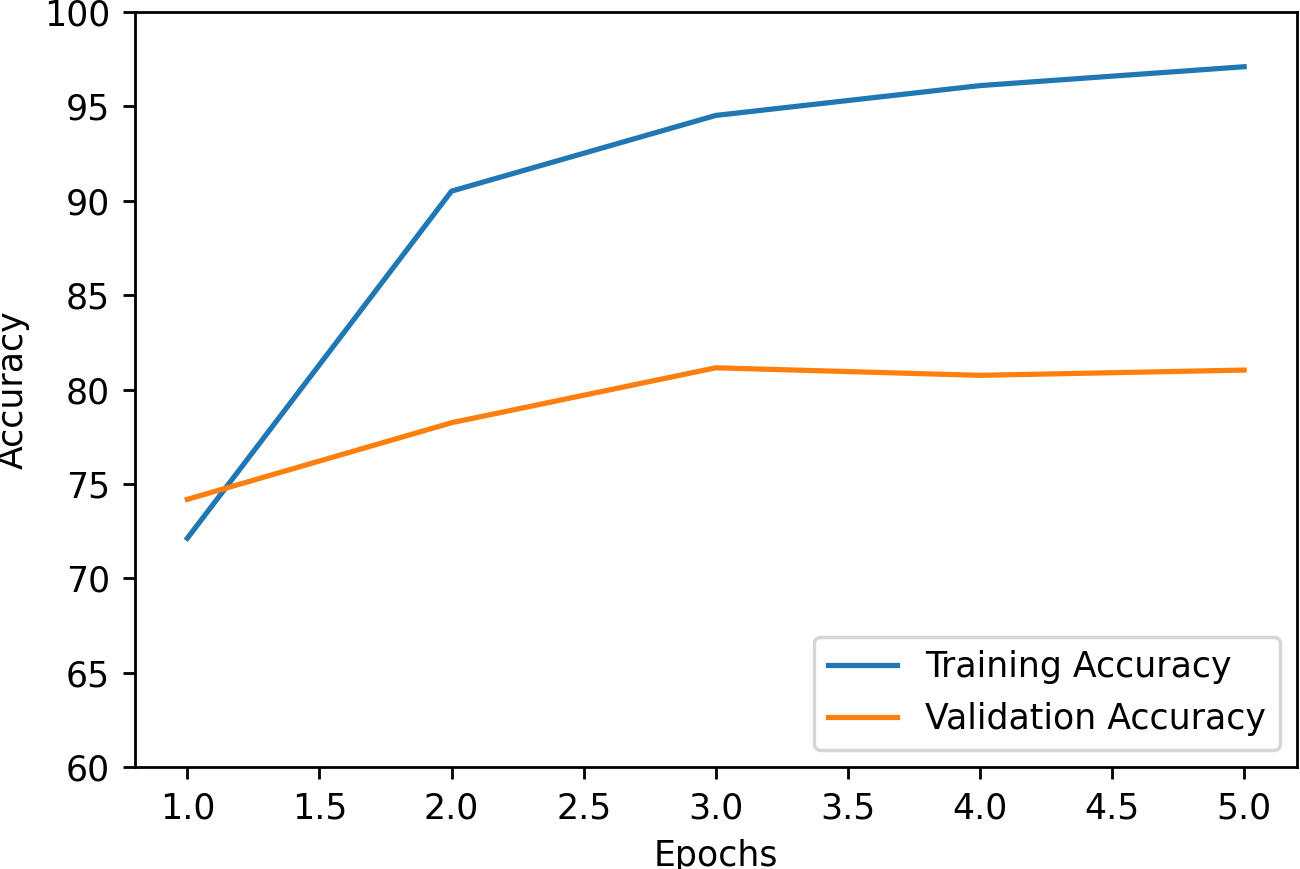
Figure 3 shows the training and validation accuracy for the k-train based BERT model for decoding text-based emotion. We used a pre-trained k-train model and further trained it on our dataset. The model was provided with the text extracted from speech to text. The model runs for 5 epochs and post that no improvement was seen and the training was stopped. The model achieved a test accuracy of 81% with 5 classes. Table 3 shows the precision, recall, and F1 score of individual emotions. Precision for Joy and fear is the same 0.85%, anger is 0.82%, neutral is 0.79% and sadness is 0.77%. Macro-average values is calculated by:
| (3) |
where can be precision or recall or F1 score. is precision/recall/f1 score for class and is the total number of class.
| Emotion | Precision | Recall | F1-score |
| Joy | 0.85 | 0.84 | 0.84 |
| sadness | 0.77 | 0.83 | 0.80 |
| fear | 0.85 | 0.83 | 0.84 |
| anger | 0.82 | 0.75 | 0.78 |
| neutral | 0.79 | 0.83 | 0.81 |
| macro avg | 0.82 | 0.82 | 0.81 |
| accuracy : 0.81 | |||
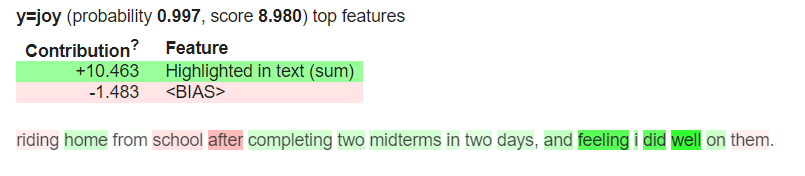
Figure 4 shows the model explainability behind the emotion “Joy”, where green shows the positive contribution and red shows negative emotion towards “Joy”. Figure 5 shows the overall distribution of emotions in the text data. It was observed that the content with more varying emotions has higher engagement than the content with one emotion.
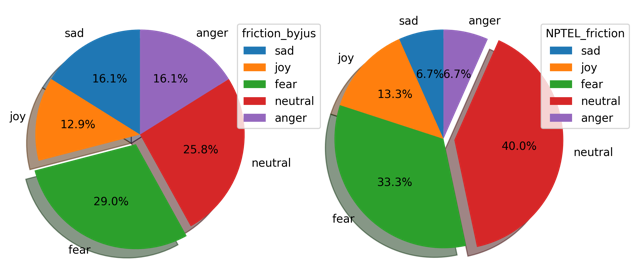
Figure 6 shows the training and test accuracy for speech-based emotion detection. The model was trained for 190 epochs and achieved an overall accuracy of 70.83% with 8 classes.
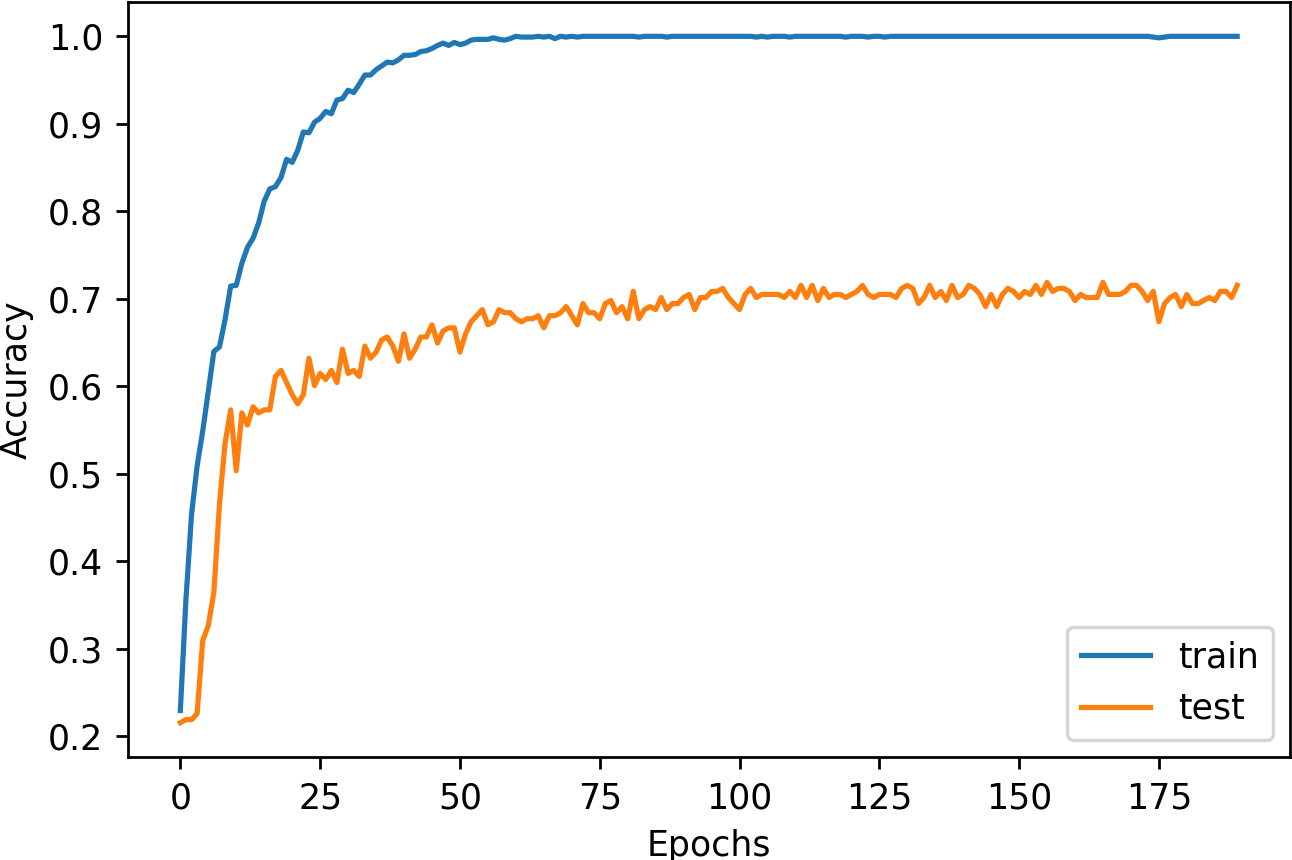
Figure 7 shows the confusion matrix of emotions from speech data. The precision for angry is 0.82 %, calm is 0.72%, disgust is 0.74%, fearful is 0.68%, happy is 0.59%, neutral is 0.75%, sad is 0.59% ans surprised is 0.86%. Macro average precision, recall and f1 score is 0.72%, 0.71% and 0.71% respectively.
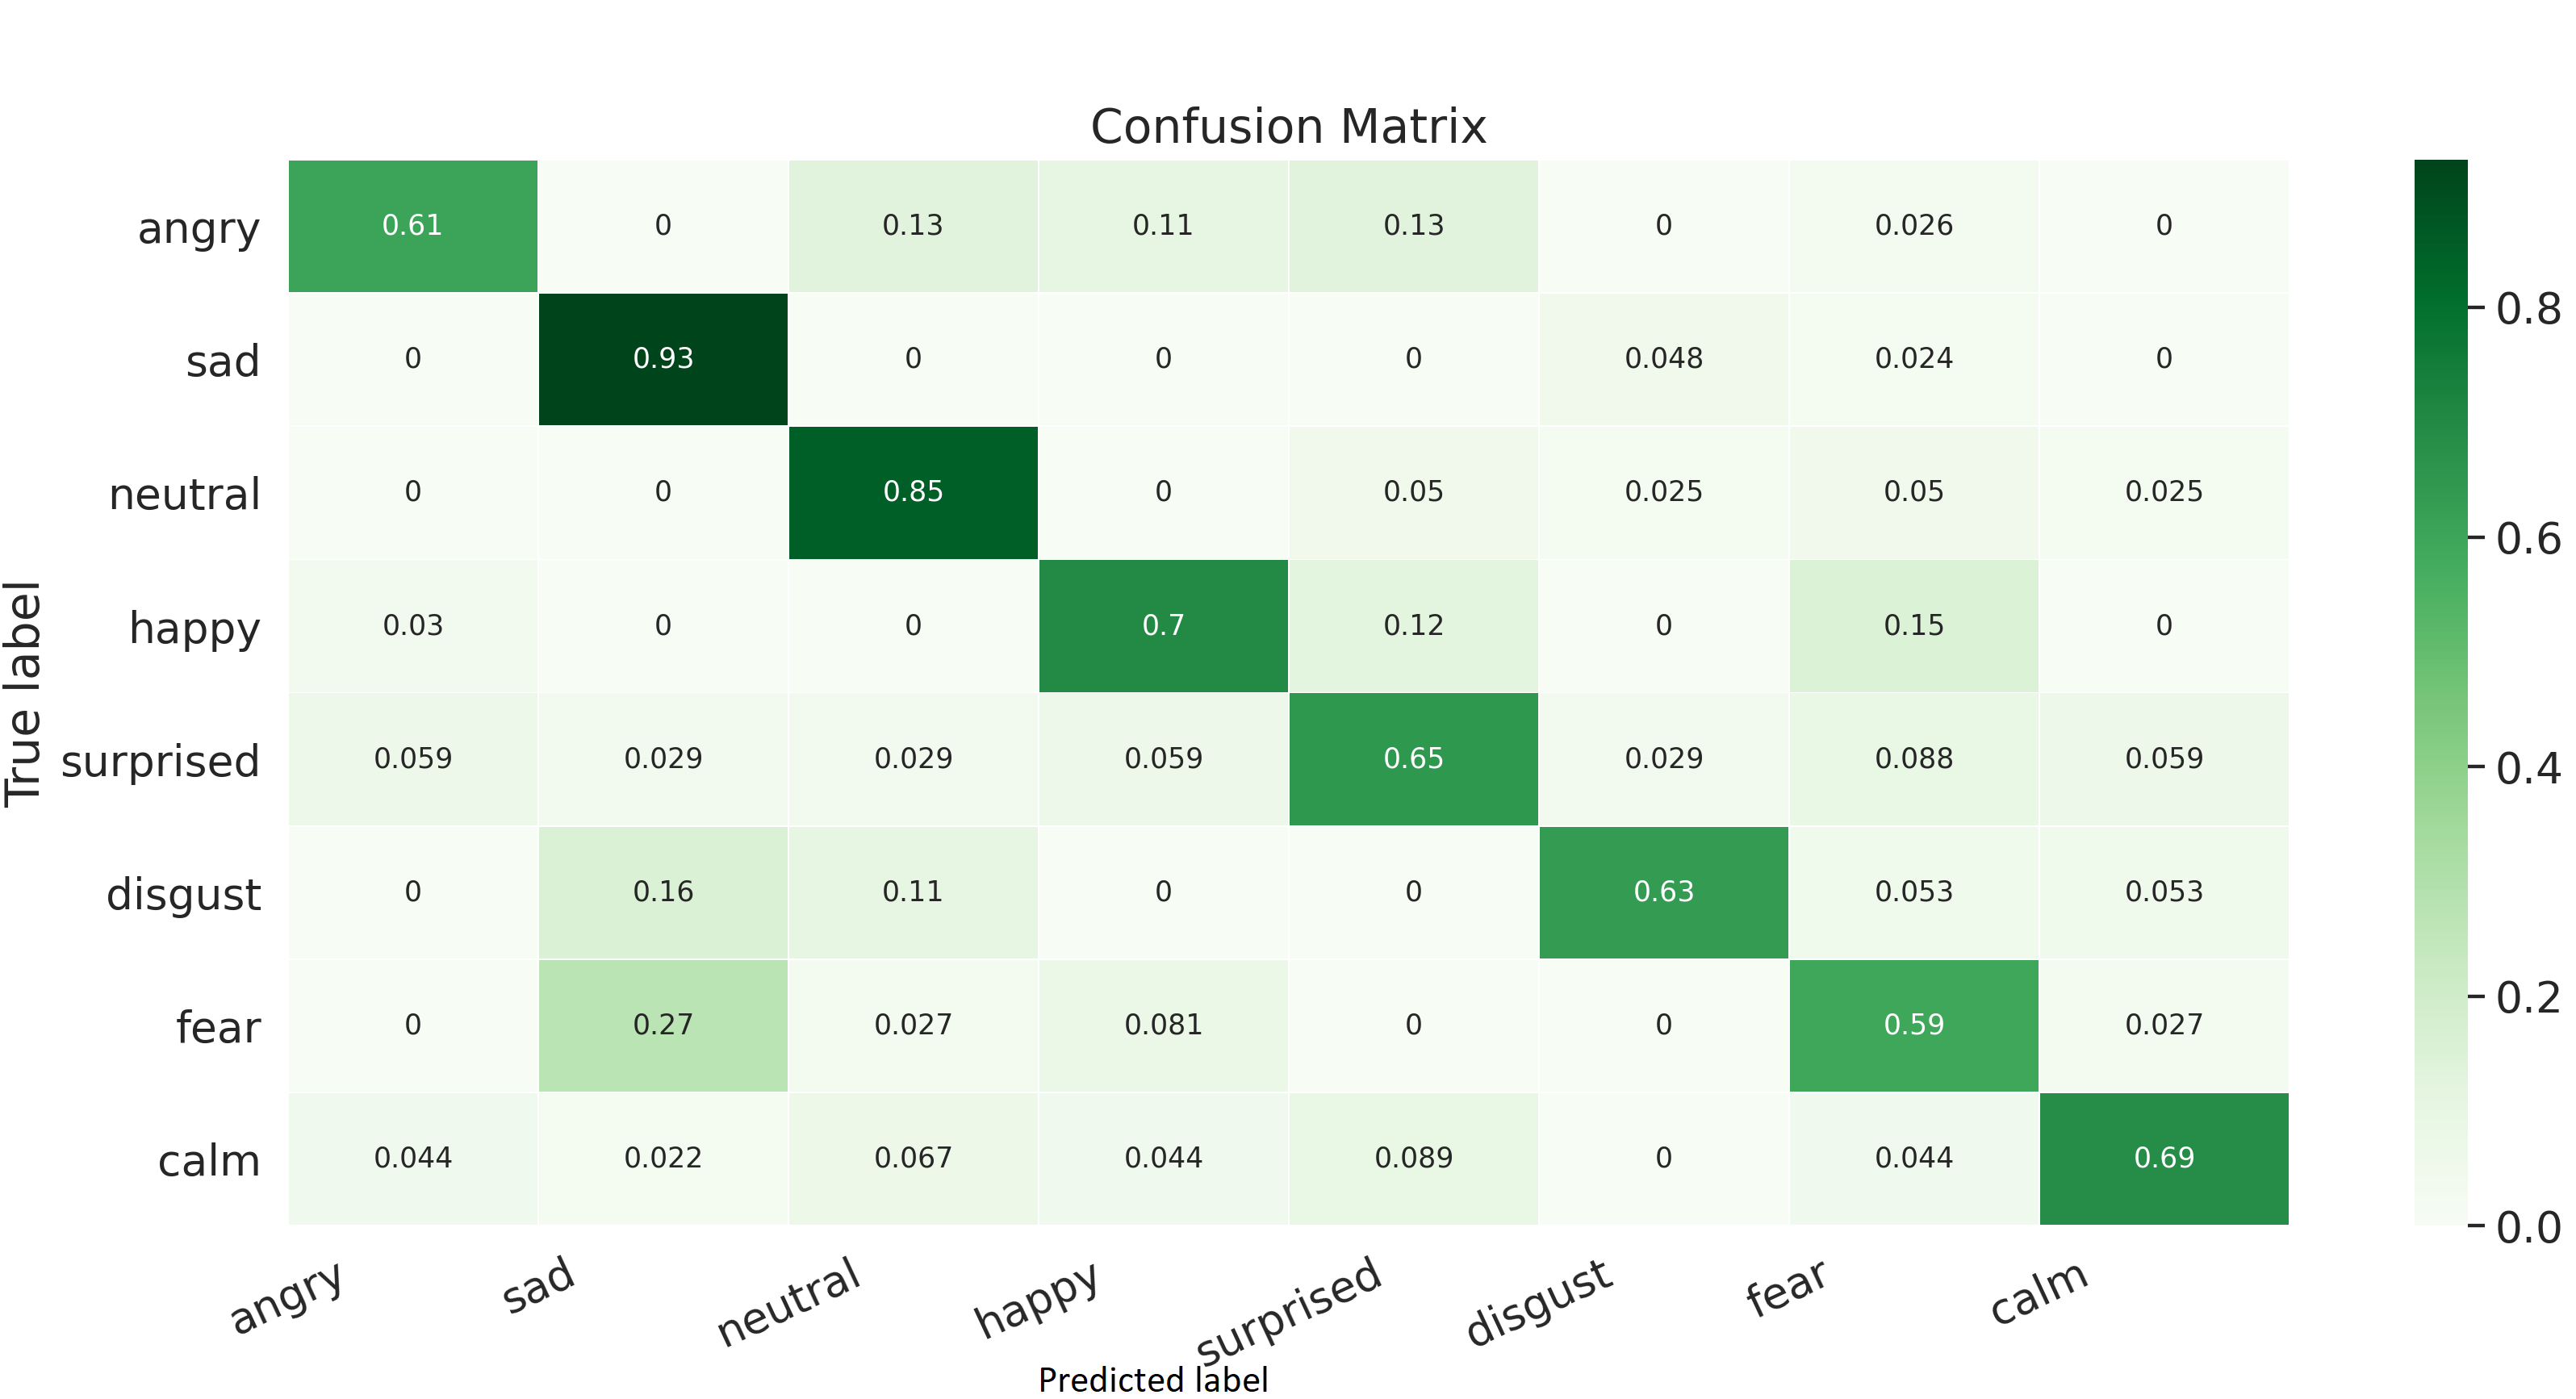
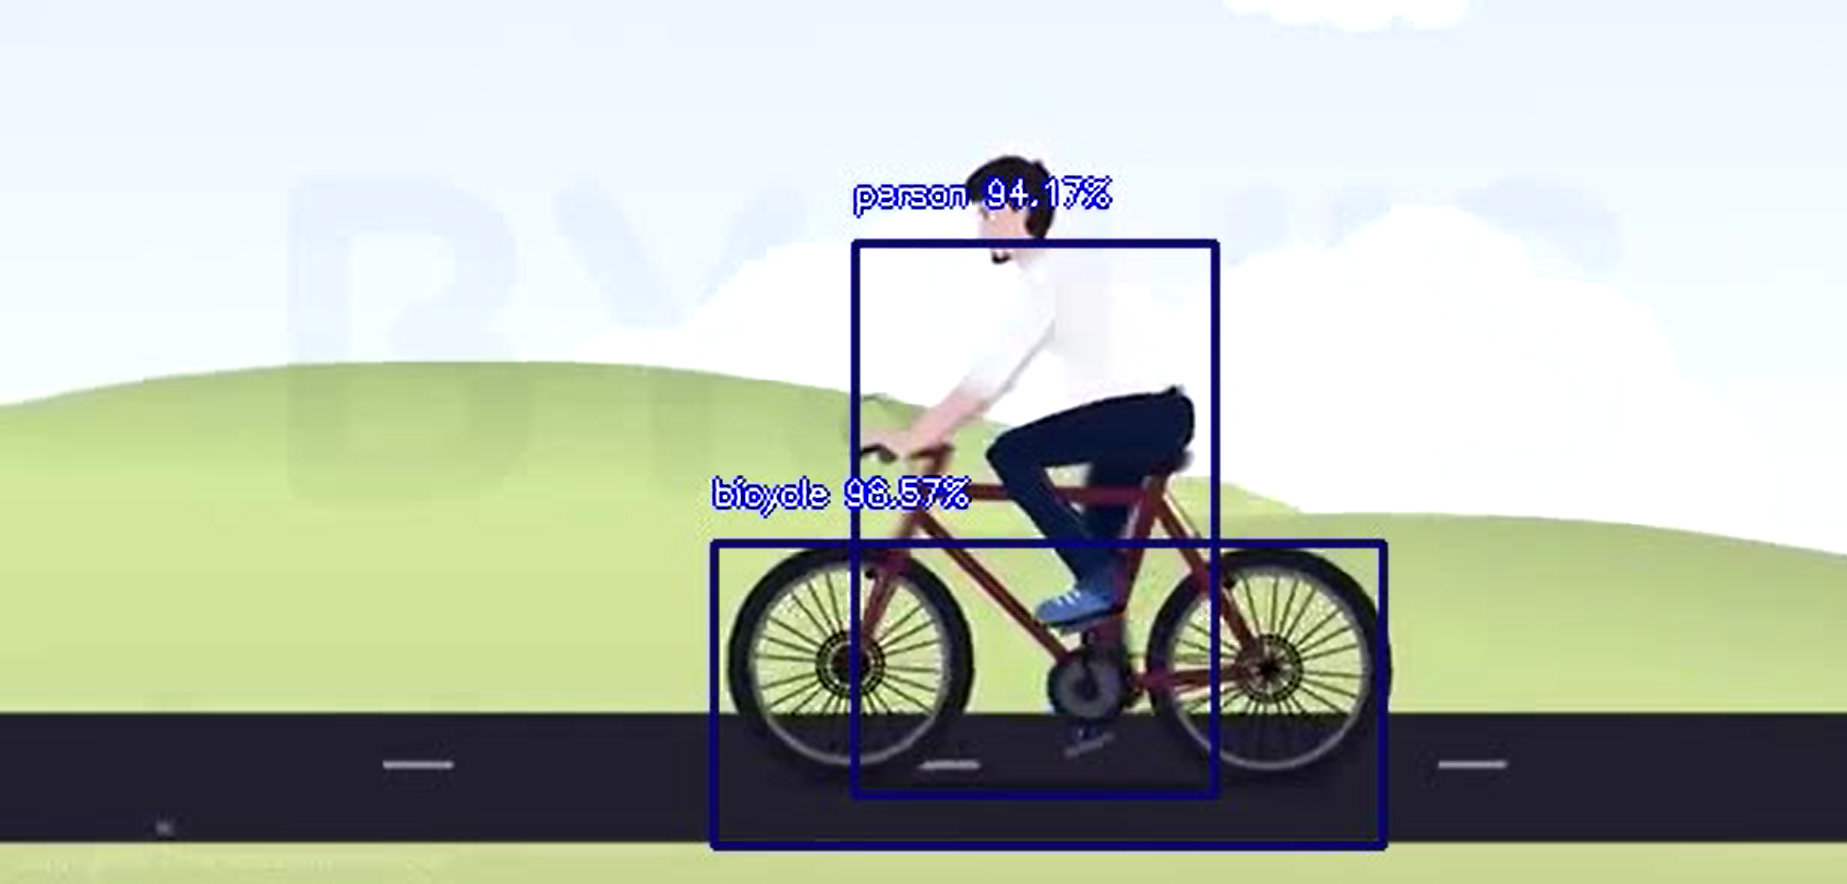
Figure 8 shows the detection of objects inside the specific video frame with 3fps and it keeps the count of the objects shown with reference to time. As a result, we can automatically detect the activities with different objects in the video. We are extracting the information of objects and matching it with the pretext context of that object for the relevancy of the topic. In this way, we can gauge the role of various objects towards the overall engagement score.
4.2. CLUE Results
We have used our proposed architecture CLUE on our new dataset, where we used the user ratings based on engagement for the video as the target variable and benchmark. For collecting this dataset, we have deployed the model on the cloud server, and users are shown a video from open-source videos lectures according to their interest. After completing the video users are asked to provide a rating for their engagement on a scale of 1 to 10. We have, until now, 50 videos in our collection dataset. The average video length was 29.5 minutes, and the topics cover domains of school level physics, literature and history. Videos were obtained from open source lectures, such as NPTEL, byjus, and Unacademy. Note that even with this dataset size, we can obtain reliable features from these full-length videos to train our model. We expect that with the large-scale datasets such as those used in (Bulathwela et al., 2020a), we can further help improve our model performance.
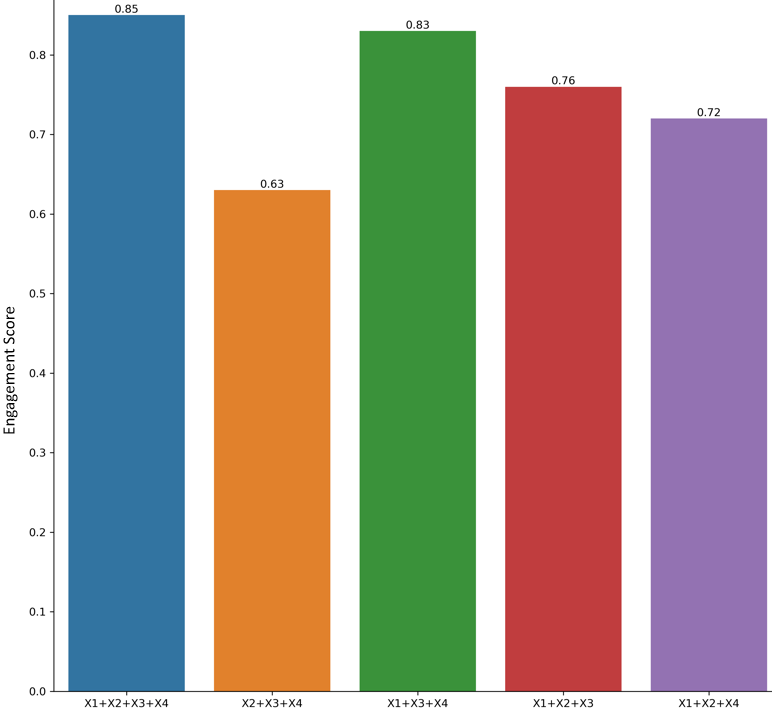
For every video processing, it was separated in two segments, one with video frame embeddings and the other with audio. We extracted the features from the audio and video as discussed for CLUE and calculated the engagement score based on our pre-trained model. The ground truth mean engagement score as reported by users after normalisation is 0.88. The predicted mean engagement score by CLUE is 0.85. Figure 9 depicts the predicted engagement score by all the models and also the predicted engagement score if we leave one model out. Predicted engagement score = 0.85, = 0.63, = 0.72, = 0.76, = 0.72. The engagement score shows the impact of individual model on the final output.
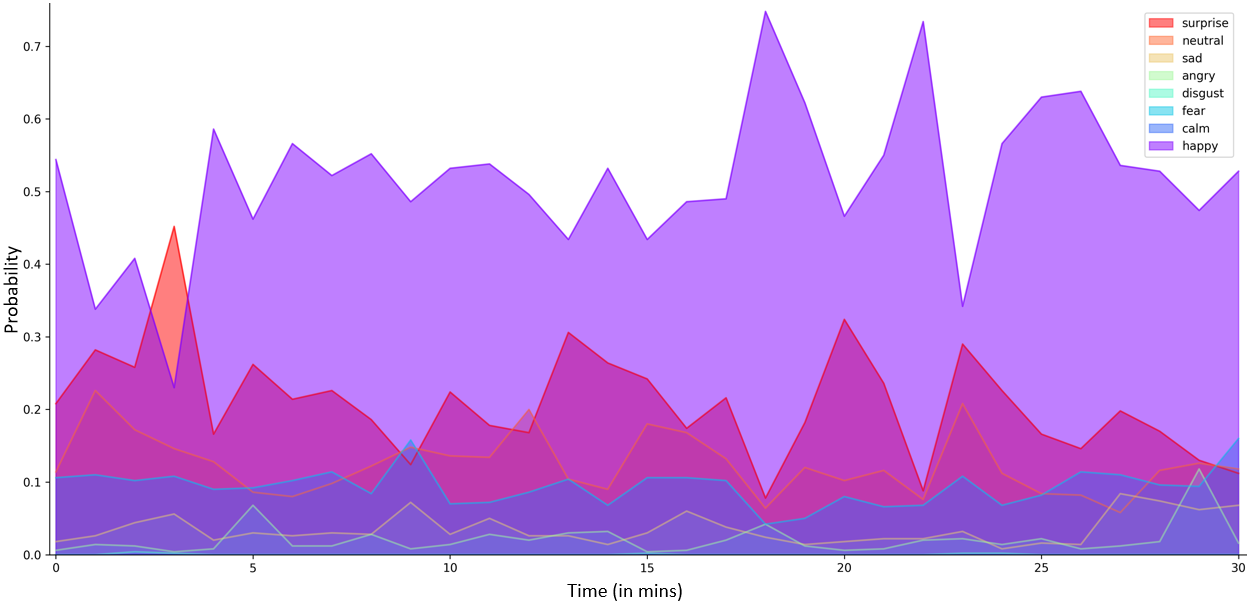
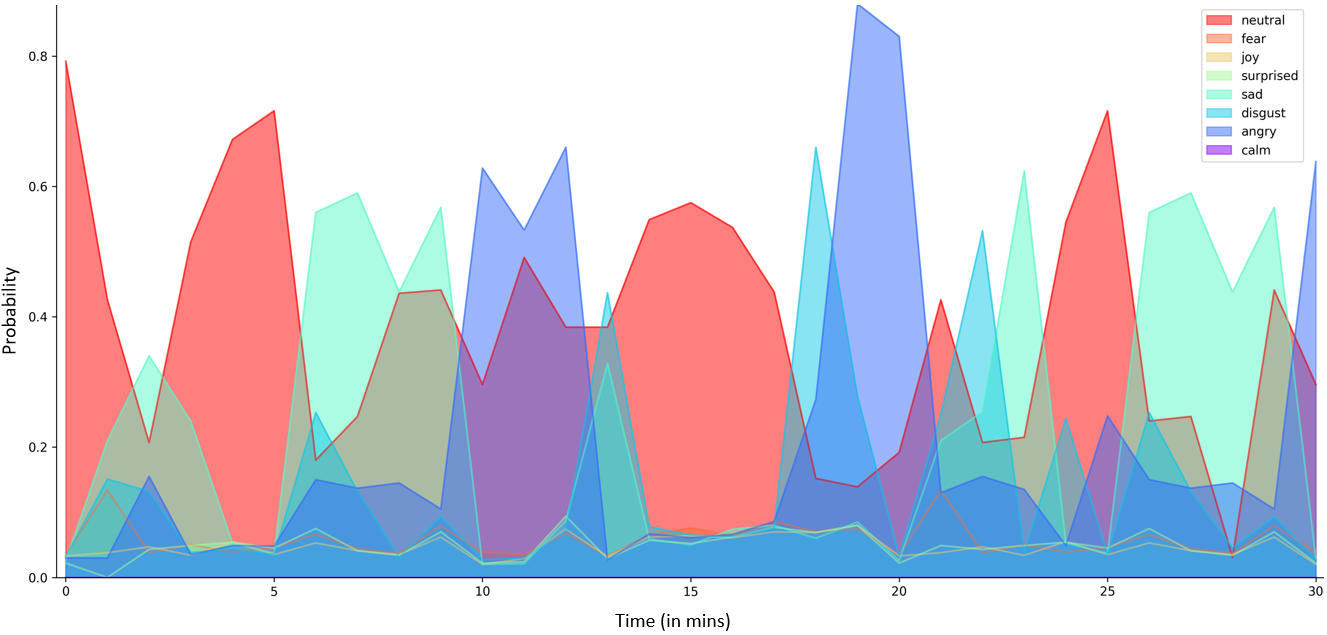
Figure 10 shows the variation of speech-based emotion over the video length where “Happy”, “Surprised”, “Neutral”, “Fear” are dominant. To generate this figure, we extracted 10 secs of speech with a moving window of 10 secs and a hop of 10 secs as well. Subsequently, the model prediction probability for every emotion was used for plotting. Similarly, Figure 11 shows the variation of speech-based emotion over the other video where “Anger”, “Sad”, “Disgust”, “Neutral” are dominant.
5. Discussions & Conclusion
We have developed a new framework CLUE for contextualised adaptive engagement. Some previous works, e.g., (Bulathwela et al., 2020a) have focused on the textual information only for establishing contextualised engagement which is insufficient to provide feedback. As a result, we have extracted additional discriminative features, which are, textual emotion, speech emotion variability with time, animation and object detection from the video lectures, and unified them to create a prediction variable and update the vector based on user feedback. Our novel model unifies the individual pre-trained models and learns their weight parameters in a completely unsupervised way. Our results show that our model can reliably provide engagement scores followed by explainability which existing models cannot do.
The individual models in our CLUE framework were first trained on publicly available datasets, and the training performances were reported on those datasets as baseline results. Subsequently, we unified these models to develop our novel CLUE framework and compared the performance of each model against the CLUE model. As evidenced in the results in Figure 9 the major impact on the prediction is based on which was trained on the VLN dataset with subset features, used in (Bulathwela et al., 2020a). Removing , from the overall model, did not impact the prediction significantly which models the emotions based on the textual content. Likely, textual emotions are not very crucial in domain-specific videos. As a result, the emotion of text can have the least impact on domain-specific predictions. Removing , which is based on emotion decoding over speech reduced the predicted engagement score significantly. It is also observed that variation of positive emotion increases engagement compared to negative emotion. Figure 10 shows the variation in emotion of speech over time where “Happy”, “Surprised”, “Neutral”, “Fear” are dominant and Figure 11 shows the variation in emotion of speech over time where “Anger”, “Sad”, “Disgust”, “Neutral” are dominant. Engagement score of video, Figure 10, were significantly better than the video in Figure 11. Variation in the emotion of speech over time helps to increase the engagement score than having a single emotion tone for a longer period. Removing which accounts for object count over the video also had a significant drop in the engagement score as the animation plays a key role in engagement. However, the impact of this model would be greater if we could account for more than 80 objects as fixed in Yolo. Based on textual data the length of the video, tobe_verb_rate, Auxilary_rate, speaker speed, and the easiness level of the text is important for engagement prediction. For video to be engaging the length of the video should be short, the use of tobe_verb_rate should be , use of Auxilary_rate should be , speaker speed should be in the range of 115-120 wpm, easiness level should be more than 83.
In the future, we will design an estimator and policy based on the observed truth and ground truth to make the prediction stronger and user-centric. To this end, we will develop a new reinforcement learning framework where user feedback is incorporated into the model.
References
- (1)
- Alswaidan and Menai (2020) Nourah Alswaidan and Mohamed El Bachir Menai. 2020. A survey of state-of-the-art approaches for emotion recognition in text. Knowledge & Information Systems 62, 8 (2020).
- Baziotis et al. (2018) Christos Baziotis, Nikos Athanasiou, Alexandra Chronopoulou, Athanasia Kolovou, Georgios Paraskevopoulos, Nikolaos Ellinas, Shrikanth Narayanan, and Alexandros Potamianos. 2018. Ntua-slp at semeval-2018 task 1: Predicting affective content in tweets with deep attentive rnns and transfer learning. arXiv preprint arXiv:1804.06658 (2018).
- Bulathwela et al. (2020a) Sahan Bulathwela, María Pérez-Ortiz, Aldo Lipani, Emine Yilmaz, and John Shawe-Taylor. 2020a. Predicting engagement in video lectures. arXiv preprint arXiv:2006.00592 (2020).
- Bulathwela et al. (2020b) Sahan Bulathwela, María Pérez-Ortiz, Rishabh Mehrotra, Davor Orlic, Colin de la Higuera, John Shawe-Taylor, and Emine Yilmaz. 2020b. SUM’20: State-based User Modelling. In Proceedings of the 13th International Conference on Web Search and Data Mining. 899–900.
- Bulathwela et al. (2020c) Sahan Bulathwela, Maria Perez-Ortiz, Emine Yilmaz, and John Shawe-Taylor. 2020c. Truelearn: A family of bayesian algorithms to match lifelong learners to open educational resources. In Proceedings of the AAAI Conference on Artificial Intelligence, Vol. 34. 565–573.
- Bulathwela et al. (2020d) Sahan Bulathwela, Maria Perez-Ortiz, Emine Yilmaz, and John Shawe-Taylor. 2020d. VLEngagement: A Dataset of Scientific Video Lectures for Evaluating Population-based Engagement. arXiv preprint arXiv:2011.02273 (2020).
- Burkhardt et al. (2005) Felix Burkhardt, Astrid Paeschke, Miriam Rolfes, Walter F Sendlmeier, and Benjamin Weiss. 2005. A database of German emotional speech. In Ninth european conference on speech communication and technology.
- Chen et al. (2020) Su Chen, Ying Fang, Genghu Shi, John Sabatini, Daphne Greenberg, Jan Frijters, and Arthur C Graesser. 2020. Automated Disengagement Tracking Within an Intelligent Tutoring System. Frontiers in artificial intelligence 3 (2020).
- Dalip et al. (2011) Daniel Hasan Dalip, Marcos André Gonçalves, Marco Cristo, and Pável Calado. 2011. Automatic assessment of document quality in web collaborative digital libraries. Journal of Data and Information Quality (JDIQ) 2, 3 (2011), 1–30.
- Devlin et al. (2018) Jacob Devlin, Ming-Wei Chang, Kenton Lee, and Kristina Toutanova. 2018. Bert: Pre-training of deep bidirectional transformers for language understanding. arXiv preprint arXiv:1810.04805 (2018).
- Du and Nie (2018) Pan Du and Jian-Yun Nie. 2018. Mutux at SemEval-2018 Task 1: exploring impacts of context information on emotion detection. In Proceedings of the 12th international workshop on semantic evaluation. 345–349.
- Ehlers et al. (2018) Max Ehlers, Robert Schuwer, and Ben Janssen. 2018. OER in TVET: Open Educational Resources for Skills Development. UNESCO-UNEVOC International Centre for Technical and Vocational Education and Training (2018).
- Ekman (1992) Paul Ekman. 1992. Are there basic emotions? (1992).
- Engberg and Hansen (1996) Inger Samso Engberg and Anya Varnich Hansen. 1996. Documentation of the danish emotional speech database des. Internal AAU report, Center for Person Kommunikation, Denmark 22 (1996).
- Guo et al. (2014) Philip J Guo, Juho Kim, and Rob Rubin. 2014. How video production affects student engagement: An empirical study of MOOC videos. In Proceedings of the first ACM conference on Learning@ scale conference. 41–50.
- Huber (1965) Peter J Huber. 1965. A robust version of the probability ratio test. The Annals of Mathematical Statistics (1965), 1753–1758.
- Jimenez-Liso et al. (2021) Maria Rut Jimenez-Liso, María Martinez-Chico, Lucy Avraamidou, and Rafael López-Gay Lucio-Villegas. 2021. Scientific practices in teacher education: the interplay of sense, sensors, and emotions. Research in Science & Technological Education 39, 1 (2021), 44–67.
- Kay and Knaack (2008) Robin H Kay and Liesel Knaack. 2008. Exploring the Impact of Learning Objects in Middle School Mathematics and Science Classrooms: A Formative Analysis. Canadian Journal of Learning and Technology 34, 1 (2008), n1.
- Li et al. (2016) Xiangsheng Li, Jianhui Pang, Biyun Mo, and Yanghui Rao. 2016. Hybrid neural networks for social emotion detection over short text. In 2016 International joint conference on neural networks (IJCNN). IEEE, 537–544.
- Li et al. (2017) Yanran Li, Hui Su, Xiaoyu Shen, Wenjie Li, Ziqiang Cao, and Shuzi Niu. 2017. Dailydialog: A manually labelled multi-turn dialogue dataset. arXiv preprint arXiv:1710.03957 (2017).
- Livingstone and Russo (2018) Steven R Livingstone and Frank A Russo. 2018. The Ryerson Audio-Visual Database of Emotional Speech and Song (RAVDESS): A dynamic, multimodal set of facial and vocal expressions in North American English. PloS one 13, 5 (2018), e0196391.
- Lugger et al. (2009) Marko Lugger, Marie-Elise Janoir, and Bin Yang. 2009. Combining classifiers with diverse feature sets for robust speaker independent emotion recognition. In 2009 17th European Signal Processing Conference. IEEE, 1225–1229.
- Meisheri and Dey (2018) Hardik Meisheri and Lipika Dey. 2018. Tcs research at semeval-2018 task 1: Learning robust representations using multi-attention architecture. In Proceedings of The 12th International Workshop on Semantic Evaluation. 291–299.
- Muda et al. (2010) Lindasalwa Muda, Mumtaj Begam, and Irraivan Elamvazuthi. 2010. Voice recognition algorithms using mel frequency cepstral coefficient (MFCC) and dynamic time warping (DTW) techniques. arXiv preprint arXiv:1003.4083 (2010).
- Nias (1996) Jennifer Nias. 1996. Thinking about feeling: The emotions in teaching. Cambridge journal of education 26, 3 (1996), 293–306.
- Nicholson et al. (2000) Joy Nicholson, Kazuhiko Takahashi, and Ryohei Nakatsu. 2000. Emotion recognition in speech using neural networks. Neural computing & applications 9, 4 (2000), 290–296.
- Ntoulas et al. (2006) Alexandros Ntoulas, Marc Najork, Mark Manasse, and Dennis Fetterly. 2006. Detecting spam web pages through content analysis. In Proceedings of the 15th international conference on World Wide Web. 83–92.
- Nwe et al. (2003) Tin Lay Nwe, Say Wei Foo, and Liyanage C De Silva. 2003. Speech emotion recognition using hidden Markov models. Speech communication 41, 4 (2003), 603–623.
- Redmon et al. (2015) J Redmon, S Divvala, R Girshick, and A Farhadi. 2015. You look only once: unified real-time object detection. arXiv preprint arXiv:1506.02640 (2015).
- Redmon and Farhadi (1804) Joseph Redmon and Ali Farhadi. 1804. Yolov3: An incremental improvement. arXiv 2018. arXiv preprint arXiv:1804.02767 (1804), 1–6.
- Redmon and Farhadi (2018) Joseph Redmon and Ali Farhadi. 2018. Yolov3: An incremental improvement. arXiv preprint arXiv:1804.02767 (2018).
- Scherer and Wallbott (1994) Klaus R Scherer and Harald G Wallbott. 1994. Evidence for universality and cultural variation of differential emotion response patterning. Journal of personality and social psychology 66, 2 (1994), 310.
- Schuller et al. (2005) Björn Schuller, Manfred Lang, and Gerhard Rigoll. 2005. Robust acoustic speech emotion recognition by ensembles of classifiers. In Tagungsband Fortschritte der Akustik-DAGA# 05, München.
- Sieber (2001) Ellen Sieber. 2001. Teaching with Objects and Photographs: Supporting and Enhancing Your Curriculum. A Guide for Teachers. (2001).
- Sutton and Wheatley (2003) Rosemary E Sutton and Karl F Wheatley. 2003. Teachers’ emotions and teaching: A review of the literature and directions for future research. Educational psychology review 15, 4 (2003), 327–358.
- Wang et al. (2016) Yaqi Wang, Shi Feng, Daling Wang, Ge Yu, and Yifei Zhang. 2016. Multi-label chinese microblog emotion classification via convolutional neural network. In Asia-Pacific Web Conference. Springer, 567–580.
- Warncke-Wang et al. (2013) Morten Warncke-Wang, Dan Cosley, and John Riedl. 2013. Tell me more: an actionable quality model for Wikipedia. In Proceedings of the 9th International Symposium on Open Collaboration. 1–10.
- White (2013) Ryen White. 2013. Beliefs and biases in web search. In Proceedings of the 36th international ACM SIGIR conference on Research and development in information retrieval. 3–12.
- Zembylas (2007) Michalinos Zembylas. 2007. The power and politics of emotions in teaching. In Emotion in education. Elsevier, 293–309.
- Zhou and Bhat (2021) Jianing Zhou and Suma Bhat. 2021. Modeling Consistency Using Engagement Patterns in Online Courses. In LAK21: 11th International Learning Analytics and Knowledge Conference. 226–236.
Appendix A Real-world study of our contextualised engagement model after deployment in a production environment by Learning Management System (LMS) company
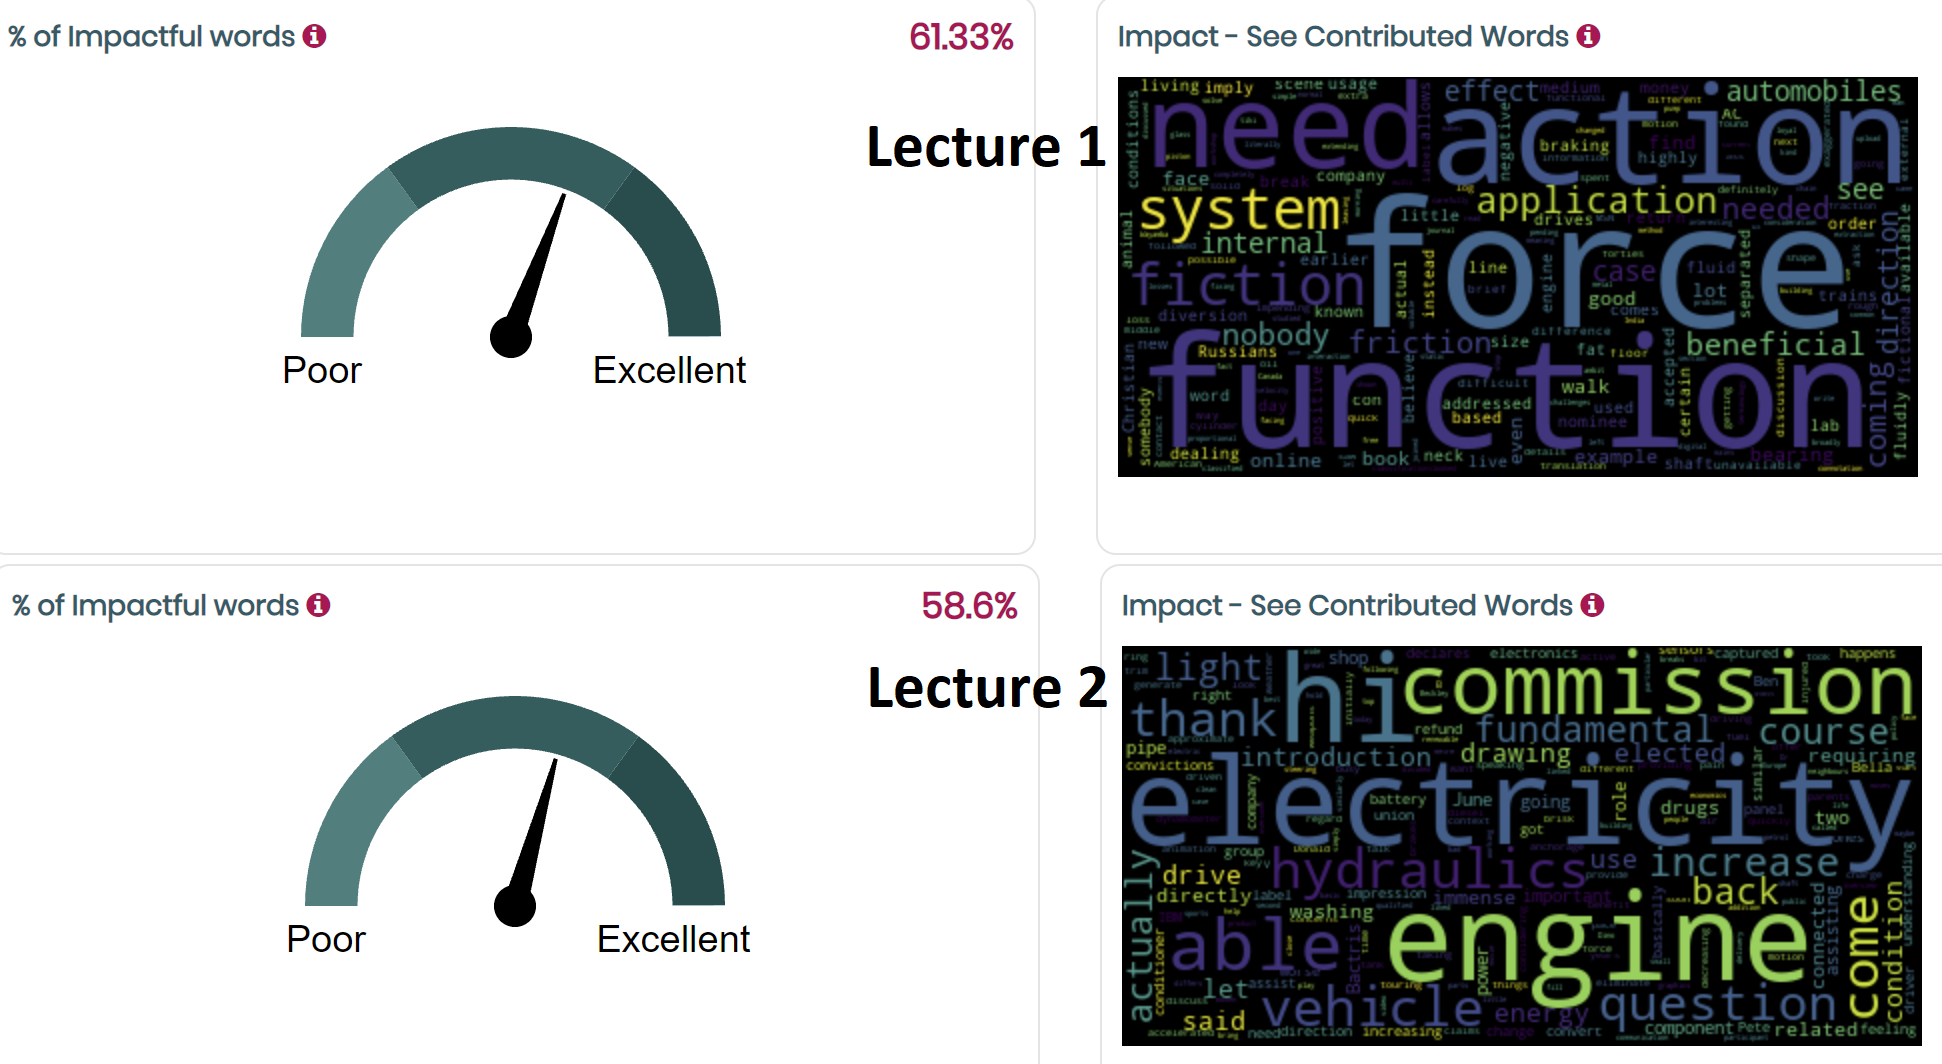
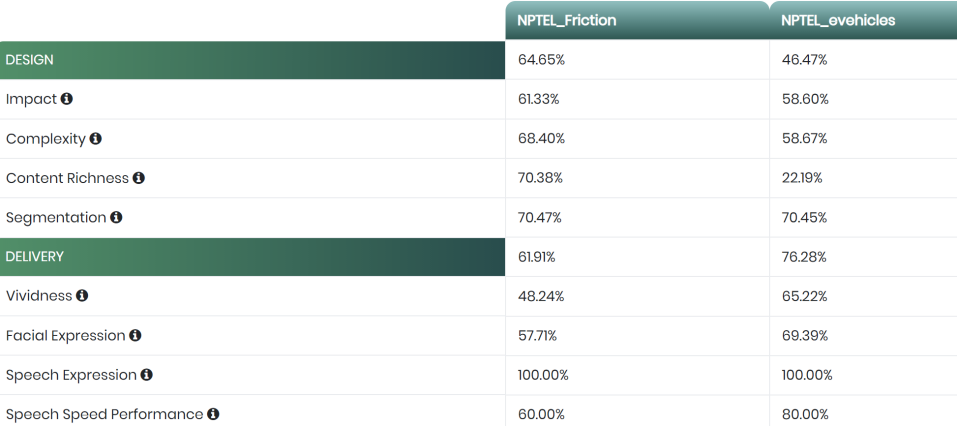
Our model was deployed online in a production environment and was provided for public use. LMS organisation helped in assessing online lectures and evaluating them in real-time with their users. The deployed model evaluated the two sample lectures from NPTEL, one a lecture on Friction and the other on eVehicles, based on the design and delivery of the content. The design of the lecture was evaluated on Impact, Complexity, Content Richness and Segmentation whereas the delivery was evaluated based on Vividness, Facial Expression, Speech Expression, and Speech Speed Performance. The goal of this user study is to measure whether our model can learn reliably from the data. The data used in this study can be obtained by contacting the authors which not only includes the videos but also the associated user study data.
Our model was deployed on the server and the LMS company asked tutors to upload their online content on the server, where the model evaluated every video and provided feedback to the creators. Post analysis LMS company asked students to mark the video on a scale of 1 to 10 in terms of engagement. Post lecture, content creators asked questions related to the topic in form of a checkbox to gauge the understanding of content.
-
(1)
Impact – Content impact measures the proportion of meaningful words to that of total words used in the content. The briefer the content is the higher is the learner engagement. Impact measure helps maintain brevity by creating maximum impact through the lowest possible content.
-
(2)
Complexity – Content complexity measures the depth and diversity of the words used in design and delivery. Content complexity feedback helps optimise the usage of rare and unique words to keep the content simple and thus maximise learner engagement.
-
(3)
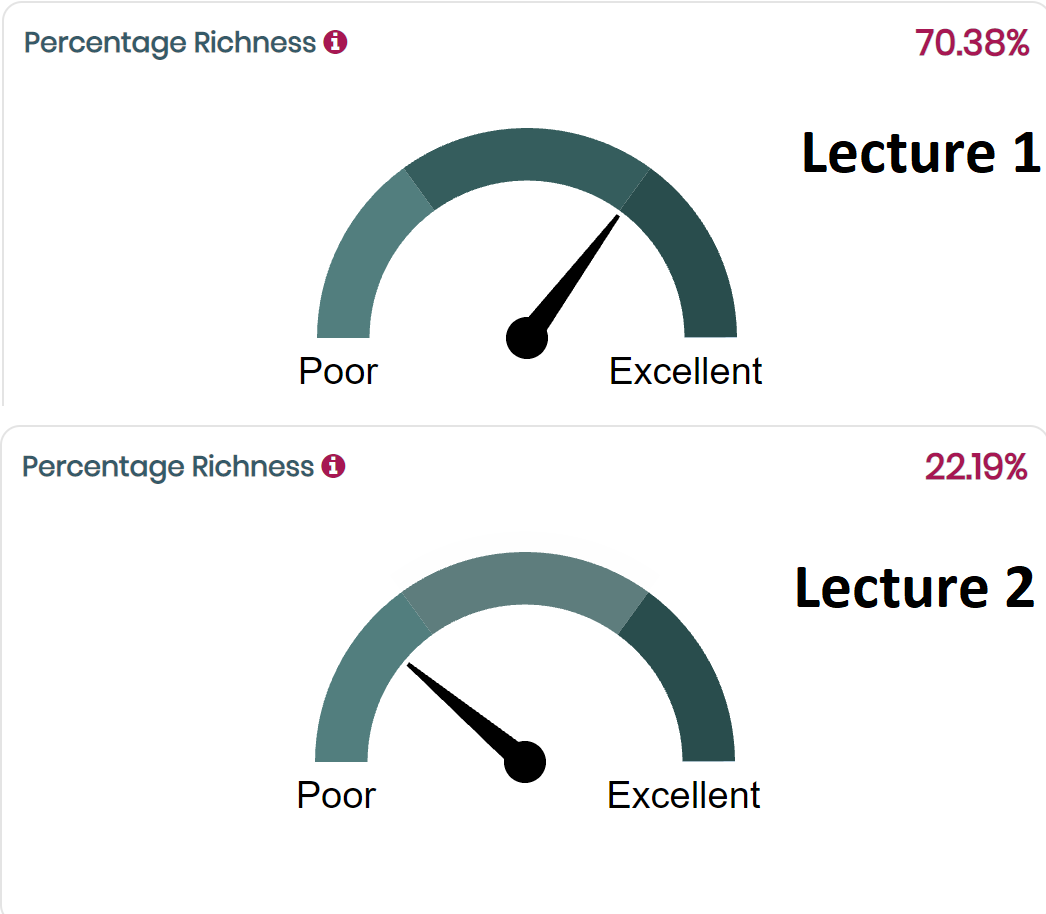
Content Richness – Content richness provides feedback on optimal usage of educational media in the video. A video lecture gets the highest possible visual engagement when it has more multimedia in it. However, creating such a video is complex and highly time-consuming. Content richness helps instructors identify the optimal amount of educational media to be used without worrying about the engagement level of the video.
-
(4)
Segmentation – Segmentation provides feedback on the optimal duration of the video for better learner attention.
-
(5)
Vividness – Content vividness measures the contextual word usage in speaker communication. The usage of striking words is proven to better engage listeners over bland word choices. Appropriate word choices eliminate the overuse of words and reduce the monotonicity in the narration.
-
(6)
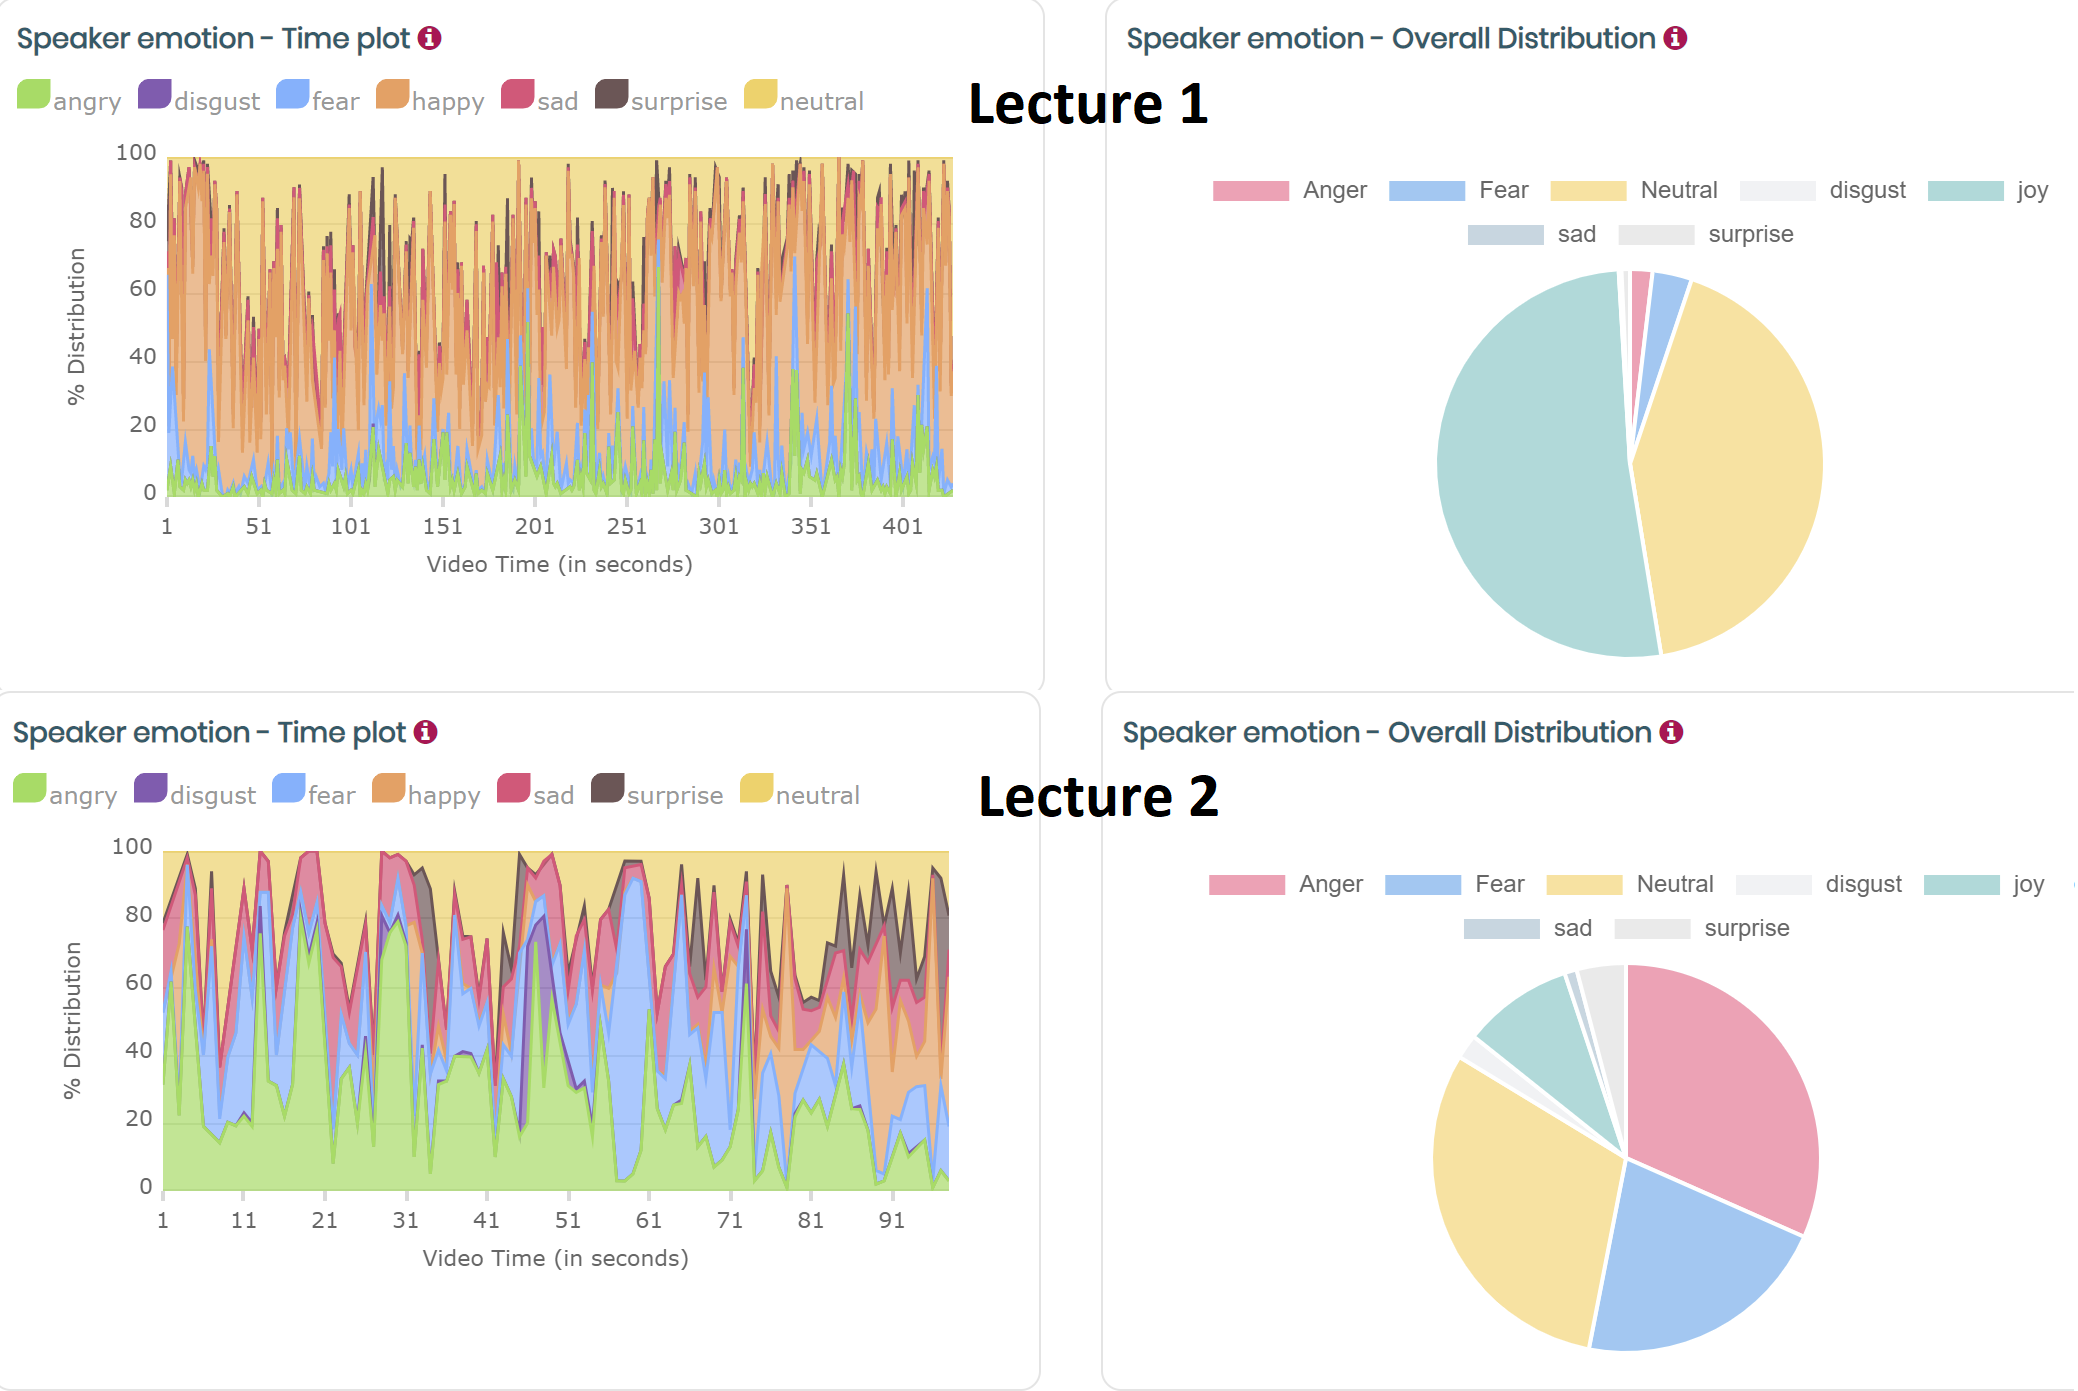
Facial Expression – Speaker facial decoding reports the emotions expressed in the speaker’s face during content delivery. Major emotions that are reported and proven to impact the learner mood are happy, sad, surprise, angry, disgust and fear.
-
(7)
Speech Expression – Delivery tone and rhythm feedback report the emotions conveyed in the speaker’s audio pitch. Speech tone and rhythm are found to influence the listener’s mental state. The feedback helps the speaker achieve a tone that expresses joy and surprise that is proven to have better engagement among the listeners.
-
(8)
Speech Speed Performance – Speaker speed measures the words-per-minute in speech. Speaker speed influences the processing of the learner’s acquired information. While a lower speed is proven to be perceived as less challenging among the listeners, speed in the upper range is proven to be equally dangerous in losing learner attention. Speaker speed feedback helps optimize the speed based on the context of the content.