Effect of clustering on the orientational properties of a fluid of hard right isosceles triangles
Abstract
Recent studies have shown the fluid of hard right triangles to possess fourfold and quasi-eightfold (octatic) orientational symmetries. However, the standard density-functional theory for two-dimensional anisotropic fluids, based on two-body correlations, and an extension to incorporate three-body correlations, fail to describe these symmetries. To explain the origin of octatic symmetry we postulate strong particle clustering as a crucial ingredient. We use Scaled Particle Theory to analyze four binary mixtures of hard right triangles and squares, three of them being extreme models for a one-component fluid, where right triangles can exist as monomeric entities together with triangular dimers, square dimers or square tetramers. Phase diagrams exhibit a rich phenomenology, with demixing and three-phase coexistences. More important, under some circumstances the orientational distribution function of triangles has equally high peaks at relative particle angles and , signalling fourfold, tetratic order, but also secondary peaks located at and , a feature of eightfold, octatic order. Also, we extend the binary mixture model to a quaternary mixture consisting of four types of clusters: monomers, triangular and square dimers, and square tetramers. This mixture is analyzed using Scaled Particle Theory under the restriction of fixed cluster fractions. Apart from the obvious tetratic phase promoted by tetramers, we found that, for certain cluster compositions, the total orientational distribution function of monomers can exhibit quasi-eightfold (octatic) symmetry. The study gives evidence on the importance of clustering to explain the peculiar orientational properties of liquid-crystal phases in some two dimensional fluids.
I Introduction
The experimental and theoretical study of two-dimensional (2D) fluids of hard anisotropic particles has enjoyed an upsurge in recent years, mainly motivated by the development of novel experimental techniques such as lithographic particle fabrication Zhao1 ; Zhao2 ; Zhao3 ; Zhao4 . Using these techniques, micro-prisms of any cross-sectional shape can be fabricated, and suspensions of these particles can be adsorbed on surfaces, giving rise to effectively two-dimensional fluids of diffusing Brownian particles Zhao1 ; Zhao2 ; Zhao3 ; Zhao4 . The fluid phase behavior can be explored by varying particle volume fraction, and in many cases a plethora of exotic liquid-crystal and crystalline phases results. These phases possess symmetries that strongly depend on particle shape. Some of these phases were predicted theoretically and later confirmed by Monte Carlo (MC) simulations, and different theoretical models have been developed to explain the rich phase behavior of these 2D hard-core fluids and its particle shape dependence Schlaken ; Frenkel ; Donev ; Dijkstra ; MR1 ; MR2 ; MR3 ; MR4 ; Dani ; Escobedo ; Glotzer1 ; Cinacchi .
Of particular interest are the triatic (TR) and tetratic (T) phases found in fluids of hard equilateral triangles Zhao4 ; Dijkstra ; MR3 and squares (and also in rectangles of small aspect ratios) MR2 ; Escobedo , with particle axes pointing along six or four equivalent directors, respectively. The T phase can be viewed as the 2D analog of the biaxial nematic phase, recently found to be stable in colloidal suspensions of board-like particles Vroege ; Vanakaras and whose stability can be enhanced by size polydispersity Roij ; Patti ; Patti2 .
Vertically vibrated granular monolayers are being studied as experimental models of real 2D fluids in thermal equilibrium. Under specific experimental conditions, monolayers of squares experiments and cylinders Dani2 ; MR4b ; MR5 exhibit the presence of T and also smectic liquid-crystal textures in the steady-state configurations. The excitation of topological defects in the orientational and positional director fields of these fluidized granular monolayers, when confined into circular cavities, have been observed and studied MR5 . These results point to the importance of hard core entropic interactions in the stability of these dissipative textures, which turn out to be very similar to those obtained in equilibrium experiments on monolayers of colloidal spherocylinders confined in cavities of different shapes Wittmann1 ; Wittmann2 . This connection opens up the possibility that vibrated granular monolayers may be considered as valid experimental models to probe the interplay between symmetry and order in 2D fluids.
The most successful theoretical tool used in the study of liquid-crystal phase behavior of hard-body fluids is Density Functional Theory (DFT) hard-body . The main advantage of DFT is that it allows to obtain, via functional minimization, the equilibrium angular distribution function of a 2D oriented fluid, i.e. the probability density of particle axes to orient at an angle with respect to one of the equivalent directors. As shown in Ref. MR3, , the Scaled-Particle Theory (SPT) version of DFT (which includes only two-body correlations) predicts that the uniaxial nematic (N) phase is the only stable orientation phase of a fluid of hard right triangles, i.e. no exotic liquid-crystal phases do exist in this fluid. A bifurcation analysis, corroborated by rigorous functional minimization close to the bifurcation, confirmed this result, and the incorporation of three-particle correlations did not modify this scenario nosotros . By contrast, MC simulations of the same fluid showed the presence of the T phase (obtained by expanding a perfect T-crystal), along with an additional exotic oriented fluid phase with eightfold symmetry, the octatic (O) phase, obtained by compressing the isotropic (I) fluid. Even though all evidence suggests T to be the true stable phase, the fluid is prone to developing strong O correlations as density is increased from the I fluid. Note that the T and O phases are highly-symmetric phases having fourfold and eightfold symmetries, i.e. their angular distribution functions have the property , with and 8, respectively Dijkstra ; nosotros . The failure of the standard Onsager theory and its variations, all based on two-body correlations, to predict the phase behaviour of hard-particle models, at least at a qualitative level, is quite unusual in the history of liquid crystals. In Ref. nosotros, we advanced a reason why the standard two-body theory, and also the three-body-extended theory, cannot predict the highly-symmetric T and O phases, namely the crucial contribution of fourth-, and probably even higher-order, correlations in this system.
Given the difficulty of improving the standard theories by incorporating such high-order correlations, in this work we explore different ideas in an effort to understand the problem from different perspectives. On the one hand we focus on a system that should promote orientational correlations with O symmetry: a binary mixture of hard right triangles and squares. The excluded area between these two particles shows local minima at relative angles and , which could drive a stable O phase. As will be seen, this property of the excluded area is not enough to promote bulk O ordering, and the N and T phases are the only oriented phases that get stabilized in the phase diagrams for the four different mixtures analyzed. Despite this, we found that the orientational distribution function of triangles, for certain values of mixture composition, exhibits small secondary peaks located at the relative angles above.
On the other hand, we study the effect of particle clustering in the orientational properties of hard right triangles. Clustering is an extreme consequence of high-order particle correlations and could be a complementary point of view to extract useful information on the fluid behavior. We formulate a theory for clustering with the help of a toy model for particle self-assembling where monomers are just "free" right triangles. These monomers are assumed to self-assemble into different triangular and square-shaped clusters, the latter coming in two varieties: dimers and tetramers. An effectively quaternary mixture results from these considerations, which is analyzed using the SPT version of DFT. We numerically minimize the functional for particular compositions and, from the equilibrium angular distribution functions of the four species, a monomer distribution function can be predicted. It is then shown that, for certain cluster compositions, this function has quasi-eightfold symmetry, i.e. four peaks of similar heights at () in the interval . This result demonstrates the relevance of clustering to explain the presence of O orientational symmetry in a fluid of right triangles.
Aside from the theoretical calculations, we have also performed MC simulations of the real fluid of right triangles to confirm the presence of clustering. It has been pointed out Glotzer2 that entropic interactions between anisotropic particles in dense fluids can in some sense be regarded as chemical bonds, that in turn may promote particle self-assembling. In our simulations we define a criterion to identify different clusters: triangular, square and rhomboidal dimers, and also square tetramers. Cluster fractions are analyzed as a function of packing fraction in MC compression runs starting from the I fluid, and also from expansion runs from the T crystalline phase. We show that the T phase is enriched in square dimers and tetramers, with a small proportion of the remaining clusters. By contrast, all clusters have similar fractions in the O phase.
Instead of the fixed cluster compositions assumed in our toy model, a more sophisticated model to describe strong clustering effects in hard particle fluids should certainly predict cluster compositions at equilibrium in a consistent fashion. Chemical equilibrium between different clusters, a mass conservation law, and a larger variety of clusters (such as clusters with rhomboidal shape), along with effective internal energies of clusters are important ingredients that the new model should take into account. This line of research we leave for future developments.
The article is organized as follows. In Sec. II we study four different binary mixtures of hard squares and hard right triangles and calculate their phase diagrams and the orientational properties of the different species. The effect of clustering on the stability of the liquid-crystal phase with eightfold symmetry is analyzed in Sec. III. MC simulations and results for cluster fractions are shown in Section IV. Finally some conclusions are drawn in Sec. V.
II Binary mixtures of right triangles and squares
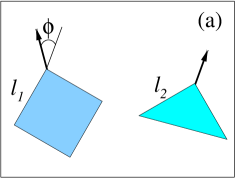
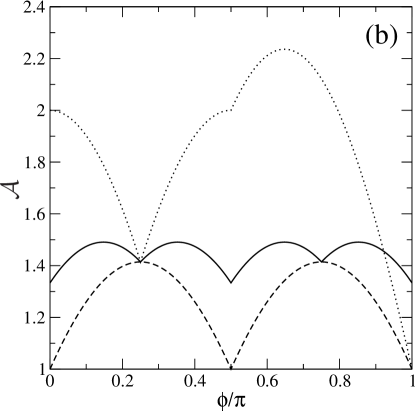
In this section we study the phase behavior and orientational properties of binary mixtures of squares (species 1) and right triangles (species 2). The motivation is that the cross excluded area (apart from being symmetric with respect to ) exhibits four local minima in the interval , located at relative angles (); see Fig. 1 where the relative angle is defined and the excluded area shown for the particular case of squares and triangles of the same (equally-sized) lengths, (solid curve in the figure). We can see however that the gain in scaled excluded area for these relative angles is rather modest. For comparison the same figure shows the excluded area between like species. In these cases the gain in excluded area at the local minima is much higher. Despite this, the presence of four local minima in could in turn promote the stability of the O phase in the binary mixture. Even though the standard DFT does not predict the stability of the O phase in one-component fluids nosotros , the mixing of right triangles with other particles such that the cross excluded area presents eight local minima in the interval could generate an O phase. One example of such a particle is the square. We remind the reader that simulations, DFT and experimental studies on vibrated monolayer of hard squares Frenkel ; MR1 ; experiments have shown that the one-component fluid exhibits I-T and T-crystal second-order phase transitions.
To analyze this mixture we used a DFT based on the SPT-second virial theory, generalized to binary mixtures. The proposed expression for the excess free-energy per particle in reduced thermal units is
| (1) |
Here a truncated Fourier expansion of the orientational distribution functions,
| (2) |
is used to calculate the double angular average with respect to and in the SPT expression nosotros0 , giving the term between parenthesis in Eqn. (1). The total packing fraction is defined as , i.e. the product of the total number density and the average area , given by a sum over species of the products of molar fractions and particle areas (). Here is the equally-sized side-length of species (see Fig. 1). The coefficients can be computed analytically from the expressions
| (3) |
The ideal part of the free-energy for the mixture is
| (4) |
The total free-energy per particle is , and the Gibbs free-energy functional per particle can be obtained from
| (5) |
The latter expression is very useful for the calculation of the phase diagrams of binary mixtures, in particular when the fluid demixes into two coexisting phases. The procedure is: (i) fix the pressure to some constant value ; (ii) using this constraint, calculate the total density as a function of the molar fraction of squares , and insert back into the Gibbs free-energy to obtain the function . Note that in the above procedure all Fourier amplitudes have to be obtained through the equilibrium condition . From the double-tangent construction of the function , which guarantees the equality of chemical potentials of the species at the coexisting phases, we find the coexisting values and , and from these the coexisting densities and . Changing the pressure and repeating the above procedure we can construct that part of the phase diagram in the pressure-composition plane where demixing is present.
In the case of second order phase transitions a bifurcation analysis is required (see MR3 for the case of mixtures of triangles using the SPT formalism). The packing fraction at bifurcation (spinodal curves) turns out to be a simple generalization of the corresponding expression for the one-component fluid nosotros :
| (6) |
The orientational order of squares and triangles is measured using the set of order parameters
| (7) |
These parameters account for N (), T (), TR () and O () ordering.
II.1 Bifurcation curves
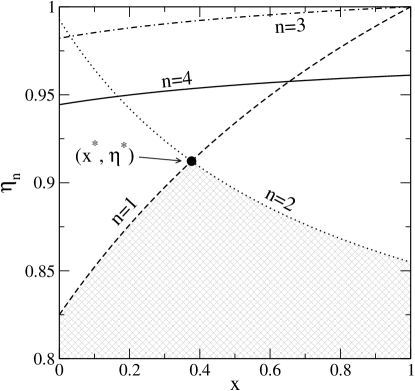
The spinodal curves for from Eqn. (6) are plotted in Fig. 2 for a binary mixture of particles with . The I-N () and I-T () curves departing from (one-component triangle fluid) and (one-component square fluid) are monotonically increasing functions of ( for I-N and 2 for I-T respectively), and intersect at . This in turn means that mixing stabilizes the I phase, which can be easily explained by the different (two- vs. four-fold) symmetries of the liquid-crystal phases of hard-triangle and hard-square fluids, respectively. The shaded area in the figure indicates the region of I-phase stability against orientational order. As we will shortly see, the point is always located inside the demixing gap. It is interesting to note from Fig. 2 that the effect of mixing leads to the lowering of the packing-fraction difference between the I-O and I-N or I-T bifurcations. This indicates that the O phase of the mixture becomes "less" unstable with respect to the N or T phases. However this mixing effect is not sufficient to stabilize it.
II.2 Phase diagrams
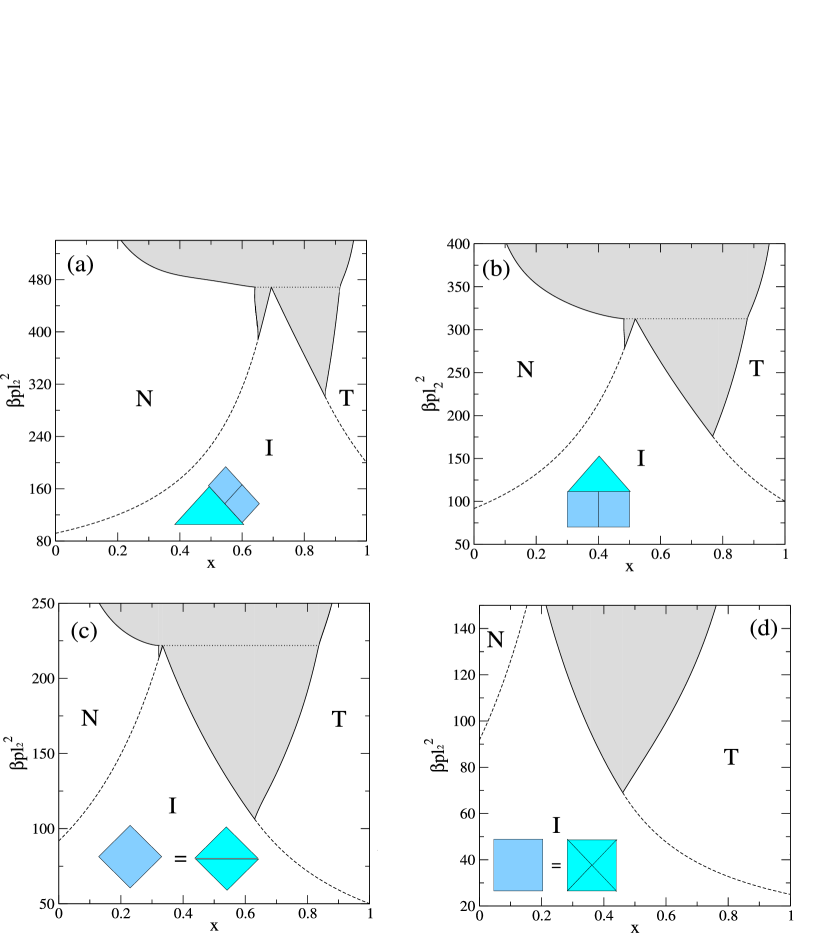
Phase diagrams have been calculated for four different binary mixtures, Figs. 3 (a)-(d). Defining the length ratio , the four mixtures have , , , and . The area ratio for the mixtures is , , , and 4, respectively. I-N and I-T second-order transition curves depart from the and axes, respectively. Both curves end in corresponding tricritical points. For pressures above these tricritical points the corresponding transitions become of first order. In the case of the I-T curve the transition corresponds to strong demixing, with strong fractionation of the two species. Both phase transitions are bounded above by a triple I-N-T coexistence (dotted horizontal lines in panels (a)-(c) of Fig. 3), and for higher pressures demixing takes place between a N phase, rich in triangles, and a T phase, rich in squares. It is interesting to note that the lowest tricritical point is always that of the I-T spinodal curve. This is the effect of the large decrement in total averaged excluded area, , when T (instead of N) orientational ordering is induced by squares. It is clear from Fig. 3(b) that mixing of species with approximately the same areas (values of in the neighborhood of unity) also exhibit strong demixing. This can be explained by two facts, which we elaborate in the following.
-
(i)
The different (two- vs. four-fold) symmetries of the N and T phases of the hard-triangle and hard-square fluids, respectively. Triangles oriented into a T configuration generate a high free-energy cost due to the particular form of the triangle-triangle excluded area. From Fig. 1 we can see how the equipartition of particle orientations into the discrete set of angles (perfect T ordering) generates an averaged triangle-triangle scaled excluded area
(8) larger than that corresponding to equipartition into the angles (perfect N ordering), equal to . Also a fluid of hard squares cannot exhibit a N phase due to the symmetry of the particles, which give an excluded area invariant under -rotations. Therefore, at high enough pressures, phase-separation into two phases, each having the orientational order promoted by the most populated species, guarantees a much lower free-energy at equilibrium.
-
(ii)
The decrease in excluded area promoted by orientational order is less for the triangle-square pairs than for triangle-triangle or square-square pairs (Fig. 1), which obviously favors the demixed state.
A final comment on the phase diagrams is that the coexistence region of the first-order I-N transition shrinks dramatically with the ratio , eventually disappearing for (see panel (d) of Fig. 3). This is the most likely scenario, something that cannot be settled with total certainty as the minimization in Fourier space cannot be achieved successfully for pressure values close to the intersection between the I-N second order transition curve and the N binodal of the N-T demixing. Our numerical minimization scheme does not give reliable results at these pressure values, even for a number of Fourier coefficients equal to 100, due to the incorrect numerical representation of . A pressure difference, measured from the I-T tricritical point, of , is the highest pressure for which we could perform accurate numerical minimizations. If this scenario were correct the second-order I-N transition would end as a critical end-point at the N binodal of the N-T demixing transition.


These phase diagrams resemble those recently obtained from MC simulations of mixtures of hard disks and squares Escobedo2 , where the packing fraction for the I-hexatic transition (counterpart of the present I-T transition) increases with the molar fraction of squares (disks). Both transition curves merge in a mosaic region where a micro-segregated phase with mixed hexatic and T symmetries become stable. This region is in turn bounded above by a triangular-solid-T demixing which, at high enough pressures, becomes a solid-solid demixing between a triangular solid, rich in disks, and a square crystal, rich in squares. Here we do not consider nonuniform phases in the triangle-square mixture, so we cannot discard that, for high enough pressures, the demixed phases found are in fact crystalline (instead of liquid crystalline).
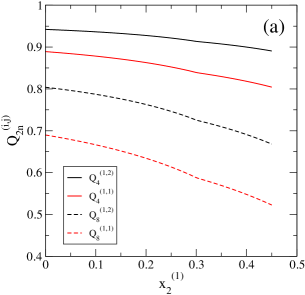
We now study the orientational properties of the mixture with asymmetry (). The fluid pressure was fixed to a value , i.e. above the I-N-T triple point (see panel (b) of Fig. 3). The total free-energy per particle was minimized with respect to all Fourier amplitudes , and the equilibrium orientational distribution functions and order parameters were obtained as a function of mixture composition . Results for the latter are shown in Fig. 4. Note that, for a wide range of compositions, the curves represent order parameters of the unstable mixture due to the demixing transition shown in Fig. 3(b). However it is illustrative to look at the behavior of the orientational ordering of triangles and squares as a function of composition for the whole interval . Close to the one-component limits or , the N order parameter of triangles , or the T order parameter of squares, , is highest, indicating strong N or T orientational ordering. In the neighborhood of squares follow the orientation of the more abundant triangular species by orienting their axes into a T configuration, but with rather low orientational ordering. However, as Fig. 5(a) indicates, the function has (aside from the three main peaks located at , typical of the T symmetry), two additional small peaks at and ; this is again an indication that square-triangle interactions are behind the rising of orientational correlations with eightfold symmetry. This in turn affects the difference between the order parameters and , which is anyway rather small as can be seen from Fig. 4 (a).
For triangles, we see from Fig. 4(b) that decreases with and becomes zero for , while is always different from zero, exhibits a local minimum at and then increases monotonically. This means that for triangles adopt the same T-orientational symmetry as squares. It is interesting to note that, for these compositions, the values of the T () and O () order parameters of triangles are very similar, which again points to the existence of square-triangle correlations with eightfold symmetry. This feature can be directly seen in Fig. 5 (b), where the functions are plotted for a stable mixture with . Note the strong T ordering of both, squares and triangles, indicated by the presence of sharp peaks at , but also the presence of small satellite peaks in at , a clear signature of the O-orientational correlations promoted by square-triangle interactions. Despite the presence of these correlations, we should bear in mind that triangles are clearly oriented in a T-configuration, with the symmetry . The exact O symmetry, , is never observed for any mixture-asymmetry, pressure or composition values.
Fig. 5(c) shows the functions for a mixture with a reference value of (at which the curves and cross each other). Note that this mixture is unstable with respect to phase-separation. In this case squares clearly orient in a T configuration, but triangles have a rather low uniaxial N ordering, with significant secondary peaks at , again a signature of eightfold square-triangle orientational correlations. The conclusion can be extracted from all these results that, despite the existence of square-triangle interactions, which promote the presence of small secondary peaks in signalling O-type ordering, the effect is not sufficient to stabilize the O phase.
III The clustering effect
As shown in our previous paper nosotros , a DFT based on the second- or third-virial coefficients is not capable of accounting for the O liquid-crystal symmetry in a one-component fluid of hard right triangles. MC simulations Dijkstra ; nosotros , however, indicate that these correlations are present. Clearly, any attempt to formulate a theory for the fluid of hard right triangles should consider at least four-body particle correlations. Needless to say this is an exceedingly complicated task. Because of these high-order correlations, we may expect particles to be prone to arrange into more or less short-lived clusters containing a few (but anomalously high as compared to ‘normal’ fluids) number of particles. In the case of right triangles it is not difficult to think of the geometries of the most stable particle arrangements (see below). It is also reasonable to expect that these ‘clusters’ may dominate the fluid structure and govern the bulk orientational properties of the fluid. With this idea in mind, a step forward in our attempts to construct an alternative model for O correlations is based on considering these clusters as special entities, connecting to the idea self-assembly of particles (taken as monomer units). This idea leads to an extreme model, where monomers form ‘superparticles’, which in turn may orient in such a way as to give rise to eightfold symmetry in the final monomer orientational distribution function.
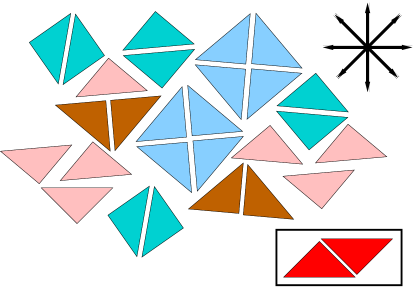
Based on previous MC simulations Dijkstra ; nosotros and on additional MC simulations to be presented below, we have identified what can be regarded as ‘important’ local particle configurations in the fluid at high packing fractions. A total of four such configurations have been chosen because of their high probability along the MC chains generated in the simulations. A sketch of these four important configurations is shown in Fig. 6, where they are drawn in different colors. Hereafter these configurations will be called ‘clusters’ and we now proceed to defined their structure and shapes.
First we define ‘big-square’ clusters. These appear close to the T-K transition and may be regarded as tetramers, made out of four right triangles (monomers) with their short equally-sized sides (of length ) almost in contact, and with their right-angled vertexes also in close proximity. This configuration gives a big square with side equal to the triangle hypotenuse (). Four-body correlations obviously induce the formation of these structures. We also identify another type of cluster of square symmetry but with smaller size, obtained by joining two triangular monomers by their hypotenuse, creating a small square dimer of side . Obviously the presence of these clusters in the fluid is very likely because this configuration guarantees the absolute minimum of the triangle-triangle exluded area (when the relative angle between particle axes is ), but note that tetramers do not result by merging two of these clusters. Next, if two triangular monomers are joined by their equally-sized sides with the right-angled vertexes in contact they form a large right-angled triangular cluster with the equally-sized lengths equal to . Triangular clusters need to be considered in the analysis since tetramers can be formed by merging two of these. The last species to consider is, obviously, the free triangular monomer (the building block of all the larger clusters).
We should note that a rhomboidal dimer (see Fig. 6) can be also formed by two triangles with their small sides almost in contact and their right-angled and acute-angled vertexes in close proximity. Even though these clusters are present in some cases (see later), they will be discarded from the model in order to make it computationally manageable. Also, other possible clusters of different shapes or larger sizes will not be taken into account. Again we refer to Fig. 6 for the definition of the four clusters and also to Table 1 where their shapes, sizes and areas are summarized.
In the following we present a simple extension of the SPT model for the quaternary mixture that results from a consideration of the four clusters defined above as distinct species. will denote the length of the species, with indicating the geometry ( for squares and for triangles), and the cluster size ( for small and for big clusters). The excess free-energy per particle of the mixture can be obtained by substituting the product by , and the particle areas by , into Eqn. (3), thus obtaining the generalized coefficients which are then used in (1). Note that the sums over in the latter equation, and also in the ideal free-energy (4), should run over four () and two () indexes, respectively. Obviously we need to extend the same labelling to the molar fractions and to the orientational distribution functions: and , respectively. The total packing fraction is then , and the orientational order parameters are written as
| (9) |
| Species | 11 | 12 | 21 | 22 |
|---|---|---|---|---|
| Geometry | |
|
|
|


Now we specify how the orientational ordering of monomers is calculated from that of clusters. Cluster numbers in the mixture are given by (), with the total number of clusters. The total number of monomers distributed among all different clusters can be calculated as . First let us consider the case of square dimers. The main axes of the triangular monomers point parallel and antiparallel to one of the square axis, i.e. the one perpendicular to the square diagonal coinciding with the monomer hypotenuse (see Fig. 8). Note that if we select the square axis to be parallel to the other diagonal these angles are . However, as the squares only have I or T liquid-crystal phases, which are orientationally invariant with respect to rotations, the above definitions are identical, i.e. they do not affect the final result for the orientational ordering of monomers. Thus the contribution of the square dimers to the global orientational ordering of monomers is given by the function
| (10) |
For square tetramers, we can see, as Fig. 8 shows, that the axes of the triangular monomers are at angles with respect to one of the square diagonals. Thus the contribution of the square tetramers is
The free triangular monomers give a contribution of
| (12) |
Finally, for triangular dimers, it is easy to see that the two monomer axes point at angles with respect to the main axis of the dimer (see Fig. 8). The contribution of the triangular dimers is then
| (13) |
The total orientational distribution function of monomers is just the sum of the different contributions obtained above,
| (14) |
and from this we can calculate the order parameters of monomers as
| (15) |
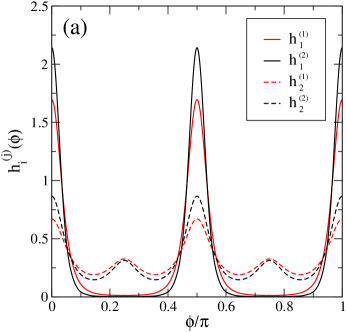
We have performed a minimization of the total free-energy per particle with respect to all the Fourier amplitudes (note the labelling extension ) of the quaternary mixture. Possible demixing scenarios were not searched for because we are only interested in the effect of clustering on the orientational ordering of monomers. Fig. 7(a) shows the equilibrium orientational distribution functions , for a scaled pressure fixed to , and a set of molar fractions with values , , and , fulfilling the equality . Clearly the system exhibits T ordering in all the species, with square clusters being more ordered and with the presence of secondary peaks (located at and ) in the distribution functions of triangular clusters. As explained above, this is due to square-triangle interactions. The monomer distribution function , calculated from Eqn. (14), is shown in panel (b). It has a quasi-eightfold symmetry, with peaks located at (). Note however that the perfect symmetry is not exactly fulfilled: small differences in the height of the peaks are clearly visible. To put this result in perspective we remark that, in a MC simulation, small differences like these would naturally be attributed to the effect of limited angular sampling in the histogram of . In any case the function plotted in Fig. 7(b) shows a high O-type ordering, which is a direct consequence of the strong particle clustering.
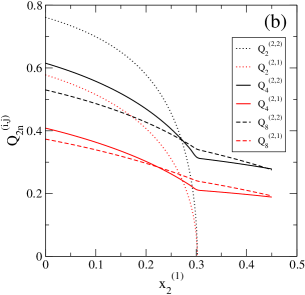

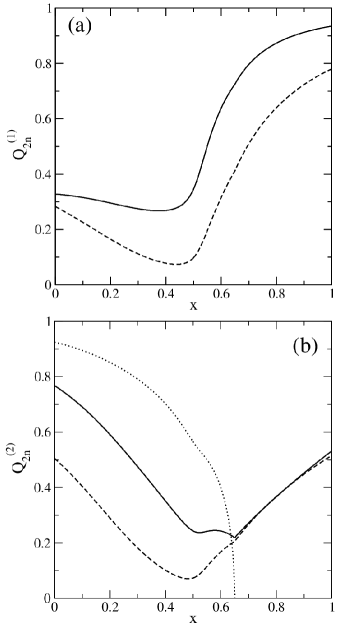
Next, order parameters obtained using Eqn. (15) are shown in Fig. 9 as a function of monomer composition , following a path in molar fractions , and (these values fulfill the constraints : the sum of compositions of big triangles and small squares is equal to the sum of compositions of the other two species). Panel (a) shows that square tetramers have the largest T ordering, as compared to that of square dimers. This order decreases with as a consequence of the fact that (the fraction of big squares) also decreases along the selected path. In turn, triangular dimers and monomers exhibit N ordering up to , beyond which it vanishes due to the fact that (the fraction of big triangles) decreases with along the same path, see panel (b). From this value, triangular species follow the T ordering of the square species. It is interesting to note that the O order parameter of the triangular species, (), becomes larger than the T order parameter, , indicating the presence of satellite peaks in at and . Panel (c) shows the monomer order parameters as a function of , calculated from Eqn. (15). The N ordering of monomers is relatively low, something that can be seen from the negligible value of which becomes zero beyond . We also see that, close to , the T order parameter, , becomes zero, while the O ordering, measured through , is relatively high in the neighborhood of . Therefore there exists an interval in around where the orientational distribution function of monomers is similar to that shown in Fig. 7 (b), i.e. it shows a quasi-eightfold symmetry. Note that, for , the T director of square clusters coincides with that of the preferential alignment of square dimers, while for it changes to that of square tetramers (rotated by with respect to the former). This is the reason why the order parameter exhibits a change in sign at . Again we can conclude from these results that the O ordering is highly enhanced by the presence of particle clustering: when monomers are mainly distributed into square dimers and tetramers, there exists an interval in the composition of free monomers for which the monomer distribution function exhibits quasi-eightfold symmetry.
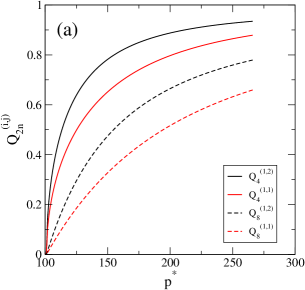
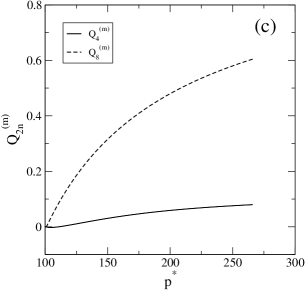
Fig. 10 shows the evolution of the order parameters of all species [panels (a) and (b]) and of the monomers [panel (c)] as a function of reduced pressure for the same fixed set of compositions as in Fig. 7: , , , and , where all species exhibit T ordering. The quasi-O ordering, measured by , increases from zero at the same pressure value where square dimers and tetramers exhibit a second-order I-T transition at . For higher pressures the O order parameter of monomers, , is significantly larger than the T order parameter .

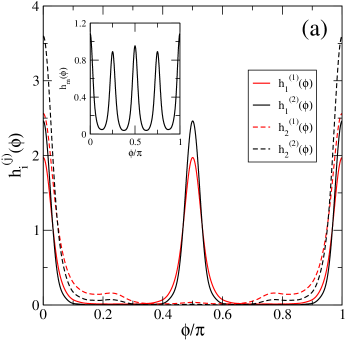
The angular distribution function of monomers with quasi eightfold-symmetry can also be obtained for a ternary mixture of free monomers and dimers of triangular or square symmetry, i.e. for vanishingly small tetramer composition. This is shown in Fig. 11(a), where all cluster orientational distribution functions, , are shown for a quaternary mixture with , , and and reduced pressure . For comparison, the monomer function is also shown (see inset). This time free monomers and triangular dimers clearly orient in a N-like configuration. As pointed out before, the axes of monomers in triangular dimers are oriented with respect to the dimer axis with relative angles of , while monomers in square dimers have their axes parallel or anti-parallel to the dimer axis. Taking into account these relative orientations, and the fractions of the different clusters ( and for triangular and square dimers, respectively; and the rather small values of and for free monomers and tetramers, respectively), the quasi-eightfold symmetry of explains itself. We expect that the inclusion of the fourth virial coefficient in the theory would cause the orientational distribution function of triangles to exhibit strong O correlations, since configurations where two or four triangles form triangular or square dimers, and also square tetramers, might be entropically favored.
The above set of values is just a particular case of the path obtained by varying the free-monomer composition inside the interval , together with the constraints , , (keeping fixed the small tetramer composition). The evolution of the order parameters of monomers, , with respect to along this path and for the same pressure is shown in Fig. 11(b). A wide region exists, close to the axis, where the O order parameter is highest, which corresponds to strong eightfold orientational correlations between monomers. In the opposite region, close to the axis, monomers are oriented in an N-like configuration ( begin the highest parameter). Obviously this is a direct consequence of the small population of triangular and square clusters with respect to free monomers.

IV Monte Carlo simulations
To understand the relevance of clusters in the configurations of hard right triangles and give some support to the assumptions underlying the models presented in the previous sections, we have performed NVT-MC simulations of a system of 576 particles in a square box using periodic boundary conditions, using MC steps for equilibration and MC steps for averaging. Different expansion and compression runs were performed, starting from different initial configurations, to explore different liquid-crystalline phases. For more details on the simulations we refer to our previous work nosotros .
As shown in Ref. nosotros, , the high-density fluid of hard right triangles seems to be very prone to staying in specific configurations which can be controlled by an adequate choice of symmetry for the initial configuration. This would mean that there are dense regions in phase space from which it would be difficult to escape, probably due to unlikely local rearrangements of particle orientations. Thermodynamically we could think of these configurations as corresponding to metastable phases. A reasonable procedure to identify the true stable phase at each density would be to perform free-energy calculations using thermodynamic integration or applying the coupling method Frenkel1 . In this section, however, we are not interested in thermodynamic stability (which would require extensive simulations), but rather we use this feature of the hard right-triangle fluid to probe for particle clustering in fluids of different bulk symmetries. Also, since we are using the MC technique, we are not probing the stability in time of clusters as separate entities, but simply the occurrence of a set of particular configurations and their relative importance along the MC chains.
While the definition of clusters in a one-component fluid of hard particles may be clearly specified, the criteria used in a simulation to associate a particular local configuration of particles to a given cluster type is somewhat arbitrary. Here we have focused on the clusters defined in Section III used to explore the consequences of the mixture model since, as explained previously, these are the most natural configurations of the system. We advance that indeed these configurations are very frequent, depending on the total fluid density.
Again we refer to Fig. 6 and Table 1 for the definition of three types of clusters: square tetramers, square dimers, an triangular dimers. In the simulations we have also focused on rhomboidal dimers (defined in Section III), since they may be present at not too high densities. To define a dimer with a particular symmetry (either square, triangular or rhomboidal), we calculate the distance between the barycenters of two neighbouring triangles as well as their relative angle. Each perfect dimer (particles in contact with the correct relative orientation) has specific values for these two variables (relative distance and relative angle). We define a dimer of a given type whenever these variables depart by less than 15% from their ideal values. This criterion is totally arbitrary and, in fact, may lead to a situation where some pairs of particles are not considered to form a dimer, whereas visually one would clearly ascribe the pair to be a dimer. Also, a given pair of neighboring particles may be considered as a dimer discontinuously along the MC chain. Finally, the fact that the same tolerance is used to define all types of dimers may introduce a bias in the relative fraction of dimers. Again, the analysis is qualitative and not aimed at extracting definite numbers on quantities that are otherwise ill-defined.
Finally, square tetramers are defined as the association of two triangular dimers by applying a more relaxed criterion on distance and angle (20%) with respect to the ideal values for a square tetramer with all four particles in contact. This is because the positions and angles of the two particles of a triangular dimer will already depart from the ideal values.
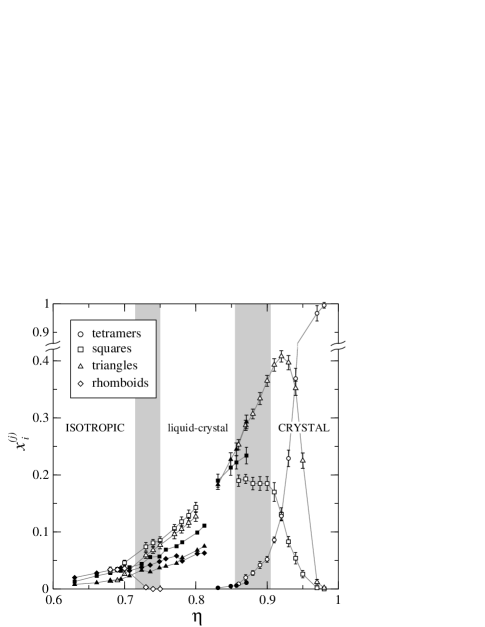
Fig. 12 shows the fractions of the four species of clusters as a function of packing fraction. To calculate the fraction of a given species, the average number of clusters of that type along the simulation is divided by the average number of clusters of all species, including "isolated" triangles (monomers). Several expansion and compression runs were performed, following the results presented in Ref. nosotros, . In Fig. 12 the different clusters are indicated by different symbols, as shown in the keybox. Filled symbols correspond to compression runs, while open symbols are from expansion runs. In the isotropic phase, our cluster criterion identifies a small fraction of the two types of dimers and rhomboids. They correspond to local arrangements that do not persist along the MC chain. As density is increased (compression run, filled symbols) cluster fractions also increase. In the liquid-crystal region an order-parameter analysis (see Ref. nosotros, ) identifies this phase as tetratic or octatic, since the and adopt comparable and relatively high values. The strong O ordering is coming mainly from square dimers, which also force neighboring monomers to adopt orientations that foster this type of ordering. Note that rhombic clusters are also present, but no tetramers can be identified.
An expansion run from a perfect crystal of tetramers (perfect tetratic crystal) at is also shown in Fig. 12. Initially only tetramers are present, but as density is decreased these clusters break into triangular dimers. At the end of the crystal phase the latter clearly dominate, but at the same time a I fraction of square dimers is created. These are probably formed by "free" monomers that have been detached from neighboring tetramers. In essence the existence of these clusters and the evolution of their fractions with density are perfectly compatible with a crystal phase showing thermal fluctuations. As expected, the fraction of rhombic clusters is essentially negligible as particles would have to rotate locally by , which is very difficult at high packing fraction.
Melting of the crystal is associated with a change in the variation of fractions with density. Tetramers have disappeared while the fractions of square and triangular clusters tend to be similar. The fluid becomes ordered in a T phase, dominated by these two types of clusters. As density is further decreased this phase changes to the isotropic phase. Note that in the T phase no rhombic clusters are excited. However, the fraction of these clusters increases suddenly, and the equilibrium value of this fraction in the isotropic phase is reproduced by the expansion run from the T as soon as the phase transition is crossed.
A final compression run was performed from the T phase. As expected, the fluid cannot crystallize and the fraction of square clusters does not match the one obtained from the expansion run, even though triangular clusters do have almost identical fractions.
In summary, the MC simulations show that the particle clusters introduced in Sections II and III do occur in the fluid of hard right triangles, in high proportion and in varying degrees according to the global orientational order of the system. Therefore, a model based on the equilibrium statistics of these clusters as separate entities may be a fruitful way to understand the essential orientational properties of the hard right triangle fluid.
V Conclusions
In this paper we have addressed the origin of the liquid-crystal phase of hard right triangles. Compression Monte Carlo simulations indicate the existence of an exotic liquid-crystalline phase exhibiting tetratic order and strong octatic correlations, which the standard and extended SPT versions of DFT are unable to describe. As a step forward, and in view of the apparently important clustering tendencies of right triangles into square and triangular clusters, we have implemented an SPT (second-virial) approach to analize the phase behavior of four different binary mixtures of right triangles and squares, and calculated their respective phase diagrams. The length-asymmetry of the species are , , 1 and , where the second case corresponds to species having equal particle areas (). All mixtures (including the equal-area one) exhibit strong I-T and N-T demixing, a region of I-N first order transition, and the presence of a I-N-T triple point. The demixing scenarios directly follow from the different liquid-crystal symmetries exhibited by the one-component fluids of hard triangles and hard squares, i.e. N and T symmetries, respectively. Triangles in the mixture can adopt a T ordering which follows the natural ordering of the more populated square species, but with an orientational distribution function, , exhibiting two relatively small satellite peaks located at , which points to the importance of square-triangle interactions in the existence of orientational correlations with eightfold symmetry. However, the distribution function has a clear T character (with T and O order parameters having similar values).
We also provided some results that explain the evidence that, under certain conditions, particle clustering can give rise to situations where the O order parameter, , is much higher that the N, , or T, order parameters. Our results are based on the implementation of a toy model consisting of a quaternary mixture where species are triangular monomers, triangular and square dimers, and finally tetramers, all assumed to form in the real one-component fluid by monomer self-assembling. Evidence form MC simulation for the prevalence of these clusters in the equilibrium configurations of this fluid was presented in Section IV. We then used the SPT approach to estimate the free-energy of the mixture and, via minimization, calculated the equilibrium orientational distribution functions of clusters. From them the corresponding function for monomers can be derived. The question of the possible demixing scenarios, which do certainly exist in these mixtures, was not addressed. The focus was put on the monomer distribution function which, for certain sets of cluster compositions, exhibits quasi eightfold symmetry, with four peaks of similar, although not identical, height in the interval . This demonstrates that the elusive eightfold ordering seen in the simulations, but not in the standard two- and three-body versions of DFT, can originate from the prevalence of particle clustering and its effect on the global orientational properties of the fluid. Further studies focusing on the dynamics of these processes may reveal whether the clustering idea is just a convenient artifact to partition configurational space or a real situation with clearly separated time scales associated to cluster kinetics, internal cluster dynamics and the fluid dynamics of clusters as separate entities. In any case, our results indicate that it is reasonable to appeal to the clustering effect to explain why the O phase, observed in simulations, cannot be stabilized by the usual implementations of DFT.
Even if the idea of the fluid as a collection of clusters turns out to be useful, the present assumption that cluster composition can be fixed in advance should be improved by considering these compositions as an output of the model. Consistent with the theory for the kinetics of clustering, monomer aggregation and evaporation, and cluster formation and fragmentation, may be described by a set of chemical reactions, with certain reaction constant ratios at equilibrium. These ratios can be obtained from the difference between the chemical potentials of the species involved in the reactions. The more realistic model would consider the fluid as a polydisperse mixture of cluster or superparticles of different sizes and shapes, each cluster having a particular association energy as in models of associated fluids. We believe these ideas deserve some exploration in the future.
Acknowledgements.
Financial support under grant FIS2017-86007-C3-1-P from Ministerio de Economía, Industria y Competitividad (MINECO) of Spain, and PGC2018-096606-B-I00 from Agencia Estatal de Investigación-Ministerio de Ciencia e Innovación of Spain, is acknowledged.References
- (1) K. Zhao, C. Harrison, D. Huse, W. B. Russel, and P. M. Chaikin, Phys. Rev. E 76, 040401(R) (2007)
- (2) K. Zhao, R. Bruinsma, and T. G. Mason, Proc. Natl. Acad. Sci. USA 108, 2684 (2011).
- (3) K. Zhao, R. Bruisma, and T. G. Mason, Nat. Commun. 3, 801 (2012).
- (4) Z. Hou, Y. Zong, Z. Sun, F. Ye., T. G. Mason, and K. Zhao, Nat. Communn. 11, 2064 (2020).
- (5) H. Schlacken, H.-J. Mogel, and P. Schiler, Mol. Phys. 93, 777 (1998).
- (6) K. W. Wojciechowski and D. Frenkel, Comp. Met. Sci. Tech. 10, 235 (2004).
- (7) A. Donev, J. Burton, F. H. Stilinger, and S. Torquato, Phys. Rev. B 73, 054109 (2006).
- (8) A. P. Gantapara, W. Qi, and M. Dijkstra, Soft Matter 11, 8684 (2015).
- (9) Y. Martínez-Ratón, E. Velasco, and L. Mederos, J. Chem. Phys. 122, 064903 (2005).
- (10) Y. Martínez-Ratón, E. Velasco, and L. Mederos, J. Chem. Phys. 125, 014501 (2006).
- (11) Y. Martínez-Ratón, A. Díaz-De Armas and E. Velasco, Phys. Rev. E 97, 052703 (2018).
- (12) Y. Martínez-Ratón and E. Velasco, Phys. Rev. E 102, 052128 (2020).
- (13) T. Geigenfeind and D. de las Heras, J. Chem. Phys. 150, 184906 (2019).
- (14) C. Avendaño and F. A. Escobedo, Soft Matter 8, Soft Matter 8, 4675 (2012).
- (15) , J. A. Millan, M. Engel, and S. C. Glotzer, Phys. Rev. X 7, 021001 (2017).
- (16) J. P. Ramírez González and G. Cinacchi, Phys. Rev. E 104, 054604 (2021).
- (17) E. van den Pol, A. Petukhov, D. Thies-Weesie, D. Byelov and G. Vroege, Phys. Rev. Lett. 92, 145505 (2004).
- (18) S. D. Peroukidis and A. G. Vanakaras, Soft Matter 9, 7419 (2013).
- (19) S. Belli, A. Patti, M. Dijkstra and R. van Roij, Phys. Rev. Lett. 107, 148303 (2011).
- (20) E. M. Rafael, D. Corbett, A. Cuetos and A. Patti, Soft Matter 16, 5565 (2020).
- (21) E. M. Rafael, L. Toni, D. Corbett, A. Cuetos and A. Patti, Phys. Fluids 33, 067115 (2021).
- (22) L. Walsh and N. Menon, J. Stat. Mech. 083302 (2016).
- (23) T. Müller, D. de las Heras, I. Rehberg and K. Huang, Phys. Rev. E 91 062207 (2015).
- (24) M. González-Pinto, F. Borondo, Y. Martínez-Ratón and E. Velasco, Soft Matter 13, 2571 (2017).
- (25) M. González-Pinto, J. Renner, D. de las Heras, Y. Martínez-Ratón and E. Velasco, New. J. Phys. 21, 033002 (2019).
- (26) R. Wittmann, L. B. G. Cortes, H. Löwen and D. G. A. L. Aarts, Nat. Commun. 12, 623 (2021).
- (27) P. A. Monderkamp, R. Wittmann, L. B. G. Cortes, D. G. A. L. Aarts, F. Smallenburg and H. Löwen, Phys. Rev. Lett. 127, 198001 (2021).
- (28) L. Mederos, E. Velasco and Y. Martínez-Ratón, J. Phys.: Condens. Matter 26, 463101 (2014).
- (29) Y. Martínez-Ratón and E. Velasco, Phys. Rev. E 104, 054132 (2021).
- (30) E. S. Harper, G. van Anders, and S. C. Glotzer, PNAS 116, 16703 (2019).
- (31) Y. Martínez-Ratón, E. Velasco and L. Mederos, Phys. Rev. E 72, 031703 (2005).
- (32) P. Bolhuis and D. Frenkel, J. Chem. Phys. 106, 666 (1997).
- (33) B. P. Prajwal and F. A. Escobedo, Phys. Rev. Mat. 5, 024003 (2021).