Charge density wave order in the kagome metal AV3Sb5 (A= Cs, Rb, K)
Abstract
We employ polarization-resolved electronic Raman spectroscopy and density functional theory to study the primary and secondary order parameters, as well as their interplay, in the charge density wave (CDW) state of the kagome metal AV3Sb5. Previous x-ray diffraction data at 15 K established that the CDW order in CsV3Sb5 comprises of a structure: one layer of inverse-star-of-David and three consecutive layers of star-of-David pattern. We analyze the lattice distortions based on the structure at 15 K, and find that the lattice distortion is the primary-like (leading) order parameter while and distortions are secondary-like order parameters for vanadium displacements. This conclusion is confirmed by the calculation of bare susceptibility that shows a broad peak at around along the hexagonal Brillouin zone face central line ( line). We also identify several phonon modes emerging in the CDW state, which are lattice vibration modes related to V and Sb atoms as well as alkali-metal atoms. The detailed temperature evolution of these modes’ frequencies, half-width at half-maximums, and integrated intensities support a phase diagram with two successive structural phase transitions in CsV3Sb5: the first one with a primary-like order parameter appearing at K and the second isostructural one appearing at around K. Furthermore, the -dependence of the integrated intensity for these modes shows two types of behavior below : the low-energy modes show a plateau-like behavior below while the high-energy modes monotonically increase below . These two behaviors are captured by the Landau free-energy model incorporating the interplay between the primary-like and the secondary-like order parameters via trilinear coupling. Especially, the sign of the trilinear term that couples order parameters with different wave-vectors determines whether the primary-like and secondary-like order parameters cooperate or compete with each other, thus determining the shape of the dependence of the intensities of Bragg peak in x-ray data and the amplitude modes in Raman data below . These results provide an accurate basis for studying the interplay between multiple CDW order parameters in kagome metal systems.
pacs:
74.70.Xa,74,74.25.ndI Introduction
The kagome lattice is a model system to study the electronic and magnetic properties Syôzi (1951); Broholm et al. (2020). The corner shared triangle network of the kagome lattice enables three sublattice interferences, which give rise to a variety of exotic physics, for example, flat bands, van Hove singularities, Dirac dispersions in its electronic structure, frustrated magnetism, to name a few. Various electronic orders such as charge and spin density wave order, charge bond order, chiral flux order, nematic order, and superconductivity are under rigorous investigations Wang et al. (2013); Kiesel et al. (2013); Feng et al. (2021a); Denner et al. (2021); Lin and Nandkishore (2021); Park et al. (2021); Setty et al. (2021); Feng et al. (2021b); Christensen et al. (2021); Tazai et al. (2021); Jiang et al. (2021a); Xie et al. (2021); Chen et al. (2021a); Liang et al. (2021).
Recently, a three-dimensional charge density wave (CDW) order, which coexists with superconductivity (SC) at low temperatures, was discovered in AV3Sb5 (A= Cs, Rb, K) kagome metals [Fig. 1(a)] Feng et al. (2021a); Ortiz et al. (2019, 2020, 2021a); Jiang et al. (2021b); Tan et al. (2021); Zhao et al. (2021); Chen et al. (2021a); Li et al. (2021); Chen et al. (2021b). Superconductivity emerges at 13 K, much lower than the CDW transition temperature (80100 K) Ortiz et al. (2019, 2020, 2021a). Superconductivity competes with the CDW order in AV3Sb5, as increases when the CDW order is suppressed by hydrostatic pressure Yu et al. (2021a); Chen et al. (2021b), or by the hole doping Oey et al. (2021); Liu et al. (2021a); Song et al. (2021a), or by thickness reduction Song et al. (2021a, b). Furthermore, the CDW state shows a large extrinsic anomalous Hall effect Yang et al. (2020); Yu et al. (2021b) in the absence of magnetic ordering Kenney et al. (2021). In the same CDW state, muon spin relaxation studies revealed a striking enhancement of the internal field just below which persists into the SC state, suggesting time-reversal symmetry breaking Mielke et al. (2022); Yu et al. (2021c). Thus, clarification of the symmetry, the nature, and the low-temperature properties of the CDW order is pivotal for understanding the superconductivity in AV3Sb5 system.
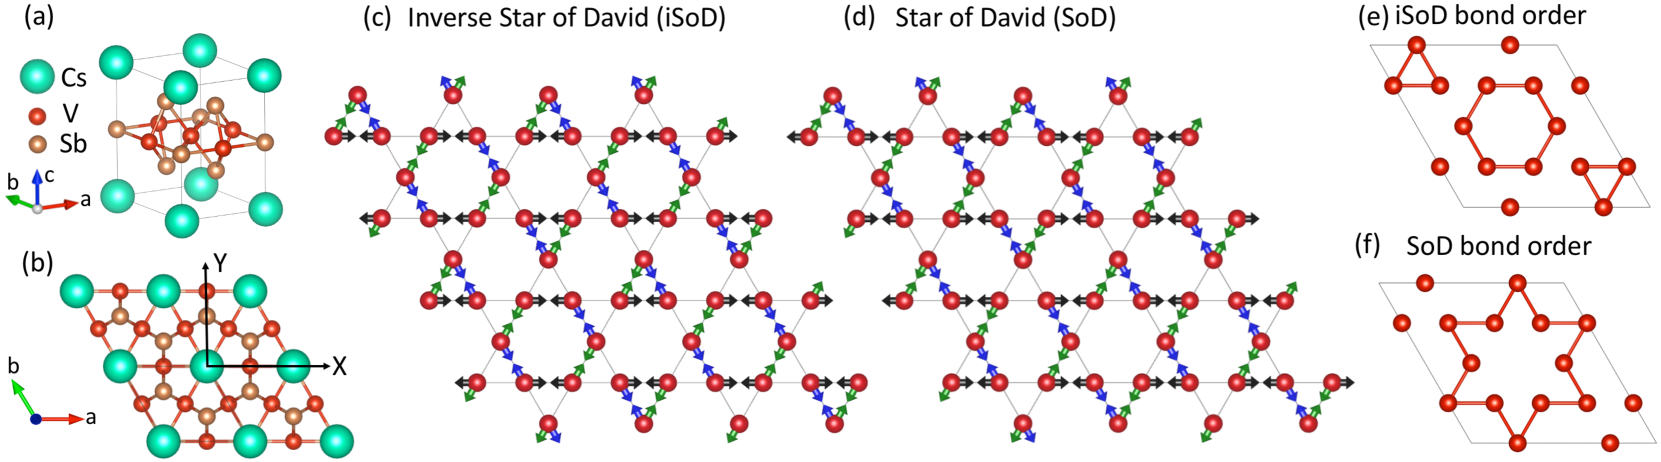
The origin of the CDW order in AV3Sb5 remains under debate Jiang et al. (2021b); Feng et al. (2021a); Denner et al. (2021); Lin and Nandkishore (2021); Park et al. (2021); Setty et al. (2021); Feng et al. (2021b); Christensen et al. (2021); Tan et al. (2021); Luo et al. (2022); Jiang et al. (2021a). However, there is a consensus that CDW order leads to lattice distortions, which mostly consist of the displacements of vanadium atoms in the kagome plane: the inverse-star-of-David (iSoD) type CDW [Fig. 1(c)] and the star-of-David (SoD) type CDW [Fig. 1(d)] are obtained by the opposite sign displacements according to the same pattern Tan et al. (2021); Christensen et al. (2021). Both SoD and iSoD structure display an in-plane modulation of the high-temperature structure Tan et al. (2021), which is clearly demonstrated by scanning tunneling microscopy (STM) measurements Jiang et al. (2021b); Chen et al. (2021a); Zhao et al. (2021); Liang et al. (2021). Earlier x-ray diffraction measurements identified a three-dimensional CDW order in all AV3Sb5 compounds Ortiz et al. (2020); Li et al. (2021). However, more recent x-ray measurements reported a CDW order in CsV3Sb5 Ortiz et al. (2021b), highlighting nontrivial interlayer ordering along the -axis direction. Furthermore, at an intermediate temperature about 60–70 K, an additional uniaxial charge modulation was reported by STM studies Chen et al. (2021a); Zhao et al. (2021); Liang et al. (2021). Ultrafast coherent phonon spectroscopy measurements Ratcliff et al. (2021); Wang et al. (2021a); Wu et al. (2021), muon spin relaxation measurements Yu et al. (2021c), and transport studies Ni et al. (2021); Xiang et al. (2021) all identified anomalies at around , suggesting a secondary instability below . Finally, density functional theory (DFT) phonon dispersion calculations found imaginary phonon frequencies at both and points Tan et al. (2021), as well as at points along the line connecting the and momenta of the Brillouin zone for the high-temperature phase Christensen et al. (2021), indicating , , and lattice instabilities. These , , and lattice instabilities contribute to , , and CDW orderings, respectively. Which lattice instabilities give rise to the leading order parameter, and how it interplays with other lattice instabilities below the CDW transition in AV3Sb5 system, are not yet conclusively understood Christensen et al. (2021).
In this paper, we use polarization-resolved electronic Raman spectroscopy and DFT calculations to study the leading order parameter associated with the CDW transition in the kagome metal AV3Sb5. Prior x-ray diffraction data established that the CDW order in CsV3Sb5 has super-modulation structure with space group : one layer of iSoD, alternating with three consecutive layers of SoD with zero-phase-shift between neighboring layers Ortiz et al. (2021b). To a good approximation, the structure can be further refined to space group , which is the same space group for the high temperature undistorted kagome phase. By analyzing the vanadium lattice distortions in the structure, we find that lattice instability is primary-like while and instabilities are secondary-like. This is also confirmed by the calculation of the bare static susceptibility that shows a broad peak at around along the hexagonal Brillouin zone face central line ( line).
These primary-like and secondary-like order parameters are revealed by Raman studies of the amplitude modes. We identify several new and phonon modes related to V and Sb atoms as well as alkali-metal atoms displacements in the CDW state. Both the new and modes are the amplitude modes of the CDW order parameter. Especially, each new mode is a doublet that contains two modes close to each other. The detailed temperature evolution of the modes’ frequency, half-width at half-maximum, and integrated intensity support two successive phase transitions in CsV3Sb5: the first one with a primary-like order parameter appearing at K and the second isostructural one emerging at about K. Moreover, we find two types of dependence of the integrated intensity for the new modes below : the low-energy modes show a plateau-like behavior below while the high-energy modes monotonically increase below . These two behaviors are captured by the Landau free-energy model incorporating the interplay between the primary-like and the secondary-like order parameters via trilinear coupling.
The rest of this paper is organized as follows. In Sec. III, we present and discuss the theoretical and experimental results. Specifically, in Sec. III.1, we first present an overview of the dependence of the Raman results. In Sec. III.2, we introduce three lattice instabilities along the -line, namely, , , and instabilities. In Sec. III.3, we examine the bare susceptibility along the line and establish an enhancement of at , which corresponds to the lattice instability. In Sec. III.4.1, we discuss the crystal structure of CsV3Sb5 at 15 K and analyze the major lattice distortions in CsV3Sb5. In Sec. III.4.2, we perform the subduction analysis for the CDW phase. In Sec. III.4.3, we construct a Landau free-energy model to study the interplay between the primary-like and secondary-like order parameters. In Sec. III.5.1, we show several Raman modes appearing in the CDW state and compare them in three AV3Sb5 systems. In Sec. III.5.2, we discuss the temperature dependence of the main phonon modes in and scattering geometries in CsV3Sb5. In Sec. III.5.3, we discuss the temperature dependence of the and amplitude modes in and scattering geometries in CsV3Sb5, respectively. Finally, in Sec. IV, we provide a summary of our observations and conclusions.
II Experiment and Methods
II.1 Single crystal preparation and characterization
Single crystals of AV3Sb5 (A= K, Rb, Cs) were synthesized via the flux method described in Refs. Ortiz et al. (2019, 2020, 2021a), and the chemical compositions were determined by inductive coupled plasma analysis. These samples were characterized by electric transport and magnetic susceptibility measurements. The extracted structure phase transition (charge density wave transition) temperatures for AV3Sb5 (A= K, Rb, Cs) are 78, 103, and 94 K, respectively Ortiz et al. (2019, 2020, 2021a). The sharpness of the Raman modes and the low residual spectra background (Fig. 2) indicate the high quality of the single crystals.
II.2 Raman scattering measurements
The as-grown samples were cleaved in the air to expose a fresh (001) crystallographic plane. The fresh cleaved surface was stable in the air, as we did cleave the crystals in N2 atmosphere and found no noticeable changes in the Raman data. A strain-free area was examined by a Nomarski image. The cleaved crystals were positioned in a continuous helium flow optical cryostat. The Raman measurements were mainly performed using the Kr+ laser line at 647.1 nm (1.92 eV) in a quasibackscattering geometry along the crystallographic axis. The excitation laser beam was focused into a m2 spot on the surface, with the incident power around 10 mW. The scattered light was collected and analyzed by a triple-stage Raman spectrometer, and recorded using a liquid-nitrogen-cooled charge-coupled detector. Linear and circular polarizations were used in this study to decompose the Raman data into different irreducible representations. The instrumental resolution was maintained better than 1.5 cm-1 . All linewidth data presented were corrected for the instrumental resolution. The temperatures were corrected for laser heating (Appendix A).
All spectra shown were corrected for the spectral response of the spectrometer and charge-coupled detector to obtain the Raman intensity , which is related to the Raman response : . Here denotes the polarization of incident (scattered) photon, is energy, is temperature, and is the Bose factor.
The Raman spectra were recorded from the (001) surface for scattering geometries denoted as , which is short for in Porto’s notation, where and denote linear polarization parallel and perpendicular to the crystallographic axis, respectively; and denote the right- and left-circular polarizations, respectively. The direction corresponds to the axis perpendicular to the (001) plane [see Fig. 1(b)]. The polarization leakage from optical elements was removed in our data analysis (see Appendix B).
The relationship between the scattering geometries and the probed symmetry channels are summarized in Table 1. The algebra used in this study to decompose the Raman data into three irreducible representations of the point group are summarized in Table 2. More details are presented in Appendix C.
| Scattering geometry | Symmetry channel |
|---|---|
| Symmetry Channel | Expression |
|---|---|

II.3 Density functional theory calculations
Density functional theory (DFT) calculations were performed within the Perdew-Burke-Ernzerhof-type generalized gradient approximation Perdew et al. (1996), which is implemented in the Vienna -initio Simulation Package (VASP) Kresse and Furthmüller (1996, 1996). The projected augmented wave potentials with 9 valence electrons for the A atom, 5 valence electrons for V, and 5 valence electrons for Sb were employed. The cutoff energy for the plane-wave basis set was 300 eV. The zero-damping DFT-D3 van der Waals correction was employed throughout the calculations. The phonon dispersion was calculated by using the finite displacement method as implemented in the PHONOPY code Togo and Tanaka (2015). More details of phonon calculations are presented in Ref. Tan et al. (2021).
The bare charge susceptibility was calculated via Eqs. 1 and 2 where both intraband and interband contributions are considered Johannes and Mazin (2008):
| (1) |
| (2) |
and are the real and imaginary parts of bare susceptibility, respectively. is the Fermi-Dirac distribution function. is the band dispersion, is the Fermi energy, and . The two parts for the high-temperature phase are calculated with a tight-binding Hamiltonian based on the maximally localized Wannier functions Mostofi et al. (2008). The mesh for the Brillouin zone integral is . The temperature in the Fermi-Dirac distribution is about 116 K (10 meV). For the imaginary-part integral, the delta functions were replaced with the Lorentzian functions. The full width at half maximum for the Lorentzian function is about 10 meV.
II.4 Symmetry analysis
The ISODISTORT tool Campbell et al. (2006), which is part of the ISOTROPY software suite, was used to analyze the lattice distortions in CsV3Sb5 shown in Table 3. This procedure uses projection operators that decompose lattice distortions into separate irreducible representations (irreps) of the space group. The amplitudes of these irreducible representations can then be analyzed to identify the primary-like lattice distortions that have the largest amplitude below the structural phase transition, and the secondary-like distortions which have smaller amplitudes. We refrain from referring to these order parameters as “primary” and “secondary”, and instead call them “primary-like” and “secondary-like”, because there are trilinear terms present in the lattice Hamiltonian which can induce avalanche transitions. In such a phase transition, both order parameters set in together, but the transition disappears when the secondary-like order parameter is removed. The free-energy expression in Eq. 6 was obtained following the same procedure in Ref. Christensen et al. (2021), and with the help of the INVARIANTS tool of the ISOTROPY software suite. The information for the irreducible representations of point groups and space groups follow the notations of Cracknell, Davies, Miller & Love Cracknell et al. (1979), which is the same for the Bilbao Crystallographic Server Aroyo et al. (2011, 2006).
III Results and Discussions
III.1 Data overview
The high-temperature undistorted crystal of CsV3Sb5 has a hexagonal structure with space group (#191) (point group: ) above K. Below , the translational symmetries are broken and a three dimensional CDW order forms. In Fig. 2, we present an overview of the dependence of the Raman modes in both and scattering geometries for CsV3Sb5. In addition to one main phonon in scattering geometry and one main phonon in scattering geometry persisting across upon cooling, several new phonons modes appear in both scattering geometries below . The new modes in scattering geometry and the higher-energy modes in scattering geometry abruptly appear below and gain intensity gradually upon cooling [Fig. 2(c)]. In contrast, the low-energy modes in scattering geometry first appear as relatively broad features which then sharpen upon cooling and gain intensity moderately [Fig. 2(a)]. In the following sections, we will discuss the nature of these modes, analyze the leading order parameters, the symmetry of the CDW ground state, and the origin of these two different behaviors for the new Raman modes below .
III.2 Lattice instabilities at , , and points
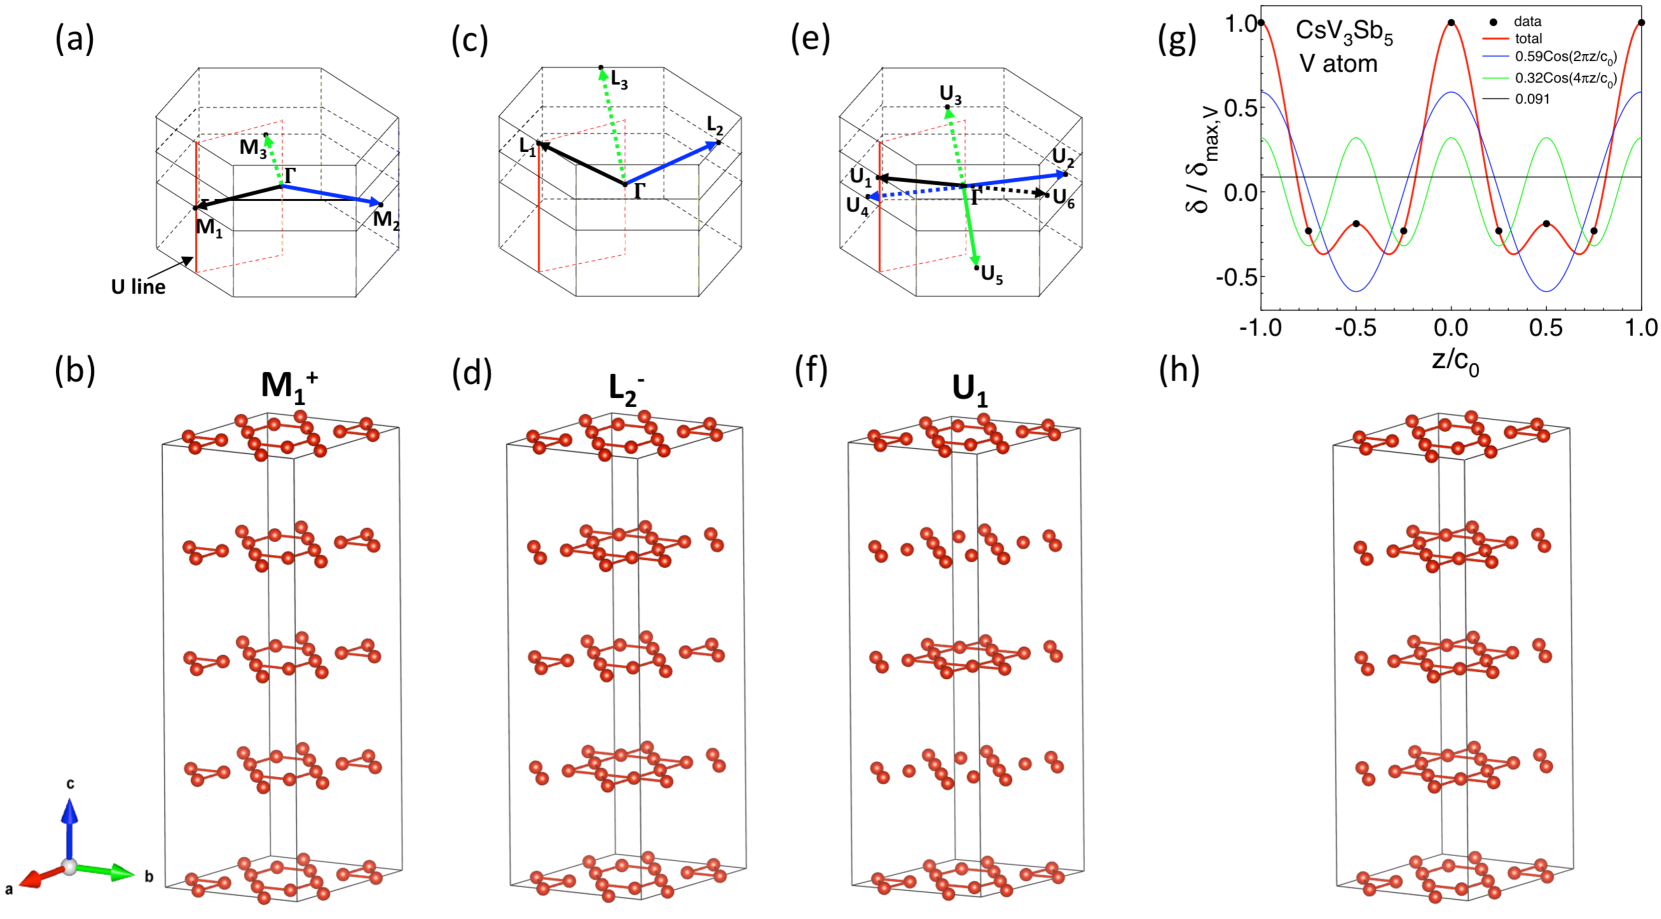
To begin with, we discuss the lattice instabilities in CsV3Sb5. Previous DFT calculations for this crystal structure find two unstable phonon modes at and points, as well as at the middle points of the -line connecting the and momenta of the Brillouin zone Tan et al. (2021); Christensen et al. (2021) (see Appendix D). They transform as , , and irreducible representations of the space group . Formally, , , and are one-dimensional irreducible representations of the little group of the wave vectors (), (), and (), respectively. There are three vectors in the stars of both and points, as shown in Figs. 3(a) and (c), respectively. The star of points has six vectors existing in three pairs. Within each pair, the two vectors are related to each other by inversion symmetry, as shown in Fig. 3(e). As a result, the and space group representations are three dimensional while the space group representation is six- dimensional.
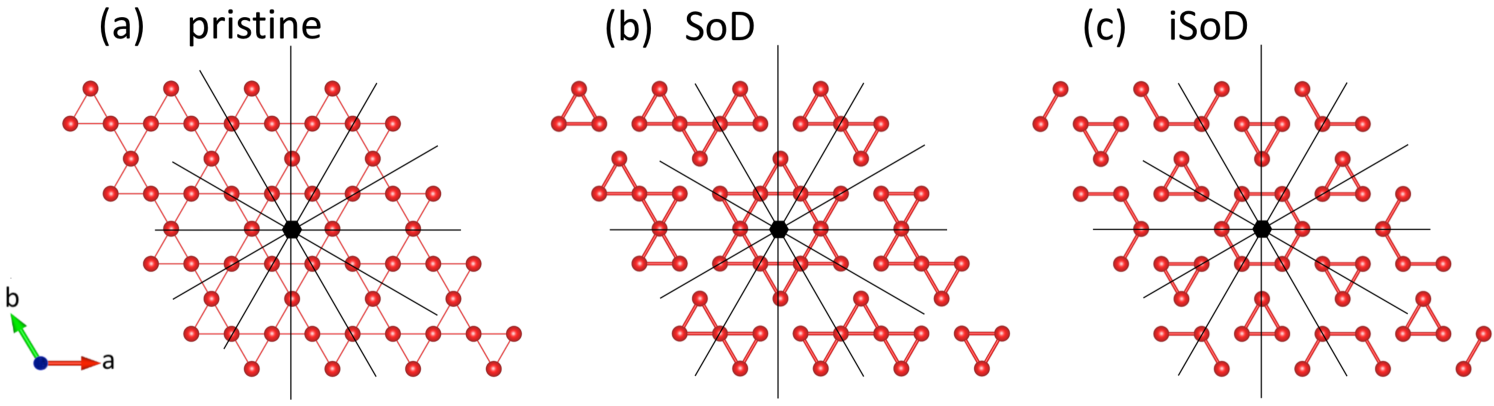
For a single kagome layer, considering the instability, the equal-weight superposition of the three in-plane V-V displacements along the vectors shown in Fig. 3(a) lead to two distinct -symmetric CDW orders. If all three components of V-V displacements have the same phase and equal amplitudes [Fig. 1(c)], the resulting shorter V-V bond pattern is the inverse star-of-David (iSoD) bond order shown in Fig. 1(e). On the other hand, if we shift the phase of one of the three V-V displacements by while keeping the amplitudes the same [Fig. 1(d)], the resulting pattern is the star-of-David (SoD) bond order shown in Fig. 1(f). Flipping the sign of two components of the order parameter, in other words, shifting the phase of two of the three V-V displacements by , does not change the CDW pattern, but it shifts the CDW pattern by one unit cell, leading to a different domain of the same low-symmetry phase. While the translational symmetries are broken in the SoD and iSoD phases, they both possess the same set of mirror planes as the high-temperature structure, hence, they have the same point group , as is illustrated in Fig. 4.
In real space, the only difference for , , and instabilities is the interlayer ordering for neighboring V kagome layers along the -axis direction. For instability, all atoms are displaced in phase between the neighboring layers [Fig. 3(b)], corresponding to a ordering. For instability, all V displacements are out-of-phase between the nearest-neighboring layers [Fig. 3(d)], leading to a ordering. For instability, all V displacements are out-of-phase between next-nearest-neighboring V layers [Fig. 3(f)], contributing to a ordering. Note that even when the and order parameters set in (when the phase of displacements in neighboring kagome layers are not equal), it is possible to have mirror planes both normal to and in the plane of kagome layers. The equal-amplitude distortions of all three or all six components give rise to the same structures, but with enlarged ( or ) unit cells. The realized CDW structure with supercell [Fig. 3(h)] can be a combination of the three lattice instabilities, namely, it is a superimposition of the three bond orders shown in Figs. 3(b), (d), and (f). Because the has lower symmetries than or , in other words, it breaks all the symmetries that and break, these and order parameters whose displacement patterns will be induced by can be regarded as secondary(-like) order parameters.
III.3 Bare susceptibility
In order to understand which lattice instabilities (, , and ) drive the CDW order in AV3Sb5, we examine the bare susceptibility .
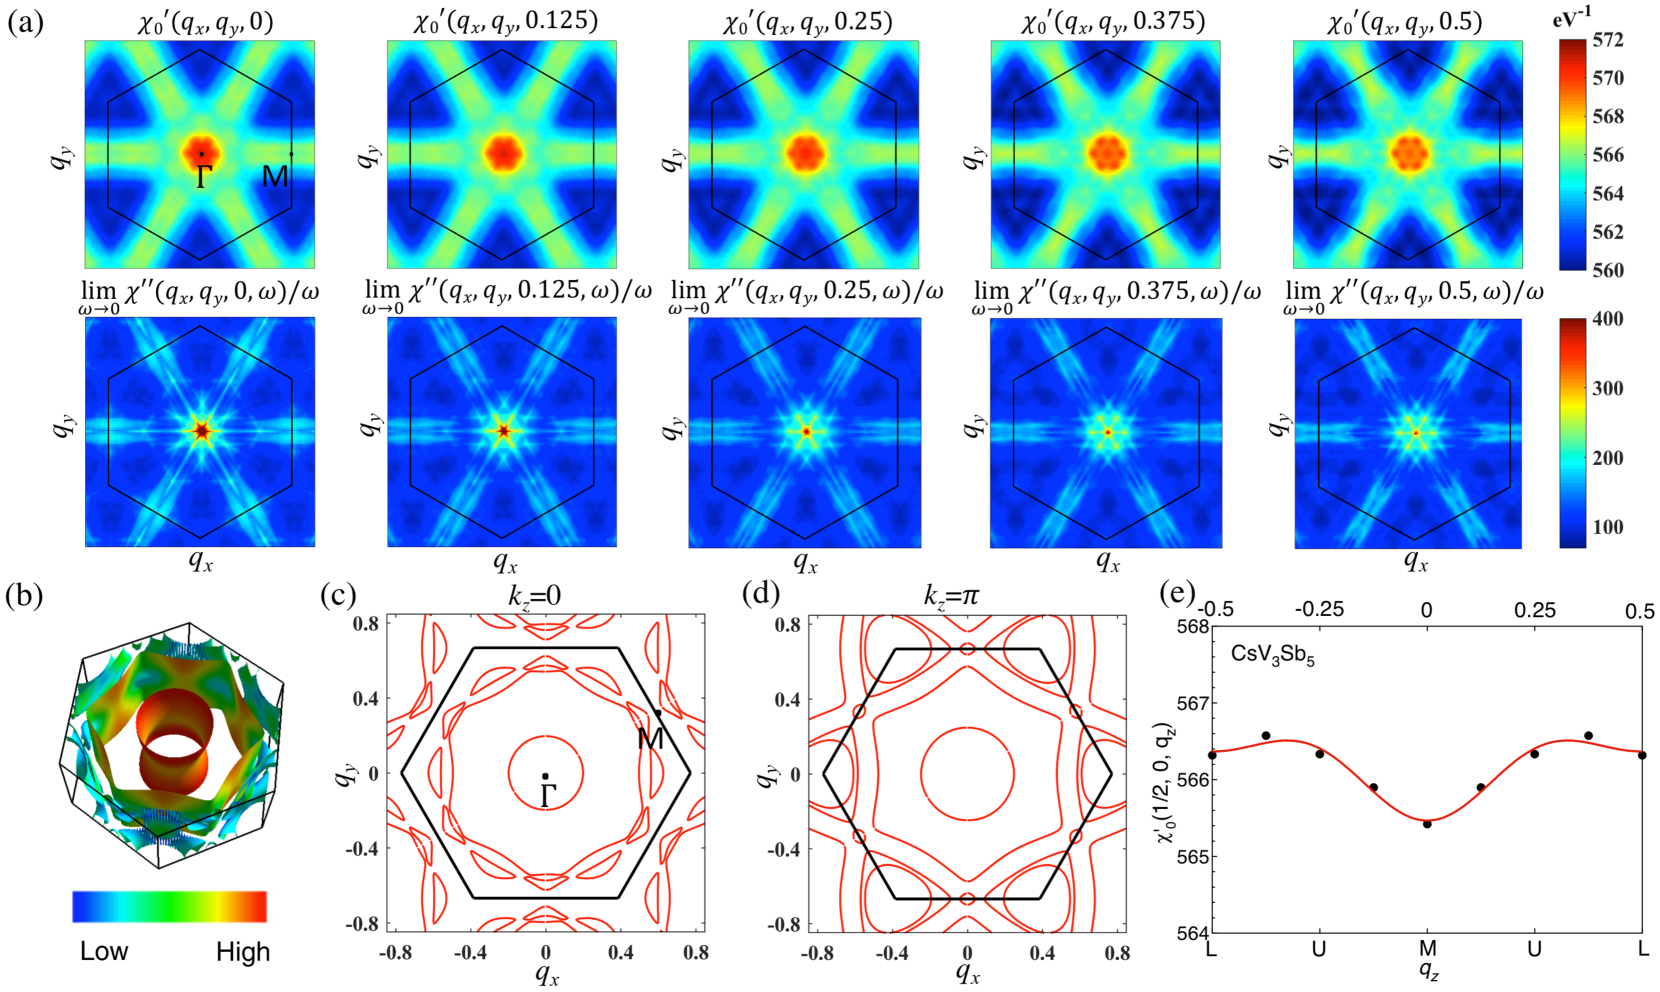
In Fig. 5(a), we show and for CsV3Sb5 in the high-temperature phase with at 116 K. The , , and lattice instabilities locate in the planes, respectively. For , shows a broad enhancement along direction in the momentum space, indicating that Fermi surface nesting is marginal to drive the CDW transition. This result is also consistent with the Ref. Wang et al. (2022). Local minima are found at points and ridges along direction exist around point. Similar topography in is also found for nonzero , as well as for . The ridges around lines originate from the 2D-like large hexagonal Fermi surface of V band near Brillouin zone boundary [Fig. 5(b)]. Because the faces of the hexagon are relatively flat [Fig. 5(c) and (d)], the susceptibility along the direction parallel to the faces is large, resulting in the ridge along the direction. Due to the 2D-like Fermi surface [Fig. 5(b)], and show little dependence of [Fig. 5(a)].
In Fig. 5(e), we present as a function of along the line, namely, line. show a general enhancement along the whole -line compared with BZ corner. This indicates the line is a line of lattice instabilities, which is the source for nontrivial interlayer orderings along the -axis direction Ortiz et al. (2020); Li et al. (2021); Ortiz et al. (2021b). In particular, shows a broad peak at around along the line, which suggests that lattice instability is dominant compared with and lattice instabilities.
Furthermore, due to the broad response, the calculated bare susceptibility does not indicate a single CDW ordering wave vector. The same is true also for the DFT phonon calculations [Appendix D]. Therefore, x-ray diffraction refinement data are required to settle the CDW ordering wave vector as well as the dominant lattice instability symmetry. These results will be presented in the next section.
We note that the true CDW instabilities can only be found from the full susceptibilities , not merely from the bare susceptibility . The full susceptibilities must account for both the electronic interactions and the interactions with the lattice. In addition, the local field effects might need to be considered in the calculations Wang et al. (2022); Johannes et al. (2006).
III.4 x-ray diffraction analysis
III.4.1 Primary-like and secondary-like order parameters
For CsV3Sb5, the CDW order is established to be a structure below =94 K Ortiz et al. (2021b). It is refined within the space group assuming a minimal three-fold rotational symmetry and the inversion symmetry based on the x-ray diffraction data Ortiz et al. (2021b).
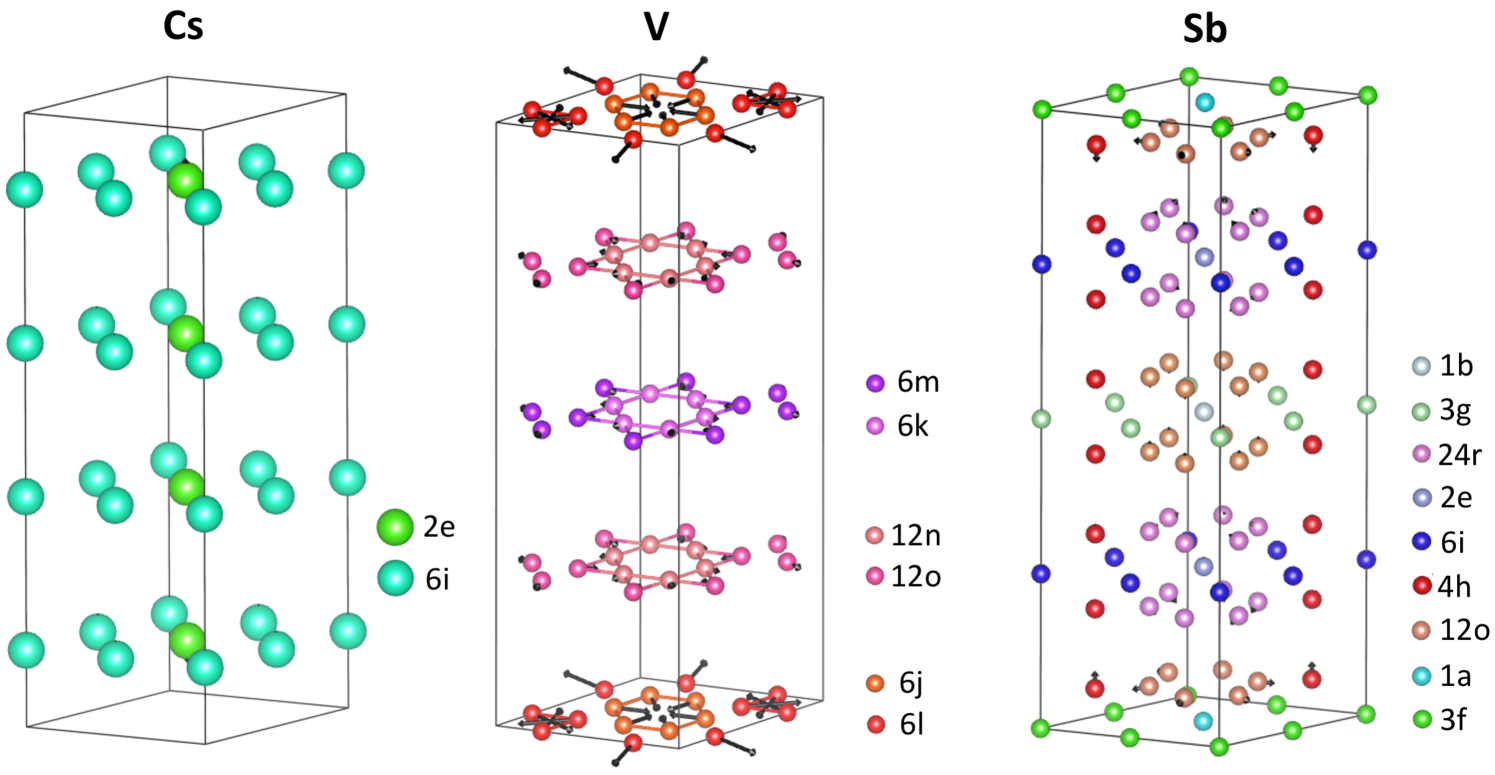
In Fig. 6, we show the refined structure for CsV3Sb5 at 15 K. It is composed of one layer of iSoD structure and three consecutive layers of SoD structures, with zero-phase-shift between neighboring layers. If we disregard the tiny distortions, structure can be further refined to higher-symmetry space group . The point group symmetries of the high-temperature phase are also preserved in this structure, similar as the SoD and iSoD structure illustrated in Fig. 4.
To visualize the lattice distortion in the CDW phase, in Fig. 6, we show the displacement pattern for the structure of CsV3Sb5 at 15 K. The most prominent distortions come from V atoms in the bottom kagome layer at and Wyckoff sites, which show iSoD-type distortions. These distortions are about 1% of the lattice constant, consistent with the 34 orders of magnitude weaker for the superlattice Bragg peak intensity compared with the fundamental lattice Bragg peak. The V atoms in the other three kagome layers at , , , and Wyckoff sites show SoD-type distortions, which are about four times smaller than the iSoD layer. For Sb atoms, only the ones in bottom honeycomb layer at and Wyckoff sites show noticeable distortions, the rest ones in the other three layers hardly move. For Cs atoms, the distortions at Wyckoff sites are tiny while the ones at Wyckoff sites barely move in the CDW phase.
| Displacement | Instability | Amplitude |
| Sb | 0.13 | |
| V | 0.05 | |
| V | 0.17 | |
| V | 0.22 | |
| Cs | 0.03 | |
| Cs | -0.03 |
To quantitatively analyze these lattice distortions and figure out the leading order parameters, we use the ISODISTORT tool set Campbell et al. (2006) to list all the major distortions in Table 3. From Table 3, for V displacements, the distortion is the largest with an amplitude of 0.22 Å. This is the total displacement, summed over all V atoms in the supercell. The distortion is a bit smaller. The amplitude for distortion is about 0.05 Å, much smaller than the distortion. Since the distortion is largest and it breaks all the in-plane and -axis translational symmetries that are broken by and order parameters, we refer to it as the primary-like order parameter while we refer to the or distortions as secondary-like order parameters 111 The reason that we do not regard the distortion as the primary order parameter is due to the trilinear coupling between , , and order parameters. This coupling leads to a simultaneous condensation of multiple order parameters at a temperature where all the second-order coefficients in the free-energy expansion become positive Christensen et al. (2021); Etxebarria et al. (2010). This is referred to as an “avalanche-transition”. Since the avalanche transition is a first-order transition, it is impossible to separate the primary and secondary order parameters as in an ordinary first-order phase transition. Hence, we refer to the order parameters only as primarylike and secondarylike..
Similar conclusions can be also reached by analyzing the normalized amplitude of V displacements in the four kagome layers. In Fig. 3(g), we present the normalized in-plane amplitude of V-displacements () (at sites in the first kagome layer, sites in the second kagome layer, sites in the third kagome layer) as function of coordinate ( is the -axis lattice constant for the four-layer unit cell) at 15 K. The positive sign of represents the iSoD-type distortion while the negative sign represents the SoD-type distortion. We find that can be modeled by a sum of three components: a period of interlayer cosinusoidal modulation, a period of interlayer cosinusoidal modulation, and a constant. These three components correspond to [Fig. 3(f)], [Fig. 3(d)], and [Fig. 3(b)] order parameters, respectively. The amplitude of interlayer modulation is about twice of interlayer modulation, consistent with previous distortion analysis for V displacements that order parameter is the dominant one that drives the CDW order while order parameter is secondary-like. Similar conclusions can also be reached by analyzing V displacements at sites in the first kagome layer, sites in the second kagome layer, and sites in the third kagome layer.
III.4.2 The symmetry of the order parameters
After establishing that instability is primary-like while and instabilities are secondary-like for V displacements, in this section we focus on the symmetry of the order parameters in the CDW ground state Holy et al. (1976).
We refer to the high-temperature structure’s space group as . Similarly, we refer to the space group of the supercell as . Each symmetry of is a symmetry of , but the opposite is not true, because the translation by a primitive lattice vector is no longer a symmetry in the structure. When the symmetry is reduced from to due to the reduced translational symmetry, the irreducible representations of may become reducible representations of . The originally unstable , and modes of the high-temperature structure get folded back to the center of the Brillouin zone for the low-temperature structure. The list of the irreducible representations subducted from the irreducible representations of for are:
| (3) |
| (4) |
| (5) |
Equations (3)-(5) show the symmetry-allowed order parameters with specific irreducible representation symmetries that can emerge in the ordered state due to the corresponding , , and instabilities. For example, instability leads to four potential order parameters in the ground state: (which corresponds to the point group irreducible representation , Raman active, or ), (which corresponds to , Raman active, or ), (which corresponds to , infrared active, ), and (which corresponds to ).
The () is the fully symmetric irreducible representation and () is the two-dimensional (2D) irreducible representations. Both representations are Raman active Nagaosa and Hanamura (1982). According to Eq. (5), only a single unstable phonon in the high-temperature structure freezes below the phase-transition temperature, and becomes the order parameter with a nonzero expectation value in the ground state. This realizes the global minimum of the free energy, and transforms as () in the low-temperature structure.
The other unstable modes in Eq. (5) can be thought of as the “failed order parameters” that would appear as low-energy oscillations of the order parameter. The excitations into the “failed order parameters” could be accessed spectroscopically by exciting the amplitude modes of the “failed order parameters”.
(), one of the “failed order parameters”, breaks the three-fold rotational symmetry. This “nematiclike” -symmetry broken-phase could be stabilized on the surface, which is predicted for a real CDW ordering with due to the three-dimensional coupling Park et al. (2021). It might explain the rotational symmetry breaking due to uniaxial charge modulation observed by STM Liang et al. (2021); Zhao et al. (2021); Chen et al. (2021a), two-fold -axis magnetoresistance below Ni et al. (2021); Xiang et al. (2021), the enhanced elasto-resistance coefficient above Nie et al. (2022), as well as the two-fold-like amplitude of coherent phonon mode observed in the pump-probe Kerr rotation measurement Wu et al. (2021).
III.4.3 Interplay between the primary-like and secondary-like order parameters
In this section, we use a phenomenological model at the level of Landau free-energy expansion to study the interplay between the primary-like and secondary-like order parameters for V displacements in the ground state with () symmetry.
Since the amplitude of the secondary-like distortion is significantly smaller than the and distortions of V displacements (Table 3), we neglect distortion. For the specific domain and order parameter directions of and , the free energy is
| (6) |
where and represent the and order parameters, respectively. , , , and are coefficients while and are coupling constants between and . This form of free energy is found by considering every polynomial, up to fourth order, of the order parameters that remain invariant under each symmetry operation of the high-temperature space group. The term is the trilinear term while the terms is the biquadratic coupling term. They involve coupling between different order parameters Christensen et al. (2021).
According to DFT phonon calculations which are performed at zero temperature Tan et al. (2021); Christensen et al. (2021), both the and modes are unstable. Therefore, both and are negative at zero temperature; however, at high temperature they must both be positive so that the non-symmetry-broken structure is retained. There is no symmetry argument that sets the temperature at which these parameters cross zero, so one can set and without loss of generality. Doing this, and minimizing the free energy Eq. 6 with respect to and , we can obtain the solution of and , as well as the corresponding free energy .
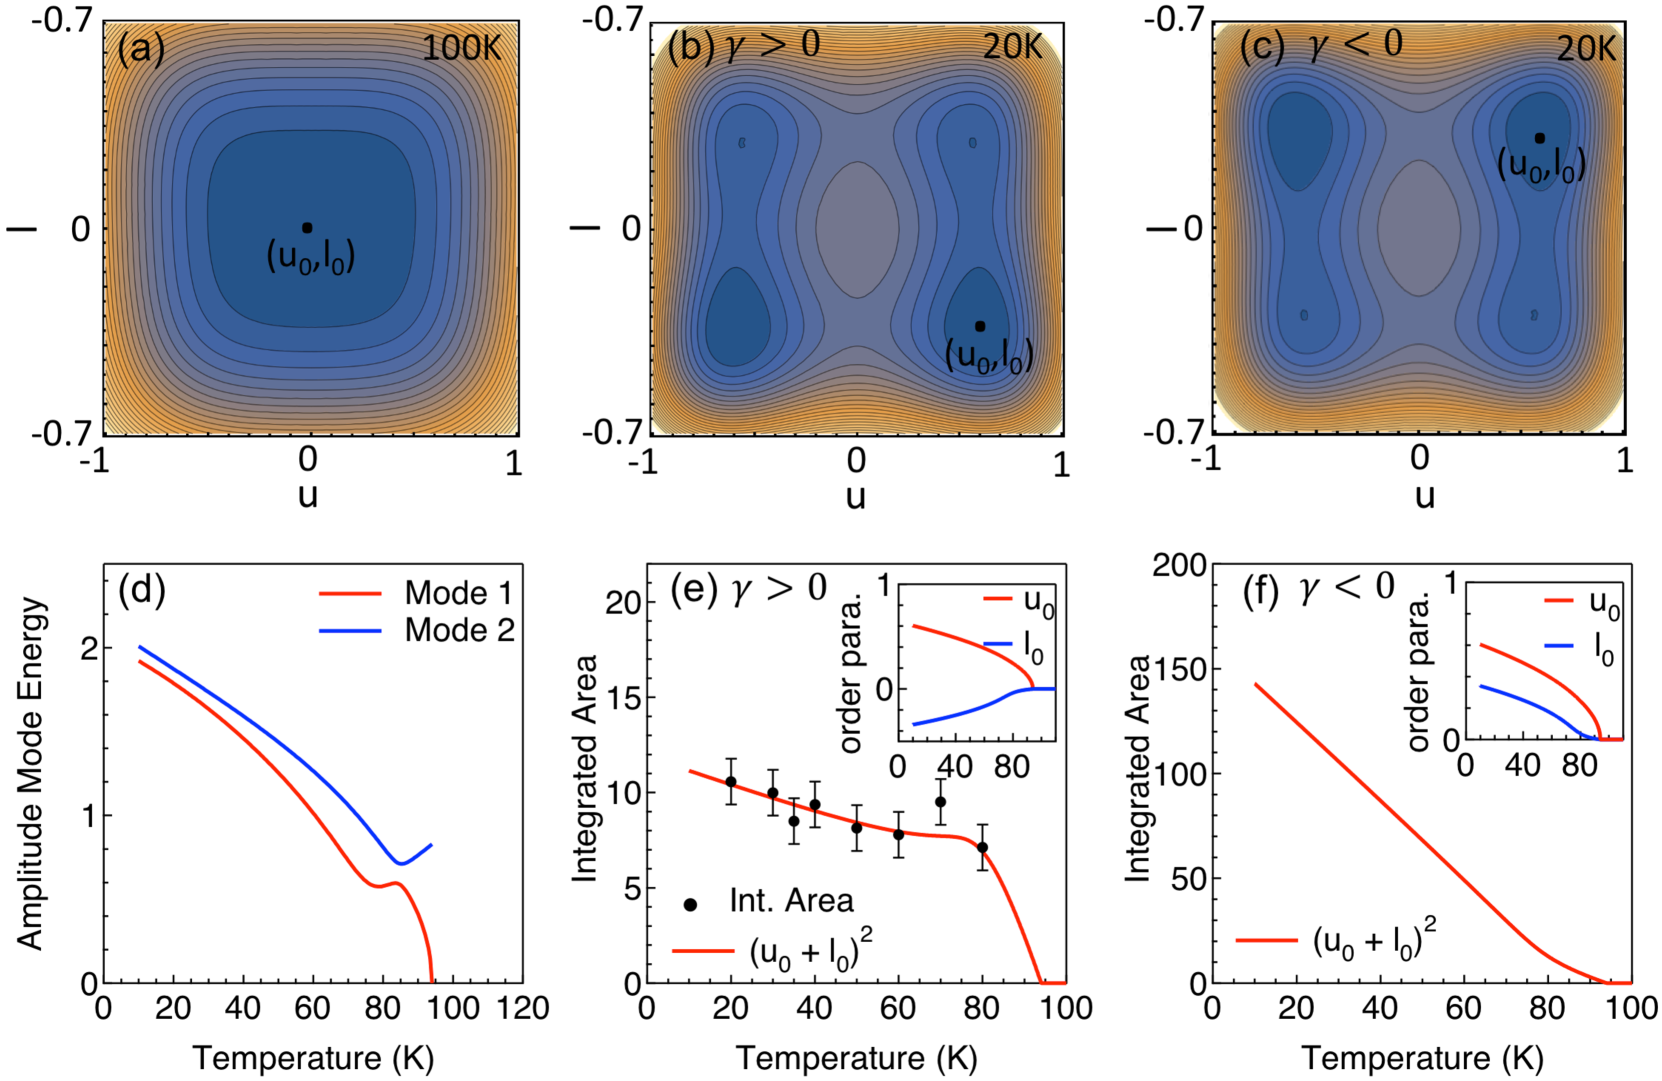
As shown in Fig. 7(a), well above the free energy has a single minimum at . Reducing the temperature near , nonzero order parameters and develop. The free energy develops two minima in the parameter space. Depending on the sign of the parameter , the global minimum appears in a different part of the parameter space. Suppose a case that and the global minimum appears where and [Fig. 7(b)]. If we reverse the sign of , the global minimum locates where and [Fig. 7(c)]. This conclusion also holds when such as in a domain structure, because is even with respect to . In the insets of Figs. 7(e) and (f), we show the solution and corresponding to the global minimum in Figs. 7(b) and (c), respectively. In both cases, the transition is first order and both order parameters have a discontinuity at the transition temperature, but the primary-like order parameter develops more sharply below while the secondary-like order parameter develops gradually below .
The dependence of the square of the order parameters can distinguish how the primary-like and secondary-like order parameters interplay with each other. In Fig. 7(e), we show the dependence of in the case of where and have different signs. In this case, and interplay with each other destructively. As a consequence, shows a plateau-like behavior below . In Fig. 7(f), we show the dependence of the in the case of where and have the same signs. In this case, and interplay with each other constructively. Thus, increases monotonically below . These two behaviors can be tested by the temperature dependence of the amplitude modes’ integrated intensities, which will be discussed in Section. III.5.3.
Moreover, the dependence of also implies the properties of the second phase transition at . For V displacements, the first transition at is driven by the primary-like order parameter, and it breaks both the in-plane and -axis translational symmetries at . The secondary-like order parameter appears by coupling to the primary-like order parameter below . The second transition involves mostly a change in the secondary-like order parameter’s amplitude at . This second transition is isostructural, and results in no change in the symmetry of the crystal. As a consequence, this second transition at is necessarily first order according to group theory.
Finally, we discuss the dependence of the amplitude mode’s frequencies. We expand the free energy at the minimum position (, ). Taking the second derivative of with respect to and , and solving the eigenvalue of the equation
| (7) |
we obtain the dependencies of two normal amplitude mode frequencies around the free-energy minima at (, ) 222In Eq. (7), has the unit of the mass in analog of a two-dimensional harmonic oscillator.. We note that there are two solutions of amplitude mode frequencies based on Eq. (7), suggesting that each amplitude mode is a doublet that contains two modes close to each other in this system.
In Fig. 7(d), we show an example of the dependence of the two amplitudes modes frequencies below . Mode 1 increases gradually from zero below . Mode 2 first decreases, showing an upturn, and then increases gradually. Both modes 1 and 2 show a clear anomaly at around 80 K, which is close to that is set to be 70 in the free-energy model. The anomalies at around are due to the interplay between the primary-like and secondary-like order parameters, because the frequencies of mode1 and 2 are expected to show mean-field-like behavior (square root of ) in the case of and .
III.5 Raman results
In the previous sections, we have established the primarylike and secondarylike order parameters for V displacements, and the interplay between them in the free-energy model. In this section, we illustrate how they are reflected in the Raman data.
III.5.1 Phonon modes

From the group-theoretical considerations of the high-temperature structure, -point phonon modes of the hexagonal AV3Sb5 are expressed as = + 4 + + + 2 + 2 + + 5+ . Raman active modes are = + + . Note that and phonons can be measured from the -plane measurement while the phonon can only be accessed from the surface.
In Figs. 8(a)-8(d), we compare the phonon modes of CsV3Sb5 above and below (94 K) measured in four different scattering geometries. Above , as shown in Fig. 8(a), the sharp phonon mode at around 119 cm-1 detected in , , and scattering geometries corresponds to the phonon, which is the in-plane lattice vibration of the Sb atoms in the honeycomb net. The other sharp phonon at 137 cm-1 detected in and scattering geometries corresponds to the phonon. It is the -axis lattice vibration of the Sb atoms in the honeycomb net. As we show the symmetry decompositions in Fig. 8(b), the and phonon modes are clearly separated into the and channels, respectively.
Below (94 K), new phonon modes are expected to appear in the CDW state Devereaux and Hackl (2007). While there are 26 + 33 + 35 Raman-active modes in the structure due to BZ folding (Appendix E), only those modes modulating the ionic deviation from the high-temperature structure [Fig. 6] with a large amplitude can gain noticeable Raman intensity, thus can be detected in the Raman spectra Klein (1982); Holy et al. (1976); Nagaosa and Hanamura (1982). These modes are the amplitudes modes of the CDW order parameter. The new modes are the amplitudes modes of the CDW ground state while the new modes are the amplitudes modes of the ‘failed order parameters’ (Sec. III.4.2). Specifically, in the case of dual order parameters, each new mode is a doublet at low temperatures (Sec. III.4.3).
In Figs. 2 and 8(c), we show several new phonon modes appearing in all four scattering geometries below . The intensities of these new phonon modes are generally two orders of magnitude weaker than the main phonon peak at 119 and 137 cm-1 , consistent with the weak superlattice Bragg peaks observed in the x-ray scattering measurements Li et al. (2021); Ortiz et al. (2021b). The symmetry of these new phonon modes can be clearly distinguished by decompositions according to the point group shown in Fig. 8(d). This indicates that the three-fold rotational symmetry remains intact in the CDW phase [Appendix C].
Specifically, three additional doublet modes are detected in the channel, and seven additional modes are observed in the channel below . These new phonon peak positions are summarized in Table 4. From Table 4, we find that the experimentally observed phonon frequencies for CsV3Sb5 at 20 K agree with the DFT phonon calculations based on the iSoD structure, suggesting the iSoD-type distortion is dominant in the CDW ground state. This is consistent with the major iSoD-type displacement patterns in the x-ray results [Fig. 6].
It deserves to remark on the charge density gaps which are about meV determined by STM Jiang et al. (2021b), ARPES Kang et al. (2022); Wang et al. (2021b); Luo et al. (2022), and ultrafast measurements Wang et al. (2021a). The CDW gap-opening signatures, namely, the suppression of the low-energy spectra weight and the enhancement of the spectra weight close to meV, are not observed in the Raman response both in the and channels. The absence of CDW gap-opening signatures may be due to the multiband effects in AV3Sb5 system.
We note that if the inversion symmetry does not hold, the infrared-active and modes will become Raman active. However, no such modes are observed [Table 4]. Thus, the inversion symmetry remains intact in the CDW phase, consistent with the second harmonic generation measurements Ortiz et al. (2021b); Yu et al. (2021c) and the x-ray diffraction results Ortiz et al. (2021b).
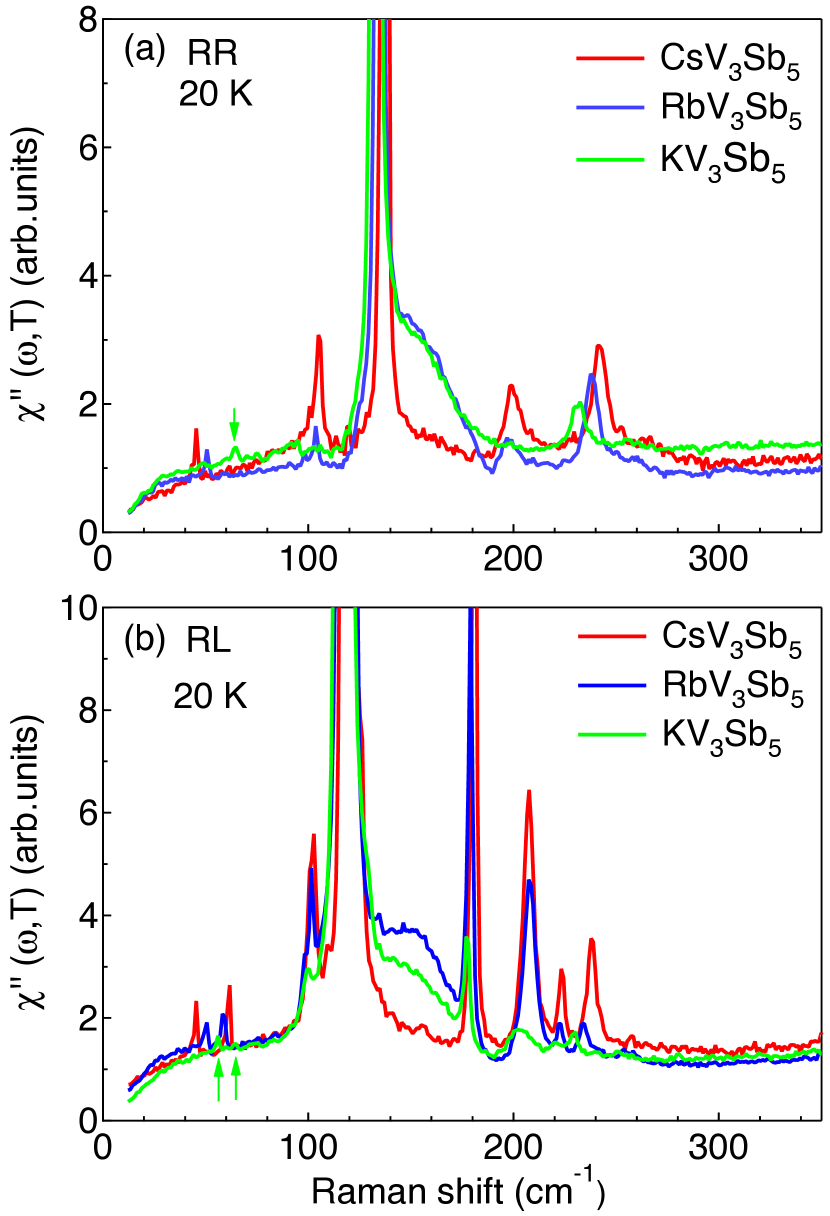
After establishing the new phonon modes in the CDW phase of CsV3Sb5, it is instructive to take a closer look at their sibling compounds RbV3Sb5 and KV3Sb5. In Fig. 9(a) and 9(b), we compare the Raman response in and scattering geometries for the three compounds. In general, the spectral features for all three compounds are similar. They show a similar number of new phonon modes at similar positions at 20 K. The summary of the new phonon modes for the three compounds at 20 K is presented in Table 4.
| CsV3Sb5 | CsV3Sb5 | CsV3Sb5 | RbV3Sb5 | KV3Sb5 | |
| Sym. | SoD | iSoD | |||
| (DFT) | (DFT) | (Exp) | (Exp) | (Exp) | |
| 227 | 242 | 241,262 | 238,260 | 231,254 | |
| 200 | 203 | 197,202 | 196,201 | ||
| 143 | 142 | ||||
| 124 | 132 | 137 | 136 | 133 | |
| 93 | 108 | 99,105 | 98,104 | 92,95 | |
| 45 | 51 | 64 | |||
| 247 | 234 | 238 | 234 | 230 | |
| 219 | 221 | 223 | 223 | 220 | |
| 172 | 212 | 208 | 208 | 202 | |
| 169 | 175 | 181 | 179 | 177 | |
| 130 | 129 | ||||
| 120 | 125 | 119 | 119 | 117 | |
| 55 | 99 | 102 | 101 | 100 | |
| 50 | 58 | 61 | 59 | 56 | |
| 45 | 51 | 64 |
| sample | ||
|---|---|---|
| CsV3Sb5 | 5.4 | 10.2 |
| RbV3Sb5 | 6.9 | 13.8 |
| KV3Sb5 | 26.7 | 28.5 |

According to the group-theoretical analysis, for the SoD or iSoD phase, all the Raman-active phonon modes are related to the V atoms in the kagome net and Sb atoms in the honeycomb net. The lattice vibration for the alkali-metal atoms (Cs, K, Rb) are forbidden. However, they become Raman-active in the structure [Appendix E]. Based on Table 4, all the phonon frequencies decrease when switching from Cs to K, except for the low-energy modes showing both and symmetries, e.g. 45 cm-1 mode in CsV3Sb5. The distinct behavior for this phonon with and symmetry indicates it does not come from the kagome net nor from the honeycomb net. Based on the fact that (1) Cs is the heaviest atom in CsV3Sb5, it should have the lowest vibration frequency; (2) the atomic mass deceases when switching from Cs to K in AV3Sb5, the vibration frequency is expected to increase, we conclude that the low-energy phonon modes at 45 cm-1 in CsV3Sb5, 51 cm-1 in RbV3Sb5, and 64 cm-1 in KV3Sb5 must be the alkali-atom-related lattice vibration modes [Appendix E]. Furthermore, these modes appear for all four scattering geometries, thus they do not obey the selection rules [Table 1 and 2], suggesting they are not bulk phonons. Moreover, the amplitude of the mode at 45 cm-1 in CsV3Sb5 shows two-fold rotational symmetry in the pump-probe Kerr rotation measurement at 20 K Wu et al. (2021), indicating a -symmetry-broken phase. This “nematiclike” -symmetry-broken phase would be characterized by the failed order parameter with () symmetry that is stabilized on the surface [Section III.4.2]. Indeed, the alkali-metal surface reconstruction, namely, the half alkali-metal surface, is most commonly observed in STM experiments Liang et al. (2021).
However, we notice several quantitative differences for the three compounds AV3Sb5 (A=Cs, Rb, K). First, the intensity of the new phonon modes are the strongest in CsV3Sb5 among the three compounds; it becomes weaker in RbV3Sb5 and becomes much weaker in KV3Sb5. We note that the amplitude of specific jump at for KV3Sb5 is also the smallest among the three systems Ortiz et al. (2019, 2020, 2021a); Yin et al. (2021). Second, the scattering rate for the main phonon modes is the smallest for CsV3Sb5 and the largest for KV3Sb5 [Table 5]. This might explain why the new phonon intensity in KV3Sb5 is weaker, as there might be more disorders or stacking faults in KV3Sb5 than the other two systems. Third, there is a broad peak centered at around 150 cm-1 for RbV3Sb5 and KV3Sb5 in both and scattering geometries Li et al. (2021); Wulferding et al. (2021), but not noticeable for CsV3Sb5.
III.5.2 Temperature dependence of main modes
After establishing the phonon modes in the three AV3Sb5 systems, we switch to study the dependence of these modes.
In Fig. 2, we present the dependence of the phonon modes in both and scattering geometries for CsV3Sb5. The main phonon at 119 cm-1 and main phonon at 137 cm-1 persist across . In contrast, all the new modes abruptly appear below . Most of the new modes first appear as relatively broad features which then sharpen upon cooling.

We fit the Raman spectra shown in Fig. 2 by multi-Lorentzian peaks on a smooth background. Examples of the fits for the Raman response in and scattering geometries at 20 K are presented in Fig. 10.
In Fig. 11, we show the dependence of the phonon frequencies, HWHM, and the integrated intensity for the main phonon at 119 cm-1 and main mode at 137 cm-1 in CsV3Sb5. For the main phonon, the frequency increases upon cooling and shows little changes across . It can be well described by the anharmonic phonon decay model [Appendix F]. The HWHM decreases upon cooling and decreases faster below . The integrated intensity increases slowly upon cooling and stays almost a constant below .
The main phonon hardens upon cooling and shows a large additional hardening below , suggesting the main phonon couples to the -symmetry CDW order parameter below . The main phonon narrows upon cooling and narrows much faster below . The HWHM of this mode starts to decrease slower at a lower temperature K. The -dependence of HWHM for this mode strongly deviates from the anharmonic phonon decay model [Appendix F], suggesting phononic self-energy effect due to the coupling to the -symmetry CDW order parameter below . The integrated intensity for the main phonon decreases a bit upon cooling and increases slightly below , which is an indication of finite electron-phonon coupling in this system Ye et al. (2019).
III.5.3 Temperature dependence of the amplitude modes
In this section, we study the dependence of the new and modes. They are both the amplitude modes of the CDW order parameter.
We first discuss the -dependence of the new amplitude modes. Since each new mode is a doublet [Section III.4.3], we fit each new mode with double-Lorentzian functions except for the 45 cm-1 mode [Fig. 10(a)].
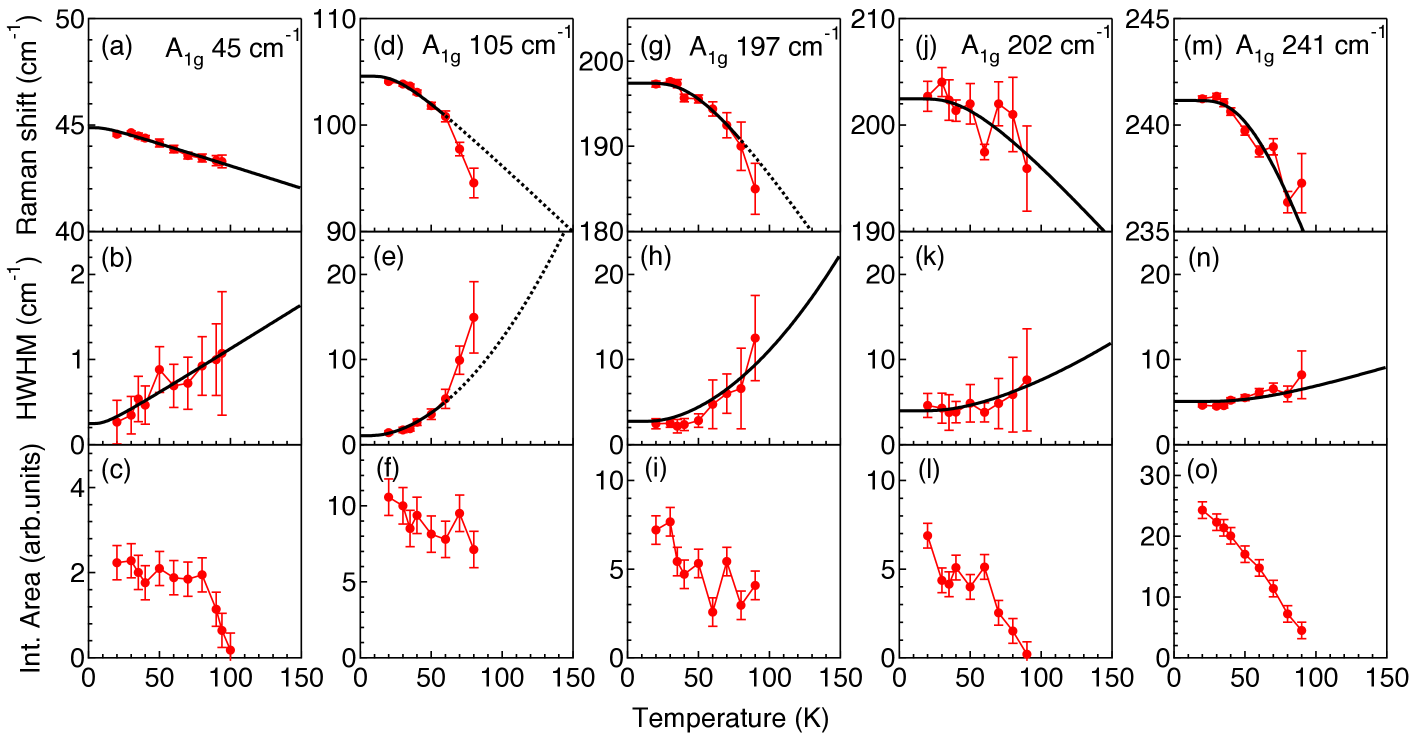
In Fig. 12, we present the selected dependence of peak frequency, HWHM, and integrated intensity for the new phonon modes. For the modes at 45, 202, and 241 cm-1 , the dependence of these peak frequency and HWHM follow the anharmonic phonon decay model well below [Appendix F]. To the contrary, the -dependence of the phonon peak frequency and HWHM for the mode at 105 cm-1 deviates from the anharmonic phonon decay model in the range K [Fig. 12(d) and (e)]. Same is found for the mode at 197 cm-1 which shows a deviation at around = K, as shown in Fig. 12(g). These anomalies are consistent with the theoretical -dependence of the amplitude modes frequencies at around 80 K [Fig. 7(d)], which is close to that is set to be 70 K in the free-energy model [Eq. 6]. These anomalies at around results from the interplay between the primary-like and secondary-like order parameters.
The integrated intensity for the new mode at 241 cm-1 increases monotonically below [Fig. 12(o)], indicating a dominant order parameter emerging below . To the contrary, the new mode at 105 cm-1 first appears as a weak and broad feature below , then becomes noticeable at around K and gradually gain intensity below [Fig. 2(b)]. The integrated intensity for this mode shows a saturation-like behavior below [Fig. 12(f)]. Similar behaviors are also found for the modes at 197 cm-1 and 202 cm-1 [Fig. 12(i) and (l)]. These results suggest that a secondary order parameter comes into play below .
The above two different behaviors for the modes’ integrated intensity –the monotonical increase and the saturation-like behavior– can be captured by the Landau free-energy model [Eq. 6] incorporating the interplay between the primary-like () and the secondary-like () order parameters via trilinear coupling . The plateau-like behavior for the mode at 105 cm-1 below can be modeled by the -dependence of in the case of where and have different signs. In this case, and interplay with each other destructively, thus shows a plateau-like behavior below [Fig. 7(e)]. The monotonic increase of the integrated intensity for the higher-energy modes at 241 cm-1 can be qualitatively described by the -dependence of the in the case of where and have the same signs. In this case, and interplay with each other constructively, thus increases monotonically below [Fig. 7(f)].
The above two different behaviors for the integrated intensities originate from the multiband nature of AV3Sb5. Recent angle-resolved photoemission measurements indeed revealed that multiple V bands cross the Fermi level Kang et al. (2022); Wang et al. (2021b); Luo et al. (2022); Wang et al. (2021a). The Landau free energy parameters, especially the trilinear coupling constant , vary for different bands. They determine whether the primary-like and secondary-like order parameters interplay constructively or destructively, thus determining the shape of the -dependence of the integrated intensity below .
We note that the appearance of the mode at 105 cm-1 below was also reported in the ultrafast coherent phonon spectroscopy measurements Ratcliff et al. (2021); Wang et al. (2021a); Wu et al. (2021). The authors of these works Ratcliff et al. (2021); Wang et al. (2021a); Wu et al. (2021) linked the temperature to the emergence of a uniaxial charge modulation observed by STM Liang et al. (2021); Zhao et al. (2021); Chen et al. (2021a), which breaks both / rotational symmetry. However, the presented here x-ray and Raman data do not support this scenario. First, both x-ray and Raman results indicate that rotational symmetry is preserved in the CDW ground state. Secondly, the Raman data shown in Fig. 2 do not show any additional sets of new phonon modes below . Third, the refined low-temperature structure shown in Fig. 6 does not contain an interlayer phase shift, ruling out the bulk CDW order Miao et al. (2021). Thus, the presented here results suggest that the uniaxial charge modulation below is not a bulk effect.
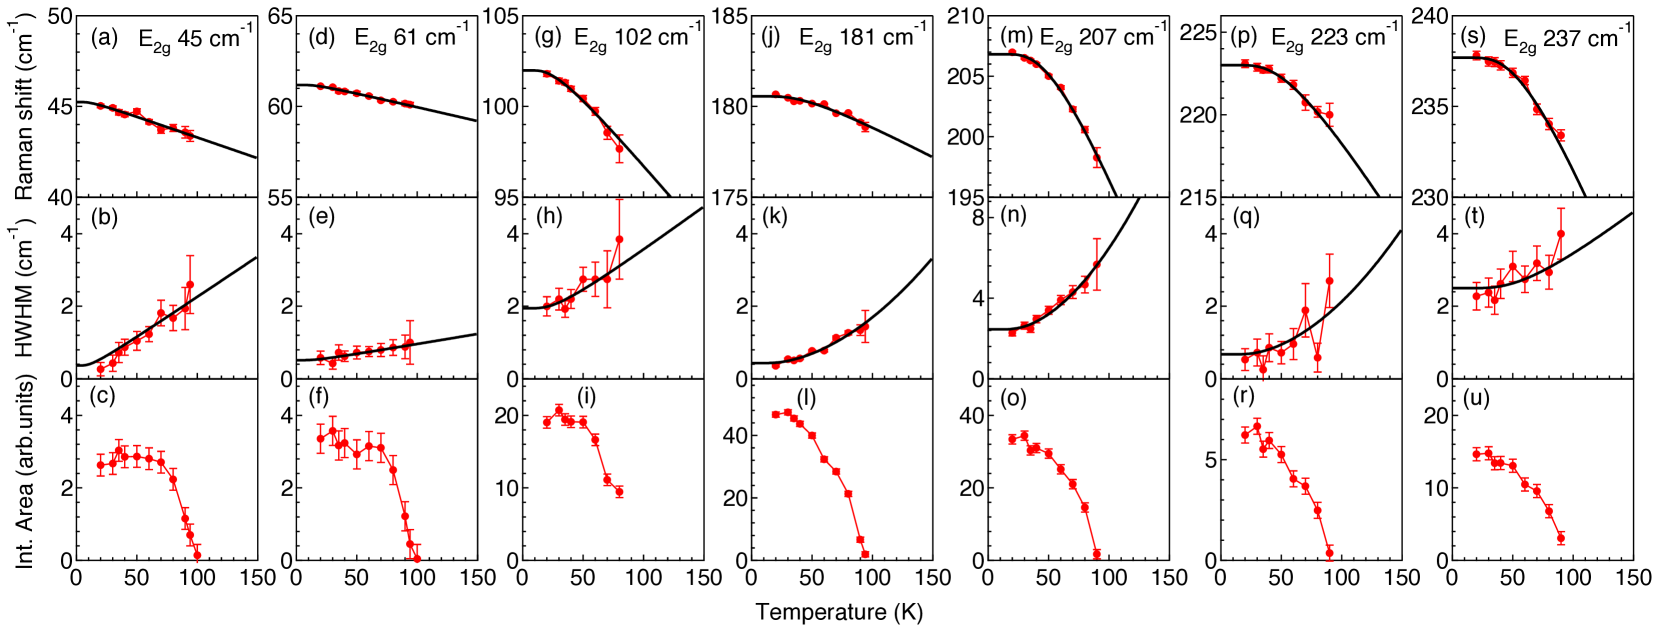
Finally, we switch to discuss the dependence of the modes, which are accessed spectroscopically by exciting the amplitude modes of the failed order parameters. In Fig. 13, we present the dependencies of the new phonon modes. In general, the dependencies of peak frequency and HWHM are smooth, showing no anomalies below . They follow the anharmonic phonon decay model well below [Appendix F]. The abrupt appearance of the new phonon modes below can be clearly seen from the dependence of the integrated intensities. They onset at and increase monotonically below , except for the low-energy mode at 61 cm-1 . The integrated intensity for this mode shows a saturationlike behavior below =70 K. These two distinct behaviors are similar to the temperature dependence of the amplitude modes shown in Fig. 12, consistent with the primary-like and secondary-like order parameters.
IV Conclusion
In summary, we study the primary and secondary order parameters associated with the CDW transition in the kagome metal AV3Sb5 system by polarization-resolved electronic Raman spectroscopy and DFT calculations.
Previous x-ray diffraction data at 15 K established that the CDW order in CsV3Sb5 is a structure with space group : one layer of iSoD structure, and three consecutive layers of SoD structure with zero-phase-shift between neighboring layers. This structure can be further refined to space group if we disregard the tiny distortions. The vanadium atoms show major displacements in the iSoD layer while they show minor displacements in the SoD layer. By quantitatively analyzing the vanadium lattice distortions, we identify that lattice distortion is the primary-like order parameter while and distortions are secondary-like order parameters. This is also confirmed by the calculation of bare static susceptibility that shows a broad peak at around along the hexagonal Brillouin zone face central line ( line).
The primary and secondary order parameters are revealed by Raman scattering. We identify several and phonon modes related to V and Sb atoms as well as alkali-metal atoms emerging in the CDW state. The symmetry decompositions analysis for these V-and-Sb-atoms-related modes indicates the symmetry is preserved in the CDW phase. To the contrary, the low-energy alkali-metal-atom-related lattice vibration modes do not obey the point group selection rules. These alkali phonon modes indicates a “nematiclike” -symmetry-broken phase characterized by the “failed order parameter” with () symmetry that is stabilized on the surface.
The observed number of Raman-active phonon modes in the CDW state indicates that the inversion symmetry remains intact. By comparing the DFT phonon calculations and the observed new phonon frequencies, we find that the structure hosts a dominant iSoD-type lattice distortion, consistent with the x-ray refinement results.
The detailed temperature evolution of these new modes’ peak frequency, HWHM, and integrated intensity support two successive phase transitions in CsV3Sb5: the first one associated with the primary-like order parameter appearing at K and the second isostructural one appearing at K. Moreover, the -dependence of the integrated intensity for these modes show two type of behavior below : a plateau-like behavior below and monotonically increase below . These two behaviors are captured by a Landau free-energy model incorporating the interplay between the primary-like and the secondary-like order parameters via trilinear coupling. Especially, the sign of the trilinear term determines whether the primary-like and secondary-like order parameters cooperate or compete with each other, thus determining the shape of the dependence of the Raman data below .
These results establish a solid foundation to study the interplay between the primary and secondary CDW order parameters in the kagome metal system. They guide to identify the primary and secondary order parameters as well as their interplay, when these CDW order parameters are tuned by carrier doping Oey et al. (2021); Liu et al. (2021a); Song et al. (2021a), external pressure Yu et al. (2021a); Chen et al. (2021b), or strain Qian et al. (2021).
Note added in proof. Recently, G. Liu . have posted Raman data for CsV3Sb5 which is consistent with the data reported here Liu et al. (2021b). In contrast, polarization-insensitive broad feature at about 150 cm-1 with anomalous temperature dependence reported and studied by H. Li . Li et al. (2021), or by D. Wulferding . Wulferding et al. (2021) is inconsistent with presented here data, thus must be of an external origin.
Acknowledgements.
The spectroscopic work conducted at Rutgers (S.-F.W. and G.B.) was supported by NSF Grants No. DMR-1709161 and No. DMR-2105001. The sample growth and characterization work conducted at UC Santa Barbara (B.R.O. and S.D.W.) was supported by the UC Santa Barbara NSF Quantum Foundry funded via the Q-AMASE-i program under Award No. DMR-1906325. B.R.O. also acknowledges support from the California NanoSystems Institute through the Elings fellowship program. The DFT phonon and bare susceptibility calculations work conducted at Weizmann Institute of Science (H.X.T. and B.H.Y.) was supported by the European Research Council (ERC Consolidator Grant “NonlinearTopo”, No. 815869), the ISF-Quantum Science and Technology (No. 1251/19). The theoretical work conducted at the University of Minnesota (T.B.) was supported by the NSF CAREER Grant No. DMR-2046020. The work at NICPB was supported by the European Research Council (ERC) under the European Union’s Horizon 2020 research and innovation programme grant agreement No. 885413.Appendix A Laser heating determination
The laser heating rate, a measure of the temperature increase per unit laser power (K/mW) in the focused laser spot, in the Raman experiments was determined by monitoring the appearance of new phonon modes induced by the CDW order during the cooling process with a constant laser power 10 mW.
At the cryostat temperature 90 K, we barely detect any new phonon modes, indicating the laser spot temperature is above =94 K. When cooling the sample to 85 K, we start to detect several weak new phonon signals both in the and scattering geometries, indicating the laser spot temperature is slightly below 94 K. When cooling the sample to 80 K, the intensity of these new modes develop significantly, indicating the laser spot temperature is well below 94 K. Thus, the heating coefficient can be determined via: . In this way, we have deduced the heating coefficient: K/mW.
Appendix B Removal of polarization leakage
In this appendix, we provide the detailed procedure to remove the polarization leakage signal from optical elements in our data analysis.
In our polarization optics setup, we used a Glan-Taylor polarizing prism (Melles Griot) with an extinction ratio better than to clean the laser excitation beam and a broad-band 50 mm polarizing cube (Karl Lambrecht Corporation) with an extinction ratio better than 1:500 to analyze the scattered light. For the linearly polarized and scatting geometries, the leakage intensity ratio is negligibly small (less than 0.2 %), thus the leakage intensity from the linearly polarized scattering geometries is not considered.
For measurements with circularly polarized light, we employed a Berek compensator (New Focus) to convert the incoming linearly polarized light into circularly polarized light for excitation. We used a broad-band 50-mm-diameter quarter wave retarder (Melles Griot) with a retardance tolerance before the polarizing cube to convert the out-coming circularly polarized light into linearly polarized light for the analyzer. The leakage of circular polarized light is due to the limitations of the broadband quarter wave plate and alignment of the Berek compensator.
The amount of phonon leakage intensity is determined based on the and bulk phonons of CsV3Sb5 at the same temperature in and scattering geometries. To remove the polarization leakage intensity, we subtract intensity from the orthogonal polarization geometry, i.e., , where and are the raw data taken in and polarization scattering geometries at temperature , respectively, and is a small number representing the leakage ratio. It is expected that the same ratio also applies to polarization scattering geometry as well: .
In Fig. 14, we show the Raman spectra of the unprocessed raw data and polarization-leakage-removed spectra taken at 60 K from the surface of CsV3Sb5 crystals in and scattering geometries, respectively. The leakage intensity of the bulk phonons at 119 and 181 cm-1 in the raw data taken with scattering geometries can be fully removed with a leakage ratio close to .

Appendix C Raman tensor analysis
The Raman tensor is a matrix for an irreducible representation () of a point group. It can be used to estimate the phonon intensity in a Raman experiment. With incident and scattering light polarization unit vector respectively defined as and , the phononic Raman response is described as Hayes and Loudon (1978):
| (8) |
The Raman tensors () for the irreducible representations () of point group have the following forms:
We choose and to be , , , and , where , , , and .
Based on Eq. (8), we obtain:
| (9) |
Thus, the Raman selection rules for the point group indicate that the , , , and polarization geometries probe the , , , 2 symmetry excitations, respectively [Table 1].
The sum rule that + = + = set a constraint for the Raman response in different scattering geometries, thus providing a unique way to check the data consistency.
From Eq. (9), we can calculate the square of the Raman tensor element:
| (10) |
Therefore, the algebra in Eq. (10) can be used to decompose the measured Raman signal into three separate irreducible representations (, , ) of point group [Table 2].
This decomposition algebra is a characteristic property of a lattice system with trigonal or hexagonal symmetries, where the three-fold rotational symmetry is preserved 333Whether six-fold rotational symmetry is preserved or not depends on the system.
Appendix D Phonon instability calculation

In Fig. 15, we show DFT calculation of the phonon frequencies in the whole Brillouin zone for the high-temperature phase of CsV3Sb5. The lowest phonon branch shows a broad imaginary response along the whole line [-- line], as well as the and lines. Therefore, the DFT calculation does not provide a unique identification of the lattice instability vector.
Appendix E Group-theoretical analysis
In this appendix, we focus on the folded phonon modes in the BZ center which originate from BZ boundary due to the CDW ordering.
Extending the high-temperature supercell to the supercell, we have two types of CDW order driven by V displacements in the kagome layer: SoD and iSoD structure. These two superlattices share the same space group of as the high-temperature phase, displaying an in-plane modulation of the high-temperature structure. From the group-theoretical considerations Kroumova et al. (2003), -point phonon modes of the supercell can be expressed as = 5 + + 3 + 9 + 4 + 5 + 2 + 7 + 8+ 8 + 14 + 6. Raman active modes = 5 + 8 + 6, IR active modes are =8 + 13, the acoustic mode = + and the silent modes are = 3 + 4 + 2 + + 5 + 7 + 8. Note that alkali atoms (K, Rb, Cs) do not involve any Raman-active vibration in the SoD and iSoD phase, as well as in the high-temperature phase.
Extending the supercell to the three-dimensional supercell, we have a structure composed of one layer of the iSoD structures and three consecutive layers of SoD structure, with zero-phase-shift between neighboring layers [Fig. 6]. It has the same space group as the high-temperature phase. From the group-theoretical considerations, -point phonon modes of this superstructure can be expressed as = 26 + 6 + 10 + 30 + 20 + 16 + 12 + 24 + 31 + 33 + 45 + 35, where Raman active modes = 26 + 33 + 35, IR active modes are = 29 + 44, the acoustic mode = + and the silent modes are = 6 + 10 + 20 + 16 + 12 + 24 + 31. Note that the alkali-metal atoms (Cs, Rb, K) lattice vibrations become Raman-active in the superstructure.
Appendix F Anharmonic phonon decay model
In this appendix, we discuss the anharmonic phonon decay model. We fit the temperature dependence of the phonon frequency and HWHM by anharmonic phonon decay model Klemens (1966); Menéndez and Cardona (1984):
| (11) |
| (12) |
| (13) |
| (14) |
where , is the Bose-Einstein distribution function. and involves mainly three-phonon decay process where an optical phonon decays into two acoustic modes with equal energy and opposite momentum. and involves additional four-phonon decay processes compared with and .
References
- Syôzi (1951) Itiro Syôzi, “Statistics of Kagome Lattice,” Progress of Theoretical Physics 6, 306–308 (1951).
- Broholm et al. (2020) C. Broholm, R. J. Cava, S. A. Kivelson, D. G. Nocera, M. R. Norman, and T. Senthil, “Quantum spin liquids,” Science 367, eaay0668 (2020).
- Wang et al. (2013) Wan-Sheng Wang, Zheng-Zhao Li, Yuan-Yuan Xiang, and Qiang-Hua Wang, “Competing electronic orders on Kagome lattices at van Hove filling,” Phys. Rev. B 87, 115135 (2013).
- Kiesel et al. (2013) Maximilian L. Kiesel, Christian Platt, and Ronny Thomale, “Unconventional Fermi surface instabilities in the Kagome Hubbard model,” Phys. Rev. Lett. 110, 126405 (2013).
- Feng et al. (2021a) Xilin Feng, Kun Jiang, Ziqiang Wang, and Jiangping Hu, “Chiral flux phase in the Kagome superconductor AV3Sb5,” Science Bulletin 66, 1384–1388 (2021a).
- Denner et al. (2021) M. Michael Denner, Ronny Thomale, and Titus Neupert, “Analysis of charge order in the kagome metal (),” Phys. Rev. Lett. 127, 217601 (2021).
- Lin and Nandkishore (2021) Yu-Ping Lin and Rahul M. Nandkishore, “Complex charge density waves at Van Hove singularity on hexagonal lattices: Haldane-model phase diagram and potential realization in the kagome metals (=K, Rb, Cs),” Phys. Rev. B 104, 045122 (2021).
- Park et al. (2021) Takamori Park, Mengxing Ye, and Leon Balents, “Electronic instabilities of kagome metals: saddle points and Landau theory,” Phys. Rev. B 104, 035142 (2021).
- Setty et al. (2021) Chandan Setty, Haoyu Hu, Lei Chen, and Qimiao Si, “Electron correlations and T-breaking density wave order in a Kagome metal ,” arXiv:2105.15204 (2021).
- Feng et al. (2021b) Xilin Feng, Yi Zhang, Kun Jiang, and Jiangping Hu, “Low-energy effective theory and symmetry classification of flux phases on the kagome lattice,” Phys. Rev. B 104, 165136 (2021b).
- Christensen et al. (2021) Morten H. Christensen, Turan Birol, Brian M. Andersen, and Rafael M. Fernandes, “Theory of the charge density wave in kagome metals,” Phys. Rev. B 104, 214513 (2021).
- Tazai et al. (2021) Rina Tazai, Youichi Yamakawa, Seiichiro Onari, and Hiroshi Kontani, “Mechanism of exotic density-wave and beyond-Migdal unconventional superconductivity in kagome metal AV3Sb5 (A=K, Rb, Cs),” arXiv:2107.05372 (2021).
- Jiang et al. (2021a) Kun Jiang, Tao Wu, Jia-Xin Yin, Zhenyu Wang, M. Zahid Hasan, Stephen D. Wilson, Xianhui Chen, and Jiangping Hu, “Kagome superconductors AV3Sb5 (A=K, Rb, Cs),” arXiv:2109.10809 (2021a).
- Xie et al. (2021) Yaofeng Xie, Yongkai Li, Philippe Bourges, Alexandre Ivanov, Zijin Ye, Jia-Xin Yin, M. Zahid Hasan, Aiyun Luo, Yugui Yao, Zhiwei Wang, Gang Xu, and Pengcheng Dai, “Electron-phonon coupling in the charge density wave state of CsV3Sb5,” arXiv:2111.00654 (2021).
- Chen et al. (2021a) Hui Chen, Haitao Yang, Bin Hu, Zhen Zhao, Jie Yuan, Yuqing Xing, Guojian Qian, Zihao Huang, Geng Li, Yuhan Ye, Sheng Ma, Shunli Ni, Hua Zhang, Qiangwei Yin, Chunsheng Gong, Zhijun Tu, Hechang Lei, Hengxin Tan, Sen Zhou, Chengmin Shen, Xiaoli Dong, Binghai Yan, Ziqiang Wang, and Hong-Jun Gao, “Roton pair density wave in a strong-coupling kagome superconductor,” Nature 599, 222–228 (2021a).
- Liang et al. (2021) Zuowei Liang, Xingyuan Hou, Fan Zhang, Wanru Ma, Ping Wu, Zongyuan Zhang, Fanghang Yu, J.-J. Ying, Kun Jiang, Lei Shan, Zhenyu Wang, and X.-H. Chen, “Three-dimensional charge density wave and surface-dependent vortex-core states in a kagome superconductor ,” Phys. Rev. X 11, 031026 (2021).
- Ortiz et al. (2019) Brenden R. Ortiz, Lídia C. Gomes, Jennifer R. Morey, Michal Winiarski, Mitchell Bordelon, John S. Mangum, Iain W. H. Oswald, Jose A. Rodriguez-Rivera, James R. Neilson, Stephen D. Wilson, Elif Ertekin, Tyrel M. McQueen, and Eric S. Toberer, “New Kagome prototype materials: discovery of , and ,” Phys. Rev. Materials 3, 094407 (2019).
- Ortiz et al. (2020) Brenden R. Ortiz, Samuel M. L. Teicher, Yong Hu, Julia L. Zuo, Paul M. Sarte, Emily C. Schueller, A. M. Milinda Abeykoon, Matthew J. Krogstad, Stephan Rosenkranz, Raymond Osborn, Ram Seshadri, Leon Balents, Junfeng He, and Stephen D. Wilson, “: a topological kagome metal with a superconducting ground state,” Phys. Rev. Lett. 125, 247002 (2020).
- Ortiz et al. (2021a) Brenden R. Ortiz, Paul M. Sarte, Eric M. Kenney, Michael J. Graf, Samuel M. L. Teicher, Ram Seshadri, and Stephen D. Wilson, “Superconductivity in the Kagome metal ,” Phys. Rev. Materials 5, 034801 (2021a).
- Jiang et al. (2021b) Yu-Xiao Jiang, Jia-Xin Yin, M. Michael Denner, Nana Shumiya, Brenden R. Ortiz, Gang Xu, Zurab Guguchia, Junyi He, Md Shafayat Hossain, Xiaoxiong Liu, Jacob Ruff, Linus Kautzsch, Songtian S. Zhang, Guoqing Chang, Ilya Belopolski, Qi Zhang, Tyler A. Cochran, Daniel Multer, Maksim Litskevich, Zi-Jia Cheng, Xian P. Yang, Ziqiang Wang, Ronny Thomale, Titus Neupert, Stephen D. Wilson, and M. Zahid Hasan, “Unconventional chiral charge order in kagome superconductor kv3sb5,” Nature Materials 20, 1353–1357 (2021b).
- Tan et al. (2021) Hengxin Tan, Yizhou Liu, Ziqiang Wang, and Binghai Yan, “Charge density waves and electronic properties of superconducting kagome metals,” Phys. Rev. Lett. 127, 046401 (2021).
- Zhao et al. (2021) He Zhao, Hong Li, Brenden R. Ortiz, Samuel M. L. Teicher, Takamori Park, Mengxing Ye, Ziqiang Wang, Leon Balents, Stephen D. Wilson, and Ilija Zeljkovic, “Cascade of correlated electron states in the kagome superconductor ,” Nature 599, 216–221 (2021).
- Li et al. (2021) Haoxiang Li, T. T. Zhang, T. Yilmaz, Y. Y. Pai, C. E. Marvinney, A. Said, Q. W. Yin, C. S. Gong, Z. J. Tu, E. Vescovo, C. S. Nelson, R. G. Moore, S. Murakami, H. C. Lei, H. N. Lee, B. J. Lawrie, and H. Miao, “Observation of unconventional charge density wave without acoustic phonon anomaly in Kagome superconductors (, Cs),” Phys. Rev. X 11, 031050 (2021).
- Chen et al. (2021b) K. Y. Chen, N. N. Wang, Q. W. Yin, Y. H. Gu, K. Jiang, Z. J. Tu, C. S. Gong, Y. Uwatoko, J. P. Sun, H. C. Lei, J. P. Hu, and J.-G. Cheng, “Double superconducting dome and triple enhancement of in the Kagome superconductor under high pressure,” Phys. Rev. Lett. 126, 247001 (2021b).
- Yu et al. (2021a) F. H. Yu, D. H. Ma, W. Z. Zhuo, S. Q. Liu, X. K. Wen, B. Lei, J. J. Ying, and X. H. Chen, “Unusual competition of superconductivity and charge-density-wave state in a compressed topological kagome metal,” Nat. Commun. 12, 3645 (2021a).
- Oey et al. (2021) Yuzki M. Oey, Brenden R. Ortiz, Farnaz Kaboudvand, Jonathan Frassineti, Erick Garcia, Samuele Sanna, Vesna Mitrović, Ram Seshadri, and Stephen D. Wilson, “Fermi level tuning and double-dome superconductivity in the kagome metals CsV3Sb5-xSn,” arXiv:2110.10912 (2021).
- Liu et al. (2021a) Yixuan Liu, Yuan Wang, Yongqing Cai, Zhanyang Hao, Xiao-Ming Ma, Le Wang, Cai Liu, Jian Chen, Liang Zhou, Jinhua Wang, Shanming Wang, Hongtao He, Yi Liu, Shengtao Cui, Jianfeng Wang, Bing Huang, Chaoyu Chen, and Jia-Wei Mei, “Doping evolution of superconductivity, charge order and band topology in hole-doped topological kagome superconductors Cs(V1-xTix)3Sb5,” arXiv:2110.12651 (2021a).
- Song et al. (2021a) Yanpeng Song, Tianping Ying, Xu Chen, Xu Han, Xianxin Wu, Andreas P. Schnyder, Yuan Huang, Jian-gang Guo, and Xiaolong Chen, “Competition of superconductivity and charge density wave in selective oxidized thin flakes,” Phys. Rev. Lett. 127, 237001 (2021a).
- Song et al. (2021b) B. Q. Song, X. M. Kong, W. Xia, Q. W. Yin, C. P. Tu, C. C. Zhao, D. Z. Dai, K. Meng, Z. C. Tao, Z. J. Tu, C. S. Gong, H. C. Lei, Y. F. Guo, X. F. Yang, and S. Y. Li, “Competing superconductivity and charge-density wave in kagome metal CsV3Sb5: evidence from their evolutions with sample thickness,” arXiv:2105.09248 (2021b).
- Yang et al. (2020) Shuo-Ying Yang, Yaojia Wang, Brenden R. Ortiz, Defa Liu, Jacob Gayles, Elena Derunova, Rafael Gonzalez-Hernandez, Libor Šmejkal, Yulin Chen, Stuart S. P. Parkin, Stephen D. Wilson, Eric S. Toberer, Tyrel McQueen, and Mazhar N. Ali, “Giant, unconventional anomalous Hall effect in the metallic frustrated magnet candidate, KV3Sb5,” Sci. Adv. 6, eabb6003 (2020).
- Yu et al. (2021b) F. H. Yu, T. Wu, Z. Y. Wang, B. Lei, W. Z. Zhuo, J. J. Ying, and X. H. Chen, “Concurrence of anomalous hall effect and charge density wave in a superconducting topological kagome metal,” Phys. Rev. B 104, L041103 (2021b).
- Kenney et al. (2021) Eric M Kenney, Brenden R Ortiz, Chennan Wang, Stephen D Wilson, and Michael J Graf, “Absence of local moments in the kagome metal KV3Sb5 as determined by muon spin spectroscopy,” J. Phys. Condens. Matter 33, 235801 (2021).
- Mielke et al. (2022) C. Mielke, D. Das, J.-X. Yin, H. Liu, R. Gupta, Y.-X. Jiang, M. Medarde, X. Wu, H. C. Lei, J. Chang, Pengcheng Dai, Q. Si, H. Miao, R. Thomale, T. Neupert, Y. Shi, R. Khasanov, M. Z. Hasan, H. Luetkens, and Z. Guguchia, “Time-reversal symmetry-breaking charge order in a kagome superconductor,” Nature 602, 245–250 (2022).
- Yu et al. (2021c) Li Yu, Chennan Wang, Yuhang Zhang, Mathias Sander, Shunli Ni, Zouyouwei Lu, Sheng Ma, Zhengguo Wang, Zhen Zhao, Hui Chen, Kun Jiang, Yan Zhang, Haitao Yang, Fang Zhou, Xiaoli Dong, Steven L. Johnson, Michael J. Graf, Jiangping Hu, Hong-Jun Gao, and Zhongxian Zhao, “Evidence of a hidden flux phase in the topological kagome metal CsV3Sb5,” arXiv:2107.10714 (2021c).
- Luo et al. (2022) Hailan Luo, Qiang Gao, Hongxiong Liu, Yuhao Gu, Dingsong Wu, Changjiang Yi, Junjie Jia, Shilong Wu, Xiangyu Luo, Yu Xu, Lin Zhao, Qingyan Wang, Hanqing Mao, Guodong Liu, Zhihai Zhu, Youguo Shi, Kun Jiang, Jiangping Hu, Zuyan Xu, and X. J. Zhou, “Electronic nature of charge density wave and electron-phonon coupling in kagome superconductor KV3Sb5,” Nature Communications 13, 273 (2022).
- Ortiz et al. (2021b) Brenden R. Ortiz, Samuel M. L. Teicher, Linus Kautzsch, Paul M. Sarte, Noah Ratcliff, John Harter, Jacob P. C. Ruff, Ram Seshadri, and Stephen D. Wilson, “Fermi Surface Mapping and the Nature of Charge-Density-Wave Order in the Kagome Superconductor ,” Phys. Rev. X 11, 041030 (2021b).
- Ratcliff et al. (2021) Noah Ratcliff, Lily Hallett, Brenden R. Ortiz, Stephen D. Wilson, and John W. Harter, “Coherent phonon spectroscopy and interlayer modulation of charge density wave order in the kagome metal ,” Phys. Rev. Materials 5, L111801 (2021).
- Wang et al. (2021a) Z. X. Wang, Q. Wu, Q. W. Yin, C. S. Gong, Z. J. Tu, T. Lin, Q. M. Liu, L. Y. Shi, S. J. Zhang, D. Wu, H. C. Lei, T. Dong, and N. L. Wang, “Unconventional charge density wave and photoinduced lattice symmetry change in the kagome metal probed by time-resolved spectroscopy,” Phys. Rev. B 104, 165110 (2021a).
- Wu et al. (2021) Qiong Wu, Z. X. Wang, Q. M. Liu, R. S. Li, S. X. Xu, Q. W. Yin, C. S. Gong, Z. J. Tu, H. C. Lei, T. Dong, and N. L. Wang, “The large static and pump-probe Kerr effect with two-fold rotation symmetry in Kagome metal CsV3Sb5,” arXiv:2110.11306 (2021).
- Ni et al. (2021) Shunli Ni, Sheng Ma, Yuhang Zhang, Jie Yuan, Haitao Yang, Zouyouwei Lu, Ningning Wang, Jianping Sun, Zhen Zhao, Dong Li, Shaobo Liu, Hua Zhang, Hui Chen, Kui Jin, Jinguang Cheng, Li Yu, Fang Zhou, Xiaoli Dong, Jiangping Hu, Hong-Jun Gao, and Zhongxian Zhao, “Anisotropic superconducting properties of Kagome metal CsV3Sb5,” Chinese Physics Letters 38, 057403 (2021).
- Xiang et al. (2021) Ying Xiang, Qing Li, Yongkai Li, Wei Xie, Huan Yang, Zhiwei Wang, Yugui Yao, and Hai-Hu Wen, “Twofold symmetry of -axis resistivity in topological kagome superconductor CsV3Sb5 with in-plane rotating magnetic field,” Nat. Commun 12, 6727 (2021).
- Perdew et al. (1996) John P. Perdew, Kieron Burke, and Matthias Ernzerhof, “Generalized gradient approximation made simple,” Phys. Rev. Lett. 77, 3865–3868 (1996).
- Kresse and Furthmüller (1996) G. Kresse and J. Furthmüller, “Efficient iterative schemes for ab initio total-energy calculations using a plane-wave basis set,” Phys. Rev. B 54, 11169–11186 (1996).
- Kresse and Furthmüller (1996) G. Kresse and J. Furthmüller, “Efficiency of ab-initio total energy calculations for metals and semiconductors using a plane-wave basis set,” Computational Materials Science 6, 15–50 (1996).
- Togo and Tanaka (2015) Atsushi Togo and Isao Tanaka, “First principles phonon calculations in materials science,” Scripta Materialia 108, 1–5 (2015).
- Johannes and Mazin (2008) M. D. Johannes and I. I. Mazin, “Fermi surface nesting and the origin of charge density waves in metals,” Phys. Rev. B 77, 165135 (2008).
- Mostofi et al. (2008) Arash A. Mostofi, Jonathan R. Yates, Young-Su Lee, Ivo Souza, David Vanderbilt, and Nicola Marzari, “wannier90: A tool for obtaining maximally-localised Wannier functions,” Computer Physics Communications 178, 685–699 (2008).
- Campbell et al. (2006) Branton J. Campbell, Harold T. Stokes, David E. Tanner, and Dorian M. Hatch, “ISODISPLACE: a web-based tool for exploring structural distortions,” Journal of Applied Crystallography 39, 607–614 (2006).
- Cracknell et al. (1979) A. P. Cracknell, B. L. Davies, S. C. Miller, and W. F. Love, “Kronecker Product Tables. Vol. 1. General introduction and Tables of irreducible representations of space groups,” (IFI/Plenum, New York, 1979).
- Aroyo et al. (2011) M. I. Aroyo, J. M. Perez-Mato, D. Orobengoa, E. Tasci, G. De La Flor, and A. Kirov, “Crystallography online: Bilbao crystallographic server,” Bulg. Chem. Commun 43, 183–97 (2011).
- Aroyo et al. (2006) Mois I. Aroyo, Asen Kirov, Cesar Capillas, J. M. Perez-Mato, and Hans Wondratschek, “Bilbao crystallographic server. ii. representations of crystallographic point groups and space groups,” Acta Crystallogr., Sect A: Found. Crystallogr. 62, 115–128 (2006).
- Wang et al. (2022) Chongze Wang, Shuyuan Liu, Hyunsoo Jeon, and Jun-Hyung Cho, “Origin of charge density wave in the layered kagome metal ,” Phys. Rev. B 105, 045135 (2022).
- Johannes et al. (2006) M. D. Johannes, I. I. Mazin, and C. A. Howells, “Fermi-surface nesting and the origin of the charge-density wave in ,” Phys. Rev. B 73, 205102 (2006).
- Note (1) The reason that we do not regard the distortion as the primary order parameter is due to the trilinear coupling between , , and order parameters. This coupling leads to a simultaneous condensation of multiple order parameters at a temperature where all the second-order coefficients in the free-energy expansion become positive Christensen et al. (2021); Etxebarria et al. (2010). This is referred to as an “avalanche-transition”. Since the avalanche transition is a first-order transition, it is impossible to separate the primary and secondary order parameters as in an ordinary first-order phase transition. Hence, we refer to the order parameters only as primarylike and secondarylike.
- Holy et al. (1976) John A. Holy, Miles V. Klein, W. L. McMillan, and S. F. Meyer, “Raman-active lattice vibrations of the commensurate superlattic in ,” Phys. Rev. Lett. 37, 1145–1148 (1976).
- Nagaosa and Hanamura (1982) N. Nagaosa and E. Hanamura, “Microscopic theory on the Raman spectra of transition metal dichalcogenides in CDW state,” Solid State Commun. 41, 809–813 (1982).
- Nie et al. (2022) Linpeng Nie, Kuanglv Sun, Wanru Ma, Dianwu Song, Lixuan Zheng, Zuowei Liang, Ping Wu, Fanghang Yu, Jian Li, Min Shan, Dan Zhao, Shunjiao Li, Baolei Kang, Zhimian Wu, Yanbing Zhou, Kai Liu, Ziji Xiang, Jianjun Ying, Zhenyu Wang, Tao Wu, and Xianhui Chen, “Charge-density-wave-driven electronic nematicity in a kagome superconductor,” Nature (2022), 10.1038/s41586-022-04493-8.
- Note (2) In Eq. (7), has the unit of the mass in analog of a two-dimensional harmonic oscillator.
- Devereaux and Hackl (2007) T. P. Devereaux and R. Hackl, “Inelastic light scattering from correlated electrons,” Rev. Mod. Phys. 79, 175–233 (2007).
- Klein (1982) M. V. Klein, “Theory of raman scattering from charge-density-wave phonons,” Phys. Rev. B 25, 7192–7208 (1982).
- Kang et al. (2022) Mingu Kang, Shiang Fang, Jeong-Kyu Kim, Brenden R. Ortiz, Sae Hee Ryu, Jimin Kim, Jonggyu Yoo, Giorgio Sangiovanni, Domenico Di Sante, Byeong-Gyu Park, Chris Jozwiak, Aaron Bostwick, Eli Rotenberg, Efthimios Kaxiras, Stephen D. Wilson, Jae-Hoon Park, and Riccardo Comin, “Twofold van Hove singularity and origin of charge order in topological kagome superconductor CsV3Sb5,” Nature Physics 18, 301–308 (2022).
- Wang et al. (2021b) Zhengguo Wang, Sheng Ma, Yuhang Zhang, Haitao Yang, Zhen Zhao, Yi Ou, Yu Zhu, Shunli Ni, Zouyouwei Lu, Hui Chen, Kun Jiang, Li Yu, Yan Zhang, Xiaoli Dong, Jiangping Hu, Hong-Jun Gao, and Zhongxian Zhao, “Distinctive momentum dependent charge-density-wave gap observed in CsV3Sb5 superconductor with topological Kagome lattice ,” arXiv:2104.05556 (2021b).
- Yin et al. (2021) Qiangwei Yin, Zhijun Tu, Chunsheng Gong, Yang Fu, Shaohua Yan, and Hechang Lei, “Superconductivity and normal-state properties of Kagome metal RbV3Sb5 single crystals,” Chin. Phys. Lett. 38, 037403 (2021).
- Wulferding et al. (2021) Dirk Wulferding, Seungyeol Lee, Youngsu Choi, Qiangwei Yin, Zhijun Tu, Chunsheng Gong, Hechang Lei, and Kwang-Yong Choi, “Fermi surface instabilities in electronic Raman scattering of the metallic kagome lattice CsV3Sb5,” arXiv:2108.11690 (2021).
- Ye et al. (2019) Mai Ye, E. W. Rosenberg, I. R. Fisher, and G. Blumberg, “Lattice dynamics, crystal-field excitations, and quadrupolar fluctuations of ,” Phys. Rev. B 99, 235104 (2019).
- Miao et al. (2021) H. Miao, H. X. Li, W. R. Meier, A. Huon, H. N. Lee, A. Said, H. C. Lei, B. R. Ortiz, S. D. Wilson, J. X. Yin, M. Z. Hasan, Ziqiang Wang, Hengxin Tan, and Binghai Yan, “Geometry of the charge density wave in the kagome metal ,” Phys. Rev. B 104, 195132 (2021).
- Qian et al. (2021) Tiema Qian, Morten H. Christensen, Chaowei Hu, Amartyajyoti Saha, Brian M. Andersen, Rafael M. Fernandes, Turan Birol, and Ni Ni, “Revealing the competition between charge density wave and superconductivity in through uniaxial strain,” Phys. Rev. B 104, 144506 (2021).
- Liu et al. (2021b) Gan Liu, Xinran Ma, Kuanyu He, Qing Li, Hengxin Tan, Yizhou Liu, Jie Xu, Wenna Tang, Kenji Watanabe, Takashi Taniguchi, Libo Gao, Yaomin Dai, Hai-Hu Wen, Binghai Yan, and Xiaoxiang Xi, “Observation of anomalous amplitude modes in the kagome metal ,” arXiv:2201.05330 (2021b).
- Hayes and Loudon (1978) W. Hayes and R. Loudon, “Scattering of light by crystals,” (Dover Publications, Inc, 1978).
- Note (3) Whether six-fold rotational symmetry is preserved or not depends on the system.
- Kroumova et al. (2003) E. Kroumova, M. I. Aroyo, J. M. Perez-Mato, A. Kirov, C. Capillas, S. Ivantchev, and H. Wondratschek, “Bilbao crystallographic server: Useful databases and tools for phase-transition studies,” Phase Transit. 76, 155–170 (2003).
- Klemens (1966) P. G. Klemens, “Anharmonic decay of optical phonons,” Phys. Rev. 148, 845–848 (1966).
- Menéndez and Cardona (1984) José Menéndez and Manuel Cardona, “Temperature dependence of the first-order raman scattering by phonons in si, ge, and : Anharmonic effects,” Phys. Rev. B 29, 2051–2059 (1984).
- Etxebarria et al. (2010) I. Etxebarria, J. M. Perez-Mato, and P. Boullay, “The role of trilinear couplings in the phase transitions of aurivillius compounds,” Ferroelectrics 401, 17–23 (2010).