Insights into the evolution of five isolated galaxies
Abstract
The galaxy evolution is believed to be conditioned by the environment. Isolated galaxies or galaxies in poor groups are an excellent laboratory to study evolutionary mechanisms where effects of the environment are minimal. We present new Swift-UVOT data in six filters, three in the ultraviolet (UV), of five isolated galaxies aiming at shedding light into their evolution. For all of our targets we present new UV integrated fluxes and for some of them also new UBV magnitudes. Our observations allow us to improve their multi-wavelength spectral energy distributions extending it over about 3 orders of magnitude in wavelength. We exploit our smooth-particle hydro-dynamical simulations with chemo-photometric implementation anchored, a posteriori, to the global multi-wavelength properties of our targets, to give insight into their evolution. Then we compare their evolutionary properties with those previously derived for several galaxies in groups. The evolution of our targets is driven by a merger occurred several Gyrs ago, in the redshift range , not unlike what we have already found for galaxies in groups. The merger shapes the potential well where the gas is accreting driving the star formation rate and the galaxy evolution. Isolated galaxies should not have suffered from interactions for at least 3 Gyr. However, the initial merger is still leaving its signatures on the properties of our targets. Several rejuvenation episodes, triggered by in situ accretion, are highlighted. Moreover, jelly-fish morphologies appear as these galaxies achieve their maximum star formation rate, before their quenching phase.
Subject headings:
Galaxies: elliptical and lenticular, cD —- Ultraviolet: galaxies – galaxies: evolution — galaxies: individual: CIG 189, CIG 309, CIG 389, CIG 481, CIG 6371. Introduction
The research on isolated galaxies started in 1970’s from the investigation of the Palomar Observatory Sky Survey (POSS) plates (see e.g. Rampazzo et al., 2016, for a historical persepective). Conceptually, a galaxy is considered isolated if it has not experienced any gravitational influence from neighbours, at least over the last few billion years. In practice, isolated galaxies are sought among those that, at first instance, do not have (obvious) nearby companions. Karachentseva et al. (1973) compiled the first catalog of such objects, The Catalog of Isolated Galaxies (CIG hereafter), from the visual examination of POSS plates adopting 2D isolation criteria, since in most cases redshifts were not available. CIG includes 1050 candidates of all morphological classes, although spiral candidates are predominant. Since then, with the increase in the number of candidates with known redshift, several other catalogs have followed over the years, either revisions of the CIG (Verdes-Montenegro et al., 2005; Verley et al., 2007a; Argudo-Fernández et al., 2013) or new 3D compilations (Argudo-Fernández et al., 2015).
| Acronym | |
|---|---|
| BP | Brightest Point |
| BC | Blue Cloud |
| CIG | Catalog of Isolated Galaxies |
| CMD | Color Magnitude Diagram (NUV-r vs Mr) |
| CPI | Chemo-Photometric Implementation |
| DM | Dark Matter |
| ETG | Early Type (elliptical+S0) Galaxy |
| FIR | Far-Infrared |
| FUV | Far-Ultra Violet |
| GV | Green Valley |
| GALEX | GALaxy evolution EXplorer |
| iETG | isolated ETG |
| LDE | Low Density Environment |
| LTG | Late Type Galaxy |
| RS | Red Sequence |
| SED | Spectral Eenergy Distribution |
| SF | Star Formation |
| SFR | Star Formation Rate |
| SSFR | Specific Star Formation Rate |
| SPH | Smoothed Particle Hydrodynamics |
| UV | UltraViolet |
During the past 30 years it has become clear that galaxy properties e.g. morphology, star formation (SF), nuclear activity, and evolution may be driven as strongly by initial conditions as by environment, that is the subsequent dynamical processes they experienced (see e.g. Boselli et al., 2006; Cappellari, 2016, and references therein). In this context, the value of galaxies in isolation seems twofold. From one side, isolation offers the possibility either to reduce or even to exclude the influence of the environment from the study of galaxy evolution going directly to basic ingredients. From the other, a well selected sample of isolated galaxies would represent the baseline with which to compare the properties of galaxies inhabiting areas of different richness, from which to give back insight about assembling mechanisms at work (Boselli et al., 2006). There are two kinds of environmental influences a) one-by-one and b) local number density of galaxies. A single, sometimes difficult to identify, neighbour can be able of a larger effect than an enhanced local number density of galaxies. Effects related to local density can be especially difficult to quantify because automated sample selection can often miss close neighbours (Verley et al., 2007a).
New imaging and spectroscopic surveys showed that the isolation of galaxies is challenged by several factors. The SLOAN Digital Sky Survey (SDSS, Aguado et al., 2019, and references therein) largely contributed both to show the presence of faint intruders that can undermine the isolation criteria, and, with new redshift measures, that these companions are likely physically associated to the galaxy deemed isolated. Statistical considerations (Section 2.1) suggest that truly isolated galaxies could have been isolated for at least 3 Gyrs, certainly a significant fraction of their entire lifetime (Verley et al., 2007a).
Long lasting signatures of past interaction and merging events are still detectable on the isolated galaxy structures. A large fraction (50-60%) of isolated early-type galaxies (iETGs) show a large variety of such structures like shells, ripples, streams and tails (Hernadez-Toledo et al., 2007; Rampazzo et al., 2020a). Isolated late-type galaxies (iLTGs) may show different levels of perturbation in their properties (see e.g. Fernandez-Lorenzo et al., 2014; Jones et al., 2018).
In this paper we present a study of five isolated galaxies (Section 2), for which we obtained new Swift-UVOT observations (PI Trinchieri). Four of these galaxies are iETGs with good confidence (Section 2.2). The far-UV (FUV) study of iETGs is per se a challenge since the true (or presumed) isolation together with the early morphological type should be a guarantee of an extinguished, red and dead, galaxy. Far-UV observations offer a snapshot of the recent (106-107 years old) SF activity in galaxies (Kennicutt & Evans, 2012). This is relevant also for ETGs. Several ETGs show a residual SF activity even if they have reached the red sequence (RS), as shown by Jeong et al. (2009) and Marino et al. (2011) studies with GALaxy evolution EXplorer (GALEX hereafter; Martin et al. (2007)) data. We recently examined 11 ETGs with SWIFT-UVOT and noticed that the Sérsic indices in UV are typically lower than optical ones, suggesting the emergence of a disk structure in UV (Rampazzo et al., 2017). This is an indication of a dissipative formation of ETGs, not strictly related to their classification (E vs. S0SAs). We deepen the study of these galaxies giving insight into their evolution making use of a grid of Smoothed Particle Hydrodynamics simulations with chemo-photometric implementation (SPH-CPI hereafter) anchored, a posteriori, to the global properties of our targets. We already applied this approach to study ETGs and LTGs evolution in several environments (Mazzei et al., 2014a, b; Buson et al., 2015; Plana et al., 2017; Mazzei et al., 2018, 2019). The plan of the paper is the following. In Section 2 we present the general properties of the five isolated galaxies observed, in Section 3 we detail observations and the reduction techniques adopted. Difficulties in an accurate surface brightness analysis of UVOT data are reviewed as well as the reduction packages used. Results, presented in Section 4, include the UV and the optical surface brightness distributions and the comparison of the optical integrated magnitudes with those in the literature. These new data allow us to improve the multi-wavelength spectral energy distributions (SEDs) of our targets extending it over about 3 orders of magnitude in wavelength, starting from 0.15 micron. Additional information from the literature of our targets are reported in Appendix. We use all these data in Section 5 to constrain, a posteriori, our simulations. In this Section we summarize the recipes of our SPH-CPI simulations, detailed in previous papers, and present the results of the simulations which best match the global properties of our targets so giving insight into their evolution. The discussion of evolutionary properties derived is given in Section 6 and, finally, in Section 7 there are our conclusions.
Hereafter we use the same cosmological parameters as in Mazzei et al. (2019): H0=67 km s-1 Mpc-1, =0.68, =0.32 (Planck Collaboration XVI, 2014; Calabrese et al., 2017) which correspond to a cold dark matter (CDM) model with Universe age of 13.81 Gyr (Calabrese et al., 2017, see their Table 1), and a light travel time (look-back time) of 7.98 Gyr at z=1 and 5.23 Gyr at z=0.5. In order to help the interested reader, we collect in Table 1 the acronyms commonly used through this paper.
2. The sample
The iETGs we are analyzing cover the whole range of morphological classification of ETGs. In the following we report some considerations about the degree of isolation and the morphology of our targets whose general properties are reported in Table 2.
| Galaxy ID | D3K | Morph. | T | D25 | B | AB | MB | MHI | QK | |
|---|---|---|---|---|---|---|---|---|---|---|
| [Mpc] | [arcmin] | [mag] | [mag] | [mag] | 109 [M⊙] | |||||
| CIG 189 | 48.63.4 | E | -4.80.8 | 2.09 | 14.190.25 | 0.28 | -19.520.43 | … | 0.403 | -3.067 |
| CIG 309 | 24.81.7 | Sab(R) | 1.60.6 | 4.27 | 11.140.10 | 0.19 | -21.020.37 | 0.46c | … | … |
| CIG 389 | 25.31.8 | S0B | -1.50.9 | 2.34 | 12.860.08 | 0.16 | -19.320.36 | 0.015a | … | … |
| CIG 481 | 24.21.7 | S0-a | -0.10.5 | 2.19 | 13.250.13 | 0.04 | -18.710.36 | 0.31b | 1.080 | -2.279 |
| CIG 637 | 33.52.3 | E-S0 | -3.21.0 | 2.40 | 12.590.05 | 0.05 | -20.090.35 | 0.032a | 1.132 | -1.432 |
| Galaxy | W2 | M2 | W1 | U | B | V |
|---|---|---|---|---|---|---|
| ID | [s] | [s] | [s] | [s] | [s] | [s] |
| CIG 189 | 31165 | 21766 | 16303 | 8016 | 7892 | 7518 |
| CIG 309 | 11196 | 8028 | 5857 | 2638 | 2638 | 2639 |
| CIG 389 | 22219 | 15317 | 11423 | 5701 | 5704 | 5501 |
| CIG 481 | 26741 | 19803 | 13193 | 6572 | 6499 | 6206 |
| CIG 637 | 17620 | 12789 | 9598 | 4601 | 4451 | 4266 |


2.1. Isolation
The Catalog of Isolated Galaxies (CIG) (Karachentseva et al., 1973) includes 1050 galaxies. The CIG sample was assembled with the requirement that no similar sized galaxies, that is neighbors with angular diameter between 1/4 and 4 times the angular diameter of the primary galaxy, lie at an angular projected separation from the primary galaxy smaller than 20. For instance, a CIG galaxy with D = 3′, has no neighbor with d= 12′ within 240′ and no companion with d = 0.75′within 15′. However, dwarf companions are not excluded. Therefore, if one assumes an average D = 25 kpc for a CIG galaxy and a typical ”field” velocity of 150 km s-1 then an approximately equal mass perturber (d=D) would require 3.2109 years to traverse a distance of 20d (Stoke, 1978; Verley et al., 2007a). This suggests that the galaxy did not suffer strong interactions in the last 3.2 Gyrs.
Here we are analyzing five CIG galaxies with new SWIFT UVOT observations. Two of them, CIG 309, and CIG 389, are nearby galaxies with a recession velocity V1500 km s-1, so are not included in the reassessment of the isolation degree of CIG galaxies by Verley et al. (2007a), neither in the following quantification of the degree of isolation (Verley et al., 2007b). CIG 309 and CIG 389 are in the outermost parts of the local supercluster (Verdes-Montenegro et al., 2005). As noted by Haynes & Giovanelli (1983) in spite of the fact that most of the isolated galaxies are outer components of groups or clusters, so that it seems difficult to find a truly isolated population of galaxies, however it is possible to have access to regions of very low galaxy density, where the galaxies reflect properties characterizing their formation. CIG 309, also known as NGC 2775, as an example, is a member of the same group as NGC 2777 (Shapley et al., 2001), LGG 169 (Garcia, 1993) which includes 3 member galaxies. Galaxies in the CIG have been found to show different degrees of isolation (Verley et al., 2007a, b). CIG 189, CIG 418, and CIG 637, actually lie in very low density environments given that their local number density parameter, (Table 1), is below the critical value, 2.4. Moreover, the tidal strength estimation, Qk, is lower than the critical value, -2, for CIG 189 and CIG 481 (Table 1) which are isolated from any sort of external influence. The same is not true for CIG 637 which lies in a very low density environment but can suffer the consequences of tidal interactions with some dwarf companion.
2.2. Morphologies
In addition to a reassessment of their isolation, several galaxies in CIG have been also re-classified many times (see e.g. Fernandez-Lorenzo et al., 2012; Buta, 2019; Rampazzo et al., 2020a). CIG 309 deserves a special mention. HyperLeda classified this galaxy as a Spiral with an outer ring (Table 2). BVRI photometry reveals a ring enclosing a ”soft” bulge (Hernández-Toledo & Ortega-Esbrí, 2008). The spatial distribution of the inner star forming regions and dust lanes traces the arms. For Cómeron et al. (2014) NGC 2775 is a SA(rl)0+, that is a lenticular galaxy with a inner resonance ring. Indeed this galaxy does not present arms and the disk extends well outside the ring (see their Appendix B1). The classification suggested by near-IR data of Cómeron et al. (2014) is well supported by the high stellar circular velocity, 2704 km s-1, and central velocity dispersion, 16213 km s-1, of Ferrarese (2002). Morales et al. (2018, upper panel in their Fig.8) do not find any signature of spiral arms. However, they find a tidal stream extending 29 kpc around this galaxy which they define as a shell. Shells are faint structures found in ETGs as remnants of a merging episode (Malin & Carter, 1983; Dupraz & Combes, 1987) especially in ETGs in low density environments where mergers are likely to occur (Reduzzi et al., 1996; Rampazzo et al., 2020a). We conclude that the morphological properties of CIG 309 are likely of an ETG at the border with a LTG. .
CIG 389 (NGC 3098) is a barred lenticular galaxy according to HyperLeda (Table 2). This classification has been revised by Buta et al. (2015) in SAB:0 that corresponds to a value 0.25 of the type (T) parameter of HyperLeda. Laurikainen & Salo (2017) found that the galaxy has a very compact X-structure in the centre (see also Yildiz et al., 2020).
3. Observations and data reduction
UVOT is a 30 cm telescope in the Swift platform operating both in imaging and spectroscopy (Roming et al., 2005). We observed our targets in imaging in all six available filters, W2 ( 2030 Å), M2 ( 2231 Å), W1 ( 2634 Å), in the ultraviolet (UV) spectral range, and U ( 3501 Å), B ( 4329 Å), V ( 5402 Å) in the optical one. Description of the filters, their PSFs (2.92″ for W2, 2.45″ for M2, 2.37″ for W1, 2.37″ for U, 2.19″ for B, 2.18″ arcsec for V), and calibrations are discussed in (Breeveld et al., 2010, 2011). UVOT data obtained in imaging mode with a 22 binning, resulting in 1.004″/pixel of resolution, were processed using the procedure described online111http://www.swift.ac.uk/analysis/uvot/. We combined all the images taken in the same filter for each galaxy in a single image using UVOTSUM, binned 22 to improve the S/N and to enhance the visibility of UV features of low surface brightness. The final exposure times per image are different since we complied with the request of preserving the lifetime of the filter wheel and therefore observed as much as possible in the filter-of-the-day. Total exposure times are reported in Table 2. We used the photometric zero points provided by Breeveld et al. (2011) for converting UVOT count rates to the AB magnitude system V = 17.880.01, B = 18.980.02, U = 19.360.02, W1 = 18.950.03, M2 =18.540.03 and W2 = 19.110.03 (Oke, 1974).
UVOT is a photon counting instrument and is therefore subject to coincidence loss when the throughput is high, whether this is due to background or source counts, which may result in an undercounting of the flux. This effect is a function of brightness of the source and affects the linearity of the detector. The U, B, and V filters are most affected, although coincidence loss can also be present in UV filters. For our binning, Hoversten et al. (2011, and reference therein) estimate that count rates lower than 0.028 counts s-1 pixel-1 are affected by at most 1% due to coincidence loss. We checked for coincidence loss in all our images. The UV filters W2, M2, and W1 are almost free of coincidence loss effects. We verified that in W1, which is the most affected of the UV filters, the region with count rate 0.028 counts s-1 pixel-1 is restricted to a few pixels centered on the galaxy nucleus. For instance, in the case of CIG 637, the level of the 0.028 counts s-1 pixel-1 in the W1 filter is exceeded in four central pixels. Coincidence loss effects can be corrected in the case of point sources (Poole et al., 2008; Breeveld et al., 2010). For extended sources a correction process has been performed for NGC 4449, a Magellanic-type irregular galaxy with bright star-forming regions, by Karczewski et al. (2013). Even though their whole field is affected, the authors calculated that the statistical and systematic uncertainties in their total fluxes amount to 7-9% overall for the UV and the optical bands. Based on these results, we decided to refrain from applying any correction for coincidence loss to our optical and UV data.
We considered the presence of instrumental scattered light that, in the UV filters, may cover the whole frame and of the light scattered from stars (see e.g. Hodges-Kluck & Bregman, 2014). This latter may produce ghost-images: for particularly bright stars, a typical ring pattern is produced. The most contaminated frames are those of CIG 637, in the W1 filter (see next section). However, our images are the sum of several dithered and rotated frames. This sum tends to smooth out large-scale inhomogeneities in the final frame, while ghosts of bright stars remain a serious problem for an accurate surface photometry. Our targets, however, cover a limited portion of the 17′17′of the UVOT field of view. The background, although not homogeneous due to the above factors, can be well evaluated around each object. The surface photometry has been performed using the ELLIPSE (Jedrzejeswki, 1987) fitting routine in the STSDAS package of IRAF. Foreground and background objects have been removed substituting the surrounding background using the IRAF task IMEDIT. Ghosts, very bright and extended only in the case cited above, have been masked using ELLIPSE. To secure a reliable background measure, we forced the measure well beyond the galaxy emission. From the surface brightness profiles, we derived apparent magnitudes by integrating the surface brightness within elliptical isophotes. Errors of the magnitudes where estimated by propagating the statistical errors on the isophotal intensity provided by ELLIPSE. Our integrated magnitudes, reported in Table 4, are not corrected for Galactic extinction.
| Galaxy | W2 | M2 | W1 | U | B | V |
|---|---|---|---|---|---|---|
| ID | [mag] | [mag] | [mag] | [mag] | [mag] | [mag] |
| CIG 189 | 18.740.07 | 18.740.14 | 17.310.10 | 15.540.15 | 13.930.11 | 12.980.10 |
| CIG 309 | 15.040.05 | 15.100.12 | 13.930.06 | 12.600.06 | 11.170.07 | 10.420.10 |
| CIG 389 | 17.660.14 | 17.670.19 | 16.260.07 | 14.470.15 | 13.100.11 | 12.480.10 |
| CIG 481 | 15.840.04 | 15.780.08 | 15.090.08 | 13.990.07 | 12.910.05 | 12.200.06 |
| CIG 637 | 17.610.07 | 17.780.14 | 15.860.13 | 14.480.11 | 12.980.07 | 12.330.07 |
| Galaxy | BT | BT | BT | BT |
|---|---|---|---|---|
| ID | [HyperLeda] | [NED] | [Verdes-Montenegro] | [our] |
| CIG 189 | 14.190.25 | 14.020.15 | 14.300.14 | 14.060.11 |
| CIG 309 | 11.140.10 | 11.030.10 | 11.400.14 | 11.300.11 |
| CIG 389 | 12.860.08 | 12.890.17 | 13.000.14 | 13.230.11 |
| CIG 481 | 13.250.13 | 13.420.18 | 13.400.14 | 13.040.05 |
| CIG 637 | 12.590.05 | 12.600.20 | 13.300.14 | 12.980.07 |
| Galaxy | W2 | M2 | W1 | U | B | V |
|---|---|---|---|---|---|---|
| ID | ||||||
| CIG 189 | 3.230.18 | 2.790.10 | 2.850.12 | 3.190.19 | 2.360.07 | 2.430.11 |
| CIG 309 | 1.290.03 | 1.700.13 | 2.070.07 | 1.650.01 | 1.740.03 | 2.100.07 |
| CIG 389 | 1.650.04 | 1.580.04 | 1.560.04 | 1.370.01 | 1.240.03 | 1.260.03 |
| CIG 481 | 5.120.13 | 4.230.22 | 4.610.24 | 2.770.01 | 2.870.03 | 2.970.05 |
| CIG 637 | 2.520.07 | 2.300.15 | 3.670.14 | 2.370.07 | 2.540.08 | 2.490.01 |
4. Photometry results
4.1. UVOT Integrated magnitudes
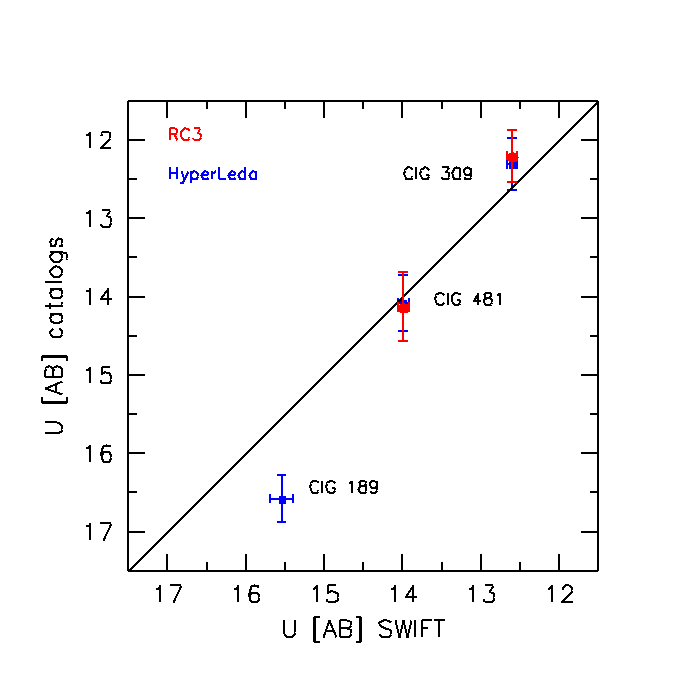
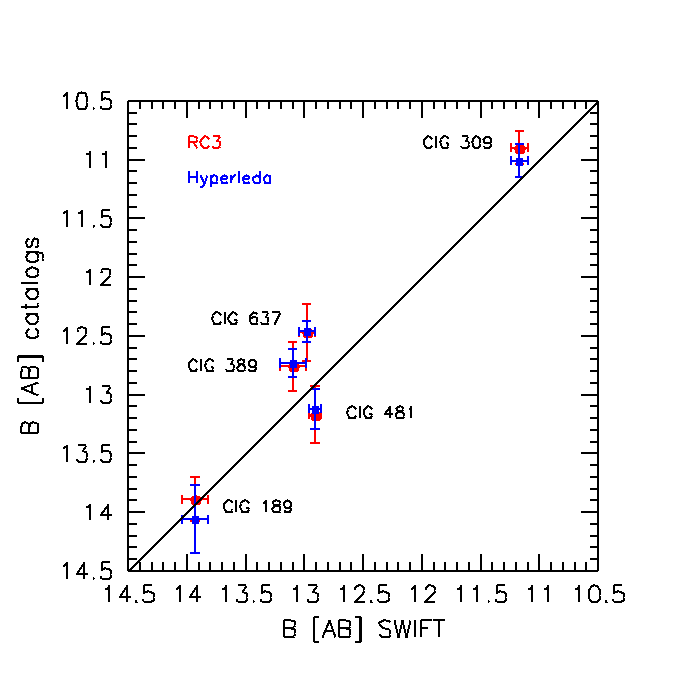
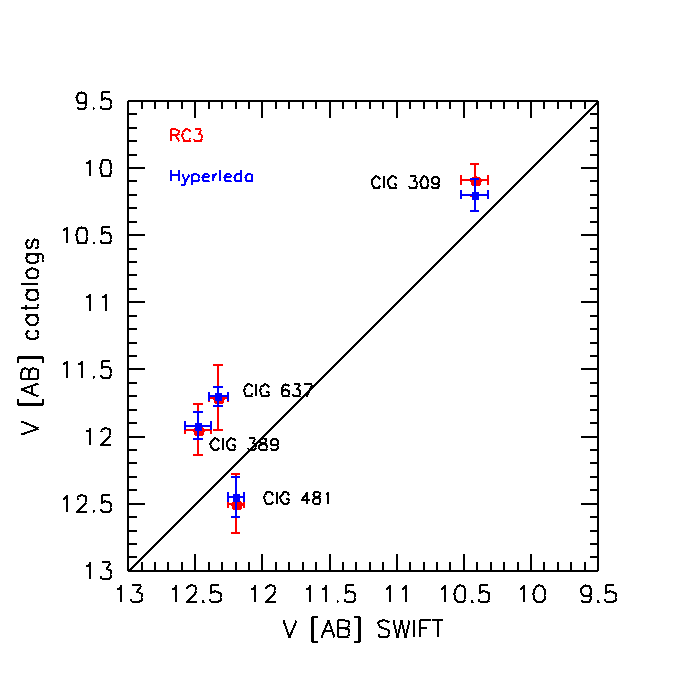
Table 4 shows the integrated magnitudes we derived. We compare our AB integrated optical (U, B and V) magnitudes with RC3 (de Vaucouleurs et al., 1991) and Hyperleda catalogs in Figure 1 by applying the following corrections, AB-Vega: V = -0.01, B = -0.13, U = 0.79, as in Rampazzo et al. (2017). Table 5 extends the comparison of our B integrated magnitudes with other available data in the literature. Most of our magnitudes are consistent, within errors, with those in the previous catalogs indicating that the effects discussed above (Section 3) do not affect our measures significantly. Moreover, B and V magnitudes of CIG 309 agree well with the results of Hernadez-Toledo et al. (2007, their Table 3).
New U magnitudes for CIG 389 and CIG 637, and V magnitude for CIG 189 are derived together with new UV magnitudes in three bands for each of our targets.
4.2. UVOT surface photometry
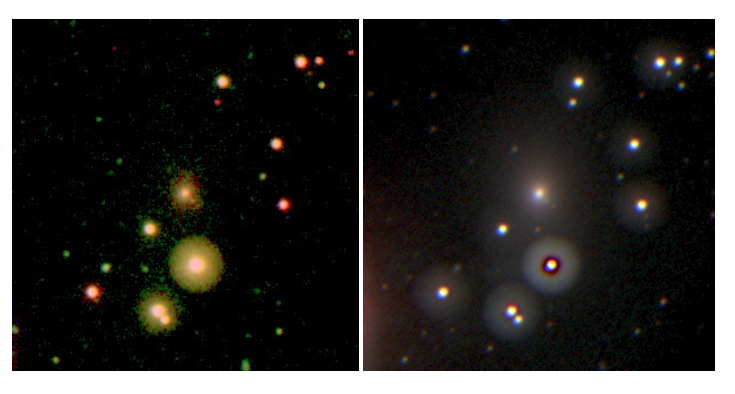
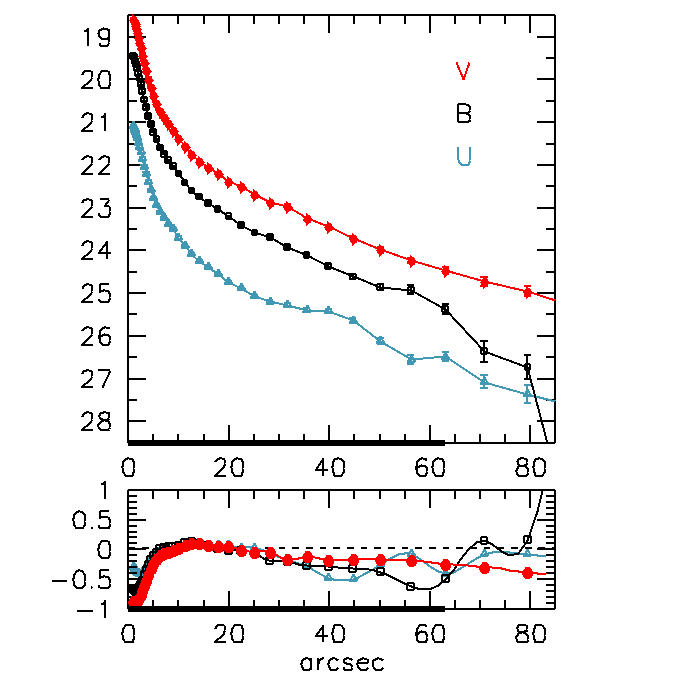
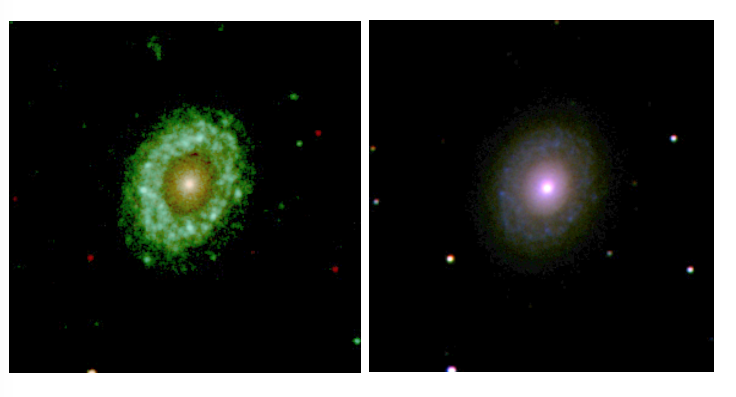
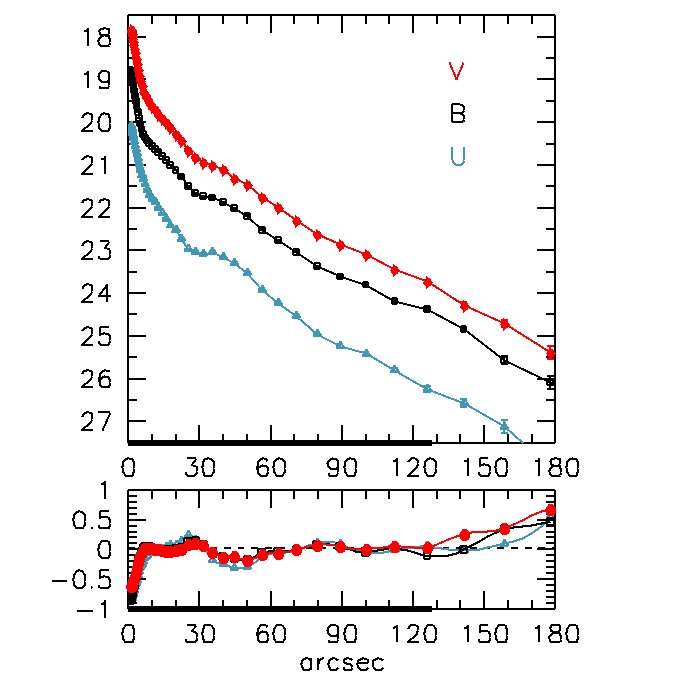
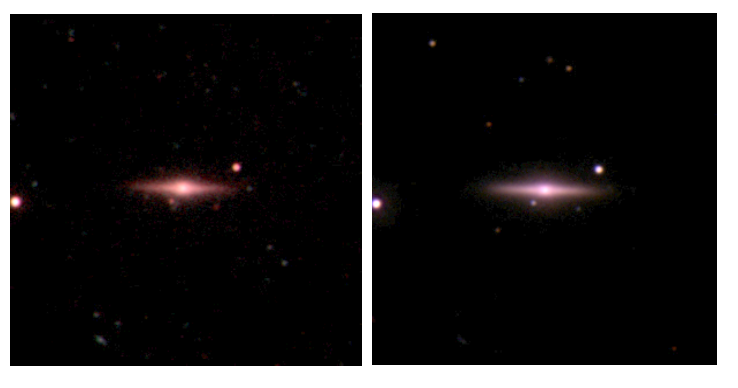
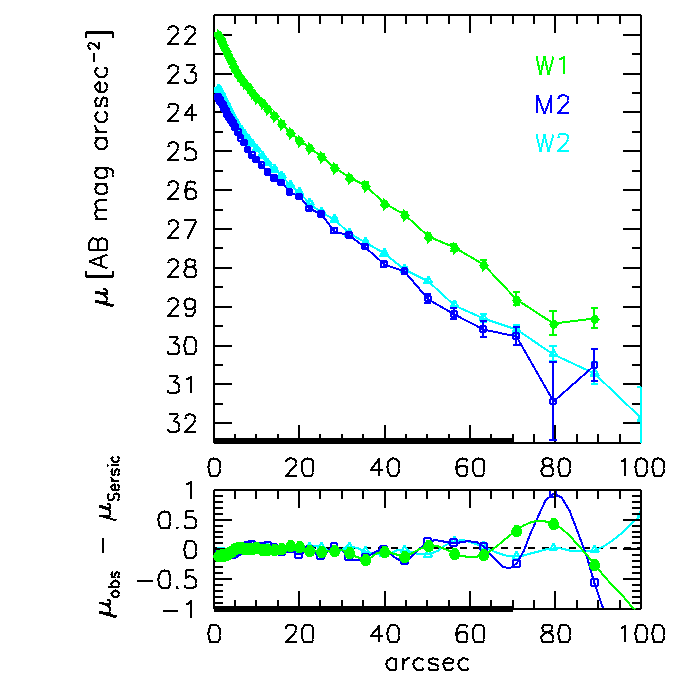
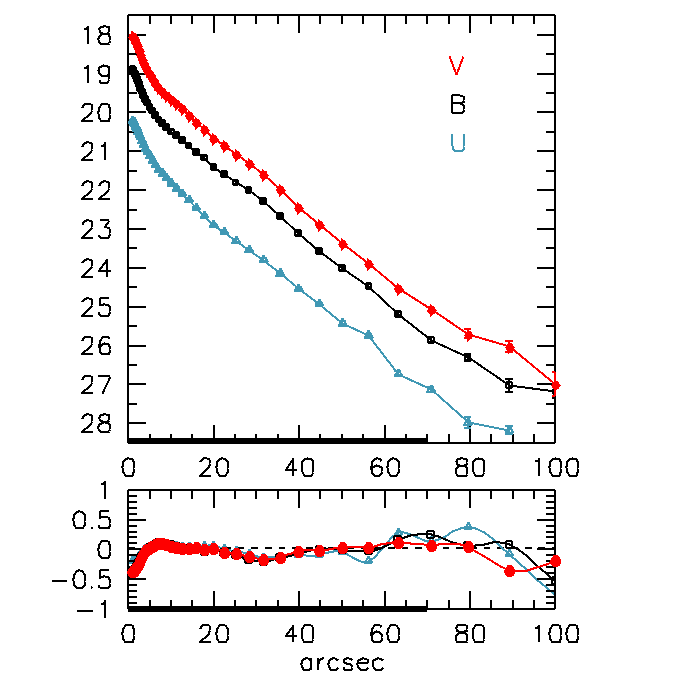
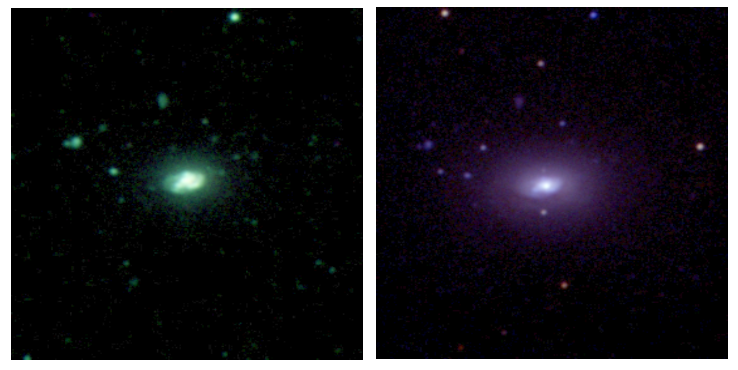
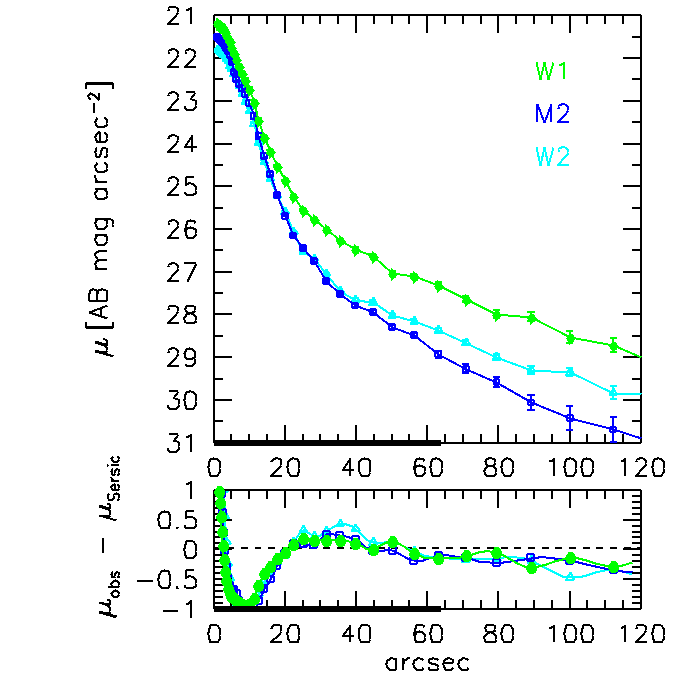
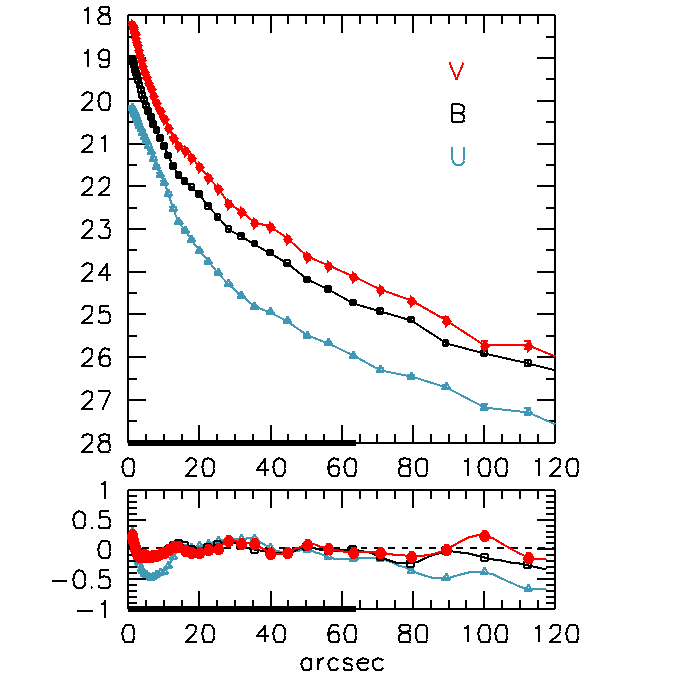
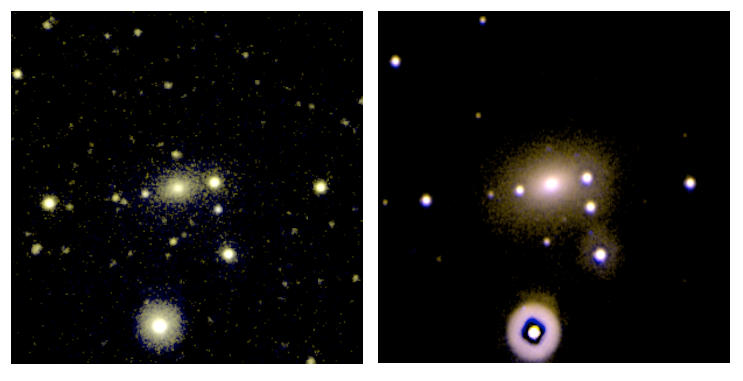
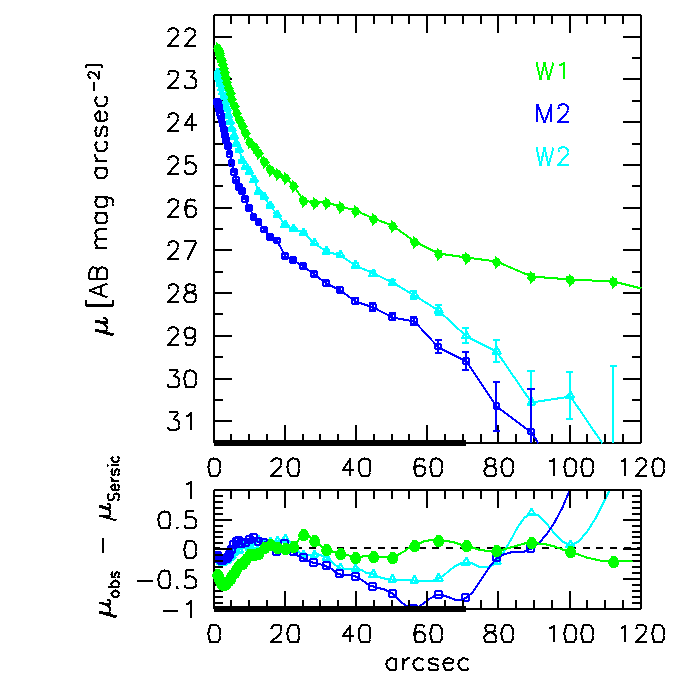
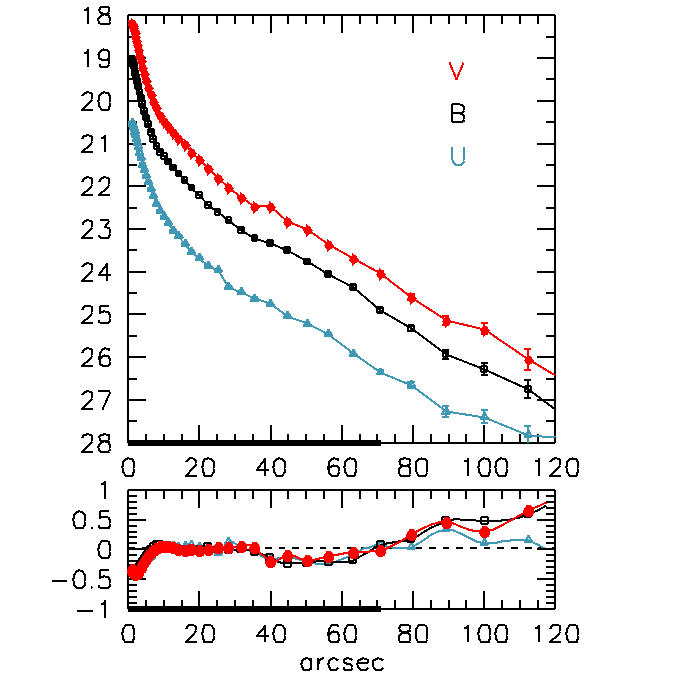
Top panels of Figure 2 to Figure 6 show color-composite images of our targets in the UV (left) and in the optical bands (right). Luminosity profiles are presented in AB magnitudes in the middle panels of the same figures, bottom panels show the fit residuals.
To parameterize the shape of luminosity profiles, we adopted a simple Sérsic law ( r1/n; Sérsic, 1968), which is widely used for elliptical and S0 galaxies since it is a generalization of the r1/4 de Vaucouleurs (1948) law (see also Caon, Capaccioli & D’Onofrio, 1993). Special cases are n = 1, the value for an exponential profile, and n = 0.5, a Gaussian luminosity profile. Galaxies with n values higher than 1 have a steep luminosity profile in their nuclear regions and extended outskirts. Values lower than 1 indicate a flat nuclear region and more sharply truncated outskirts. From a 2D luminosity profile decomposition of about 200 Ellipticals from the SDSS, Gadotti (2009) measured that the Sérsic index in the i-band has a mean value of 3.80.9, close to n = 4, the historical paradigm for bona fide Ellipticals (de Vaucouleurs, 1948), although with a large scatter. The multi-wavelength analysis by La Barbera et al. (2010) showed that ni values of ETGs are quite stable, with average values from 5.442.36 in g-band to 6.682.60 in K-band. In the following we summarize our photometric results for each target together with kinematical properties, if any. We will use all these data in Section 5 to constrain (a posteriori) our simulations. We consider 2.5 as the transition value between galaxies without a disk (2.5) and those with a disk (2.5). We perform a 1D best fit with a Sérsic law convolved with a point-spread function (PSF) using a custom IDL routine based on the MPFit package (Markwardt et al., 2009) and accounting for errors in the surface photometry, as in Rampazzo et al. (2017). The PSF model is a Gaussian of a given full width at half maximum (FWHM), and the convolution is computed using fast Fourier transformation (FFT) on oversampled vectors. We used the nominal value of the FWHM of the PSF for each UVOT filter. However, as a result of the coadding, binning, and relative rotation of the frames, the FWHM is broadened by about 15% compared to the nominal value (Breeveld et al., 2010). We verified that the effects of the small variations of the PSF are well within the error associated with the Sérsic index. The derived values of Sérsic indices, ni, in the six UVOT filters are presented in Table 6. The residuals from the best-fit with the single Sérsic laws in Table 6 of the luminosity profiles of our targets are reported in the bottom panels of Figure 2 to Figure 6.
CIG 189. This Elliptical galaxy, UGC03844,is in a crowded field, both in the optical and in the UV filters (Figure 2, top). Its luminosity profiles (Figure 2, middle) extend beyond R25 (Table 2 and tick x-axis line) showing small errors, with the exception of M2 and W1 profiles at r90″.The average value of the Sérsic indices in Table 6 is 2.810.36. We do not find any significant difference between the optical and UV average values, 2.660.46, and 2.960.24, respectively.
CIG 309.
This galaxy, alias NGC 2775 or UGC 4820, has an uncertain classification
as explained in Section 2.2.
Color-composite images and its luminosity profiles are provided in
Figure 3 (top and middle, respectively). Following
Shapley et al. (2001), this is the brighter member of a low density group
together with NGC 2777, two magnitude fainter. Its luminosity profiles
extend well beyond R25, up to 128″(Table 2). The
outer ring is very bright in the UV and it is still well visible in the
optical bands.
This galaxy is an interesting example of ring formation in isolated
environment. Most rings form by gas accumulation at resonances, usually
under the continuous action of gravity torques from a bar pattern, but
sometimes in response to a mild tidal interaction with a nearby
companion (Buta & Combes, 1996; Buta, 1999). A resonance is a very special
place in a galaxy where SF can be enhanced and may proceed
either as a starburst or continuously over a period of time. Most of the
observed rings in isolated galaxies (Hernadez-Toledo et al., 2007) show blue
colour distributions, suggesting that their stellar populations are
similar to those in their hosting disks. The composed JHK image of this
galaxy by Hernadez-Toledo et al. (2007, their Fig. B.9, bottom panel) also
shows the ring. The existence of an old stellar population underlying
the star-forming one suggests a strong coupling between the stellar and
gaseous components in this resonance region.
The average value of the Sérsic indices in Table 6 is
1.760.30. There are no meaning differences between the averages of
optical and UV values, 1.830.24 and 1.690.39
respectively. These results indicate the presence of a stellar disc in the UVOT filters.
The H-band surface brightness profile decomposition of
Fabricius et al. (2012) points towards a higher value with, however, a large
uncertainty, 3.230.93, in the inner regions of this galaxy.
CIG 389. This edge-on S0 barred galaxy is also known as NGC 3098. Its luminosities profiles are in Figure 4 below color-composite UV and optical images. The major axis of this galaxy in the B-band is about 1′(RC3). The surface brightness profiles extend up to 1.5 times this limit. The mean value of the Sérsic indices in Table 6 is 1.440.18 with 1.290.07 for the optical and 1.590.05 for UV indices. All these values hint at the presence of a well defined stellar disc.
CIG 481. This galaxy, also known as NGC 3682 (Table 2), has a very uncertain classification being, probably, a peculiar S0 since does not show arms (Rampazzo et al., 2020a). Morales et al. (2018) found two classical shells on both sides of the galaxy. Figure 5 shows UV and optical color-composite images and the luminosity profiles. Our profiles extend almost up to 2R25. The average value of the Sérsic indices in Table 6 is 3.761.02, as expected for ETGs. The average value of UV indices, 4.650.45, is higher than that of optical ones, 2.870.10 suggesting the presence, in the inner 20″, of a very asymmetric component, with a complex geometry, not well matched by 1D UV fits.
CIG 637. This nearby galaxy (Table 2, see also Rampazzo et al. (2020a) and references therein), also known as NGC 5687, belongs to a quite crowded field, with several bright optical stars projected around the galaxy body. Figure 6 shows its UV and optical composite images and the luminosity profiles we derived. The optical brightness profiles extend almost up to 2R25. The average value of the Sérsic indices in Table 6 is 2.640.50, with the average of UV indices and optical ones, 2.830.74 and 2.470.09 respectively. These values are border-line with the transition value for ETGs (n2.5) pointing towards a disk component as discussed in Section 2.2 and references therein.
Summarizing, the results of our photometric study suggest that: 1) iETGs in our sample cover the entire range of ETGs, from bona fide Ellipticals (CIG 189) to late S0s (CIG 309) borderline with LTGs; 2) this variety is confirmed also by Sérsic indices running from about 1.3 to 4.8 with sometimes significant differences between optical and UV (see also Rampazzo et al., 2017); 3) the mass of HI gas shows a significant range, from 7.19 to 8.58 in log(MHI[M⊙]). According to Serra et al. (2012) the HI gas is typically distributed in a small disk within the galaxy.
5. SPH+CPI simulations
| Galaxy | Mtot | Mass ratio | Npart | r1 | r2 | v1 | v2 | spins |
|---|---|---|---|---|---|---|---|---|
| ID | [1010 M⊙] | [kpc] | [kpc] | [km s-1] | [km s-1] | |||
| CIG 189 | 250 | 5:1 | 20.0104 | 93 | 373 | 33 | 131 | T |
| CIG 309* | 500 | 1:0.51 | 20.0104 | 701,198 | 621 | 121,27 | 108 | + T |
| CIG 389 | 220 | 10:1 | 17.6 104 | 15 | 149 | 14 | 140 | |
| CIG 481 | 200 | 1:1 | 20.0104 | 446 | 446 | 71 | 71 | |
| CIG 637* | 250 | 1:10.5 | 20.0104 | 427,359 | 217 | 118, 56 | 66 | + |


We are exploring galaxy formation and evolution via a merger/interaction scenario focusing on low density environments. We have performed a large grid of simulations of galaxy encounters and mergers starting from collapsing triaxial systems composed of DM and gas as described in several previous works (Mazzei et al., 2014a, b, 2018, 2019, and references therein). We combine Smooth Particle Hydrodynamic (SPH) code with Chemo-Photometric Implementation (SPH-CPI simulations hereafter) based on Evolutionary Population Synthesis (EPS) models providing the spectral energy distribution (SED) at each snapshot. The SED accounts for chemical evolution, stellar emission internal extinction, and re-emission by dust in a self-consistent way (Spavone et al. 2009, 2012, and references therein). This extends more than four orders of magnitude in wavelength, from 0.05 to 1000 m. Each simulation in the grid self-consistently provides morphological, dynamic, and chemo-photometric evolution.
From our grid of SPH-CPI simulations, for each galaxy we select the simulation that matches its current, global properties, in particular accounts for the following observational constraints: (i) the total absolute B-band magnitude within the range allowed by observations (Table 1), (ii) the integrated SED extended over four orders of of magnitude in ,, (iii) UV and optical morphologies as confirmed by a (iv) comparison between luminosity profiles. Moreover, the selected simulation must account for v) the available kinematic data, and vi) the HI gas mass in Table 2.
These simulations, anchored a posteriori to the local properties of our targets, are used to give insights into galaxy evolution and, in particular, to shed light on the quenching phase which is identified by the rest-frame NUV-r vs Mr color magnitude diagram (CMD) that is an excellent tracer of even small amounts of residual SF (see e.g. Mazzei et al., 2014a). Therefore, we analyze here the galaxy transformation by looking at the behavior of the SFR, the mass growth of different components (gas, stars, and DM), the specific SFR (SSFR) and, in particular, the CMD diagram. This is a useful tool to capture very low level of residual SFR, highlighting the length of different phases leading to quenching and galaxy transformation from the Blue Cloud (BC) to the Red Sequence (RS). We applied already the same approach to ETGs belonging to the galaxy groups USGC 376 and LGG 225 (Mazzei et al., 2014a), and to some S0 galaxies, namely NGC 3626 and NGC 1533, in (Mazzei et al., 2014b), where we match their photometric, structural (e.g. disk vs. bulge) and kinematical (gas vs. stars) properties, showing that a major merger (1:1) accounts for the structural and photometric transformations expected in S0s systems (Querejeta et al., 2015). Furthermore, our approach allowed us to fit the current global properties of i) several other ETGs (Spavone et al., 2009, 2012; Trinchieri et al., 2012; Bettoni et al., 2011, 2012, 2014; Mazzei et al., 2019), ii) the blue dwarf galaxy UGC 7639 (Buson et al., 2015), iii) a few late-type galaxies of different luminosity classes (Bettoni et al., 2011, 2014; Mazzei et al., 2018), iv) a pre-merger case, NGC 454 (Plana et al., 2017), and v) the false pair NGC 3447/3447A (Mazzei et al., 2018), showing that this a powerful tool to investigate galaxy evolution.
Each simulation of our grid of galaxy mergers and encounters starts from collapsing triaxial halos initially composed of DM and gas (Curir & Mazzei, 1999; Mazzei & Curir, 2003) built up with the same initial conditions and the parameters tuned in previous papers (Mazzei et al., 2014a, b, 2018, 2019, and references therein). This set accounts for different initial masses (from 1013 to 1010 M⊙ for each system), mass ratios (from 1:1 to 10:1), gas fractions (from 0.1 to 0.01), and particle resolutions (initial number of gas and DM particles from 6 to 22104). By seeking to exploit a wide range of orbital parameters, we varied the orbital initial conditions in order to have the first pericentre separation, p, equal to the initial length of the major axis of the more massive triaxial halo down to 1/10 of the same axis for the ideal Keplerian orbit of two points of given masses. For each value of p, we changed the eccentricity in order to have hyperbolic orbits of different energy. The spins of the systems are generally parallel to each other and perpendicular to the orbital (XY) plane. Misaligned spins have also been analyzed in order to investigate the effects of the system initial rotation on the results. Table 7 reports the initial conditions of each simulation that best reproduces, at a given snapshot, the global current properties of our targets. We recall here that by major mergers, we mean mergers with the initial mass ratio of halo progenitors 4, while in minor mergers, the ratio is 4.
We refer the interested reader to the paper by Mazzei et al. (2019, Section 3 and references therein) where the recipes of our simulations and the grid are extensively described. We note that all the selected simulations correspond to galaxy mergers, not to encounters (Table 7). Moreover, no single collapsing halo, like those analyzed in Mazzei & Curir (2003), is able to match the global properties of our targets (Mazzei et al., 2019, and references therein). The initial gas fraction is 0.1 in all the cases here analyzed. The stellar mass resolution ranges from 0.4 to 0.04 the gas mass resolution that is, for simulations in Table 7, (0.8-20)105 M⊙. The final number of particles is at least twice that of the initial number in Table 7.
5.1. Results from SPH+CPI simulations
From our grid of SPH-CPI simulations (Mazzei et al., 2019, and references therein) we concentrate on the one simulation that provides a snapshot which convincingly reproduces the global properties of the target considered, accounting for the observational constraints at points i)-vi) of Section 5. This snapshot sets the age of the galaxy accounted for from the onset of the SF. Table 8 summarizes the global properties of the simulations in Table 7 from this snapshot. The galaxies analyzed are found to span a large range of ages, from 8.7 Gyr for CIG 481, to 13.7 Gyr of CIG 189 and CIG 389, the oldest galaxies in our sample, and of total stellar masses 1.4 – 17.61011 M⊙. The absolute magnitudes derived from the snapshots best fitting the global properties of our targets are reported in Table 8 to be compared with the observed ones in Table 2. Figure 7 allows the comparison between the observed SEDs, extended over almost 4 orders of magnitude in wavelength, and those derived from the selected snapshot of each simulation (red solid line). Error bars account for band width (x-axis) and 3 uncertainties of the flux (y-axis). The snapshot FIR SED is always composed by a warm and a cold dust component both including PAH molecules as described in Mazzei et al. (1992), Mazzei et al. (1994a), and Mazzei & De Zotti (1994b). The warm dust component is heated by massive stars in HII regions, the cold one by the diffuse light in the galaxy. More details are given in the subsections focusing on each galaxy (Section 5.2–5.6). UV and optical morphologies are compared with those provided by the selected snapshot in the same bands, with the same field of view and resolution in Figure 8, showing in general a good agreement with global morphologies. In order to derive the general trend of the underlying structure and to provide a further check for morphologies, the corresponding luminosity profiles are also compared both in the UV and in the V band (Figure 9). Properties at points v) to vi) above are discussed for each target in the dedicated Sections from 5.2 to 5.6.
| Galaxy | MB | age | Mstars | Mtot |
|---|---|---|---|---|
| ID | [mag] | [Gyr] | [1010 M⊙] | [1010 M⊙] |
| M MR50 | M MR50 | |||
| CIG 189 | -18.98 | 13.7 | 4.67 – 7.50 | 6.91 – 22.79 |
| CIG 309 | -20.61 | 10.2 | 12.65 –17.60 | 19.68 –55.57 |
| CIG 389 | -19.25 | 13.7 | 2.50 – 8.47 | 3.45 – 26.32 |
| CIG 481 | -19.11 | 8.7 | 1.97 – 6.23 | 0.75 – 24.91 |
| CIG 637 | -19.40 | 9.6 | 3.50 – 7.23 | 8.18 – 9.54 |
Relevant evolutionary properties are presented from Figure 10 to Figure 14. These include four panels for each target highlighting connections between general evolution and the path of the galaxy in the rest-frame optical-UV CMD which reflects the behavior of the SFR and emphasizes how each galaxy transforms and quenches. The evolution is stopped at 14 Gyr (cf. Section 1) in all these panels. The SFR, in panel a), is shown with a blue solid line that becomes red as the merger phase begins, namely, when the two stellar systems can no longer be distinguished because their mass centers cannot be identified/separated anymore. We find that the SFR shows a gentle self-quenching after reaching its maximum value, due to gas exhaustion and stellar feedback, lasting several Gyr in all of our targets.
The path of the galaxy in the rest-frame CMD is shown in panel b) with a blue solid line. In this panel we assume, as Mazzei et al. (2019, and references therein), that the Green Valley (GV) lies between NUV-r 3.5, which marks the GV entry, and NUV-r5, the RS threshold, (green dashed lines). Significant evolutionary stages of each target, that is the brightest point (BP in the following), the entry in the GV, and the RS achievement, are outlined by (black) squares; (red) triangles correspond to z=1 and z=0.5 using the cosmological parameters in Section 1. The loci of local (z=0) galaxies in the same panel are reported following prescriptions of Wyder et al. (2007) in magenta for the RS and cyan for the BC. Following our simulations, each galaxy moves along the BC until reaching its maximum SF which corresponds to the BP of its rest-frame CMD. Then, the SFR fades, and the quenching begins. This causes the crossing of the BC and GV. Table LABEL:tabnewb reports how long these meaningful evolutionary phases of our targets are.
| Galaxy | tBP | tBP-BC | tGV | tRS |
|---|---|---|---|---|
| ID | Gyr | Gyr | Gyr | Gyr |
| CIG 189 | 4.14 | 0.80 | 1.6 | 5.5 |
| CIG 309 | 1.33 | 3.77 | 0.91 | — |
| CIG 389 | 4.41 | 2.45 | 3.00 | 2.62 |
| CIG 481 | 2.72 | 1.62 | 1.60 | — |
| CIG 637 | 3.70 | 0.30 | 2.08 | 2.68 |
Three galaxies of our sample belong to the RS, CIG 189, CIG 389, and CIG 637. CIG 309 and CIG 481 are still in the GV.
The mass assembly history, that is, the evolution of different mass components, is shown in panel c) within a fixed radius of 50 kpc centered on the B-band luminous center of the galaxy. The black solid line is the total mass, the red short-dashed line is the DM, the blue dotted line is the gas +stars (baryons), the magenta long-dashed line is the stellar component, and the green dot-dashed line shows the amount of gas with temperature lower than 2104 K. Here, as in the following, we refer to this gas component as to cold gas given that its cooling timescale is shorter than the snapshot time resolution (0.037 Gyr, Mazzei et al. (2019)). This represents the upper limit of H I provided by each simulation. The percentages of stellar mass accreted in relevant evolutionary redshift intervals are collected in Table 10. Panel d) shows the behavior of the SSFR which further highlights the galaxy transformation during evolution. The dashed horizontal line in this panel corresponds to the threshold value between star forming and quenched galaxies, 310-10 yr-1 (Eales et al., 2017).
Figure 15 and Figure 16 collect projected morphologies at redshift 0.24, that is 3 Gyr ago compared to the current age of each target galaxy, and at BP of their rest-frame CMD respectively, as observed in the V-band and with a field of view of 20″. CIG 309 and CIG 481 have distorted morphologies, very different from the current ones, and CIG 389 and CIG 637 appear as barred galaxies at redshift 0.24. Only morphology of CIG 189 agrees with its current one, as expected for an isolated evolution. Moreover, to conclude our evolutionary picture, Figure 16 highlights that complex morphologies appear as the galaxy achieves its BP of the rest-frame CMD, showing tails and features like jelly-fish galaxies (Roman-Oliveira et al., 2019). We direct the interested reader in the evolution of our targets to the following, devoted, subsections (Section 5.2 –5.6) providing further details for each target and related Figures (Fig.7 –Fig.16).
| Galaxy | zi | z(i–0) | z(i-2) | z(1–0) | z(0.5–0) | z(BP–0) | z(GV) | z(0.24–0) |
|---|---|---|---|---|---|---|---|---|
| ID | % | % | % | % | % | % | % | |
| CIG 189 | 3.45 | 94.9 | 24.2 | 9.1 | 0.12 | 5.1 | 2.8 | 0.5 |
| CIG 309 | 0.62 | 60.0 | — | 85.2 | 47.8 | 37.8 | 1.1 | 17.8 |
| CIG 389 | 4.52 | 98.5 | 13.5 | 33.1 | 4.3 | 35.1 | 1.7 | 1.2 |
| CIG 481 | 0.60 | 83.0 | — | 99.9 | 91.2 | 17.5 | 2.6 | 16.0 |
| CIG 637 | 1.20 | 97.7 | — | 87.0 | 7.15 | 1.6 | -0.07 | 1.6 |
5.2. CIG 189
The simulation that best matches the global properties of this ETG corresponds to a minor merger (5:1) between two halos, each of gas and DM, with perpendicular spins at the beginning; the other input parameters are in Table 7. The merger occurs 1.7 Gyr after the onset of the SF, at redshift 3.45 (Table 10). At this age the two galaxies begin to mix and, 1.2 Gyr later, at redshift 2.2, the galaxy appears with a long tail since the instability due to the merger is still working. From the snapshot that best reproduces its global properties (Figure 7, Figure 8 and Figure 9) this galaxy is 13.7 Gyr old with a B-band absolute magnitude of about -19 mag (Table 8), in agreement with the value in Table 2. The age of the galaxy derived from the mean age of its stellar populations within 50 kpc is 10.7 Gyr and 9.6 Gyr weighting by their B-band luminosities. The same quantities computed inside a radius equal to R25 (Table 2) become 9.9 e 9.2 Gyr. Both these estimates point towards a red and dead galaxy. Looking at its SED in Figure 7, where cyan square in the far-UV is from the GALEX archive, we note that the FIR SED is as expected for ETGs (Mazzei et al., 1994a; Mazzei & De Zotti, 1994b). However its warm-to-cold dust energy ratio is almost ten times lower than expected, 0.02, due to the constraint given by the WISE datum at 11 m. The central (r1 kpc) velocity dispersion at the same snapshot, 164.9 km s-1, agrees with the value in the HyperLeda catalog, 147.813.6 km s-1. There are no other available global observational constraints.

Looking at its evolution (Figure 10), this galaxy crossed the BC in about 1.9 Gyr, the GV in 1.6 Gyr, then lived 5.5 Gyr on the RS reached at redshift 0.54 (Table LABEL:tabnewb and panel b). The evolution we derived agrees well with the idea of an isolated red and dead ETG, as suggested by the previous analysis of its local (z=0) photometric (n2.5, Section 4.2) and kinematical properties. Moreover, its SSFR has fallen below the critical value of star forming galaxies, 310-10 yr-1 (Eales et al., 2017) from an age of about 6 Gyr (panel d), corresponding to the BP on its CMD, and it has remained below this threshold until its current age. This behavior has covered a time range of 7.7 Gyr. Therefore, at redshift 0.24, that is 3 Gyr ago compared to its current age, the galaxy lies on the RS with a SSFR lower than 110-12 yr-1, and the morphology expected for an ETG (Figure 15).
Panel c) of Figure 15 and Table 10 highlight that i) about 95% of the stellar mass was assembled from the beginning of the merger to the current galaxy age, ii) 71% from redshift 2, and iii) 90.9% (78.4%) of the current stellar (total) mass was in place at redshift 1. iv) Only 2.8% of its current stellar mass has been assembled during the crossing of the GV and, v) 0.5% in the last 3 Gyr, that is from redshift 0.24 to z0.
5.3. CIG 309
The simulation which best matches the global properties of this galaxy (from Figure 7 to 9) corresponds to a major merger of three halos occurred 6 Gyr in the past of the galaxy, at redshift 0.62. The galaxy is 10.2 Gyr old (Table 8). Its total B-band magnitude (Table 8), agrees, within the error, with the value in Table 2 (see also Appendix). Its SED (Figure 7) includes GALEX data by Bianchi et al. (2017), violet squares, and FIR data, yellow dots, from the AKARI catalog. The FIR SED is well fitted by an early-type dust-stars distribution, as in Mazzei et al. (1994a). However, 30% of its bolometric luminosity comes out in the FIR spectral range, ten times more than expected on average for ETGs, like a normal Spiral (Mazzei et al., 1992). The age of the galaxy derived from the mean age of its stellar populations within 50 kpc is 7.8 Gyr and 7.2 Gyr weighting by its B-band luminosities. The same quantities computed within R25 in Table 2, corresponding to about 10 kpc, are 5.7 and 3.5 Gyr respectively. The central (r1 kpc) velocity dispersion, 174.6 km s-1, and the maximum gas rotation velocity, 288 km s-1, at the same snapshot, agree well with kinematical data reported in Appendix and Section 4.2 showing the values of Sérsic indices all below 2.5 (Table 6). Therefore, from our multi-wavelength analysis of its luminosity profiles (Section 4.2), matched well by the selected snapshot (Figure 9), and total SED accounting for 30% of the bolometric luminosity in the FIR spectral range, we conclude for a disk structure of this galaxy.


Looking at its evolution, the first stars appear in a filament about 500 kpc long. A region of this filament collapses forming a more dense body in about 1 Gyr from the onset of the SF. This galaxy is connected to a small mass companion, like a plume, from one side, and a tail from the other side 0.3 Gyr later. The final merger, that is a unique, quite irregular, stellar system with a plume or shell that appears as a long tail in edge-on projections, was formed 6 Gyr ago, at redshift 0.62 according our cosmology (Section 1). The galaxy lies in the BC at that time, looking at its rest-frame CMD, with a SSFR larger than the threshold value, that is like a late-type galaxy (Figure 11, panels b and d). The galaxy leaves the BC 3.8 Gyr later (Table LABEL:tabnewb), at an age of 9.4 Gyr and reaches its current position on the CMD, with a SSFR below the threshold value, in less than 1 Gyr. At redshift 0.24, that is 3 Gyr before its current age, at 7.2 Gyr, this galaxy was on the BC with a SSFR like a spiral system. Its morphology (Figure 15), is quite disturbed showing an off-centre nucleus and a long plume in x-y projection. All its properties are very different from the current ones.
From Figure 11 (panel c), we derive that i) 15% of the current stellar mass was in place at redshift 1. Table 10 highlights that ii) about 60% (2.2%) of the stellar (total) mass was assembled from the beginning of the merger, z=0.62, to its current age, iii) 47.7% of the current stellar mass is build up from redshift 0.5 to 0. However, in the same range, the total mass grows by only few percent (1.2%) while the mass of the gas is about 10 times its current value. iv) 17.8% of its stellar mass has been assembled in the last 3 Gyr. v) The galaxy is still crossing the GV and the stellar mass assembled in this phase is 1.1% of its current mass. We note that complex morphologies arise as the galaxy approaches its highest values of the SFR (Figure 16), showing tails and features like jelly-fish galaxies (Roman-Oliveira et al., 2019).
5.4. CIG 389
The simulation which best matches the global properties of this galaxy corresponds to a minor merger (10:1) with a total initial mass of 2.21012 M⊙ (Table 7).
The merger between the stellar systems occurs 1.25 Gyr after the onset of the SF, that is at redshift 4.5 (Table 10). The snapshot that best reproduces the global properties of this galaxy (Figures 7, 8 and 9) suggests this is 13.7 Gyr old with a B-band absolute magnitude, -19.25 mag (Table 8), in agreement with the value in Table 2. The age of the galaxy derived from the mean age of its stellar populations within 50 kpc is 8.7 Gyr and 8.3 Gyr weighting by their B-band luminosities. The same quantities become 7.4 e 6.8 Gyr respectively computed within R25. Looking at its SED in Figure 7, the azure square in far-UV is provided by the GALEX archive, and the yellow upper limits are from AKARI catalog. The far-IR SED, well matched by the FIR distribution of Mazzei et al. (1994a), suggests a FIR to bolometric luminosity ratio of 0.07, as expected on average for ETGs (Mazzei & De Zotti, 1994b). From the selected snapshot we derive a central (r1 kpc) velocity dispersion of 109 km s-1, a maximum stellar velocity of 135 km s-1, and maximum velocity rotation of cold gas, that is the gas with temperature lower than 20000 K, of 127 km s-1, in agreement with the values in Appendix. Figure 9 shows that the UV and optical profiles of the selected simulation match well the observed ones which, from the results in Setcion 4.2, correspond to Sérsic indices all well below 2 (Table 6).
Looking at the evolution in the rest-frame CMD (Figure 12, panel b) this galaxy moved from its BP at redshift 1.03, when its age was 5.7 Gyr, then crossed the BC in the following 2.4 Gyr, and the GV in 3 Gyr reaching the RS at redshift 0.21. The galaxy got its current position on the RS 2.6 Gyr later (Table LABEL:tabnewb), at the age of 13.7 Gyr. The quenching phase, starting at the beginning of the GV (BC point), is further emphasized by the behavior of the SSFR (Figure 12, panel d) that becomes lower than the threshold value for ETGs, 310-10 yr-1 (Eales et al., 2017), just from the age of about 8 Gyr when the galaxy comes close to the entry in the GV. At redshift 0.24, that is 3 Gyr ago, its B-band magnitude was 0.5 mag brighter than its current value and the galaxy was still crossing the GV. Its morphology was that of a barred galaxy (Figure 15).
Figure 12 (panel c) and Table 10 highlight that i) about 98% of the stellar mass was assembled from the beginning of the merger to the current galaxy age, ii) 87.8% (26.2% of the current total mass) from redshift 2, and iii) 33.1% (4.9%) from redshift 1 to the current galaxy age. iv) Only 1.7% of the stellar mass has been assembled during the crossing of the GV and 1.2% in the last 3 Gyr, that is from redshift 0.24 to z0.
5.5. CIG 481
The simulation that best matches the global properties of this galaxy corresponds to a major merger (Table 7) occurred at redshift 0.6, when the system was 2.8 Gyr old from the beginning of the SF. The current age of the galaxy is 8.7 Gyr , the youngest we derived for isolated galaxies here, with MB=-19.11 mag (Table 8, to be compared with Table 2). The age of the galaxy derived from the mean age of its stellar populations within 50 kpc is 5.3 Gyr and 2.3 Gyr weighting by B-band luminosities; these values become 3.8 and 1 Gyr respectively within R25 in Table 2. The total SED is compared with the observations in Figure 7 where violet squares are GALEX fluxes from Bianchi et al. (2017), azure dot and upper limits are from Rifatto et al. (1995), yellow points and 60 m upper limit are from AKAR-FIS catalog. This galaxy shows a strong FIR emission compared to normal ETGs. Its FIR SED requires a warm dust component with a dust temperature lower than average for ETGs, 48 K instead of 63 K, but with a warm-to-cold energy ratio of 0.7. The bolometric luminosity, indeed, provides 78% of the intrinsic luminosity. There is a large amount of residual gas 50 kpc around the galaxy (Figure 13, panel c) at the selected age, about 4108 M⊙, well in agreement with constraint in Table 2. The maximum gas rotation velocity, 158 km s-1, is also in agreement with constraint in Appendix.

Looking at the evolution of the rest-frame CMD (Figure 13 panel b, and Table LABEL:tabnewb), the galaxy leaves the BC at an age of 7.1 Gyr, or 1.6 Gyr ago, at redshift 0.12. Some rejuvenation episodes occur during the crossing of the GV that would make its intrinsic color consistent with the BC. However, because of internal reddening, the galaxy remains in the GV, as observed. Looking at 3 Gyr ago, the quenching phase is just begun. The SF achieved during this time lapse puts the galaxy up and down the SSFR threshold value separating late-type from ETGs (Figure 13, panel d). Residual bursts account for the large shells detected in the galaxy morphology (Morales et al., 2018), which, however, contradicts the strong degree of isolation established by Verley et al. (2007b, Section 2.1) for this young and reddened galaxy. These features are the product of the in-situ evolution, in particular of the evolution of its potential well which is born and still accreting by the initial merger conditions. Figure 15 highlights the observed optical morphology of this galaxy at redshift 0.24, showing that this is quite different from that of a ETG.
Figure 13 (panel c) and Table 10 highlight that i) 83% of its current stellar mass was assembled from the beginning of the merger, ii) 17.5% from the BP, at redshift 0.27, to the current galaxy age. iii) A relatively large amount of its current stellar mass, that is 16%, has been assembled in the last 3 Gyr, and only v) 2.6% in the GV. Figure 16 highlights distorted morphologies at its BP (z=0.27) as observed in the V-band.
5.6. CIG 637
This simulation is a merger of three systems with total mass 251011 M⊙ (Table 1). The merger occurred after 0.9 Gyr from the onset of the SF, at redshift 1.2 (Table 10). The same snapshot which best reproduces the properties in Figure 7, Figure 8, and Figure 9 corresponds to the age of 9.6 Gyr and a total B-band absolute magnitude -19.4 mag (Table 8 and Table 2). The age of the galaxy derived from the mean age of its stellar populations within 50 kpc is 7.3 Gyr and 6.5 Gyr weighting by B-band luminosity. The same quantities computed within R25 (Table 2) are 6.7 e 6.1 Gyr.
Concerning its SED in Figure 7, the yellow upper limits in the FIR spectral range are AKARI data from Kokusho et al. (2017). The FIR luminosity is equal to 2% of the bolometric luminosity, in agreement with the value expected, on average, for ETGs (Mazzei et al., 1994a; Mazzei & De Zotti, 1994b). The amount of cold gas within 50 kpc at the age of this galaxy is 2-3108 M⊙ (Fig. 14, panel c), consistent with observations.
Figure 14 shows the evolution.

The galaxy achieves the BP on its rest-frame CMD at redshift 0.47, at an age of 4.6 Gyr (panel b). In the next 0.3 Gyr the galaxy crosses the BC and comes in the GV (4.9 Gyr old). At the same time its SSFR drops below the critical value that separates LTGs from ETGs (panel d). Following our simulation, this ETG lived in the RS by about 2.7 Gyr, crossing the GV in the previous 2 Gyr (Table LABEL:tabnewb, 8.7 Gyr old). Thus, 3 Gyr ago, at redshift 0.24, this galaxy was still crossing the GV showing a shell morphology (Figure 15, bottom). Its SSFR was below the threshold all this time. From Figure 14 (panel c) and Table 10 we derive that i) 97.7% of the current stellar mass was assembled from the beginning of the merger to the current galaxy age, ii) 87% from redshift 1, iii) 1.6% from the BP, at redshift 0.46, and almost the same amount in the last 3 Gyr. Projected morphologies of this galaxy as observed in the V-band at its BP (Figure 16, bottom) show tails and streams of a distorted/warped galaxy.


6. Discussion

We deepen our study of the galaxy evolution in low density environments (LDE) (Mazzei et al., 2014a, 2019, and references therein) focusing here on five CIG galaxies. We are exploring the mergerinteraction scenario using a grid of SPHCPI simulations starting from triaxial halos initially composed of DM and gas (Curir & Mazzei, 1999; Mazzei & Curir, 2003) anchored at posteriori at the global galaxy properties of our targets to give insight into their evolution. We already applied this method to study the evolution to several galaxy in groups (Section 5). Mergers andor interactions (encounters) modify the SFR compared to single collapsing halos (Mazzei & Curir, 2003, and references therein) since these mechanisms deepen modify the potential well where the gas is accreting. The growth of the stellar mass develops from the SF driven by this accretion history. The SFR changes for every change of the initial conditions in our grid of simulations. This means that the evolution of the selected simulations is quite different from those in the neighborhood ones in terms of parameter space. The large number of local constrains used allow us to fix the choice.
Are iETGs different from ETGs in LDE? The question is raised by the discovery that about 60% of iETGs show shells, indicative of merging events (Rampazzo et al., 2020a, b, and references therein). Rampazzo et al. (2020a, b) also found a variety of fine structures in the CIG members, not just shells.
Figure 17 (top panel) and Table 10 show that the fraction of stellar mass accreted from redshift 1 by CIG 189 and CIG 389, is less than others 3 CIG, 11 ETGs in Mazzei et al. (2019), and 8 ETGs in Mazzei et al. (2014a), in agreement with their isolation. However, looking at the same Figure, the fraction of stellar mass accreted by CIG here analyzed in several interesting evolutionary ranges is similar to ETGs in LDE (Mazzei et al., 2019, their Table 4).
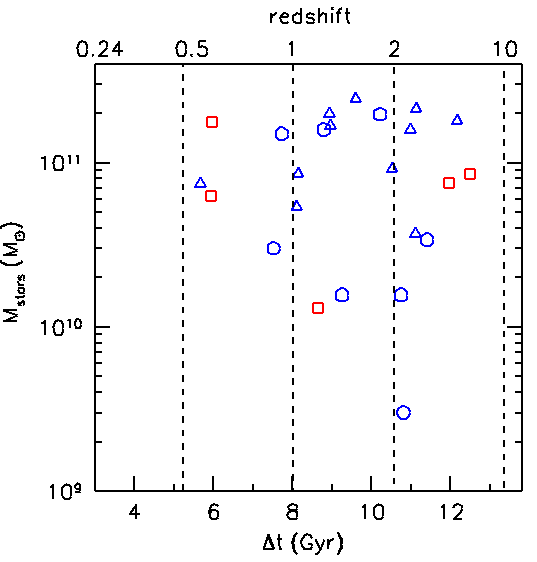
Figure18 shows that our CIG galaxies span the full range of merger-ages of ETGs in Paper II, here 0.9 the stellar mass develops from the SF 4.2 Gyr. This time-range, considering their current age in Table 8, corresponds to a look-back time from 5.9 to 12 Gyr. The youngest mergers, corresponding to a look-back time of 5.9 Gyr, and 6 Gyr, are those occurred in CIG 481 and CIG 309, respectively. Moreover, these five systems span a large stellar and total mass range, 7.517.61010 M⊙, and 9.5–55.61010 M⊙ respectively. CIG 637 and CIG 481 are the youngest galaxies based on their current ages in Table 8.
Their crossing time of the GV anti-correlates with their local stellar mass with a good anti-correlation index, (-0.61) (Figure 19, right), and the magnitude at the BP correlates well with the same time range (Figure 19, left). The evolution derived by our simulations of five CIG galaxies is driven by the stellar mass trough SFR and related feedback. The merger occurred in the past of the galaxy, produced the potential well and gas reservoir that drive the gas assembly history. The growth of the stellar mass develops from the SFR driven by this accretion history. The quenching, which gives rise to galaxy transformation, occurs from the behavior of the SFR, that is, gas exhaustion and stellar feedback, several gigayears after the start of the merger. Therefore the SF quenching is not due to the merger, rather, it is a consequence of the galaxy evolution. Our results suggest that the AGN does not affect the global evolution of our targets. This does not mean that these galaxies have no AGNs. Their feedback effects cloud be important in the nuclear regions, at spatial resolution below that considered here (50 pc), in agreement with the pictures of Bremer et al. (2018) and Eales et al. (2017, 2018a, 2018b, see also () for a discussion). The SN feedback is enough to allow quenching of all our targets. Their stellar masses range from 3.7 to 24.4 1010 M⊙ while their total masses range from 9.5 to 61.21010 M⊙ accounting for the results here and those by Mazzei et al. (2019). Therefore, the evolution expected for CIG galaxies proceeds through the same steps as for galaxies in LDE.
We note that, despite the good isolation validation of CIG 481 (Section 2.1), its observed projected morphologies at z=0.24 are very different from those expected for a normal ETG, at odds with CIG 189 which shows morphologies in agreement with the idea of an isolated ETG (Figure 15). The morphology of CIG 309 is quite peculiar, showing a plume at the same redshift, and those of CIG 389 and CIG 637 are similar to barred galaxies.


We note that all the CIG galaxies here show complex morphologies at the BP of their rest-frame CMD (Figure 16), with tails and features like jelly-fish galaxies (Roman-Oliveira et al., 2019). This point will be explored further in a future paper.
Our simulations suggest that 1) the mechanism that drives the evolution of galaxies in LDE is the merging and 2) that there is a substantial continuity in the evolution of grouped and isolated ETGs. This is shown by Figures 18 and 19, this latter summarizing evolution in terms of CMD. We can therefore argue that the current isolation of our targets is the final byproduct of the evolution in a galaxy-poor environment, starting from a pair or triplet halos. In this framework we may attempt to explain a set of observations. i) The high percentage of shells (60%) found in iETGs, compared to richer environments (Malin & Carter, 1983; Reduzzi et al., 1996; Rampazzo et al., 2020a) suggests that, since the last merging episode, no further ’external’ merger episodes occurred. If not disturbed, shells are therefore long-lasting fine structures as suggested by observations of (1998a, b, and references therein) and confirmed by recent simulations of Mancillas et al. (2019) which derive a lifetime of 4 Gyr for these features.
A further possible consequence of isolation is that the large fraction of rings revealed in the set of iETGs investigated by Rampazzo et al. (2020a) should be produced by resonances, as we already found for NGC 1533 (Mazzei et al., 2019, and references therein) and CIG 309 in this paper. ii) The presence of mergers at redshift larger than 0.5, highlighted in Figure 18, and the evolutionary path we derived, like those of galaxies in group, indicate that isolated galaxy samples are not useful to infer differences with interacting galaxies (Lisenfeld et al., 2007). The galaxy transformation to ETGs, faster in more massive galaxies, it is driven by a quenching process which is, however, a gentle process, lasting more than 1 Gyr. Therefore ETGs and star forming galaxies belong to the same galaxy population observed at different evolutionary stages.
7. Summary and Conclusions
SWIFT-UVOT observations in six bands, from 0.15 m to 0.55 m, of five CIG galaxies are presented. From the analysis of their brightness luminosity profiles we derive new Sérsic’s indices and AB integrated magnitudes (Table 4 and Table 7 respectively). In particular, we obtain new UV morphologies and luminosity profiles in three bands, from 0.15 to 0.3 m, of all our targets. New U magnitudes for CIG 389 and CIG 637, and V-band magnitude for CIG 189 are also derived. The Sérsic’s indices between 1 and 2 in all these bands for CIG 309 and CIG 389 show a dominant disk morphology. CIG 189, CIG 481, and CIG 637 have Sérsic’s indices greater than 2.5, as for ETGs (Section 4.) All these new data, together with available literature information (Appendix), are used to constrain, a posteriori, our SPH-CPI simulations to give insight into their evolution. From our grid of simulations of mergers and encounters, starting from triaxial collapsing systems of DM and gas, we select those matching the current global properties of each galaxy, in particular i) the absolute B-band magnitude, ii) the SED extended over four orders of magnitude in wavelength, and iii) the optical and UV morphologies as confirmed by iv) their corresponding luminosity profiles. Moreover, each selected simulation accounts for v) the HI gas mass, and vi) the available kinematical data of the target galaxy. No constrains on the amount of hot gas are derived by the literature for our targets.
These simulations correspond to a major merger in 3 cases and a minor merger (mass ratio as in Mazzei et al., 2014a, 2019) for CIG 189 and CIG 389. All mergers occurred before , that is more than 5.2 Gyr in the galaxy past (Figure 18), in agreement with their definition of isolated systems (Section 2.1). CIG 189, and CIG 389, are the oldest galaxies (13.7 Gyr, Table 8) in our sample. Therefore they are expected to be passively evolving. However the merger is still leaving its signatures on the evolution of all CIG galaxies here, as shown by several rejuvenation episodes in their rest-frame CMD, triggered, of course, by in situ SF.
The evolution of these five isolated galaxies is not different from evolution of 19 galaxies in LDE we analyzed (Mazzei et al., 2019, 2014a). This is mass dependent and does not require any non-thermal feedback. Our simulations, which include stellar feedback from SNae and stellar winds, show that in situ evolution, driven by the gas accretion history, self-regulates the SFR that pushes the galaxy evolution. External (e.g., ram pressure) or additional (e.g., AGN) quenching are not required. Brighter and more massive galaxies spend a shorter time in the GV than fainter, less massive ones. Both these conclusions are based on the results of the SPH-CPI simulations presented here, anchored to the current properties of 5 CIGs and of 19 ETGs in nearby groups whose stellar mass range, 0.3-24.41010 M⊙, is about two orders of magnitude. Moreover, we find that complex morphologies appear as the galaxy achieves its BP of the rest-frame CMD (Figure 16), showing tails and features like jelly-fish galaxies (Roman-Oliveira et al., 2019). Both isolated and interacting galaxy samples provide objects following the same evolutionary path but observed in different stages of their evolution and galaxy transformation. IETGs and ETGs in group are not unperturbed galaxies. Their evolution is driven by the evolution of their potential well that can still be evolving, depending on the initial conditions of the merger.
Acknowledgments
We thank the referee for helpful comments improving our manuscript.
We acknowledge the use of public data from the Swift data archive.
We acknowledge use of the HyperLeda data base (http://galaxies1.univ-
lyon1.fr). This research has made use of the NASA/IPAC Extragalactic
Database (NED), which is operated by the Jet Propulsion Laboratory,
California Institute of Technology, under contract with the National
Aeronautics and Space Administration.
We acknowledge the usage of the AKARI data
(http://www.ir.isas.jaxa.jp/AKARI/Publications/guideline.html). The
facility used is Swift.
Appendix A Additional information from the literature
Kinematical and gas richness information about our galaxies are extremely useful to identify the galaxy model from the grid of the available SPH-CPI simulations. We summarize below those we found in the literature and used in the sections above.
For CIG 189 there are no information other than those included in Section 5.2.
CIG 309. Fabricius et al. (2012) derived an optical velocity dispersion of 173.913.7 km s-1 within the inner 17. As a comparison, the Hyperleda catalog gives =171.23.8 km s-1 and a maximum gas rotational velocity corrected by inclination (40∘) of 296.18.5 km s-1. H imaging from Epinat et al. (2008, their Figure D31) comparable with that from Hameed & Devereux (2005), shows a flocculent ring of emission with a maximum rotation velocity of 33720 km s-1. However, Kregel, van der Kruit & Freeman (2005) suggest a maximum velocity of 283 km, s-1 lower than that of Epinat et al. (2008) (see their Fig. E5), and like the value of Hyperleda above.
We point out that estimating the distance is very complex for this galaxy, given its position in the Local velocity field (Section 2.1). As an example, Epinat et al. (2008) assume a distance of 17.1 Mpc and a B-band absolute magnitude of -20.3 mag, whereas Fabricius et al. (2012) give 14.4 Mpc and a B-band absolute magnitude of -19.8 mag, almost 1 mag fainter than the value in Table 2.
CIG 389. Following Cappellari et al. (2011) the distance of this galaxy is 23.0 Mpc. On this basis Serra et al. (2012) derived un upper limit to the cold gas mass, log(MHI[M⊙])7.12. rescaling to the distance in Table 2 we derive log(MHI[M⊙])7.19 (Table 2). Following Molaeinezhad et al. (2017, their Table 1), the maximum central velocity dispersion is 126.1 km s-1, in agreement with the value in the Hyperleda catalog, 112.65.1 km s-1. The mean SSP equivalent age is 14.00.61 Gyr (their Table 2). The star and gas maximum rotation velocities are 140.015.8 and 129.722.0 km s-1 respectively from Hyperleda catalog.
CIG 481. Courtois & Tully (2015) measure FHI=2.32 J km s-1 for this galaxy which, rescaling to the distance in Table 1, gives log(MHI[M⊙])=8.49. The maximum rotational velocity of the gas, corrected for inclination (56.8∘), is 152.45.7 km s-1 by HyperLeda catalog.
CIG 637. Following Cappellari et al. (2011) its distance is 27.2 Mpc. They measure a mass of cold gas, log(MHI(M⊙)=7.32 that, rescaling to the distance in Table 2, gives log(MHI[M⊙])=7.50. Moreover, Costantin et al. (2018) conclude this is a classical bulge galaxy with a luminosity-weighted value of the line-of-sight velocity dispersion within an elliptical aperture equal to the effective radius (6.67″, their Table 4) of 1706 km s-1.
References
- Aguado et al. (2019) Aguado, D.S., Ahumada, R., Almeida, A., et al. 2019, ApJS, 240, 23
- Argudo-Fernández et al. (2013) Argudo-Fernández, M., Verley, S., Bergond, G., et al. 2013, A&A, 560, A9
- Argudo-Fernández et al. (2015) Argudo-Fernández, M., Verley, S., Bergond, G., et al. 2015, A&A, 578, A110
- Bender et al. (1989) Bender, R., Surma, P., Döbereiner, S., et al. 1989, A&A, 217, 35
- Bettoni et al. (2011) Bettoni, D., Galletta, G., Rampazzo, R., et al. 2011, A&A, 534, A24
- Bettoni et al. (2012) Bettoni, D., Buson, L., Mazzei, P., et al. 2012, A&A, 423, 2957
- Bettoni et al. (2014) Bettoni, D., Mazzei, P., Rampazzo, R., et al. 2014, Ap&SS 354, 83
- Bianchi et al. (2017) Bianchi, L., Shiao, B., & Thilker, D., 2017, ApJS, 230, 24
- Boselli et al. (2006) Boselli, A., & Gavazzi, G., 2006, PASP, 118, 517
- Bremer et al. (2018) Bremer, M., Phillipps, S., Kelvin, L., et al. 2018, MNRAS, 476, 12
- Breeveld et al. (2010) Breeveld, A.A., Curran, P.A., Hoversten, E.A., et al. 2010, MNRAS, 406, 1687
- Breeveld et al. (2011) Breeveld, A.A., Landsman, W., Holland, S.T., et al. 2011, GAMMA RAY BURSTS 2010. AIP Conference Proceedings, Volumes.1358, 373
- Buson et al. (2015) Buson, L.M., Bettoni, D., Mazzei, P., Galletta, G., 2015, Advances in Astronomy, Volume 2015, id. 274968
- Buta & Combes (1996) Buta, R.J., & Combes, F., 1996, Fundamentals of Cosmic Physics, Volume 17, 95.
- Buta (1999) Buta, R., 1999, Ap&SS 269, 79
- Buta et al. (2015) Buta, R. J., Seth, K., Athanassoula, E., et al. 2015, ApJS, 217, 32
- Buta (2019) Buta, R. J., Verdes-Montenegro, L., Damas-Segovia, A., et al. 2019, MNRAS, 488, 2175
- Calabrese et al. (2017) Calabrese, E., Hloẑek, R. A., Bond, J. R., et al. 2017, Physical Review D, Volume 95, id.063525
- Caon, Capaccioli & D’Onofrio (1993) Caon, N., Capaccioli, M., & D’Onofrio, M., 1993, MNRAS, 265, 1013
- Capaccioli, Caon & Rampazzo (1990) Capaccioli, M., Caon, N., & Rampazzo, R., 1990, MNRAS, 242, 24
- Cappellari et al. (2011) Cappellari, M., Emsellem, E., & Krajnovic, D., 2011, MNRAS, 413, 813
- Cappellari (2016) Cappellari, M., 2016, ARA&A 54,597
- Cómeron et al. (2014) Cómeron, S., Salo, H., Laurikainen, E., et al. 2014, A&A 562, 121
- Costantin et al. (2018) Costantin, L., Corsini, E.M., Méndez-Abreu, J., et al. 2018, MNRAS, 481, 3623
- Courtois & Tully (2015) Courtois, H., & Tully, R.B., 2015, MNRAS, 447, 1531
- Curir & Mazzei (1999) Curir, A., Mazzei, P. 1999, NewA, 4, 1
- de Vaucouleurs (1948) de Vaucouleurs, G., 1948, Ann. Astrophys., 11, 247
- de Vaucouleurs et al. (1991) de Vaucouleurs, G., de Vaucouleurs, A., Corwin, H. G., Jr., Buta, R. J., Paturel, G., Fouqué, P. 1991, Third Reference Catalogue of Bright Galaxies. Springer, New York, NY (USA): RC3
- Dupraz & Combes (1987) Dupraz, C., & Combes, F., 1987, A&A, 185, 1
- Eales et al. (2017) Eales, S., de Vis, P., Smith, M., et al. 2017, MNRAS, 465, 3125
- Eales et al. (2018a) Eales, S., Smith, D., Bourne, N., et al. 2018a, MNRAS, 473, 3507
- Eales et al. (2018b) Eales, S., Baes, M., Bourne, N., et al. 2018b, MNRAS, 481, 1183
- Epinat et al. (2008) Epinat, Amram, P., Marcelin, M., et al. 2008, MNRAS, 388, 500
- Fabricius et al. (2012) Fabricius, M.H., Saglia, R.P., Fisher, D.B., et al. 2012, ApJ, 754, 67
- Fernandez-Lorenzo et al. (2012) Fernández Lorenzo, M., Sulentic, J. W., Verdes-Montenegro, L., et al. 2012, A&A, 540, A47
- Fernandez-Lorenzo et al. (2014) Fernández Lorenzo, M., Sulentic, J., Verdes-Montenegro, L., et al. 2014, ApJ, 788, L39
- Ferrarese (2002) Ferrarese, L., 2002, ApJ, 578, 90
- Gadotti (2009) Gadotti, D.A., 2009, MNRAS, 393, 1531
- Garcia (1993) Garcia, A.M., 1993, A&AS, 100, 47
- Governato, Reduzzi & Rampazzo (1993) Governato, F., Reduzzi, L., & Rampazzo, R., 1996, MNRAS, 261, 379
- Hameed & Devereux (2005) Hameed, S., & Devereux, N., 2005, AJ, 129, 2597
- Haynes & Giovanelli (1983) Haynes, M.P., & Giovanelli, R., 1983, ApJ, 275, 472
- Haynes et al. (2018) Haynes, M.P., Giovanelli, R., Kent, B.R., et al. 2018, ApJ, 861, 49
- Hernadez-Toledo et al. (2007) Hernández-Toledo, H., Zendejas-Domi’nguez, J., & Avila-Reese, V., 2007, AJ, 134, 2286
- Hernández-Toledo & Ortega-Esbrí (2008) Hernández-Toledo, H., & Ortega-Esbrí, S., 2008, A&A, 487, 502
- Hodges-Kluck & Bregman (2014) Hodges-Kluck, E., & Bregman, J.N., 2014, ApJ, 789, 131
- Hoversten et al. (2011) Hoversten, E. A., Gronwall, C., Vanden Berk, D. E., et al. 2011, AJ, 141, 21
- Jedrzejeswki (1987) Jedrzejewski, R.I., 1987, MNRAS, 226, 747
- Jeong et al. (2009) Jeong, H., Yi, S.K., Bureau, M., et al. 2009, MNRAS, 398, 2028
- Jones et al. (2003) Jones L. R., Ponman T. J., Horton A., Babul A., Ebeling H., Burke D.J., 2003, MNRAS, 343, 627
- Jones et al. (2018) Jones, M. G., Espada, D., Verdes-Montenegro, L., et al. 2018, A&A, 609, A17
- Karachentseva et al. (1973) Karachentseva, V. 1983, Astrofizicheskie Issledovaniia Izvestiya Spetsial’noj Astrofizicheskoj Observatorii, 8, 3
- Karczewski et al. (2013) Karczewski, O.L., Barlow, M.J., Page, M.J., et al. 2013, MNRAS, 431, 2493
- Kennicutt & Evans (2012) Kennicutt, R.C., & Evans II, N.J., 2012, ARA&A 50,531
- Kokusho et al. (2017) Kokusho, T., Kaneda, H., Bureau, M., et al. 2017, A&A, 605, A74
- Kregel, van der Kruit & Freeman (2005) Kregel, van der Kruit, P., & Freeman, K., 2005, MNRAS, 358, 503
- Laurikainen & Salo (2017) Laurikainen, E., & Salo, H., 2017, A&A, 598, A10
- La Barbera et al. (2010) La Barbera, F., de Carvahlho, R., de la Rosa, I., et al. 2010, MNRAS, 408,1313
- Lisenfeld et al. (2007) Lisenfeld, U., Verdes-Montenegro, L., Sulentic, J., et al. 2007, A&A, 462, 507
- Lisenfeld et al. (2007) Lisenfeld, U., Espada, D., Verdes-Montenegro, L., et al. 2011, A&A, 534, A102
- (61) Longhetti, M., Rampazzo, R., Bressan, A.. et al. 1998a, A&AS, 130, 251
- (62) Longhetti, M.; Rampazzo, R.; Bressan, A.. et al. 1998b, A&AS, 130, 267
- Malin & Carter (1983) Malin, D. F., & Carter, D., 1983, ApJ, 274, 534
- Mancillas et al. (2019) Mancillas, B, Duc, P.A., Combes, F., et al. 2019, A&A, 632, A122
- Markwardt et al. (2009) Markwardt, C. B. 2009, Astronomical Data Analysis Software and Systems XVIII, 411, 251
- Marino et al. (2011) Marino, A., Rampazzo, R., Bianchi, L., et al. 2011, MNRAS, 411, 311
- Martin et al. (2007) Martin, C., Wyder, T., Schiminovich, D., et al., 2007, ApJS, 173, 342
- Mazzei et al. (1992) Mazzei, P., Xu, C., & de Zotti, G., 1992, A&A, 256, 45
- Mazzei et al. (1994a) Mazzei, P., De Zotti, G., & Xu, C., 1994a, ApJ, 422, 81
- Mazzei & De Zotti (1994b) Mazzei, P. & De Zotti, G., 1994b, ApJ, 426, 97
- Mazzei & Curir (2003) Mazzei, P., & Curir,A. 2003, ApJ, 591, 784
- Mazzei et al. (2014a) Mazzei, P., Marino, A., & Rampazzo, R., 2014a, ApJ, 782, 53; Paper I
- Mazzei et al. (2014b) Mazzei, P., Marino, A., & Rampazzo, R., 2014b, Adv. Space Res. 53, 950.
- Mazzei et al. (2018) Mazzei, P., Marino, A., Rampazzo, R., et al. 2018, A&A, 610, A8
- Mazzei et al. (2019) Mazzei, P., Rampazzo, R., Marino, A., et al. 2019, ApJ, 885, 165; Paper II
- Morales et al. (2018) Morales, G., Martínez-Delgado, D., Grebel, E., et al. 2018, A&A, 614, A143
- Molaeinezhad et al. (2017) Molaeinezhad, A., Falcńo-Barroso, J., Martínez-Valpuesta, I., et al. 2017, MNRAS, 467, 353
- Plana et al. (2017) Plana, H., Rampazzo, R., Mazzei, P., et al. 2017, MNRAS, 472, 3074
- Planck Collaboration XVI (2014) Planck Collaboration XVI, 2014, A&A, 571, A16
- Poole et al. (2008) Poole, T.S., Breeveld, A.A., Page, M.J., et al. 2008, MNRAS, 383, 627
- Rampazzo et al. (2016) Rampazzo, R., D’Onofrio, M., Zaggia, S., et al. 2016, From the Realm of the Nabulæ to Population of Galaxies, ASSL 435, Chapter 5, p.416, Springer Nature
- Rampazzo et al. (2017) Rampazzo, R., Mazzei, P., Marino, A., et al. 2017, A&A, 602, A97
- Rampazzo et al. (2020a) Rampazzo, R., Omizzolo, A., Uslenghi, M., et al. 2020a, A&A, 640, A38
- Rampazzo et al. (2020b) Rampazzo, R., Uslenghi, M., Iskren, G., et al. 2020b, Astron. Nach. 341, 10R
- Reduzzi et al. (1996) Reduzzi, L., Longhetti, M., & Rampazzo, R., 1996, MNRAS, 282 149
- Rifatto et al. (1995) Rifatto, A., Longo, G., & Capaccioli, M., 1995, A&AS, 114, 527
- Roman-Oliveira et al. (2019) Roman-Oliveira, F. V., Chies-Santos, A. L., Rodríguez del Pino, B., et al. 2019, MNRAS, 484, 892
- Roming et al. (2005) Roming, P.W. A., Kennedy, T. E.; Mason, K. O. et al. 2005, Space Science Reviews, Volume 120, 95
- Oke (1974) Oke, J.B., 1974, ApJS, 27, 21
- Querejeta et al. (2015) Querejeta, M., Eliche-Moral, M.C., Tapia, T., et al. 2015, A&A, 573, A78
- Serra et al. (2012) Serra, P., Oosterloo, T., & Morganti, R., 2012, MNRAS, 422, 1835
- Sérsic (1968) Sérsic, J. L. (ed.) 1968, Atlas de Galaxias Australes (Cordoba, Argentina: Observatorio Astronomico)
- Shapley et al. (2001) Shapley, A., Fabbiano, G., & Eskridge, P. B., 2001, ApJS, 137, 139
- Spavone et al. (2009) Spavone, M, Iodice, E., Calvi, R., et al. 2009, MNRAS, 393, 317
- Spavone et al. (2012) Spavone, M, Iodice, E., Bettoni, D., et al. 2012, MNRAS, 416, 2003
- Stoke (1978) Stoke, J.T. , 1978, AJ, 83, 348
- Sulentic et al. (2006) Sulentic, J.W., Verdes-Montenegro, L., Bergond, G., et al. 2006, A&A, 449, 937
- Trinchieri et al. (2012) Trinchieri, G., Mazzei, P., Bettoni, D., et al. 2012, A&A, 545, A140
- Verdes-Montenegro et al. (2005) Verdes-Montenegro, L., Sulentic, J., Lisenfeld, U., et al. 2005, A&A, 436, 443
- Verley et al. (2007a) Verley, S., Odewahn, S.C., Verdes-Montenegro, L., et. al 2007a, A&A, 470, 505
- Verley et al. (2007b) Verley S., Leon, S., Verdes-Montenegro, L., et al. 2007b, A&A, 472, 121
- Yildiz et al. (2020) Yildiz, M.K., Peltier, M.F., Duc, P.-A., & Serra, P. , 2020, A&A, 636, A8
- Wyder et al. (2007) Wyder, T., Martin, K., Schiminovich, D., et al. 2007, ApJS, 173, 293