Interactive Data Analysis with Next-step Natural Language Query Recommendation
Abstract
Natural language interfaces (NLIs) provide users with a convenient way to interactively analyze data through natural language queries. Nevertheless, interactive data analysis is a demanding process, especially for novice data analysts. When exploring large and complex SQL databases from different domains, data analysts do not necessarily have sufficient knowledge about different data tables and application domains. It makes them unable to systematically elicit a series of topically-related and meaningful queries for insight discovery in target domains. We develop a NLI with a step-wise query recommendation module to assist users in choosing appropriate next-step exploration actions. The system adopts a data-driven approach to suggest semantically relevant and context-aware queries for application domains of users’ interest based on their query logs. Also, the system helps users organize query histories and results into a dashboard to communicate the discovered data insights. With a comparative user study, we show that our system can facilitate a more effective and systematic data analysis process than a baseline without the recommendation module.
Index Terms:
Query Recommendation, SQL Databases, Interactive Data Analysis, Natural Language Interface1 Introduction
In recent years, both academia and industry have shown a growing interest in designing natural language interfaces (NLIs) to interactively access, explore, and analyze data in databases. Existing NLIs [1, 2, 3, 4, 5, 6, 7, 8] allow users to formulate data-related questions in natural language (NL). They usually combine natural language processing (NLP) methods (e.g., semantic parsing) with human-computer interaction (HCI) techniques, and are able to translate ambiguous NL queries into formal database query languages (e.g., SQL) to facilitate data retrieval. Then, the systems can generate proper visualizations of the retrieved data, helping users gain quick insights. By using NLIs, users, especially novice data analysts and other users without a strong background in computer science, can conveniently explore and analyze data, and do not need to specify their exploration requirements through complex database query languages or tedious interface interactions (e.g., filtering, drag and drop) in data analytics tools.
However, when using these NLIs for data analysis, users need to empirically specify every data query to derive a series of meaningful data insights. Such an analysis is proceeded iteratively through trial and error, making it still time-consuming to conduct effective and systematic data analysis. In practice, real-world datasets are often large and complex, resulting in a large exploration space. Since novice data analysts do not necessarily have sufficient knowledge about data and application domains, it is challenging for them to efficiently formulate data queries without overlooking important data insights during exploration.
To address the aforementioned challenge, we develop an intelligent NLI with a next-step data query recommendation module. The system can automatically generate a series of appropriate and insightful natural language data queries and help users, especially inexperienced data analysts, decide what to ask next for subsequent data exploration steps.
To make effective query recommendations, it is crucial to capture users’ analytical interests behind a sequence of data queries and produce relevant and context-aware exploratory operations [9, 10]. In this paper, we target data analysis for industry applications where the dataset often comes from multiple tables in relational databases and is accessed and manipulated via SQL. We focus on recommending three typical data operations in SQL, including attribute selection, aggregation, and grouping. We propose a data-driven semantic-based recommendation model that suggests data queries on a dataset to a user by exploring the semantically relevant query sequences issued by other users for databases under similar topics. We assume that when users explore similar datasets, they are likely to share some common interests in their data analysis [11, 12, 13]. Moreover, our method fully exploits the contextual semantic information expressed in prior queries of the current user and dynamically adapts the recommendations to the user’s analytical focuses. We then design and develop an NLI, QRec-NLI that integrates the recommendation model to help data analysts conveniently and efficiently analyze data through NL with step-wise exploration guidance. We formulate design requirements by literature review and expert interviews with a group of data analysts and engineers from an international technology company. Their jobs mainly involve analyzing data from different domains and creating dashboards to communicate data insights. They confirmed that it is common in the daily work that they need to analyze data from a domain they are not familiar with, and need assistance in exploring data comprehensively and discovering data insights efficiently. We worked closely with them in the past seven months and refined our system iteratively. Eventually, our system, QRec-NLI, provides step-by-step NL-based data exploration recommendations. Users can specify data of their interest by typing in natural language and the system will generate proper visualizations to reveal data insights according to data types. Users are enabled to review history queries and the corresponding results, and organize them into a dashboard to communicate data insights.
The design and implementation of QRec-NLI differentiate itself from existing visualization recommendation systems without NL interaction support [14, 15, 16]. While most NLIs [6, 3, 7, 17] focus on conveying users’ analytical interests to systems using NL, a recent work [18] provides analytical guidance for single-table analysis using data interestingness metrics. However, our work adopts a semantic-based and data-driven approach to recommend data queries of interested domains for more complex multi-table data analysis in relational databases. In summary, the major contributions of this paper are as follows:
-
•
Query recommendation: we propose a data-driven next-step query recommendation model that produces semantically relevant and context-aware data queries for interested domains based on current users’ prior queries and other users’ queries for similar analysis domains.
-
•
NLI system: we design and implement QRec-NLI 111Our code is publicly available at https://github.com/xingbow/QRecNLI, an NLI that enables users to perform NL-based interactive analysis of multi-table data in SQL databases from different domains and provides users with sequential exploration guidance for deciding what to ask next.
-
•
Evaluation study: we conducted a user study to demonstrate the effectiveness of QRec-NLI in supporting sequential data exploration compared with a baseline without the recommendation module. Also, we discussed the lessons learned from the design and evaluation of QRec-NLI for future research in interactive data analysis.
2 Related Work
Our work builds upon prior research on natural language interfaces for database queries, natural language interfaces for data visualization, and next-step query recommendations for data analysis.
2.1 Natural Language Interfaces for Database Queries
Many NLIs have been developed to enable users to gain easy access to relational databases through NL, which can be classified into three types: keyword-based systems, parsing-based systems, and neural-based systems.
Keyword-based systems [19, 20, 21, 22] first identify keywords or other domain-specific or domain-independent language patterns in input questions. Then, they map those patterns to entities in the database schema. Parsing-based systems [23, 24, 25, 26] further leverage natural language processing techniques (e.g., part-of-speech tagging, dependency parsing and entity recognition) to derive semantic and syntactic information of input queries and convert them into structural query forms (e.g., SQL). However, both keyword-based and parsing-based systems have limited capability in understanding diverse natural language queries and cannot handle complex reasoning tasks (e.g., question answering). Currently, the surge of many NL-to-SQL benchmark datasets (e.g., ATIS [27], Scholar [28], Academic [25], WiKiSQL [29], Spider [30]) gives rise to many neural-network-based methods [31, 29, 32, 33, 34, 35, 36], which have better natural language understanding abilities and can achieve state-of-the-art (SOTA) performance on NL-to-SQL tasks. They typically use sequence-to-sequence deep learning models (e.g., RNN, transformer) to automatically learn the translation from NL queries to SQL queries. In our work, we choose SmBop [31] as our NL-to-SQL engine. It adopts the transformer-based architecture with semi-autoregressive bottom-up parsing, which has a good performance on the Spider dataset with a faster speed. The Spider dataset contains complex and cross-domain NL questions and SQL queries with a zero-shot setting, where the database schemas and queries of the testing sets are new and unseen in the training sets. SmBop can handle different users’ queries for different domain datasets.
2.2 Natural Language Interfaces for Data Visualization
Prior research has explored how natural language interfaces can be employed to facilitate the interaction with data visualizations and help users comprehend data query and exploration results.
Cox et al. [1] proposed a multimodal NLI that combines direct manipulation with natural language interaction to support data exploration. However, it supports only a small set of visualizations and NL queries without the ability to infer users’ analytical needs. Articulate [2] is a more intelligent NLI that first maps NL queries to some analytical tasks and then decides proper visual encodings based on the tasks and data characteristics. Flowsense [5] leverages semantic parsing techniques to enable NL-based interactions in a dataflow system. It allows users to create and connect data flow components through NL. Since NL can be ambiguous, DataTone [3] detects and presents data ambiguities in users’ NL queries. Users can use the ambiguity widgets in DataTone to interactively resolve ambiguity and derive desired visualizations. Recently, Arpit et al. [17] built a toolkit for creating NLIs to facilitate interaction with data visualizations. It employs NLP techniques (e.g., dependency parsing) to comprehensively analyze NL data queries and further interprets explicit, ambiguous, or implicit references to data attributes, analytical tasks, and visualizations.
Conversation is also an important feature in NLI design for interactive data analysis. Analyza [4] focuses on question-answer features to allow layman users to interact with databases to finish their data exploration tasks. Iris [8] is a conversational agent that can handle a sequence of user commands for complex exploratory tasks. Eviza [6] and Evizeon [7] further improve the interpretation of follow-up questions in conversations, as well as interactions with visualizations. In addition, some commercial products, such as Tableau [37], Microsoft Power BI [38], and ThoughtSpot [39], can provide NL suggestions to help complete the queries for data exploration as users type.
However, all these NLIs only focus on the analysis of existing NL queries for data analysis. Users need to specify their data queries for every exploration step empirically, which is time-consuming and inefficient. These NLIs do not predict and recommend to users what to analyze in the next step. The most related system is Snowy [18], which suggests next-step NL queries for visual data analysis by considering underexplored interesting data subsets. However, it only accepts single table data in CSV format, failing to be applied for more complex data analysis in the industry, where data is often stored in multiple tables in relational databases and accessed by SQL. Moreover, the data interestingness used by Snowy is pre-defined using a fixed set of statistical data properties, which cannot adapt to analytical interests for different application domains. In our work, we target data analysis across multiple tables from different domains. We adopt a data-driven approach and consider both semantics of application domains, and prior relevant user queries for next-step exploration (e.g., data selection, transformation).
2.3 Next-step Query Recommendations for Data Analysis
To further reduce the manual effort for data analysis and insight discovery, many query recommendation techniques have been proposed to assist users in deciding next-step exploration actions. They can be roughly categorized into two groups: interestingness-based and data-driven systems [10].
Interestingness-based systems evaluate the interestingness of data insights (e.g., data subsets) generated by different exploration actions. The interestingness can be defined according to objective measures (e.g., information gain) or subjective criteria (e.g., unexpected values that users have not explored) [40]. The typical recommendations include grouping (e.g., roll-up [41], drill-down [42]), attribute-value pairs [43], data charts [44], and data cubes [45, 46]. However, interestingness measures cannot be well adapted to the various preferences of different users. In contrast, data-driven systems [13, 12, 47, 11] recommend more personalized next-step actions based on prior queries of the current user or other users. The data-driven systems generally assume that if two users share similar query requests, they may be interested in similar aspects of data. Thus, one user’s query can be utilized to make suggestions for the other. Data-driven approaches involve two major steps. First, given a user’s query contexts, the approaches retrieve the most similar query sequences from query logs generated by the same user or other users. Then, it analyzes the retrieved sequences to synthesize the final recommendations of next-step exploration for the current user. However, many data-driven approaches measure the similarity based on prefixes of attributes without considering the semantics of attributes.
In our paper, we propose a data-driven approach that explicitly considers the target analysis domain (e.g., “customer orders”), semantic meanings of user queries, as well as conceptual relationships among a sequence of queries. And it generates exploration recommendations that can adapt to users’ interested domains and query contexts. Furthermore, we incorporate our method into a NLI to enable interactive and user-friendly data exploration.
2.4 Visualization Recommendation for Data Analysis
Visualization recommendation techniques focus on automatically generating proper and desired visualizations for data analysts to explore data and discover insights [48]. Many previous studies adopt rule-based [17, 49, 50, 51] and learning-based [52, 53, 54, 55, 56, 57, 58, 59] approaches to suggest visual encodings of specified data based on data attributes, tasks, and visual perception theory. Moreover, other work [44, 60, 61, 15, 16, 14, 62] builds interactive systems that utilize visualization recommendations to facilitate data exploration. Some systems [44, 60, 61] present data of interest in a series of visualizations based on pre-defined statistical properties (e.g., deviation, outliers, correlation). However, the recommendations do not explicitly consider different users’ preferences. Voyager [15, 16] allows users to specify data or visualization of user interest. Then, the system presents a gallery of recommended visualizations to enable faceted and breath-oriented exploration of data attributes and visual design choices. Dziban [14] further considers the context of data analysis for recommendations. It builds on Draco [52] knowledge base, and employs chart similarity measures introduced in GraphScape [63] to recommend charts that are perceptually similar to a specified “anchored” chart. However, Dziban cannot suggest visualizations for new data attributes.
In this paper, we also develop an interactive system for visual data analysis based on users’ interests and data patterns. Compared to prior visualization recommendation techniques, our work focuses on the usage and recommendation of a series of NL queries to support more effective visual analysis. Users can specify their analytical interests via NL, and the system can respond to their queries with intuitive visualizations and further guide the next-step exploration through NL query recommendations.
3 Design Requirements
We aim to develop a NLI that recommends stepwise exploration actions to data analysts to reduce the manual effort and expertise requirements for data analysis and facilitate interactive insight discovery. To identify the design requirements of QRec-NLI, we first reviewed the design requirements and implementations of previous NLIs for data analysis [1, 2, 3, 4, 5, 6, 7, 8, 17, 25, 26, 18]. We worked closely with our industry collaborators for about five months to collect their feedback on the design requirements for building a NLI that can recommend queries to facilitate their data analysis. Specifically, they are six data analysts (D1-D6) and a data visualization scientist (E1, who is also a co-author of this paper), who are from an international technology company.
Our target users, data analysts, usually rely on some business intelligence (BI) tools (e.g., Tableau and Microsoft Excel) to analyze data from different business domains (e.g., operations), extract data facts manually, and communicate data insights via dashboards. However, they do not necessarily have expertise in every domain and may overlook important analysis actions and data aspects during their data explorations. Thus, they confirmed that it would be very helpful if some intuitive hints could be provided to them to guide their subsequent data exploration. Moreover, they mostly use direct manipulations (e.g., drag and drops) to convert data into dashboards, which is found to be tedious and needs considerable effort in translating data-related problems into interface interactions. Using natural language was perceived to be intuitive and convenient by our users to formulate their data questions that require multiple steps (e.g., data transformation, visualization). During the design process, we carried out weekly meetings with our industry collaborators and iteratively updated design requirements, and implemented system prototypes according to their feedback. Finally, we compiled a list of design requirements, which can be summarized as follows:
R1. Provide easy access to databases via natural language queries. Natural language interaction provides an intuitive and user-friendly way for users to interact with databases and conduct the flow of analysis [8, 4, 6, 7]. Our target users also desire to use NL to quickly formulate their data needs. In addition, to promote data discovery, NLIs need to offer hints on what data exists in databases and what queries systems support [6, 5]. D3 commented that the system should support autocompletion of data attributes when typing a question, helping compile their questions.
R2. Present proper visualizations for the retrieved data from databases. Data visualization is an important and effective approach for analyzing big data and revealing data patterns (e.g., trends, outliers) [1, 2, 3, 17]. Our users also need to generate visualizations to share data insights within the organization. However, most of them (except D1 and D5) do not have expertise in data visualization. They expect that the system can automatically map the attributes and values of retrieved data to proper visualizations.
R3. Recommend next-step exploration actions according to users’ analysis domains and contexts. In practice, data analysts need to explore data from different business domains and empirically extract data insights. However, D1 and D3 pointed out that they often need to spend lots of time finding interesting domain-specific data facts when the dataset is from a domain that they are not very familiar with. Moreover, the large data exploration space and high data complexity in databases make data exploration even more challenging [13, 12]. To reduce manual effort in insight discovery, D3 suggested that the system should present meaningful exploration actions (“which attributes are relevant for the investigated domains”). In addition, data analysis is a subjective and iterative process that involves multiple exploration steps. Analysts may have diverging analysis flows, i.e., their analytical interests can also change during exploration. Thus, the system is expected to offer context-aware recommendations that are dynamically adapted to users’ analytical focuses [9, 10, 18].
R4. Explain the relevance of system responses to users’ queries. We find that not all of the target users have expertise in database query languages (e.g., SQL) and visualization. Thus, the system should explain analysis operations powered by SQL (e.g., attribute selection) and generate visualizations in an understandable manner. D4 said that it would be better if the system could use NL to present suggestions on exploration actions (i.e., SQL-related operations). D3 added that the system needs to demonstrate the mappings between retrieved data and generated visualizations. Besides, D3 stated that the system should link input NL queries with the generated SQL, allowing him to verify if it retrieves the correct data from databases.
R5. Support an easy exploration of query history and data visualizations. Data analysis is a multi-step iterative process. Many of our target users mentioned that they often need to refer back to previous queries, review what insights they derive, and adjust the future exploration path. Afterward, the analysts need to select important data facts and the corresponding visualizations from prior queries and create a complete data story using a dashboard. D1 advised that the system should save and summarize user query sequences and restore prior queries on demand. And D2 recommended that the system needs to further help them organize the queries and visualizations of interest into a dashboard to report data insights.
4 QRec-NLI
Motivated by the derived requirements, we design and implement QRec-NLI (Fig. 1) that can recommend next-step exploration actions to facilitate NL-based interactive and iterative data analysis. In this section, we first give an overview of the system framework. Then, we describe the recommendation model that generates semantically relevant and context-aware analysis actions in detail. Finally, we illustrate the visual components and interaction designs of the user interface.
4.1 System Framework
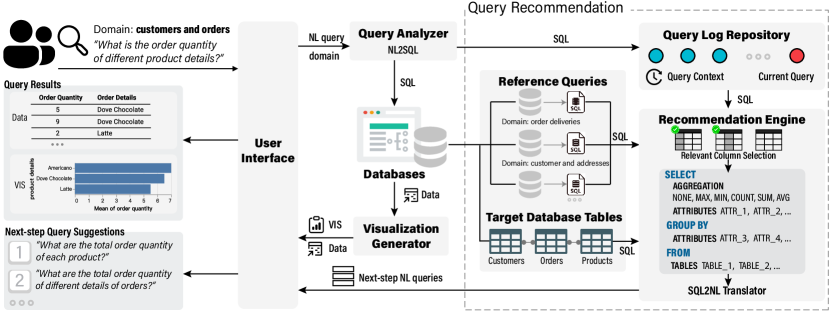
Fig. 2 summarizes the system workflow. After the user loads a database of interest and inputs an NL query through the User Interface, the Query Analyzer translates the input into a SQL query using SmBop [31], a SOTA NL2SQL model, and retrieves the data from databases. Then, the Visualization Generator automatically generates visualizations to show the data based on the data’s properties. Meanwhile, the Recommendation Engine generates a set of next-step exploration suggestions for the Target Database Tables in the form of SQL queries based on the prior user queries in the Query Log Repository and References Queries from databases, The recommendations cover the basic functionalities, including attribute selection, aggregation, and grouping. The suggested queries are then translated into NL using a deep learning model and provided in the User Interface.
4.2 Next-step Exploration Recommendations
We propose a data-driven method to generate semantically relevant and context-aware next-step exploration actions based on all queries made by a current user and reference queries in query databases. When introducing our method, we start by introducing the problem settings and the data form. Then, we describe the four major steps for recommending what to ask next, including (1) reference query preparation, (2) initial exploration action recommendation, (3) context-aware exploration action recommendation, and (4) query recommendation translation.
4.2.1 Problem Setting & Data
We define the problem of next-step query recommendation as follows. Given the database from a target domain (e.g., customer service), the problem is to generate query suggestions in NL according to the current user’s prior queries and historical queries from other users, serving as references. A database is a set of tables containing information about different entities (e.g., product and customer), linked through primary-key foreign-key pairs, describing their relationships.
In our work, the query references are from an external large and cross-domain query dataset , Spider [30], which contains 10,000 diverse and natural user SQL queries, reflecting users’ actual usage of databases. The dataset covers various common and complex SQL patterns and 138 analysis domains, such as commerce, government, and education. It can provide rich and relevant resources for exploring interested domains. We group the reference queries in Spider according to their target domains as , where is a term describing the target domain, is a set of database schemas, and is the user’s SQL queries in . These queries indicate the common analysis focuses of other users, serving as references for recommending queries to new users [11, 12, 13].
In summary, our proposed model inputs the database schema and the analysis domain , the current user’s prior queries , and the reference query dataset . It outputs next-step NL query candidates .
4.2.2 Reference Query Preparation
After the target domain, is decided, the recommendation model first scans the databases and selects the historical queries from semantically relevant domains as reference queries. For example, if a user chooses to explore the data in the “customer order deliveries” domain, historical queries from similar domains (e.g., “customer order addresses”) will be retrieved. These queries show analytical interests from previous users, serving as the references for the current user’s query suggestions. The domain similarities are measured with an embedding-based method. That is, we first transform the terms describing the domain (e.g., “customer order deliveries”) into feature vectors using a SOTA NLP model222Code: https://github.com/UKPLab/sentence-transformers [64] and then measure their cosine similarities in the vector space.
4.2.3 Initial Exploration Action Recommendation
Before the user makes his first query, our model generates a list of SQL queries as suggestions for the first-step exploration. Then the suggestions are translated into natural languages (introduced in Sec. 4.2.5). When generating the SQL queries, we focus on three fundamental functionalities, including attribute selection (i.e., which attributes (i.e., table columns) to analyze), aggregation (i.e., MIN, MAX, COUNT, SUM, AVG), and grouping. The generated SQL queries are in the form of SELECT...FROM...GROUP BY. The WHERE clause (related to the filtering functionality) is not included because the model has to understand the data to suggest insightful filters, which is time-consuming in large databases.
The model first chooses which attributes to analyze from the target database according to the columns’ (or attributes’) “frequency” in the reference queries. Specifically, for each column in , the model computes its semantic similarities with all the columns in SELECT clauses in reference SQL queries. The similarities are measured in the same way as in Sec. 4.2.2 and binarized in a vector with a threshold of 0.5, describing the target column’s relevance to other users’ queries ( means irrelevant and means highly relevant). If is found to be semantically similar to many specified columns in other users’ queries (i.e., frequent), the current user may also be interested in it. Moreover, considering that the current user may be interested in multiple attributes simultaneously, the model finds the frequent attribute combinations by mining frequent co-occurrence patterns among all similarity vectors of table columns in . For example, if two frequent columns (i.e., with many s in their similarity vectors) in have similar similarity vectors, their combination should be recommended for users to explore. To obtain such frequent itemsets of attributes, the model runs FP-Max [65] to efficiently explore long paths that contain many attributes in pattern search trees [66] with large support (i.e., high frequency). In our experience, we find that combinations of frequent attributes are often synonyms (e.g., “cinema”, “film”) or conceptually related (e.g., “order quantity”, “order status”, “order details”). Similarly, the model proposes which attributes are chosen for GROUP BY operations. Then the model decides the aggregate functions for the selected attributes. Specifically, for each selected attribute, the model suggests the aggregations (i.e., MIN, MAX, COUNT, SUM, AVG) frequently applied to its relevant attributes in SELECT clauses of the reference SQL queries.
4.2.4 Context-Aware Exploration Action Recommendation
Since users’ analytical interests may change over time, the model dynamically adapts the subsequent suggestions to users’ prior query contexts after recommending initial exploration actions. Essentially, the model re-ranks the exploration actions ( {attribution selection, grouping, aggregation}) according to a contextual similarity measure (see Eq. 1), which considers the relevance of exploration suggestions to not only other users’ queries in but also the previous queries issued by the current users. The formulation of for each exploration action is:
| (1) | |||
| (2) | |||
where is the latest query, , is the reference queries in , is the next-step exploration queries, is the relevance measure, which is the linear combinations of and (see Eq. 2). calculates the similarity between the table columns specified by exploration action in query and those in query . And the similarity measure follows the method in Sec. 4.2.2. Meanwhile, to find a set of next-step exploration actions for , we extract the top relevant and unexplored table attributes in of , as well as their relevant frequent combinations with the previously explored attributes in using the method in Sec. 4.2.3. Eventually, the model ranks the generated action candidates for according to the contextual relevance measure at each step of query recommendations.
4.2.5 Query Recommendation Translation
To help users understand the proposed top relevant exploration actions (R4), the system translates them into NL . Specifically, to improve the naturalness and authenticity of the generated NL, we finetuned T5-base deep learning model, a SOTA text-to-text transformer, to convert recommended structured SQL queries into NL forms based on the SQL-NL pairs of the Spider dataset (with over 90% accuracy), following the prior work [67].
4.3 Data Visualization
After retrieving data from databases, QRec-NLI generates data visualizations to show the results. The visualization designs are automatically generated according to the type of data. For example, the data of the answer to the query, “the total order quantity of each customer”, are pairs of the total order quantity (Quantitative) and customer (Nominal). This type of data (QN) is visualized in a bar chart. We adopt the framework from NL4DV [17] to map different types of data to a list of visualization candidates from a wide range of common visualization types (e.g., bar chart, line chart, and scatter plot). The visualizations are formulated in vega-lite [68], a high-level visualization language, and rendered in the user interface. For the cases when the data is too complicated and no proper visualization is found to show the results, QRec-NLI presents the raw data in a table. When the data simply contains one element (e.g., “the total order quantity”), QRec-NLI directly displays the data value.
4.4 System Walkthrough
Based on the recommendation model, we build a NLI for data analysts to perform interactive data analysis with step-wise exploration guidance and automatic data visualizations. Moreover, users can create a dashboard to summarize the data insights generated during the exploration process.
In this section, we introduce our system workflow, visual components, and interaction designs through a usage scenario where Andy, a data analyst from a sales department, uses QRec-NLI to perform NL-powered interactive data analysis. Andy is tasked to analyze data about customer behavior in retail stores. In addition, he needs to create a dashboard to inform store managers of the extracted insights into the selling situation and customer characteristics. Although Andy knows about context information about customers and products, he has limited knowledge of SQL and store sales data. He then refers to our system to interactively explore data insights through NL.
4.4.1 Start Initial Exploration
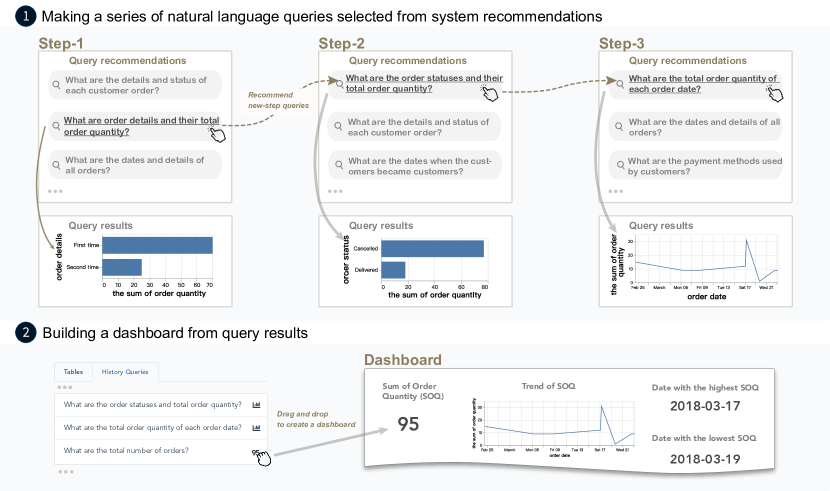
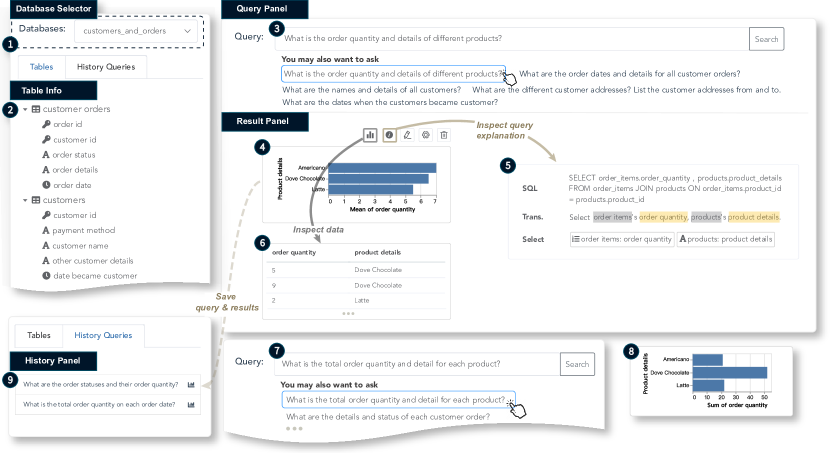
Andy first chooses to explore a customer-oriented sales database in the Database Selector, named “customers_and_orders” (Fig. 3.1). After loading the database, he gains an overview of the data tables and columns of the databases in the Table Info (Fig. 3.2). Afterward, he shifts his attention to the recommended queries in the Query Panel before he starts the initial query. He finds the top five recommendations (Fig. 3.3) are all quite reasonable and clicks the first one “What is the order quantity and details of different products?” to discover the distribution of product order quantity.
4.4.2 NL2SQL Explanation & Data Visualization
After submitting the query, Andy examines the corresponding system response (Fig. 3.4) in the Result Panel. To ensure that QRec-NLI retrieves the correct data from databases, he first refers to the predicted SQL and its explanations (Fig. 3.5) by clicking on \faInfoCircle in the resulting visualization. After reading the highlighted terms (“order items, order quantity”, “products, product details”) in the NL explanation, he realizes that the system retrieves the values of attribute order quantity from the table order items and the values of attribute product details from the table products. Furthermore, he inspects the retrieved data of his query by clicking on \faBarChart in the visualization. Finally, he confirms that the system interprets his query correctly. Then, Andy examines the generated data visualization (Fig. 3.4). The bar chart describes how many orders for each product there are on average. He notices that “Americano” has the largest average number of orders (with the longest bar) while “Latte” has the least average number of orders (with the shortest bars). He would like to investigate more about product orders.
4.4.3 Stepwise Exploration with Query Recommendations
He refers to query recommendations (Fig. 3.7) to know what he can ask about product orders in the next query. Among the suggested queries, he chooses the first one “What is the total order quantity and details for each product?” The resulting bar chart below (Fig. 3.8) shows the total orders for each product, where “Dove Chocolate” has the most orders (with the longest bar). Afterward, he is also interested in analyzing other dimensions of product orders. And he iteratively refers to the recommendations, formulates a series of queries about product orders (e.g., “order details”, “order status”, “order date”) (Fig. 1.1). Meanwhile, he inspects the corresponding visualizations to derive the data insights. For example, A majority of products are ordered for the first time rather than the second time, most product orders are canceled rather than delivered, and a large increase and decrease of product orders are observed between March 17 and March 21.
4.4.4 Dashboard Construction
After several exploration iterations with NL, Andy feels ready to create a dashboard to summarize the data insights. He examines his previous queries in the History Panel (Fig. 3.9) and clicks them to restore the query results in the Result Panel of the system. He then picks several queries and visualizations, which describe the insights about product orders from different dimensions. Eventually, he organizes them into a dashboard by direct manipulation (e.g., drags and drops) (Fig. 1.2). Next, he will use this dashboard to communicate the data insights about product orders with store managers.
5 Evaluation
We conduct a user study to evaluate the effectiveness and usability of QRec-NLI in supporting efficient and systematic interactive data exploration. Specifically, we aim to (1) verify the helpfulness of the next-step query recommendation and (2) overall system effectiveness and usability for insights discovery by comparing our system to a baseline without the recommendation module.
5.1 Experiment Design
To conduct a comparative study, we did not find comparable existing open-sourced NLI systems that can suggest next-step exploration actions. Although some data-driven recommendation techniques [13, 12, 47, 11] exist for exploratory data analysis, they do not investigate the semantic meanings of exploration actions. Also, they have no accessible NL-based interface for interactive data analysis. Therefore, we chose to compare our system to a baseline which is the simplified version of our system without the recommendation module. Specifically, the baseline does not provide users with query suggestions below the input box in the Query Panel (Fig. 3.3). Both QRec-NLI and the baseline support autocompletion of data attributes when users type their NL questions. Furthermore, we analyzed the user behavior during the experiments to see how participants would utilize the recommended NL queries for data exploration.
Tasks and Datasets. Participants were asked to perform data analysis using NLIs in a think-aloud manner given open-ended tasks. Each participant should use QRec-NLI and the baseline to explore two different datasets and extract data insights, respectively. We evaluated the two systems in a counterbalanced order. All participants had a basic understanding of application domains, but they did not know the details about data beforehand. Based on the two datasets, we designed the corresponding open-ended tasks:
-
•
Dataset One: A “customers_and_orders” dataset which contains seven tables, including customer orders, customers, order items, products, addresses, customer addresses, and customer contact channels, and 32 columns in total.
-
•
Task One: The goal is to report some valuable insights to store managers, informing them of the selling situation and customer buying behavior.
-
•
Dataset Two: A “cloud_service_accident” dataset which describes the information about accidents in cloud services (e.g., accident names, accident frequencies, importance levels, regions, departments). It has a fact table with 60 columns and an accident table with five columns.
-
•
Task Two: The goal is to extract data insights to characterize cloud service security events and to notify department managers of security accidents that need to be addressed.
Participants. We recruited 12 participants (P1-P12), ten males and two females, age 18-40, from an international technology company. They used different tools or programming languages for data analysis, such as Python, SQL, Tableau, Microsoft Power BI, and Excel. Regarding the knowledge level of NLI, four participants had experience in developing NLIs, two often used NLIs (e.g., Tableau Ask Data), two were aware of the usage of NLIs but had seldom tried it before the study, and the other four participants said that they have no experience in such tools. When asked to rate their expertise in visualization, eight rated themselves as intermediate users, two rated themselves as experts, and two participants were beginners. All participants have normal vision and hearing and we compensated each participant with $16.
Procedures. The whole user study lasted about 70 minutes on average. Initially, we collected participants’ demographic information and asked their permission to use their personal data generated during the study for research purposes only.
Then, we spent about 15 minutes briefing participants about the background and procedures of our study. We taught them how to use our system and phrase NL queries with a tutorial using an example dataset.
Next, participants were requested to use QRec-NLI and the baseline to finish Task One and Task Two, respectively, where they also needed to create dashboards. Before each task, they were given five minutes to get familiar with the dataset. The order of the systems and tasks is counterbalanced. The time limit for each task is about 15 minutes. The participants could report their data insights early. After each task, they would have another 5 minutes to organize discovered insights into a dashboard and then were asked to finish a questionnaire (Table I) to evaluate our system. Eventually, we conducted post-study interviews with the participants, collecting their feedback on the exploration experience of using the two NLI systems.
| Q1 |
|
||
|---|---|---|---|
| Q2 |
|
||
| Q3 | The system helps me decide my next-step exploration. | ||
| Q4 | The system helps me find reasonable data insights. | ||
| Q5 |
|
||
| Q6 |
|
||
| Q7 |
|
||
| Q8 |
|
||
| Q9 | It is easy to review the query histories and results. | ||
| Q10 |
|
||
| Q11 | It is easy to learn. | ||
| Q12 | It is easy to use. |
5.2 Results and Analysis
5.2.1 Next-step Query Recommendations for Exploration
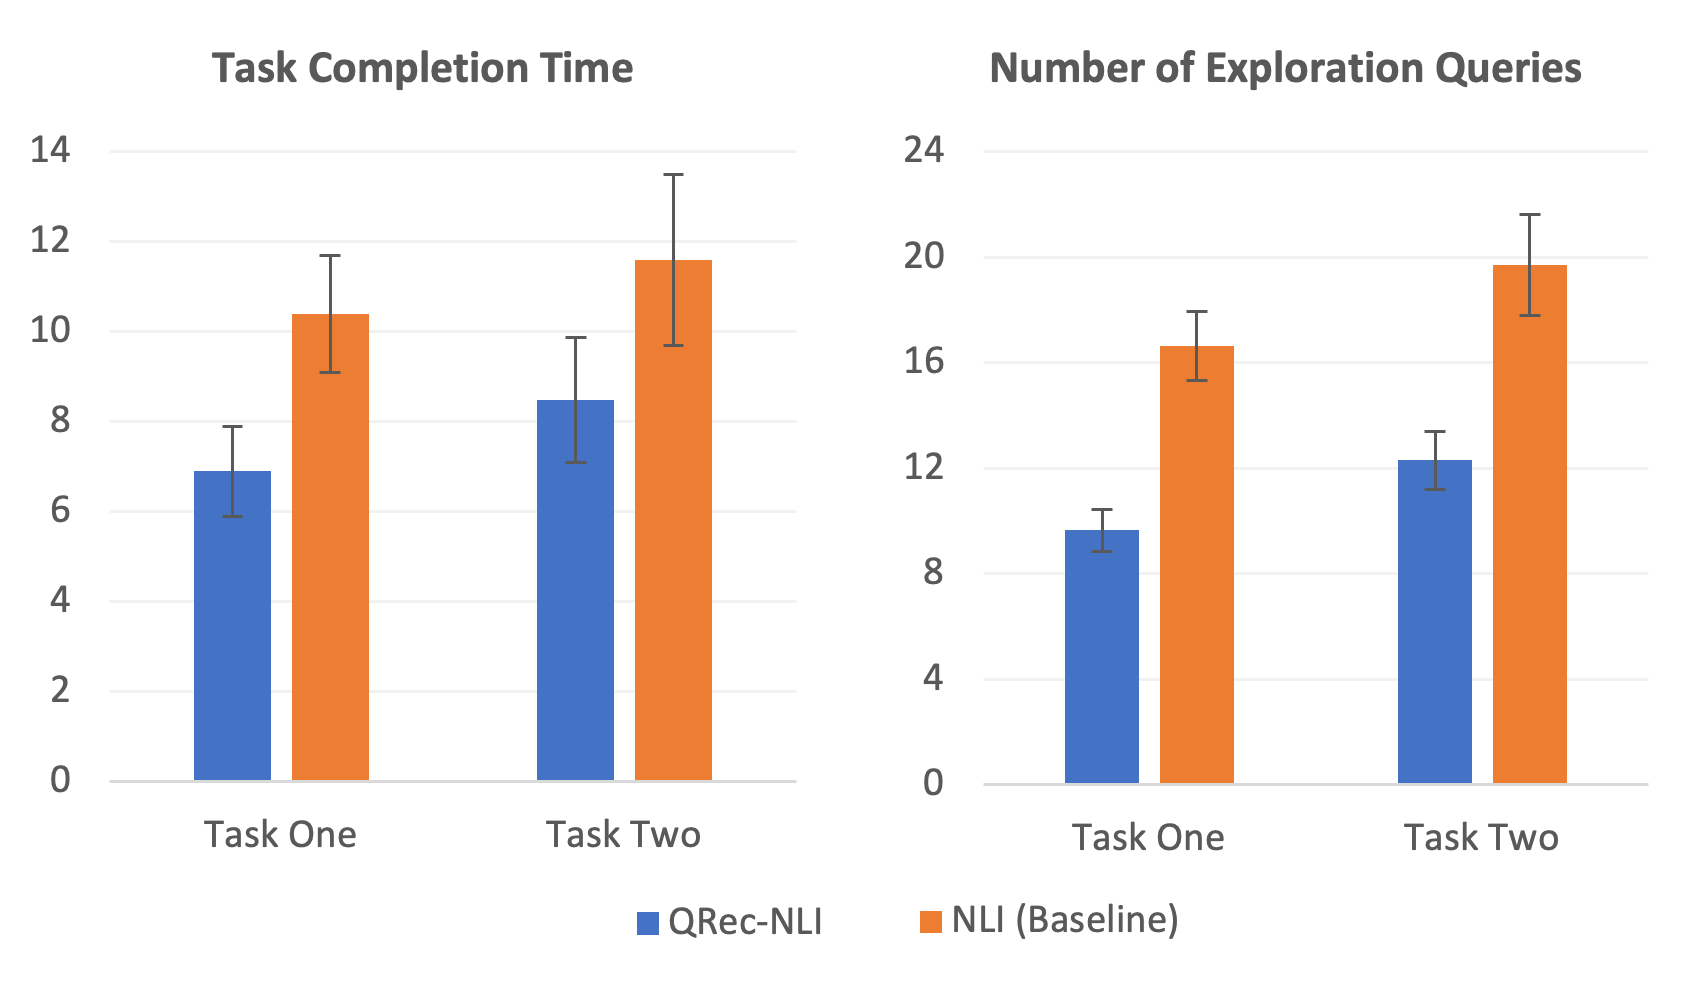
To evaluate the effectiveness of query recommendation for guiding data analysis, we conducted quantitative comparisons between the baseline and QRec-NLI based on participants’ query log data and their ratings. For each participant, we measured the task completion time of identifying desired data insights and the number of corresponding exploration steps (i.e., the number of NL queries) to derive them. As shown in Fig. 4, QRec-NLI outperforms the baseline in terms of shorter task completion time (Task One: , Task Two: ). Also, it reduces the number of exploration steps to gain desired data insights compared to baseline (Task One: , Task Two: ).
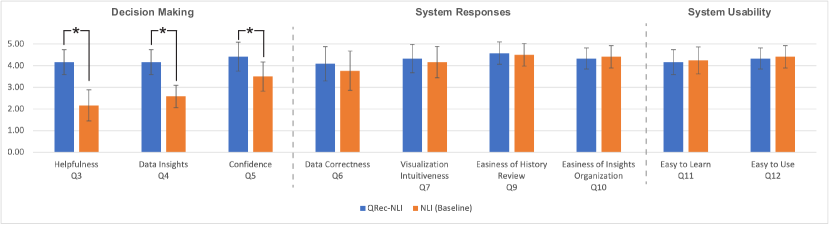
In addition, we compared participants’ ratings of QRec-NLI and the baseline using Wilcoxon signed-rank tests to assess the usefulness of query recommendations for deciding next-step exploration actions. The results (in Fig. 6) show that there is a significant difference between QRec-NLI and the baseline in terms of helpfulness to next-step exploration (Q3: ), reasonable data insights (Q4: ), and decision confidence (Q5: ). It demonstrates that QRec-NLI can more effectively help users decide what to explore next and facilitate data exploration.
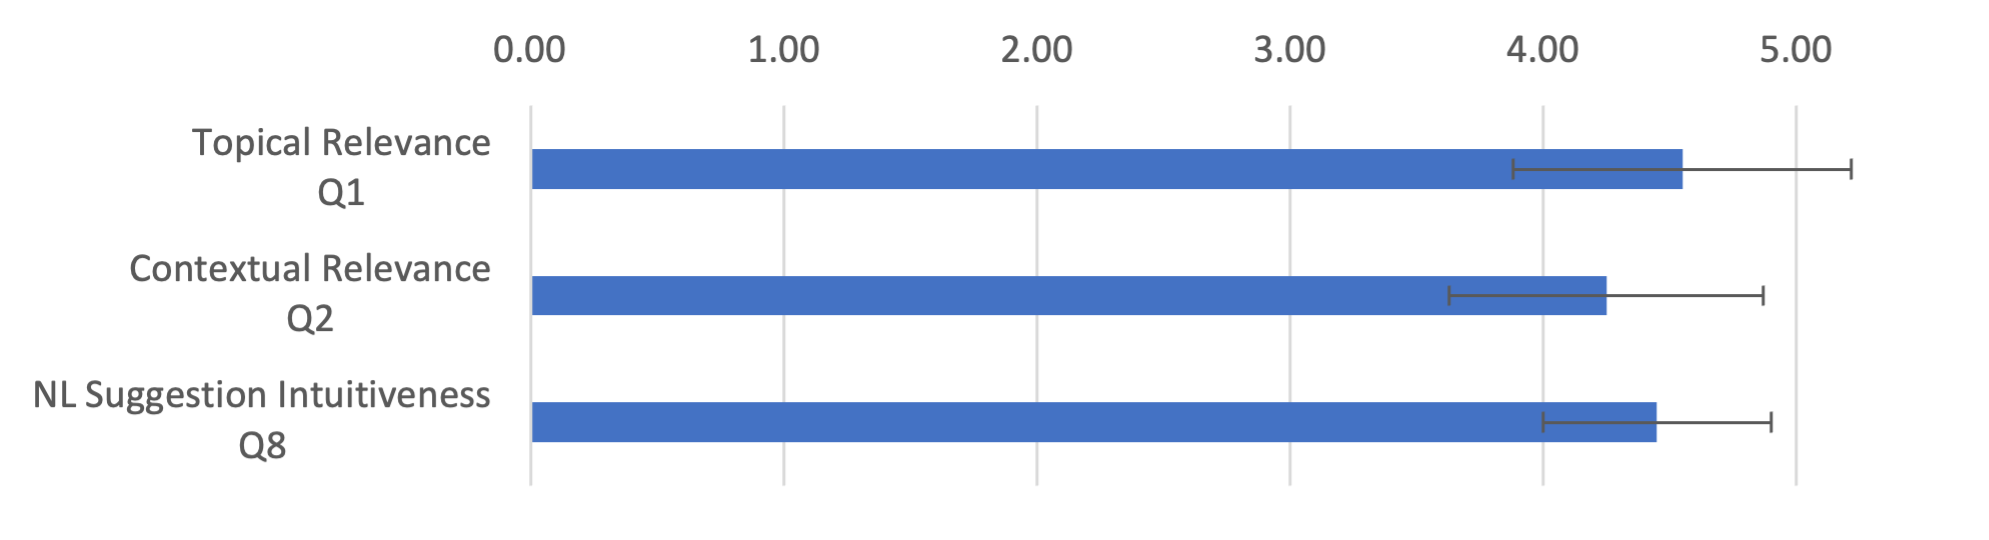
5.2.2 Perceived Query Recommendation Quality
As shown in Fig. 5, participants were positive about the quality of query recommendations generated by QRec-NLI regarding topical and contextual relevance (with ratings over four, , ). For example, P4 commented that he was not very familiar with the domain dataset and struggled to find a proper initial data query using the baseline (“the whole process is very ad-hoc”). On the contrary, QRec-NLI suggested a group of relevant data attributes for the analysis domains (e.g., “order details, quantity, and customer names” for “order” information) and helped him easily decide what to ask in an organized way. In addition, participants confirmed that the recommended queries were able to adapt to their query contexts and helped them gain a comprehensive understanding of data of interest from different perspectives. P6 mentioned “After I explored ‘customer names’ and ‘VIP status’ (in Dataset One), I wanted to see more customer-related information. The system seemed to capture my intent and suggested other relevant and unexplored data attributes, such as ‘customer orders’, ‘customer billing addresses’. I quite enjoyed the data exploration with these useful hints.” P3 commented “The top-ranked results of a series of recommendations are usually semantically coherent, focusing on the topic I am currently interested in.”
However, sometimes participants did not find the desired query in the suggestions. For example, P7 reported “(After reading the recommended queries), I feel more curious about the order quantity for each customer, rather than ‘order quantity’ and ‘product details’ in the recommendations.” Moreover, some participants, especially data analysts with more experience in NLIs, used recommended queries more cautiously. They tended to regard them as starting points for formulating their own queries (e.g., by adding more interested data attributes), or they may directly construct NL questions based on their prior knowledge and experiences. P6 specified “I have some rough ideas about questions in mind. Like, the frequencies of various accidents that happened in different departments (in Dataset Two). But I could not find them in the recommended queries, so I just phrased a question by myself.”
5.2.3 System Responses to Users’ Queries
Visualizations & NL phrasings. According to participants’ ratings on system responses, most of them agreed (with rating scores being at least four) that the visualizations (Q7 in Fig. 6: , ) and NL phrasings of recommendations (Q8 in Fig. 5: , ) are intuitive. P2 said “These charts seem very simple. I have no problem understanding them, though I am not knowledgeable in visualization.” “The system (QRec-NLI) saves me lots of trouble like specifying data for the X-Y axes and what charts to use.” (P5).
Most participants thought that the phrasings of the recommended queries are very natural and easy to understand. They liked the linguistic variation of recommendations, especially how- and wh-questions. P9 commented, “These what questions are very precise and to the point. I also like the straightforward recommended commands”. However, sometimes the phrasings were found a bit wordy. “Instead of directly using ‘active from date’ and ‘active to date’ (in Dataset One) in recommendations, I prefer rephrasing them as ‘range of active date’.” (P7)
History query management. Our participants especially appreciated the convenience of revisiting history queries and data insights (Q9, Q10 with the highest scores in Fig. 6) supported by both QRec-NLI and the baseline. Participants thought that reviewing their prior queries and visualization results made them better aware of what insights had been explored and tracked and how their analytical interests changed over time. They could avoid eliciting duplicate questions in the subsequent exploration steps. P10 added that showing all her history queries helped her formulate new queries (e.g., by integrating previously explored data attributes into a suggested query). Moreover, P2 mentioned “Sometimes, I found several suggested queries very interesting. It is really cool to see that QRec-NLI allows me to go back to previous exploration status and choose other interesting recommended queries (after I explored one of them).”
Many participants praised the direct manipulation of queries of interest in the History Panel (Fig. 3.9), as well as their corresponding data visualizations, for creating a dashboard (Fig. 1.2). One participant applauded, “I had so much fun in dragging and dropping my data queries and visualizations and organizing them into a dashboard.” Another participant added, “The interactive construction of dashboard is useful, and I definitely love to have it in data analytics tools.”
Data correctness. In general, participants thought that the system could correctly interpret their data queries for many cases, (with ratings slightly over four, Q6 in Fig. 6: , ). We observed that when participants entered complex questions with multiple clauses or fuzzy concepts (e.g., “most popular products”), the system could still interpret them correctly using some existing data attributes in datasets (e.g., “most popular product” the product that has the largest number of “orders”). In other cases, when entities in data queries carry ambiguous meanings, the system might misinterpret participants’ analytical intents. For instance, for a participant’s query “important accidents that happen in the ‘Operation and Maintenance’ department”, the system shows the whole distribution of “importance level(s)” of accidents for ‘Operation and Maintenance’ department. However, the participant wanted to know the accident that its “importance level” is “important”.
Interestingly, we found that the data correctness score of our system is still higher than that of the baseline. We speculate that our recommendation module exposed more data knowledge (e.g., attributes) to participants for exploration. It could help them discover and express their data needs in NL to the systems more accurately and clearly.
5.2.4 System Usability
We collected participants’ ratings on system usability (Q11&Q12) and their feedback on their exploration experience using QRec-NLI and the baseline. All participants valued the use of natural language to analyze data, and they generally enjoyed exploring data with query recommendations using QRec-NLI. Most participants acknowledged (with scores being at least four) that QRec-NLI and the baseline are easy to learn (QRec-NLI: , , baseline: , ) and easy to use (QRec-NLI: , , baseline: , ). No significant difference is observed between the two systems based on Wilcoxon signed-rank tests. It implies that the query recommendation module did not impose an additional burden on participants during interactive data analysis. Here, we summarize their qualitative feedback on NL-based exploration experience, as well as suggestions for improvement.
NL-based data analysis. All participants were willing to use NLIs to analyze data. They found it quite convenient and flexible to formulate their data needs using NL. They generally appreciated that NLIs could automatically retrieve and visualize data according to their questions, which saves them much time and effort. One participant P1 commented “They (NLIs) have done all the things for me. I am not bothered with SQLs and data visualization.” Also, they valued that the NLIs used NL to suggest data queries and produce explanations for NL2SQL. It helped them understand the system responses and enhanced their trust in the systems. P3 said that NL explanations of NL2SQL helped him quickly check if NLIs retrieve the correct data.
Suggestions for improvements. Our participants also provided some valuable suggestions. For example, one participant expected QRec-NLI to support multiple languages, while the current system only accepts English queries. One desired a function to adjust the resulting visualization (e.g., chart types, legends). One participant suggested the automatic generation of a dashboard based on the selected queries and data visualizations. Another participant suggested that it would be even better to support more advanced queries and tasks (e.g., sales prediction, anomaly detection of security accidents).
6 Discussion
In this section, we first summarize the lessons we learned in the development of QRec-NLI, including harvest crowd knowledge for data analysis, automation, agency, and flexibility for interactive data analysis, query recommendation transparency and biases, and alternatives to summarize history queries. In addition, we discuss the system limitations.
6.1 Harvest Crowd Knowledge for Data Analysis
When exploring data from different domains, data analysts may not have sufficient knowledge about data and applications to effectively derive valuable data insights. In this paper, we adopt a data-driven approach to retrieve other users’ queries from the domains relevant to the given target data. Then, we synthesize new data queries from retrieved queries using semantic relevance measures. These new queries reflect the analytical interests of the crowd and can be used as references by current users to formulate desired queries. Through user studies, we show that our recommendation algorithm can facilitate effective data exploration and insights discovery for different datasets.
6.2 Automation, Agency, and Adaptiveness for Interactive Data Analysis
Interactive data analysis is a time-consuming process. Users often need to empirically derive a series of data insights for interested domains through many trials and errors. To facilitate the process, QRec-NLI automatically recommends semantically-relevant exploration actions. Users, who remain in the “driver seats”, decide a next-step query by choosing and refining suggested query candidates or constructing a new one based on their prior queries and knowledge about the target domains. In this way, the level of automation and user agency can be balanced [71], while users’ workload is reduced and working efficiency is improved. Furthermore, since different users may have different data needs, it is essential that the query recommendations adapt to users’ query contexts. Our system generates next-step queries by considering their contextual relevance with prior queries of current users. Participants in the user study found our system can adapt to their analytical interests (e.g., customer-related information) by suggesting relevant data attributes from different aspects.
Nevertheless, QRec-NLI is still an initial step towards combining automation and agency to achieve adaptive data analysis. More research is still highly needed. For example, further research is necessary to evaluate to what extent participants rely on machine-generated suggestions. It is also interesting to check how these suggestions influence participants’ thinking process during data analysis.
6.3 Query Recommendation Transparency and Biases
For query recommendation techniques, transparency is crucial to prevent users from discovering false data insights and to enhance users’ trust in these techniques. During the design process, our target users pointed out that the system should explain the relevance of system responses to their data queries in an understandable manner (e.g., through data visualization, NL). According to participants’ feedback during evaluation, they appreciated the intuitive NL explanations for the NL2SQL model, which allows them to verify if the model retrieves the right data for subsequent data analysis. Some of them inspected retrieved raw data and verified the correctness of NL query interpretations. Besides, other participants identified the undesired query recommendations by examining the resulting data visualizations.
However, potential biases could still exist in our recommendation algorithm since it only considers the coverage and semantics of data attributes. To further mitigate negative effects (e.g., blind trust) of such issues, we can consider alerting users when algorithm biases occur (e.g., using some bias metrics [72] or visualizing model uncertainty [73]). In addition, we can design user interactions that help users convey their preferences of suggested queries to penalize or reward some types of recommendations.
6.4 Alternatives to Summarize History Queries
Interactive data analysis usually involves multiple exploration steps. During the design process, data analysts mentioned that they need to be aware of what queries they make and possibly adjust their future exploration paths. Our system directly displays all history queries and their results preview in a list (Fig. 3.9) and allows users to click on queries of interest to restore data visualization for a quick review. In addition, users are enabled to organize a group of queries and data visualization into a dashboard (Fig. 1.2) to convey discovered data insights. During user studies, our participants favored the interaction designs of query management. The future NLI systems can consider design alternatives to explore history queries (e.g., reveal relationships among queries and group queries according to different criteria).
6.5 Limitations
Enable more data operations. Our system recommends three basic types of exploration actions for data analysis, including attribute selection, data grouping, and aggregation. More complex data operations need to be considered to enhance the system utility in the future, for example, arithmetic operations (i.e., multiplication, addition, subtraction, and division) of attribute values and data filtering. In addition, our query recommendation techniques consider the semantics of SQL queries. Other language features (e.g., ontology) can be utilized to characterize data queries.
Semantic-driven recommendations with noisy headers. QRec-NLI recommends next-step queries by considering the semantic relationships among dataset columns/headers and users’ queries. The dataset headers need to be curated (as they may be noisy in practice) before using our system for data analysis.
Support interactive correction of NL2SQL. We explain NL2SQL results by highlighting SQL components with NL and presenting resulting raw data in a table. It allows users to quickly check if the system correctly interprets their data queries. However, the system does not support the correction of the system mistakes. And users need to try different ways of NL expressions to derive desired results. To mitigate this issue, the system should enable users to interactively correct the system errors [74, 75].
7 Conclusion and Future Work
To facilitate interactive data analysis, we designed and implemented QRec-NLI, an intelligent NLI that is able to generate step-wise semantically relevant and context-aware natural language query recommendations. Specifically, we focus on recommending three typical types of data operations, including attribute selection, grouping, and aggregation. After users elicit the data queries guided by recommendations, the system will automatically retrieve the corresponding data from databases and generate proper visualizations to reveal data insights. Moreover, users are enabled to review their prior queries and results and further organize them into a dashboard. We conducted a user study to evaluate QRec-NLI in comparison to a baseline NLI without the recommendation module. The results demonstrate that our system better facilitates users with a more systematic and effective data analysis process.
In future work, we would like to enhance the system usability by adding more functions (e.g., automatic dashboard generation) and supporting more languages. We plan to integrate our system into a data analytics platform of our industry collaborator. By collecting more user query data from the industry platform, we can further enhance the query recommendation model and adapt it to more complex business applications. Further, longitudinal studies with more data analysts will further validate the system usability and effectiveness for interactive data analysis.
References
- [1] K. Cox, R. E. Grinter, S. L. Hibino, L. J. Jagadeesan, and D. Mantilla, “A multi-modal natural language interface to an information visualization environment,” International Journal of Speech Technology, vol. 4, no. 3, pp. 297–314, 2001.
- [2] Y. Sun, J. Leigh, A. Johnson, and S. Lee, “Articulate: A semi-automated model for translating natural language queries into meaningful visualizations,” in International Symposium on Smart Graphics. Springer, 2010, pp. 184–195.
- [3] T. Gao, M. Dontcheva, E. Adar, Z. Liu, and K. G. Karahalios, “Datatone: Managing ambiguity in natural language interfaces for data visualization,” in Proceedings of the 28th Annual ACM Symposium on User Interface Software & Technology, 2015, pp. 489–500.
- [4] K. Dhamdhere, K. S. McCurley, R. Nahmias, M. Sundararajan, and Q. Yan, “Analyza: Exploring data with conversation,” in Proceedings of the 22nd International Conference on Intelligent User Interfaces, 2017, pp. 493–504.
- [5] B. Yu and C. T. Silva, “Flowsense: A natural language interface for visual data exploration within a dataflow system,” IEEE Transactions on Visualization and Computer Graphics, vol. 26, no. 1, pp. 1–11, 2019.
- [6] V. Setlur, S. E. Battersby, M. Tory, R. Gossweiler, and A. X. Chang, “Eviza: A natural language interface for visual analysis,” in Proceedings of the 29th Annual Symposium on User Interface Software and Technology, 2016, pp. 365–377.
- [7] E. Hoque, V. Setlur, M. Tory, and I. Dykeman, “Applying pragmatics principles for interaction with visual analytics,” IEEE Transactions on Visualization and Computer Graphics, vol. 24, no. 1, pp. 309–318, 2017.
- [8] E. Fast, B. Chen, J. Mendelsohn, J. Bassen, and M. S. Bernstein, “Iris: A conversational agent for complex tasks,” in Proceedings of the CHI Conference on Human Factors in Computing Systems, 2018, pp. 1–12.
- [9] A. Sordoni, Y. Bengio, H. Vahabi, C. Lioma, J. Grue Simonsen, and J.-Y. Nie, “A hierarchical recurrent encoder-decoder for generative context-aware query suggestion,” in Proceedings of the 24th ACM International Conference on Information and Knowledge Management, 2015, pp. 553–562.
- [10] T. Milo and A. Somech, “Automating exploratory data analysis via machine learning: An overview,” in Proceedings of the ACM SIGMOD International Conference on Management of Data, 2020, pp. 2617–2622.
- [11] G. Chatzopoulou, M. Eirinaki, and N. Polyzotis, “Query recommendations for interactive database exploration,” in International Conference on Scientific and Statistical Database Management. Springer, 2009, pp. 3–18.
- [12] J. Aligon, E. Gallinucci, M. Golfarelli, P. Marcel, and S. Rizzi, “A collaborative filtering approach for recommending olap sessions,” Decision Support Systems, vol. 69, pp. 20–30, 2015.
- [13] T. Milo and A. Somech, “Next-step suggestions for modern interactive data analysis platforms,” in Proceedings of the 24th ACM SIGKDD International Conference on Knowledge Discovery & Data Mining, 2018, pp. 576–585.
- [14] H. Lin, D. Moritz, and J. Heer, “Dziban: Balancing agency & automation in visualization design via anchored recommendations,” in Proceedings of the 2020 CHI Conference on Human Factors in Computing Systems, 2020, pp. 1–12.
- [15] K. Wongsuphasawat, D. Moritz, A. Anand, J. Mackinlay, B. Howe, and J. Heer, “Voyager: Exploratory analysis via faceted browsing of visualization recommendations,” IEEE transactions on visualization and computer graphics, vol. 22, no. 1, pp. 649–658, 2015.
- [16] K. Wongsuphasawat, Z. Qu, D. Moritz, R. Chang, F. Ouk, A. Anand, J. Mackinlay, B. Howe, and J. Heer, “Voyager 2: Augmenting visual analysis with partial view specifications,” in Proceedings of the 2017 CHI Conference on Human Factors in Computing Systems, 2017, pp. 2648–2659.
- [17] A. Narechania, A. Srinivasan, and J. Stasko, “Nl4dv: A toolkit for generating analytic specifications for data visualization from natural language queries,” IEEE Transactions on Visualization and Computer Graphics, vol. 27, no. 2, pp. 369–379, 2020.
- [18] A. Srinivasan and V. Setlur, “Snowy: Recommending utterances for conversational visual analysis,” in The 34th Annual ACM Symposium on User Interface Software and Technology, 2021, pp. 864–880.
- [19] E. Kaufmann, A. Bernstein, and L. Fischer, “Nlp-reduce: A naive but domainindependent natural language interface for querying ontologies,” in 4th European Semantic Web Conference ESWC. Springer, 2007, pp. 1–2.
- [20] A. Simitsis, G. Koutrika, and Y. Ioannidis, “Précis: from unstructured keywords as queries to structured databases as answers,” The VLDB Journal, vol. 17, no. 1, pp. 117–149, 2008.
- [21] G. Zenz, X. Zhou, E. Minack, W. Siberski, and W. Nejdl, “From keywords to semantic queries—incremental query construction on the semantic web,” Journal of Web Semantics, vol. 7, no. 3, pp. 166–176, 2009.
- [22] S. Shekarpour, E. Marx, A.-C. N. Ngomo, and S. Auer, “Sina: Semantic interpretation of user queries for question answering on interlinked data,” Journal of Web Semantics, vol. 30, pp. 39–51, 2015.
- [23] D. Saha, A. Floratou, K. Sankaranarayanan, U. F. Minhas, A. R. Mittal, and F. Özcan, “Athena: An ontology-driven system for natural language querying over relational data stores,” Proceedings of the VLDB Endowment, vol. 9, no. 12, pp. 1209–1220, 2016.
- [24] E. Kaufmann, A. Bernstein, and R. Zumstein, “Querix: A natural language interface to query ontologies based on clarification dialogs,” in 5th International Semantic Web Conference. Citeseer, 2006, pp. 980–981.
- [25] F. Li and H. V. Jagadish, “Constructing an interactive natural language interface for relational databases,” Proceedings of the VLDB Endowment, vol. 8, no. 1, pp. 73–84, 2014.
- [26] ——, “Nalir: an interactive natural language interface for querying relational databases,” in Proceedings of the ACM SIGMOD International Conference on Management of Data, 2014, pp. 709–712.
- [27] P. Price, “Evaluation of spoken language systems: The atis domain,” in Speech and Natural Language: Proceedings of a Workshop Held at Hidden Valley, Pennsylvania, June 24-27, 1990, 1990.
- [28] S. Iyer, I. Konstas, A. Cheung, J. Krishnamurthy, and L. Zettlemoyer, “Learning a neural semantic parser from user feedback,” in Proceedings of the 55th Annual Meeting of the Association for Computational Linguistics, 2017, pp. 963–973.
- [29] V. Zhong, C. Xiong, and R. Socher, “Seq2sql: Generating structured queries from natural language using reinforcement learning,” arXiv preprint arXiv:1709.00103, 2017.
- [30] T. Yu, R. Zhang, K. Yang, M. Yasunaga, D. Wang, Z. Li, J. Ma, I. Li, Q. Yao, S. Roman et al., “Spider: A large-scale human-labeled dataset for complex and cross-domain semantic parsing and text-to-sql task,” in Proceedings of the Conference on Empirical Methods in Natural Language Processing, 2018, pp. 3911–3921.
- [31] O. Rubin and J. Berant, “Smbop: Semi-autoregressive bottom-up semantic parsing,” 2021, pp. 311–324.
- [32] J. Guo, Z. Zhan, Y. Gao, Y. Xiao, J.-G. Lou, T. Liu, and D. Zhang, “Towards complex text-to-sql in cross-domain database with intermediate representation,” in Proceedings of the 57th Annual Meeting of the Association for Computational Linguistics, 2019, pp. 4524–4535.
- [33] B. Wang, R. Shin, X. Liu, O. Polozov, and M. Richardson, “Rat-sql: Relation-aware schema encoding and linking for text-to-sql parsers,” in Proceedings of the 58th Annual Meeting of the Association for Computational Linguistics, 2020, pp. 7567–7578.
- [34] B. Bogin, M. Gardner, and J. Berant, “Representing schema structure with graph neural networks for text-to-sql parsing,” in Proceedings of the 57th Annual Meeting of the Association for Computational Linguistics, 2019, pp. 4560–4565.
- [35] X. Xu, C. Liu, and D. Song, “Sqlnet: Generating structured queries from natural language without reinforcement learning,” arXiv preprint arXiv:1711.04436, 2017.
- [36] T. Yu, M. Yasunaga, K. Yang, R. Zhang, D. Wang, Z. Li, and D. Radev, “Syntaxsqlnet: Syntax tree networks for complex and cross-domain text-to-sql task,” in Proceedings of the Conference on Empirical Methods in Natural Language Processing, 2018, pp. 1653–1663.
- [37] https://www.tableau.com/, (Accessed on 10/1/2022).
- [38] https://powerbi.microsoft.com, (Accessed on 10/1/2022).
- [39] https://www.thoughtspot.com/, (Accessed on 10/1/2022).
- [40] L. Geng and H. J. Hamilton, “Interestingness measures for data mining: A survey,” ACM Computing Surveys (CSUR), vol. 38, no. 3, 2006.
- [41] G. Sathe and S. Sarawagi, “Intelligent rollups in multidimensional olap data,” in Proceedings of 27th International Conference on Very Large Data Bases. Morgan Kaufmann, 2001, pp. 531–540.
- [42] M. Joglekar, H. Garcia-Molina, and A. Parameswaran, “Interactive data exploration with smart drill-down,” IEEE Transactions on Knowledge and Data Engineering, vol. 31, no. 1, pp. 46–60, 2017.
- [43] M. Drosou and E. Pitoura, “Ymaldb: exploring relational databases via result-driven recommendations,” The VLDB Journal, vol. 22, no. 6, pp. 849–874, 2013.
- [44] M. Vartak, S. Rahman, S. Madden, A. Parameswaran, and N. Polyzotis, “Seedb: Efficient data-driven visualization recommendations to support visual analytics,” in Proceedings of the VLDB Endowment, vol. 8, no. 13, 2015, pp. 2182–2193.
- [45] S. Sarawagi, R. Agrawal, and N. Megiddo, “Discovery-driven exploration of olap data cubes,” in International Conference on Extending Database Technology. Springer, 1998, pp. 168–182.
- [46] S. Sarawagi, “User-adaptive exploration of multidimensional data,” in Proceedings of 26th International Conference on Very Large Data Bases. Morgan Kaufmann, 2000, pp. 307–316.
- [47] M. Eirinaki, S. Abraham, N. Polyzotis, and N. Shaikh, “Querie: Collaborative database exploration,” IEEE Transactions on Knowledge and Data Engineering, vol. 26, no. 7, pp. 1778–1790, 2013.
- [48] Z. Zeng, P. Moh, F. Du, J. Hoffswell, T. Y. Lee, S. Malik, E. Koh, and L. Battle, “An evaluation-focused framework for visualization recommendation algorithms,” IEEE Transactions on Visualization and Computer Graphics, 2021.
- [49] J. Mackinlay, “Automating the design of graphical presentations of relational information,” ACM Transactions On Graphics, vol. 5, no. 2, pp. 110–141, 1986.
- [50] J. Mackinlay, P. Hanrahan, and C. Stolte, “Show me: Automatic presentation for visual analysis,” IEEE transactions on visualization and computer graphics, vol. 13, no. 6, pp. 1137–1144, 2007.
- [51] K. Wongsuphasawat, D. Moritz, A. Anand, J. Mackinlay, B. Howe, and J. Heer, “Towards a general-purpose query language for visualization recommendation,” in Proceedings of the Workshop on Human-In-the-Loop Data Analytics, 2016, pp. 1–6.
- [52] D. Moritz, C. Wang, G. L. Nelson, H. Lin, A. M. Smith, B. Howe, and J. Heer, “Formalizing visualization design knowledge as constraints: Actionable and extensible models in draco,” IEEE transactions on visualization and computer graphics, vol. 25, no. 1, pp. 438–448, 2018.
- [53] Y. Luo, X. Qin, N. Tang, and G. Li, “Deepeye: Towards automatic data visualization,” in 2018 IEEE 34th international conference on data engineering (ICDE). IEEE, 2018, pp. 101–112.
- [54] V. Dibia and Ç. Demiralp, “Data2vis: Automatic generation of data visualizations using sequence-to-sequence recurrent neural networks,” IEEE computer graphics and applications, vol. 39, no. 5, pp. 33–46, 2019.
- [55] K. Hu, M. A. Bakker, S. Li, T. Kraska, and C. Hidalgo, “Vizml: A machine learning approach to visualization recommendation,” in Proceedings of the 2019 CHI Conference on Human Factors in Computing Systems, 2019, pp. 1–12.
- [56] X. Qian, R. A. Rossi, F. Du, S. Kim, E. Koh, S. Malik, T. Y. Lee, and J. Chan, “Learning to recommend visualizations from data,” ser. KDD ’21. New York, NY, USA: Association for Computing Machinery, 2021, p. 1359–1369. [Online]. Available: https://doi.org/10.1145/3447548.3467224
- [57] H. Li, Y. Wang, S. Zhang, Y. Song, and H. Qu, “Kg4vis: A knowledge graph-based approach for visualization recommendation,” IEEE Transactions on Visualization and Computer Graphics, 2021.
- [58] D. Deng, A. Wu, H. Qu, and Y. Wu, “Dashbot: Insight-driven dashboard generation based on deep reinforcement learning,” IEEE Transactions on Visualization and Computer Graphics, 2022.
- [59] A. Wu, Y. Wang, M. Zhou, X. He, H. Zhang, H. Qu, and D. Zhang, “Multivision: Designing analytical dashboards with deep learning based recommendation,” IEEE Transactions on Visualization and Computer Graphics, vol. 28, no. 1, pp. 162–172, 2021.
- [60] A. Key, B. Howe, D. Perry, and C. Aragon, “Vizdeck: self-organizing dashboards for visual analytics,” in Proceedings of the 2012 ACM SIGMOD International Conference on Management of Data, 2012, pp. 681–684.
- [61] Ç. Demiralp, P. J. Haas, S. Parthasarathy, and T. Pedapati, “Foresight: Rapid data exploration through guideposts,” arXiv preprint arXiv:1709.10513, 2017.
- [62] D. Raghunandan, Z. Cui, K. Krishnan, S. Tirfe, S. Shi, T. D. Shrestha, L. Battle, and N. Elmqvist, “Lodestar: Supporting independent learning and rapid experimentation through data-driven analysis recommendations,” in Proceedings of the Symposium on Visualization in Data Science, 2021. [Online]. Available: https://users.umiacs.umd.edu/~elm/projects/lodestar/lodestar.pdf
- [63] Y. Kim, K. Wongsuphasawat, J. Hullman, and J. Heer, “Graphscape: A model for automated reasoning about visualization similarity and sequencing,” in Proceedings of the 2017 CHI Conference on Human Factors in Computing Systems, 2017, pp. 2628–2638.
- [64] N. Reimers and I. Gurevych, “Sentence-bert: Sentence embeddings using siamese bert-networks,” in Proceedings of the Conference on Empirical Methods in Natural Language Processing, 2019, pp. 3980–3990.
- [65] G. Grahne and J. Zhu, “Efficiently using prefix-trees in mining frequent itemsets.” in Proceedings of the ICDM Workshop on Frequent Itemset Mining Implementations,, vol. 90, 2003, p. 65.
- [66] J. Han, J. Pei, and Y. Yin, “Mining frequent patterns without candidate generation,” in Proceedings of the ACM SIGMOD International Conference on Management of Data, 2000, pp. 1–12.
- [67] T. Xie, C. H. Wu, P. Shi, R. Zhong, T. Scholak, M. Yasunaga, C.-S. Wu, M. Zhong, P. Yin, S. I. Wang et al., “Unifiedskg: Unifying and multi-tasking structured knowledge grounding with text-to-text language models,” arXiv preprint arXiv:2201.05966, 2022.
- [68] A. Satyanarayan, D. Moritz, K. Wongsuphasawat, and J. Heer, “Vega-lite: A grammar of interactive graphics,” IEEE transactions on visualization and computer graphics, vol. 23, no. 1, pp. 341–350, 2016.
- [69] M. Lease, “On quality control and machine learning in crowdsourcing,” in Workshops at the Twenty-Fifth AAAI Conference on Artificial Intelligence, 2011.
- [70] C. Eickhoff, “Cognitive biases in crowdsourcing,” in Proceedings of the eleventh ACM international conference on web search and data mining, 2018, pp. 162–170.
- [71] J. Heer, “Agency plus automation: Designing artificial intelligence into interactive systems,” Proceedings of the National Academy of Sciences, vol. 116, no. 6, pp. 1844–1850, 2019.
- [72] E. Wall, L. M. Blaha, L. Franklin, and A. Endert, “Warning, bias may occur: A proposed approach to detecting cognitive bias in interactive visual analytics,” in 2017 IEEE Conference on Visual Analytics Science and Technology (VAST). IEEE, 2017, pp. 104–115.
- [73] J. Hullman, X. Qiao, M. Correll, A. Kale, and M. Kay, “In pursuit of error: A survey of uncertainty visualization evaluation,” IEEE transactions on visualization and computer graphics, vol. 25, no. 1, pp. 903–913, 2018.
- [74] A. Narechania, A. Fourney, B. Lee, and G. Ramos, “Diy: Assessing the correctness of natural language to sql systems,” in 26th International Conference on Intelligent User Interfaces, 2021, pp. 597–607.
- [75] A. Elgohary, S. Hosseini, and A. H. Awadallah, “Speak to your parser: Interactive text-to-sql with natural language feedback,” arXiv preprint arXiv:2005.02539, 2020.
![[Uncaptioned image]](/html/2201.04868/assets/draft/profiles/xingbo.jpeg) |
Xingbo Wang is currently a postdoctoral fellow in the Department of Computer Science and Engineering at the Hong Kong University of Science and Technology (HKUST), where he obtained his Ph.D. in 2022. He received a B.E. degree from Wuhan University, China in 2018. His research interests include multimedia visualization, interactive machine learning for natural language processing (NLP). For more details, please refer to https://andy-xingbowang.com/. |
![[Uncaptioned image]](/html/2201.04868/assets/draft/profiles/furui.jpeg) |
Furui Cheng is a Ph.D. candidate in the Department of Computer Science and Engineering at the Hong Kong University of Science and Technology (HKUST). He obtained a B.E. degree from Beihang University, China, in 2018. His research interests include visual analytics, eXplainable AI (XAI), and biomedical AI. |
![[Uncaptioned image]](/html/2201.04868/assets/draft/profiles/wangyong-2020.jpeg) |
Yong Wang is currently an assistant professor in School of Computing and Information Systems at Singapore Management University. His research interests include data visualization, visual analytics and explainable machine learning. He obtained his Ph.D. in Computer Science from Hong Kong University of Science and Technology in 2018. He received his B.E. and M.E. from Harbin Institute of Technology and Huazhong University of Science and Technology, respectively. For more details, please refer to http://yong-wang.org. |
![[Uncaptioned image]](/html/2201.04868/assets/draft/profiles/ke-xu.jpeg) |
Ke Xu is currently a scientist in the Data Intelligence Lab at HUAWEI Cloud. Before joining Huawei, he was a postdoctoral research associate in the Visualization and Data Analytics Research Center (VIDA) at New York University (NYU). He obtained his Ph.D. in the Department of Electronic and Computer Engineering at the Hong Kong University of Science and Technology in 2019, and B.S. in Electronic Science and Engineering from Nanjing University, China in 2015. His research interests include data visualization, human-computer interaction, with focus on visual anomaly detection and explainable AI. |
![[Uncaptioned image]](/html/2201.04868/assets/draft/profiles/jiang-long.jpg) |
Jiang Long is the chief architect of Huawei Cloud Data Platform and the head of Huawei Data Intelligence Innovation Lab. Prior to joining Huawei, he was a senior product expert of Alibaba Group and a senior operation expert of Alipay. Before Alibaba, he was an operation and maintenance expert of Tencent data center. His research intersts are in data intelligence, data analysis, data decision-making, data governance, data product planning and design, operation and maintenance product planning and design, data center management. |
![[Uncaptioned image]](/html/2201.04868/assets/draft/profiles/hong-lu.png) |
Hong Lu is the principle data scientist at Huawei Cloud and the director of Huawei Cloud Data Intelligence Lab. Prior to joining Huawei, Hong has served as the head of data platform and data science technology in many well-known companies in the world. She has more than 20 years of experience in database, big data, data warehouse, data lake, business intelligence, data-driven decision making, AI and other fields. |
![[Uncaptioned image]](/html/2201.04868/assets/draft/profiles/huamin-qu.jpeg) |
Huamin Qu is a professor in the Department of Computer Science and Engineering (CSE) at the Hong Kong University of Science and Technology (HKUST) and also the director of the interdisciplinary program office (IPO) of HKUST. He obtained a BS in Mathematics from Xi’an Jiaotong University, China, an MS and a PhD in Computer Science from the Stony Brook University. His main research interests are in visualization and human-computer interaction, with focuses on urban informatics, social network analysis, E-learning, text visualization, and explainable artificial intelligence. |