Study of changes in the pulsation period of 148 Galactic Cepheid variables
Abstract
Investigating period changes of classical Cepheids through the framework of O-C diagrams provides a unique insight to the evolution and nature of these variable stars. In this work, the new or extended diagrams for 148 Galactic classical Cepheids are presented. By correlating the calculated period change rates with the Gaia EDR3 colours, we obtain observational indications for the non-negligible dependence of the period change rate on the horizontal position within the instability strip. We find period fluctuations in 59 Cepheids with a confidence level of 99%, which are distributed uniformly over the inspected period range. Correlating the fluctuation amplitude with the pulsation period yields a clear dependence, similar to the one valid for longer period pulsating variable stars. The non-negligible amount of Cepheids showing changes in their diagrams that are not or not only of evolutionary origin points toward the need for further studies for the complete understanding of these effects. One such peculiar behaviour is the large amplitude period fluctuation in short period Cepheids, which occurs in a significant fraction of the investigated stars. The period dependence of the fluctuation strength and its minimum at the bump Cepheid region suggests a stability enhancing mechanism for this period range, which agrees with current pulsation models.
keywords:
Stars: variables: Cepheids – binaries: general – stars: oscillations – stars: evolution1 Introduction
The classical Cepheid variable stars (hereafter Cepheids) are objects of fundamental importance for both stellar astrophysics and extragalactic distance determination. These variables represent a brief phase in the post-main-sequence evolution of intermediate-mass (4-12 M⊙) central helium burning stars, which populate the classical instability strip in the Hertzsprung–Russell (H–R) diagram. Their importance lies in the periodic variability of these objects: the characteristic feature of their pulsation, the period, allows for the calibration of the cosmic distance ladder and an independent estimation of the Hubble constant via the famous period-luminosity (PL) relation (Freedman et al., 2001; Riess et al., 2019) or its reddening free formulation (Wesenheit function). Measuring the exact value of the period and the rate of its change can also give implications on the physical parameters of these stars and their evolution using pulsation (Bono et al., 1999; Marconi et al., 2010) and evolutionary models that take into account various recently discovered effects, e.g. realistic core overshooting and meridional mixing from rapid rotation (Maeder & Meynet, 2001; Anderson et al., 2014). It has been shown that, apart from the pulsation period, which is obviously the most crucial property for these variables, light curve parameters (amplitude, skewness and acuteness) can play an important role in the estimation of physical properties (Bellinger et al., 2020), however, the role of period changes on the precision of these estimations has not been investigated. Since Cepheids in different locations within the instability strip exhibit different period change rates, these values can be used to infer the probable value of physical properties of the stars, as well (Turner et al., 2006).
The pulsation period of Cepheids can change for multiple reasons. In most cases, the physical process behind these changes is stellar evolution, i.e. the movement of the Cepheid on the H–R diagram. This trajectory through the instability strip is associated with changes in the physical properties, which in turn change the period of pulsation: if the star evolves towards the cool edge of the instability strip, the period increases, while it decreases when evolving towards the hot edge. Superimposed on the curve corresponding to stellar evolution, low-frequency quasi-cyclic period variations can also appear, e.g., in the case of S Vul (Mahmoud & Szabados, 1980), several long-period Cepheids in the LMC (Rodríguez-Segovia et al., 2021) or for many Cepheids mentioned in this article. These variations are due to period and phase fluctuations accumulating in time and building up a phase-lag that will appear as a change in the pulsation period (Balázs-Detre & Detre, 1965). The timescale of these fluctuations varies within a wide range, from decades to even centuries. Due to these variations, period determination using diagrams can become uncertain, thus other methods might be necessary for this purpose when the baseline of the diagrams is not long enough to reliably separate the signals originating from the evolution and the fluctuations (Lombard & Koen, 1993). In most of the cases, long term photometry allows for the reliable separation of the stellar evolution from the fluctuations on the diagram. However, in some cases, as for BY Cas and DX Gem, the time span covered by observations and the timescale of fluctuations are comparable, which can even lead to the misidentification of the Cepheid’s crossing number, as it was shown by Berdnikov (2019a). Although now there are photometric data from long enough timescales for the effects of evolution and fluctuations to be separated reliably for bright Cepheids, fluctuations can still prove a problem for the period change determination of fainter Cepheids that are observed less regularly. Physical processes behind such fluctuations could be either short-term variations in the atmospheric structure (Deasy & Wayman, 1985), or minor changes in helium abundance gradients in upper layers of Cepheids (Cox, 1998). The century long temporal coverage of light curves not only allows the investigation of period changes through the simple methodology of diagrams (Sterken, 2005), but it can give us an unprecedented insight into the nature of these fluctuations as well, which facilitates the refinement of current pulsation models.
Apart from the evolutionary changes and the random fluctuations of the pulsation period, binarity of the Cepheid can also cause observable effects in the diagram. One of these is the light-time effect (LiTE), which arises from the orbital motion of the variable star. This effect can be easily distinguished from the evolutionary effect, since it results in a periodic feature in the graph. The orbital modulation can be detected in the diagram of binary Cepheids when the orbital period is sufficiently long, because in the case of short orbital periods the amplitude of this cyclic pattern would be too small to recognize. A very clear indication that a superimposed wavelike signal is caused by the LiTE instead of fluctuations is the stability of the signal; since the fluctuation waves are caused by accumulating random processes, the shape of the resulting quasi-cyclic signal will get distorted, however, as the LiTE is caused by a deterministic process, its shape will remain stable over time. The importance of light time effect lies in the fact that it can be used for a rough estimation of the orbital parameters. So far only a few Cepheids have been found to show LiTE (AW Per and RX Aur, Szabados 1992 and Vinkó 1993), with a few more awaiting spectroscopic confirmation.
Another effect characteristic of binary Cepheids is a phase jump or phase slip seen in the diagram. A phase jump in the diagram has a stepwise, while the phase slip has a sawtooth-like shape; in the first case the period remains the same while the phase of the pulsation suddenly changes, while in the second case, the period of pulsation changes rapidly, then returns to the previous value after a given amount of time (period jump-rejump). Such phase jumps have been found in the diagrams of several Cepheids (e.g. Szabados 1989). One of the most prominent examples of Cepheids exhibiting such features in their diagrams is Polaris (Turner et al., 2005), which displayed a parabolic trend corresponding to a continuously increasing period that was interrupted by a phase jump after which the period continued to increase with the previous rate, with a significant phase difference.
The idea that phase jumps appear only in the diagrams of binary Cepheids is based solely on empirical data. Each Cepheid showing such an effect is either a member of a known spectroscopic binary or suspected to have a companion based on independent evidence. Moreover, no phase jump was ever detected for any well-studied single Cepheid. The size of a phase jump is usually in the order of several hundredths of the pulsation period. Unfortunately, there is no theoretical explanation for the occurrence of such phase jumps or slips. For Polaris, Turner et al. (2005) suggested the brief interruption of the Cepheid’s regular evolution by a short-lived blueward evolution associated with a small change in the average radius of the star, or alternatively, by a sudden increase in the mass of the Cepheid. However, these effects appear to be too spontaneous and peculiar to explain the phase jumps generally, especially when the phase jump occurs multiple times for a given star, which was observed to occur among Cepheids. Szabados (1992) suspects that the occurrence of phase jumps is governed by the orbital motion. In this case, a possible explanation for the phase jumps could be the perturbing effect of the companion star that exerts increased influence on the upper layers of the atmosphere of the Cepheid (where the pulsation takes place) near periastron passage. The stepwise structure of the diagrams in the case of phase jumps contradicts current evolutionary models, which predict continuous change of pulsation period otherwise.
Even though only a few Cepheid variables were observed in the programs of the Coriolis, MOST, Kepler and CoRoT space missions, the advent of high precision space photometry brought improvements in the period change studies of these variables as well. Based on the observations of the Solar Mass Ejection Imager (SMEI) instrument onboard the Coriolis satellite, Spreckley & Stevens (2008) connected slow changes in the light curve of the Polaris to a quite fast evolutionary phase and by supplementing the existing diagram suggested that another phase jump occurred. Berdnikov & Stevens (2010) studied the period changes of short period Cepheids based on SMEI photometry and detected random fluctuations in four of the observed stars. By analysing the MOST observations of SZ Tau and RT Aur, Evans et al. (2015) revealed cycle-to-cycle variations that are a function of the pulsation phase. The stability of their pulsation was also investigated and, besides finding temporal variations on a scale of decades, it was pointed out that the pulsation of overtone Cepheids is more erratic than that of fundamental mode variables. In the case of the Kepler mission, there was only one Cepheid in the observed field, V1154 Cyg. Derekas et al. (2012, 2017) provided a detailed analysis of the data and found cycle-to-cycle fluctuations on the diagram, which were attributed to instabilities in the light-curve shape caused by convection and hot spots based on the suggestion of Neilson & Ignace (2014). Poretti et al. (2015) performed the fluctuation tests similar to the work by Evans et al. (2015) on the CoRoT data for seven Cepheids, and found small cycle-to-cycle variations. Since these space missions covered only a few Cepheids, our understanding on these small fluctuations is limited, which is expected to change through future works based on the data from the currently ongoing TESS project (Plachy et al., 2021).
In this work, our primary aim is to expand the collection of existing diagrams of known binary Cepheids by using century-long photometric observational data of these variables. To get a more complete set of diagrams, the initial set of variables was extended with stars that, to our current knowledge, do not belong to binary systems.
The structure of this paper is as follows. In Section 2 we describe the available data and the differences of our method from the standard method. In Section 3 we discuss the results obtained for Cepheids that exhibited some peculiarities on their diagrams individually. Then, in Section 4 we analyse our sample collectively, first by placing the period change rates into broader context by comparing the results with previous works, then by discussing the period fluctuations in general. Finally, in Section 5 we summarize our results and conclude the paper.
2 Data and the method of the analysis
2.1 Data and observations
To achieve the near century long coverage of the temporal behaviour of the pulsation period, we attempted to acquire all available processed photometric data for every star. The first half of the 20th century was covered by the Harvard College Observatory Plate database (DASCH project, Grindlay et al. 2012, for stars on the northern galactic hemisphere) and by the observations of the American Association of Variable Star Observers (AAVSO, Kafka 2021, for suitably bright Cepheids). The later part of the century was covered by various articles from the literature, and by the earlier works of Szabados (1989), Szabados (1991) and Berdnikov et al. (1997). The complete set of references for articles used for the individual Cepheids can be found in Table A.1. To complete this dataset with more recent observations, we used the photometric data obtained by the Hipparcos (Perryman et al., 1997), the All Sky Automated Survey (ASAS, Pojmanski 2001), INTEGRAL-OMC (Winkler et al., 2003), KELT111https://exoplanetarchive.ipac.caltech.edu/, ASAS-SN (Shappee et al., 2014; Kochanek et al., 2017), the Optical Gravitational Lensing Experiment (OGLE, Udalski et al. 2015), the Solar Mass Ejection Imager (SMEI, Eyles et al. 2003), as well as the Kamogata Sky Survey (Morokuma et al., 2014) projects. To supplement these data, we have monitored some Cepheids with the 60/90 cm Schmidt telescope at Piszkéstető Observatory. The photometric data acquired through this telescope can be found in Table 1.
| Cepheid | JD | V |
|---|---|---|
| YZ Aur | 2458806.402 | 9.8815 |
| YZ Aur | 2458807.618 | 9.8637 |
| YZ Aur | 2458823.473 | 10.392 |
| YZ Aur | 2458824.418 | 10.129 |
| YZ Aur | 2458828.623 | 10.052 |
| YZ Aur | 2458855.319 | 10.683 |
| … | … | … |
2.2 Construction of the diagrams
We followed the changes in the pulsation period of individual Cepheids using the method of diagrams (Sterken, 2005). To analyse the photometric datasets of each Cepheid, we applied Discrete Fourier Transformation (DFT, Deeming 1975) on the measurements, for which we used the Period04 software (Lenz & Breger, 2005). We analysed the data from the various sources separately, to account for differences in circumstances valid for individual observational series, by keeping the frequencies and the relative phases of the harmonics fixed to a pre-calculated parameter set, which were based on the dataset with the widest coverage and most data points, while allowing the amplitudes to change during the fitting procedure.
As a first step of the analysis, every set of observations were split into smaller subsets. For each survey, depending on the temporal coverage of the data, 300-450 day long temporal bins were defined depending on the length of the pulsation period, in which each data point was moved to a new subset. The folded light curves of each previously created subset of measurements were calculated, which then were used to determine the observed () epoch values of the average (zero point) brightness on the brightening edge of the light curve. To determine the values, we fitted the phase folded light curves corresponding to the different epochs with the previously calculated Fourier components representative of the data source at hand, by only allowing the mean brightness and phase offset of the model light curve to change. The values were then simply calculated from the phase offset of the best fit model. The use of the median brightness on the ascending branch was motivated based on the Fourier fit qualities: for longer and longer pulsation periods, the complexity of the light curve increases, which in turn means that more and more Fourier components will need to be taken into account. For older, less accurate datasets the fitting of the high order components could become uncertain, which in turn could introduce a bias to the inferred values, when they are based on the epoch of maximum brightness. However, it was found that the rising branch itself, and the epoch of average brightness on it can be fitted with suitable accuracy even in such cases, thus providing a viable alternative for datasets with lower amount of observations. The advantage of using the epoch of average brightness over that of the maximum becomes even more important for Cepheids with pulsation periods between 8-10 days, due to the secondary maximum present on the light curve. It was also found by Derekas et al. (2012), that the most accurate values can be obtained through measuring the epoch of average brightness on the rising branch. The average brightness value was determined as the baseline for the sinusoidal components at the Fourier fitting of the separate datasets. By this definition the brightness value at the zero point is slightly different for various datasets as it will account for the differences between the different surveys and measurement systems, thus the resulting points will be comparable. Although the phase folding method inevitably decreases the resolution of the resulting curve, the precision of the results increases, since the error of the phase calculation will decrease significantly.
To complete the construction of the diagram, the errors of the individual differences had to be calculated. The most important factor that governs the precision of the individual values is the number of photometric data points used for their derivation. Since we only fit the average brightness and the phase shift of a given light curve shape, even a low number of data points is enough for the calculation, however to make sure that the results we obtain are meaningful, we set the lower limit on this number to 8. Another factor that needs to be taken into account when estimating the accuracy of the points is the phase distribution of photometric data points in each of the folded light curves. Obviously, if the phase curves created with the method explained above were well-covered, i.e. the calculated phases covered the possible range in an approximately uniform manner, then the standard least-squares method could be used to fit the known light-curve shape to the phase curve, which would allow for the straightforward calculation of the covariance matrix. However, if the phase-curves were not well covered, which occurred frequently in the case of long period variables observed in a series of short-cadence observation runs (e.g. with IOMC), then the above method could significantly underestimate the error of the differences. To avoid this problem, the errors have been calculated by applying bootstrapping throughout the fitting procedure; at each step 75% of the data points have been randomly selected, and fitted with the precomputed light-curve shape. This step was carried out a hundred times for each phase curve. The final uncertainty of the individual residuals was calculated as the square root of the sum of overall phase shift and light-curve zero point variance.
The derivation method inherently contains a minor bias through the use of Fourier decomposition for the fitting, as it can obviously just approximate the actual shape of the light curve, which could cause biases in cases when a dozen or more Fourier components are required for the description. Although these biases can be minimized properly by measuring the moment of the average brightness on the rising branch instead of that of the maximum, a more precise and general method could be achieved by using a non-parametric light curve fitting instead of the Fourier decomposition. Nevertheless, since we used the same amount of Fourier components for every dataset of the individual stars, these biases affect each of the reductions similarly, thus they did not lead to noticeable artefacts between the different data sources.
3 Remarks on individual Cepheids
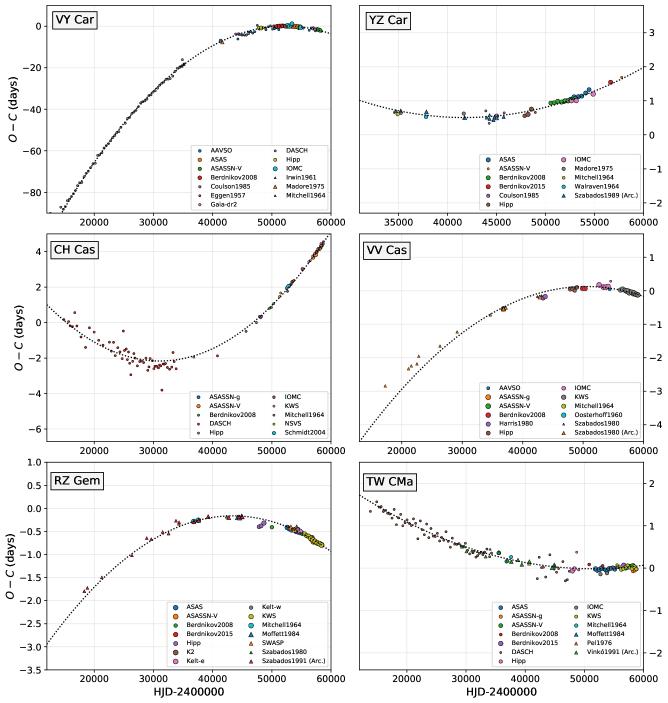
The curves corresponding to evolutionary changes are usually represented as parabolic trends, which correspond to constant rate of period change (for a sample of diagrams showing solely the effects of stellar evolution, see Fig.1). There have been numerous studies from the last decades showing such behaviour (e.g. Parenago 1956, Szabados 1983, Berdnikov et al. 1997). The rate of period change depends on the position of the Cepheid within the instability strip and the crossing number, and is usually modelled by a linear function of time, which rates are well approximated by current pulsation and evolutionary models (Anderson et al., 2016).
However, there is no physical model that restricts the period change of a star to be linear, since the luminosity and the temperature themselves change in a nonlinear manner. Hence, as it has been argued by Fernie (1990a), in some cases higher order polynomial fits are necessary for certain diagrams, which indicate not only the change of period itself, but variations in the rate of period change as well. Such behaviour is common among Cepheids, significant deviations can be observed from parabolic fits to the plot in numerous cases. Determining the period change rate for a large set of Cepheids allows for the statistical study of this phenomenon, as well as giving way for the refinement of existing period-based empirical relations. However, there are quite a few classical Cepheid variables that exhibit peculiar diagrams, for which the statistical description is not yet available due to the small number of such objects, thus these stars have to be treated separately.
In this section we present and discuss the diagrams exhibiting features which could not be explained by evolutionary changes with superimposed relatively small amplitude fluctuations, such as phase jumps or slips, or large amplitude waves that partially, if not completely, obscure the effect of evolution on the diagram. In the large sample of analysed Cepheids, we found 16 of such diagrams, which are presented below.
3.1 Cepheids showing wavelike structure
Out of the 16 Cepheids that exhibit peculiar diagrams, we found 9 stars that show a remarkable wavelike modulation. Such wavelike signals can arise either due to the presence of a companion star through LiTE, or due to the fluctuations present in the pulsation of the Cepheid, in which case the modulation can even obscure the effect of evolution on the diagram. To model these wavelike signals we simultaneously fitted the underlying parabolic trend corresponding to stellar evolution and the superimposed modulation (except for UY Mon, where we could not calculate such a fit reliably, see Sec. 3.1.7). By this procedure, we fitted a single sinusoidal waveform for each Cepheid, except for IR Cep, where involvement of one additional sinusoidal component is motivated based on the systematic deviations present in the residuals calculated with respect to the parabolic plus single sinusoidal model fit. In the case of the other Cepheids, we either did not find any additional signals in the residual data after fitting the parabola and the modulation, or due to the randomness and possible fluctuation origin of the modulation (as in the case of VZ CMa and DX Gem, see Sec. 3.1.2 and 3.1.6) we decided that adding further components would not change the outcome of the analysis significantly.
For these Cepheids, similarly to the other Cepheids showing evolutionary changes, we then statistically analysed the residuals calculated by various models (for the constant period, the linear period-change, and the linear period change plus sinusoidal signal cases) using F-test, in order to determine the significance of the wavelike modulation in the modelling. The final F-statistics and the associated p-values can be found in the summary table in the Appendix (Table B.1). In a later section (Sec. 4.2) we then used these solutions along with those of Cepheids showing evolutionary changes for the collective analysis.
3.1.1 RX Aurigae
RX Aur is a bright intermediate period Cepheid, whose binarity was long suspected based on the slope of its colour-colour loop and the LiTE-like nature of its diagram (Szabados, 1988). The total mass of the system inferred based on this diagram did not rule out the presence of a companion (Szabados, 1988), and it is further supported by the RV measurements of Gorynya et al. (1996), who marked the star as a possible binary.
By extending the diagram with more recent photometric measurements we confirm the LiTE explanation of the diagram (Fig. 2). The diagram was calculated using the following elements:
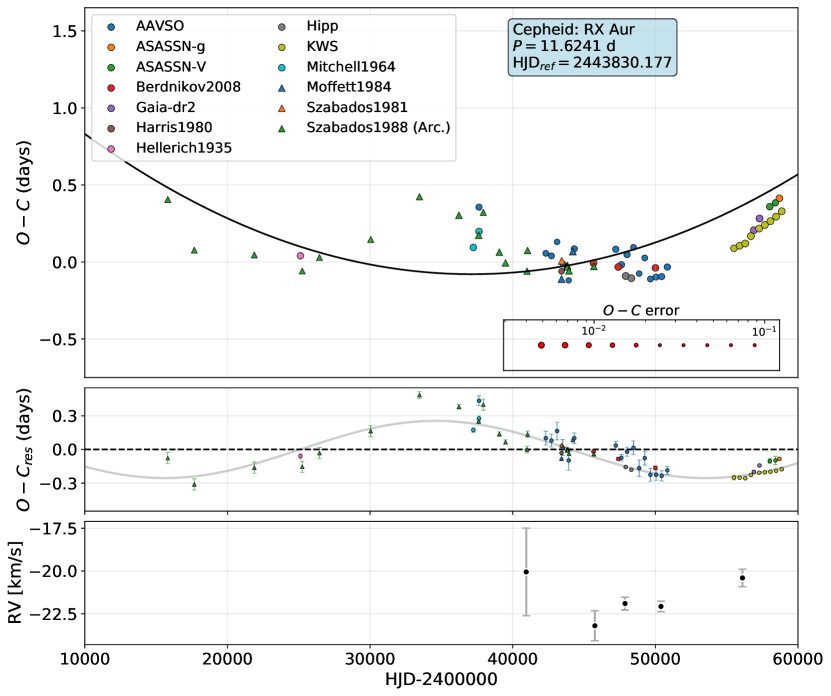
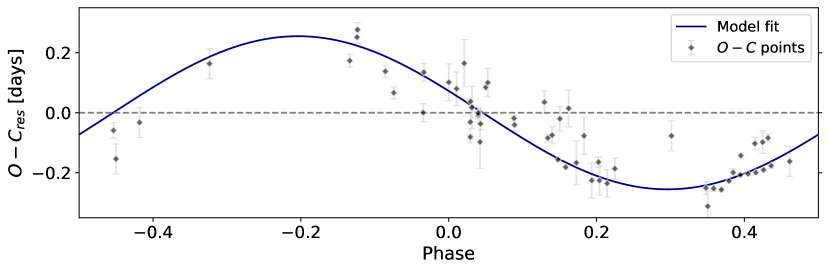
Fitting the evolutionary trend and the superimposed modulation (Fig. 3) yielded an orbital period of d yr and an amplitude of d, which are approximately 1.92 and 1.15 times larger, respectively, than the previously calculated values (Szabados, 1988). Since, as seen in Fig. 2, the maximum of the variation in the residual terms is only covered once by our dataset, a more detailed and reliable orbital parameter determination is not yet possible, as the few data points near that extremum do not provide sufficient constraint for the fitting procedure. However, the knowledge of the orbital period and semi-major axis (amplitude) allows for the determination of the total mass of the system through the
| (1) |
formula (since , with being the semi-major axis of the orbit), where is measured in astronomical units, in years. The resulting parameters are as follows:
The resulting mass is consistent with the values inferred by Kervella et al. (2019a) with the assumption that the orbital plane is oriented along or near the line of sight (), and the obtained orbital period also falls into the range proposed by them. However, no significant signal can be extracted from the available RV data (from the measurements of Schmidt 1974, Barnes et al. 1987, Gorynya et al. 1996, Imbert 1999 and Borgniet et al. 2019) displayed in Fig. 2, which show a low scatter ( km/s) and their distribution is not aligned in phase with the suspected LiTE either, hence it is not possible to reach a solid conclusion on the origin of the observed signal yet.
3.1.2 VZ Canis Maioris
VZ CMa is a short period Cepheid whose pulsation mode was investigated in various studies, yielding different results: Kienzle et al. (1999) classified this star as an overtone pulsator, while according to Groenewegen & Oudmaijer (2000) this Cepheid is a fundamental mode pulsator. Its multiplicity was also studied in various articles: it was first suspected by Stobie & Balona (1979) and Szabados (1993) based on its color indices and amplitude ratios respectively, then was finally confirmed spectroscopically by Szabados (1996). The diagram of the object was studied by Berdnikov & Pastukhova (1994), who found it to be parabolic.
By extending the previously available data with the archival measurements of Hacke & Richert (1990), and with that of modern surveys, we found that the diagram of VZ CMa exhibits a large amplitude wave (Fig. 4), which was interpreted as a parabolic pattern before, due to the lack of sufficient data. The diagram was calculated with the following elements:
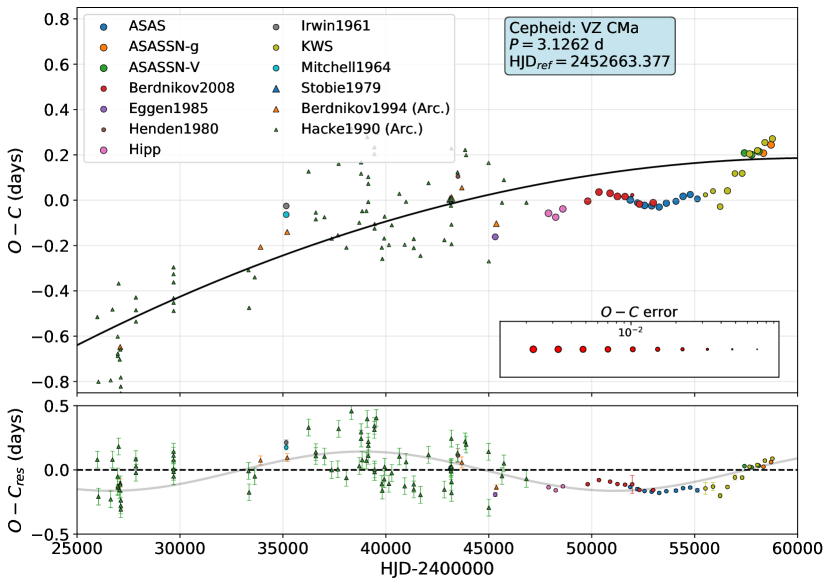
Fitting the parabolic trend and the wavelike signal simultaneously, we estimated the period of the modulation to be 24475 d (67.01 yr) and its peak-to-peak amplitude to be approximately 0.3 d. Although the values inferred here could indicate a LiTE origin for the signal, the unusual, non-sinusoidal shape points towards the presence of fluctuations in the pulsation. This ambiguity is not lifted by the RV datasets either, as the combined observations of Stobie & Balona (1979) and Kienzle et al. (1999) cover a much shorter timespan than the period of the signal, henceforth we cannot conclude whether this wave originates from binarity or period fluctuations.
3.1.3 BY Cassiopeiae
BY Cas is short period Cepheid with a long history of cluster membership and binarity studies. Membership in NGC 663 was first suggested by Malik (1965), which was contradicted by the later study of Usenko & Klochkova (2015) citing large color excess, parallax and RV differences, concluding that BY Cas is a foreground star, in agreement with the result of Anderson et al. (2013) too. However, according to the latest analysis of Glushkova et al. (2015), this Cepheid shows connection not only to its nearest cluster NGC 663, but also to the clusters NGC 654, NGC 659, and the association Cas 8, too. BY Cas was also revealed to have a companion with an orbital period of 560 d (Gorynya et al., 1994).
The period changes of this variable were investigated by Szabados (1991) and Berdnikov & Pastukhova (1994), and more recently by Berdnikov (2019b). The former analysis described the variations as a sequence of sudden period changes, while the latter work proposed evolutionary changes with a wavelike pattern superimposed. Our independent analysis showed that the diagram can indeed be explained by evolutionary changes with a wavelike signal on top of it (Fig. 5). The presented diagram was calculated with the following elements:
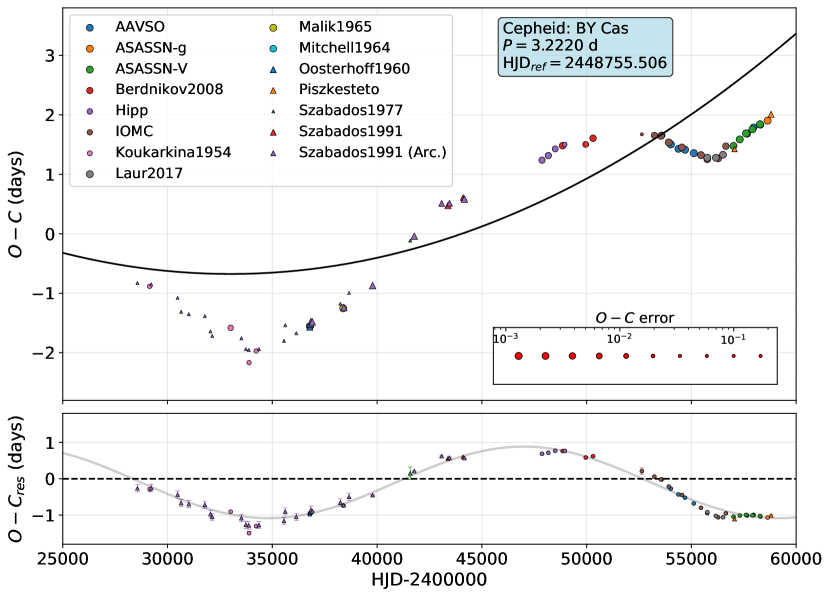
Using the parabolic fit we estimated the period change rate to be 0.338 syr-1, which is two orders of magnitude smaller than the one estimated by Berdnikov & Pastukhova (1994), and places this object in the group of third crossing Cepheids, in agreement with the findings of Berdnikov (2019b). The best explanation for the superimposed modulation is the period fluctuation, which is relatively common for these Cepheids (as shown in the later sections).
3.1.4 IR Cephei
IR Cep is a short period Cepheid which was first studied in detail by Szabados (1977), revealing strong period change. This Cepheid was found to exhibit a peculiar light curve: according to Kun & Szabados (1988), the light curve of this Cepheid rather resembles that of larger amplitude Cepheids. Thus it was suggested that IR Cep might be a classical Cepheid, but with a bright companion whose constant contribution to the emitted light reduces the observable amplitude of the variable, however, no close binary component was found by the RV analysis of Marschall et al. (1993). Kun & Szabados (1988) also suggested the possible association of this Cepheid to Cep OB2.
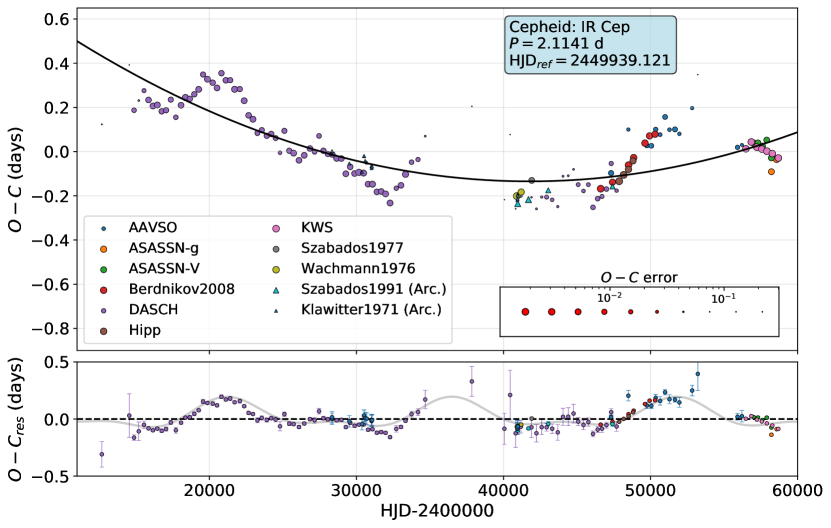
IR Cep turned out to be peculiar in its pulsation as well: this Cepheid was classified as a first overtone pulsator by Groenewegen & Oudmaijer (2000), but Szabó et al. (2007) showed that a first overtone classification would lead to excessive phase lag discrepancy for this star. They note however, that according to its position on the phase lag diagram it would quite naturally fit in the class of fundamental mode Cepheids.
Based on the acquired photometric measurements the corresponding diagram has been drawn, which covers more than a century (Fig. 6). The presented diagram was calculated using the following elements:
The rate of period change is 0.042 syr-1, while the approximate period and peak-to-peak amplitude of the seemingly periodic signal are 15150 d (41.47 yr) and 0.29 d. The origin of this wavelike signal is uncertain, as the amplitude could allow for LiTE, which is also favoured by the more stable form of the signal, however due to the short temporal coverage of the RV data obtained by Marschall et al. (1993) and Gorynya et al. (1998) this could not be confirmed spectroscopically, hence the fluctuation origin cannot be excluded either.
3.1.5 V532 Cygni
V532 Cyg is a short period Cepheid known to be a binary system member. The presence of a companion star was first suspected by Madore (1977) based on the shape of its colour-colour loop, then a similar conclusion was reached by Usenko (1990) and Szabados (1991) later on. This was later confirmed by the RV observations of Gorynya et al. (1996), finding a 388 d orbital period.
The period changes of this Cepheid were studied several times in the literature: Szabados (1977, 1991) first described the diagram as a sequence of period jumps, however, it was later shown that it can be described by evolutionary changes and a large wavelike signal superimposed (Berdnikov, 2019c). The latter behaviour of the diagram is also confirmed by our independent study, as shown in Fig. 7. The presented diagram was calculated using the following elements:
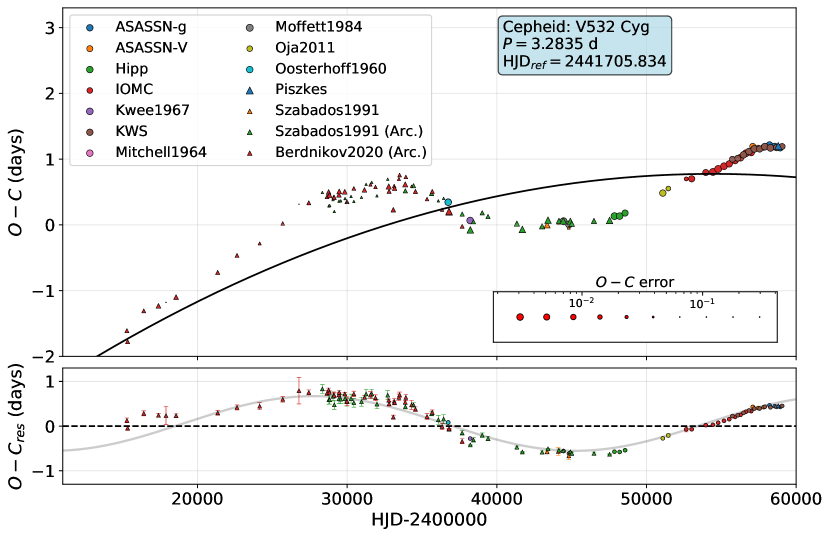
As it is shown in the diagram, the period of the Cepheid is indeed decreasing due to its evolution with a rate of 0.104 syr-1, which places it among the second crossing Cepheids. The large amplitude ( d) of the superimposed signal suggests that the fluctuation of the period is a suitable explanation.
3.1.6 DX Geminorum
DX Gem is a short period Cepheid which was for long considered one of the few first crossing Cepheids due to its large period change rate. The first period analysis on this Cepheid was done by Szabados (1977, 1991), in which a series of phase jumps that appeared to be in accord with the binarity (Burki, 1985) of the object were suggested as interpretation. However, Berdnikov (2019a) showed that the diagram can be described by an evolutionary change with a wavelike signal superimposed.
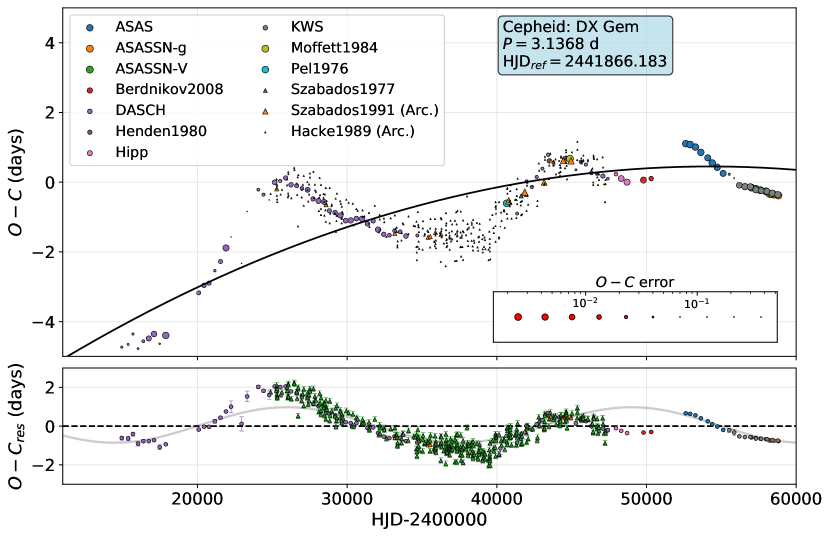
According to our independent analysis, the diagram of DX Gem indeed cannot be explained by evolutionary changes alone (see Fig. 8). Our diagram was calculated using the following elements:
From the obtained fit it is apparent that the Cepheid exhibits a shortening period with a rate of 0.186 syr-1, hence it belongs to the class of second crossing Cepheids. The residual large amplitude modulation ( d) cannot be explained by LiTE, thus the most reasonable explanation for it is the presence of fluctuations in the period.
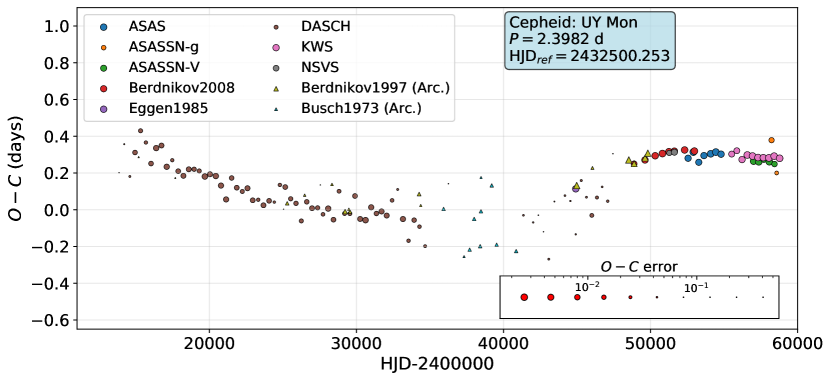
3.1.7 UY Monocerotis
UY Mon is a short period Cepheid that was rather neglected in the past: it was first correctly classified by Imbert (1981), as it was considered as an eclipsing binary before, and it has not been studied in terms of RV data and cluster membership yet. The period changes of this Cepheid were investigated before by Berdnikov et al. (1997), who found an increasing period.
In our analysis, we extended the diagram compiled by Berdnikov et al. (1997) in both directions using the Harvard Observatory plate archives and more recent observations. The diagram was calculated using the following elements:
According to our results, the diagram of UY Mon looks like a slanted sinusoidal signal, with a possible period longer than 45000d (120 yr). As the amplitude of this oscillation is small compared to the length of the period, the possibility of LiTE cannot be excluded. However, the time interval covered by the compiled data does not allow us to determine whether this signal is indeed periodic, thus further photometric and long-term RV observations are necessary for a firm conclusion.
3.1.8 Y Ophiuchi
Y Oph is an intermediate period Cepheid that was frequently analysed in the past. It is a known binary with an orbital period of 1222.5 d (Szabados, 1989): the presence of the companion was first suspected by Pel (1978) based on photometry, as Y Oph appeared too blue for its pulsation period. However, no such companion was detected from the IUE spectra (Evans, 1992) nor through NACO lucky imaging Gallenne et al. (2014). On this basis, its true nature remains elusive.
By collecting not only the more recent measurements, but the results from previous works on this Cepheid as well (Parenago, 1956; Szabados, 1989; Fernie, 1990a) we compiled an diagram spanning almost a century (Fig. 10). To calculate the diagram, we assumed the following elements:
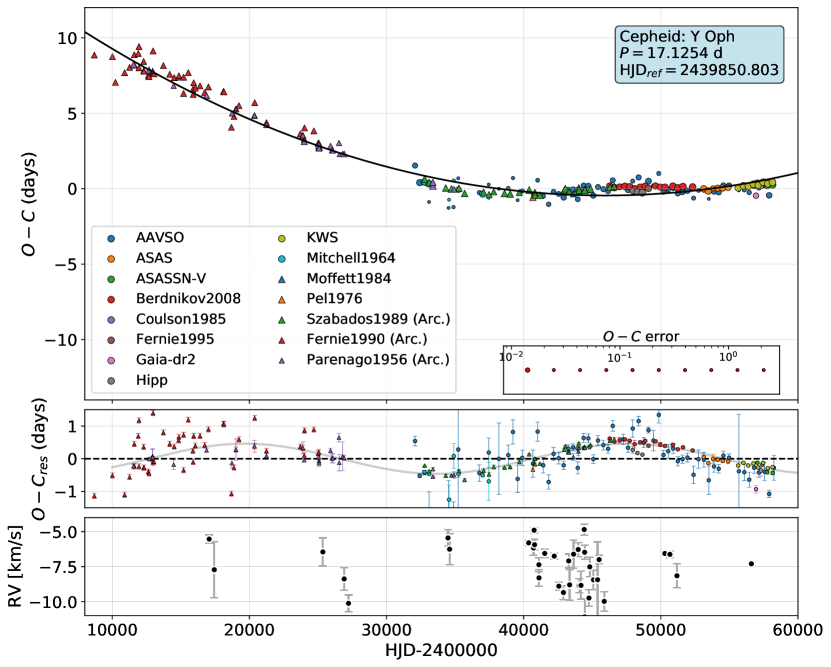
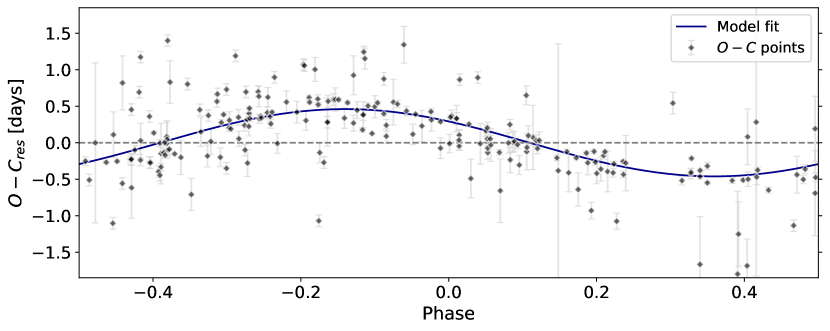
The obtained diagram can be described by a combination of the parabolic trend corresponding to the evolution of the Cepheid and a wavelike signal superimposed, with the period of the modulation being d yr and the amplitude d (Fig. 11). If we assume that this periodic variation originated from LiTE, then the obtained amplitude corresponds to a semi-major axis of AU km, which agrees well with the long period of this wave. Although the duration of the covered time interval does not allow for a detailed fit of the residual curve, the accuracy of the simple sinusoidal fit suggests that the assumed orbit has a low inclination, which also agrees well with this period–semi-major axis pair. Since the period is much longer than the one obtained for the previously suspected companion, the light-time interpretation of the wavelike signal would suggest that a third component is present in the system of Y Oph, but no signal with such a period could be extracted from the presently available RV data (bottom panel of Fig. 10). Henceforth, we cannot yet confirm the presence of the third component, however, as we will show it in Sec. 4, the amplitude of the modulation we found is larger and can be considered an outlier compared to the fluctuation amplitudes of similar period Cepheids, which also favours the new companion and the LiTE explanation.
3.1.9 AW Persei
AW Per is a short period Cepheid in a binary system. The binary nature of the star was discovered by Miller & Preston (1964) based on Ca II and K line measurements, with the orbit being investigated later on by Welch & Evans (1989), Vinkó (1993), and then by Evans et al. (2000). This object was also found to exhibit LiTE that could be matched to RV observations (Szabados, 1991).
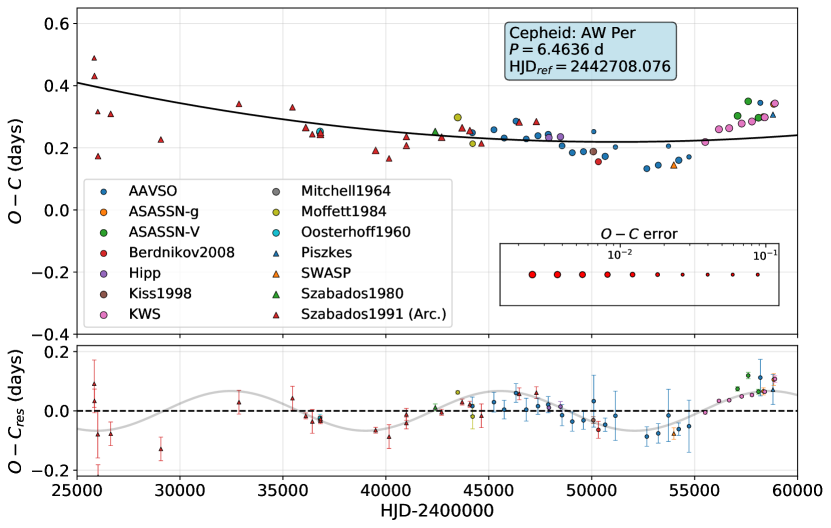
To further investigate the signal created by the LiTE we extended the dataset of Szabados (1991) with more modern observations from various sources. The resulting diagram (Fig. 12) was calculated with the following elements:
Similarly to RV data, the LiTE also allows for the detailed estimation of orbital parameters. We must note however, that we did not aim to refine the set of parameters obtained by Evans et al. (2000), we only investigated this possibility for confirmation purposes. The variation due to the orbital motion can be described as
| (2) |
where , , , and refer to the semi-major axis, eccentricity, inclination and longitude of periastron of the orbit of the pulsating star, respectively. In the equation, represents the true anomaly of the pulsator at a given time, while denotes the true anomaly at the epoch chosen for the calculation. Based on Eq. 3 the semi-amplitude can also be defined:
| (3) |
To fit this profile to the obtained set of residuals, we utilized the RadVel RV fitting toolkit developed by Fulton et al. (2018), which we appropriately modified using Eq. 3 for the fitting of diagrams. Using the Monte Carlo based fitting procedure of the code we obtained a fit plotted in Fig. 13 and for which the fitting parameters are listed in Table 2. As it is clearly visible from the obtained results, the precision of the diagram based orbital parameters is far worse than the ones obtained by Evans et al. (2000) based on higher precision RV measurements, but our results are consistent with the values obtained previously. It is worth mentioning however, that there is a significant deviation between the orbital period values, as our result for this parameter differs from the one obtained by Evans et al. (2000) ( d) by more than . Based on the fact that our photometric dataset covers a longer timeframe than the one covered by RV observations, our result suggests that the orbital period of the binary is indeed significantly shorter than previously thought. To reach a firm conclusion, however, further photometric and spectroscopic observations are required.
| Parameter | Credible Interval | Max. L. | Units |
|---|---|---|---|
| d | |||
| yr | |||
| rad | |||
| d | |||
| km | |||
| 12.10 | AU |
3.2 Cepheids showing phase jumps/slips
Of the diagrams we found to be peculiar, 5 could be explained through phase jumps or slips. In case of a phase jump, the phase of the pulsation changes rapidly, while the period remains relatively the same, leading to a stepwise graph. In the case of a phase slip however, the period of the pulsation seems to change rapidly, just to return to the previous value after a given amount of time (period jump-rejump), resulting in a sawtooth-shaped diagram. Such behaviours, which cannot be explained through stellar evolution, have been empirically associated with the Cepheids being binaries, as only some of those were found to exhibit it. However, the complete explanation for this phenomenon is still elusive.
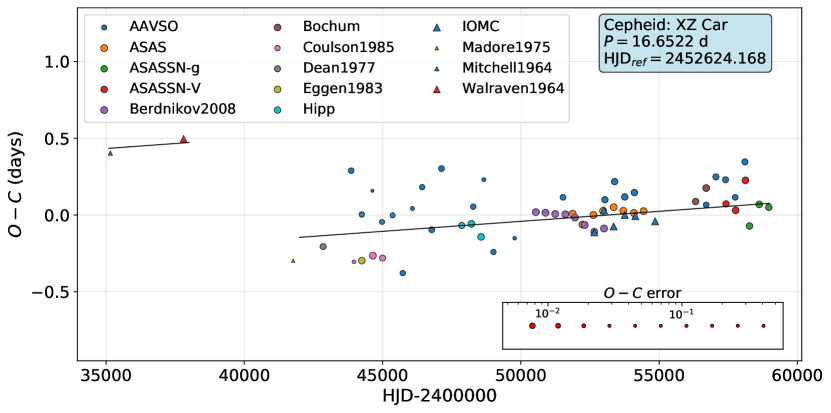
3.2.1 XZ Carinae
XZ Car is a long period Cepheid which was found to be possibly linked to various open clusters in the past: Glushkova et al. (2015) claimed a possible relation between the Cepheid and the open cluster Ruprecht 93, while Chen et al. (2015) found the membership in ASCC 64 to be more probable, based on proper motion, age, and instability-strip selection criteria, although none of these associations were marked likely by Anderson et al. (2013) earlier. Anderson et al. (2016) found the Cepheid to exhibit time dependent -velocity changes, indicating the binary nature of the star.
The period changes of this object were not investigated before, despite being a relatively bright star. According to our analysis, the diagram of XZ Car can only be explained through a phase jump, as the data points available from before HJD 2440000 show a systematic offset from the rest of the data, and no evolutionary signal was visible (Fig. 14). The diagram was calculated using the following elements:
The phase jump occurred between HJD 2438000 and 2442000, and altered the phase of the pulsation by 0.67 d (i.e. 0.040 phase), assuming that the period was unchanged before and after the jump (Fig. 14). Apart from the phase jump, no other signal could be extracted that would indicate period change in the Cepheid. We note that due to the low amount of available data before the assumed occurrence of the phase jump this interpretation remains uncertain, however, if true, it could yield an additional empirical link between the presence of a companion star and the phase jump nature of the diagram.
3.2.2 UX Carinae
UX Car is a short period Cepheid, possibly linked to the open cluster IC 2581 based on its photometric and kinematic properties (Glushkova et al., 2015). However, the latest Gaia measurements suggest that the Cepheid is outside the cluster, with the Gaia EDR3 distance of the star being 1.52 kpc (Gaia Collaboration, 2016; Bailer-Jones et al., 2021), while the distance of IC 2581 being 2.45 kpc (Kaltcheva & Golev, 2012). This association was also marked unlikely by Anderson et al. (2013) previously.
This Cepheid was not investigated in terms of period changes before. Based on our studies, this variable exhibits rapid period jumps, as it can be seen in Fig. 15. The diagram was calculated using the following elements:
As seen in the figure, the diagram shows a series of period jumps and rejumps, which is best explained by a series of constant period segments:
before HJD 2425000: d
HJD 24250002429000: d
HJD 24290002451000: d
after HJD 2451000: d
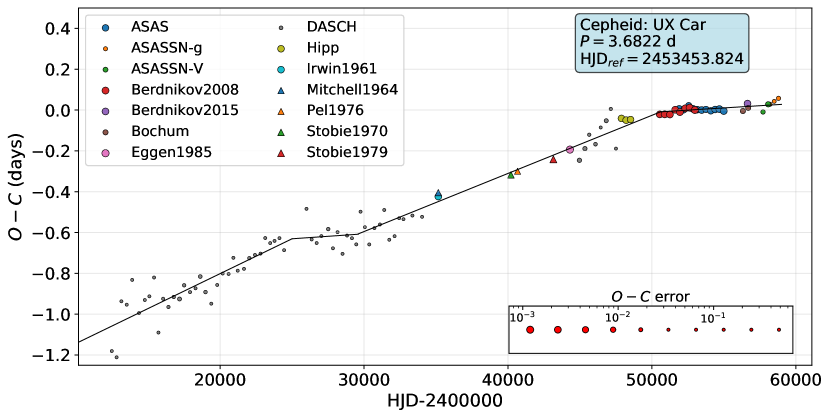
Since UX Car was found to be a possible binary by Kervella et al. (2019b) based on proper motion studies (although with low probability, due to the large separation), binarity could explain the shape of the diagram, which cannot be interpreted by evolution alone.
3.2.3 R Crucis
R Cru is a short period Cepheid that has been frequently studied in the past owing to its vicinity to and possible membership in the open clusters NGC 4349 (Majaess et al., 2012) or Loden 624 (Anderson et al., 2013). The membership in the former cluster was rejected by Chen et al. (2015), based on the distance difference between the cluster and the Cepheid and the fact the R Cru is brighter than the instability strip of the open cluster.
The binary nature of R Cru was first suspected by Lloyd Evans (1982) based on its -velocity drift, then the presence of the companion was confirmed by HST imaging (Evans et al., 2016b) and a possible X-ray emission was also identified at the position of the resolved companion (Evans et al., 2016a). This binary companion was also confirmed by Kervella et al. (2019b, a) through finding a slight offset in separation between the HST and Gaia observation epochs. They also determined the spectral type of R Cru B, which was found to be compatible with the X-ray radiation.
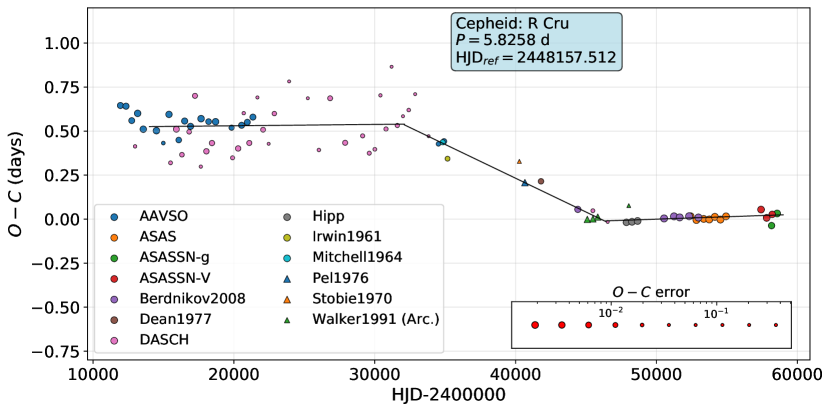
Despite being relatively bright, no diagram has been constructed yet for this Cepheid. According to our analysis, R Crucis underwent a period jump approximately at HJD 2433000 and pulsated with a modified period until approximately HJD 2446000 (Fig. 16):
before HJD 2432900: d
HJD 24329002446100: d
after HJD 2446100: d
The presented diagram was calculated using the following elements:
After the phase jump the period of the Cepheid returned to a value slightly longer than before, which suggests that the period of the Cepheid is increasing, however this could only be determined by observing another period jump. Nevertheless, the jump–rejump structure of the diagram could be linked to the presence of a companion, as evolutionary changes alone cannot explain this behaviour.
3.2.4 DT Cygni
DT Cyg is a short period Cepheid which was frequently observed in the past decades. The diagram of the Cepheid constructed by Szabados (1991) showed peculiar period jump–rejump behaviour. This Cepheid was also suggested to be in a binary system, first by Leonard & Turner (1986), then by Szabados (1991) based on RV measurements, however, the orbital motion is yet to be confirmed.
By analysing the obtained diagram of DT Cyg we confirm the previous statement by Szabados (1991), that a second rapid period change occurred near HJD 2446000 (Fig. 17). Our diagram was calculated using the following elements:
The pulsation of DT Cyg can be characterized with the following periods:
before HJD 2441300: d
HJD 24413002445900: d
after HJD 2445900: d
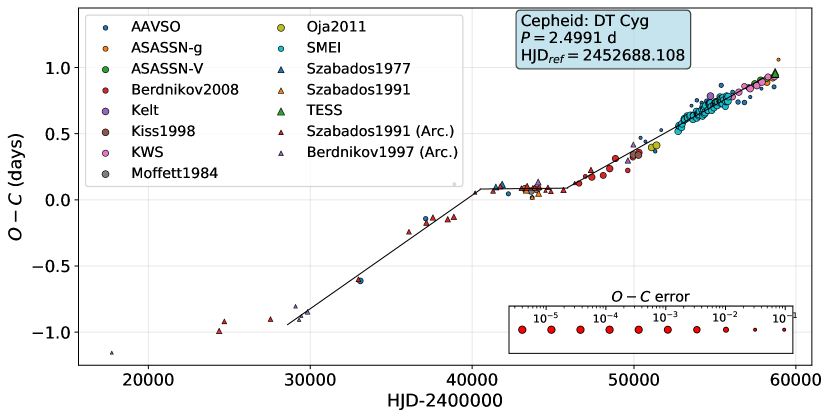
It is not possible to determine how the period changed before HJD 2428600 based on the current diagram. The peculiar structure of the diagram could be linked to the presence of a companion, since evolutionary changes alone cannot explain it. Moreover, as it can be seen from the values above, the average pulsation period of DT Cyg became shorter after the rejump, which suggests that the star belongs to the second crossing Cepheids.
3.2.5 BN Puppis
BN Pup in an intermediate period Cepheid which was not investigated in terms of period changes before. The Cepheid was suspected to be connected to NGC 2533, but this turned out to be unlikely based on the large distance and age differences (Havlen, 1976; Anderson et al., 2013). The binary nature of the object was not investigated before, with only limited amount of RV data being available (Coulson & Caldwell, 1985; Pont et al., 1994; Storm et al., 2011).
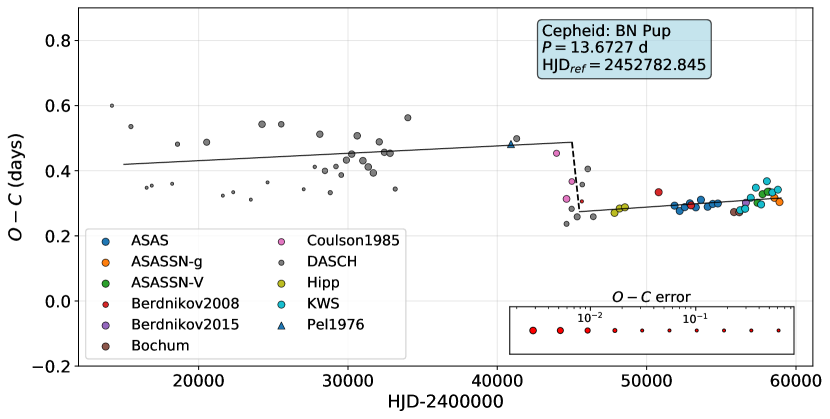
Based on the compiled diagram plotted in Fig. 18, we have some indication that the Cepheid might have a companion. The phase jump in the case of this Cepheid is less ambiguous than in other cases since it is detected in data from a single source (DASCH photometry) and it is also supported by the precise photometric measurements of Pel (1976). The presented diagram was calculated using the following elements:
The phase jump occurred at approximately HJD 2444500 and altered the phase of the pulsation with 0.2 d. The values of the pulsation period before and after the phase jump are in agreement within errors. To determine whether a long period signal can be extracted from the RV data, we reanalysed the measurements of Coulson & Caldwell (1985), Pont et al. (1994), and Storm et al. (2011). According to the Fourier decomposition of the signal, a period of 4300 d can be extracted, but the sparseness and the uncertainty of the RV data does not allow us to determine whether it is truly connected to the binary nature of the Cepheid. The phase jump exhibited by the diagram could suggest that BN Pup is possibly a member in a binary system, if one assumes an empirical correspondence between the two, although further RV measurements are necessary to validate this assumption.
3.3 Overtone Cepheids
The remaining two Cepheids that were found to exhibit peculiar diagrams show erratic or semi-erratic period changes, which, to our current best understanding, can only be explained through a set of linear segments (consecutive intervals of random, but otherwise constant-period pulsations) and is a characteristic of overtone pulsators. During the observed timeframe, none of these Cepheids showed recurrence in the change of their pulsation period.
3.3.1 X Lacertae
X Lac is a short period Cepheid which is possibly connected to the open cluster FSR 384 (Glushkova et al., 2015) (although this association was marked as unlikely by Anderson et al. (2013) before). The period changes of this Cepheid were extensively studied by Evans et al. (2015), finding that it shows an erratic period change. Apart from the erratic period change, the low pulsation amplitude also points towards the overtone nature of the pulsation (Storm et al., 2011), which makes this object interesting, as only a few overtone pulsators are known with such a long period.
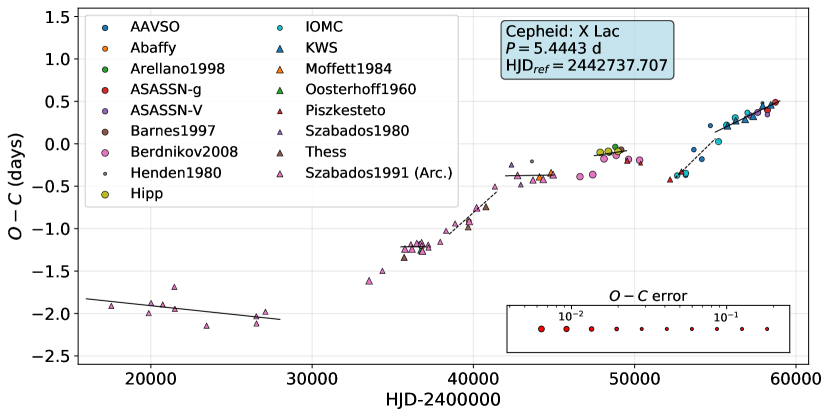
Our analysis of the available photometric data yielded very similar results to those presented by Evans et al. (2015): the resulting diagram is best fitted with a series of linear segments as shown in Fig. 19. The presented diagram was calculated with the following elements:
According to our analysis, the diagram of X Lac can be best described with the following periods:
before HJD 2428000: d
HJD 24355002437000: d
HJD 24385002441500: d
HJD 24420002445000: d
HJD 24475002449500: d
HJD 24525002455000: d
after HJD 2455000: d
Our analysis shows that the period change sequence of X Lac is indeed erratic throughout the observed timeframe, which supports the assumption that this Cepheid is an overtone pulsator.
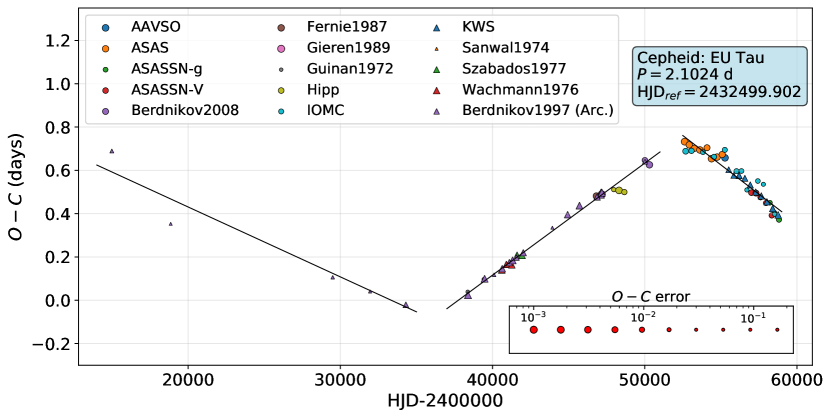
3.3.2 EU Tauri
EU Tau is a short period Cepheid and an overtone pulsator (Gieren et al., 1990). The binary nature of the object was first suspected based on RV data (Gorynya et al., 1996), however a later study by Evans et al. (2015) found this unlikely. The period changes of EU Tau were investigated by Berdnikov et al. (1997) and Evans et al. (2015), finding first a linear, then erratic period change, respectively.
The obtained diagram (Fig. 20) was calculated using the following elements:
According to our analysis, which matches with the finding of Evans et al. (2015), the diagram can be best described as three constant period segments:
before HJD 2435000: d
HJD 24370002451000: d
after HJD 2452500: d
Since the transitions between these segments were not covered by observations, their nature cannot be established. To determine whether the pulsation periods are truly erratic, or if there is any connection between them, further observations are required.
4 Collective analysis on period change rates and fluctuations
4.1 Colour-magnitude diagram and period change rates
Apart from the Cepheids detailed in the previous sections, we have obtained diagrams for 132 additional Cepheids (see Table A.1 for the complete list), which all show a parabolic shape, thus dominated by the evolution of the variable star. As a result, our Cepheid sample contains 141 stars that exhibit clear evolutionary changes in their diagrams, including those that were termed peculiar based on additional features in their diagrams in Sect 3.1.
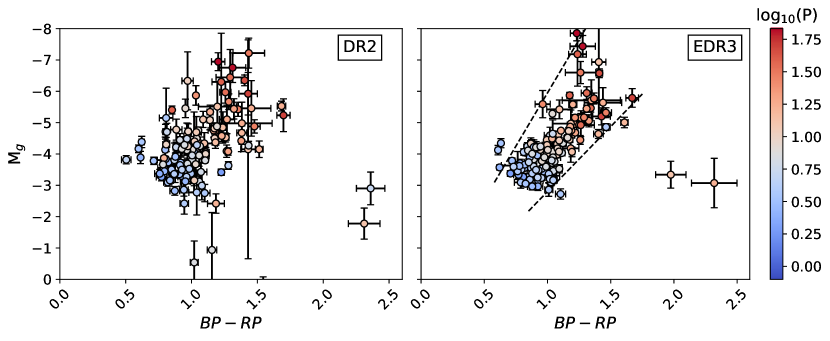
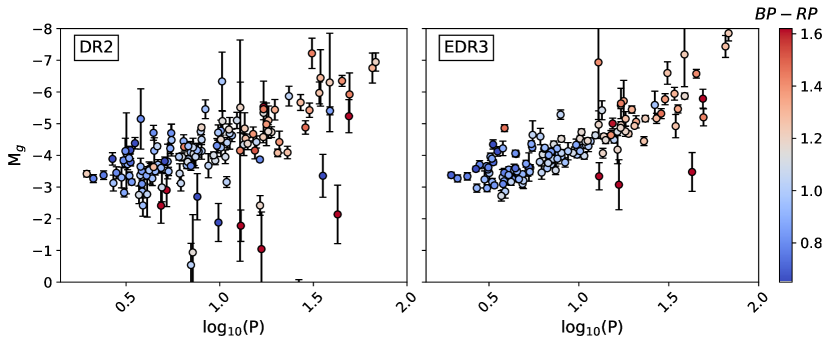
The recent advancement in astrometry owing to the measurements of the Gaia space probe allows for the construction of the colour-magnitude diagram (CMD) for the current set of Cepheids with an unprecedented accuracy. Figure 22 shows the CMD based on the Gaia DR2 and Gaia EDR3 data (Gaia Collaboration, 2016, 2018, 2021; Lindegren et al., 2021; Riello et al., 2021) as a comparison. Since neither of the data releases contained measurements of the Galactic extinction for all the Cepheids, we applied the attenuation correction on the individual photometric measurements based on the colour-excess values listed in the DDO database of Galactic Classical Cepheids222http://www.astro.utoronto.ca/DDO/research/cepheids/cepheids.html. For the Cepheids which were not listed on the website, or scattered far from the rest of the variables on the CMD due to the false value of the colour excess (KL Aql, V898 Cen) we used the more recent measurements (Schmidt, 2015; Groenewegen, 2020), but in the case of V898 Cen the resulting position was still slightly different from the rest of the dataset. For the additional Cepheids that have no published colour-excess values at all (EV Cir, V5738 Sgr, GP Mus, V2744 Oph, CE Pup, DU Pyx and V520 Vel) we assumed the extinction values inferred by Anders et al. (2019). The colour excess values were then converted to the Gaia passband system using the scaling given in Casagrande & VandenBerg (2018).
As seen in Fig. 22, the data from EDR3 show a much smaller scatter and exhibit a much clearer trend for the pulsation period of the Cepheids, which demonstrates well the improvement of the Gaia data compared to the previous data releases. On the right panel of Fig. 22 we attempted to draw the limiting lines of the strip populated by the Cepheids; for the approximate alignment of these lines we omitted all Cepheids with uncertain or non-published extinction mentioned above. The resulting lines are notably not parallel, which indicates that for longer period Cepheids the possible range of colour index values is broader, which means that the instability strip of Cepheids could in fact be an instability wedge, as proposed earlier by Fernie (1990b). This also matches the results previously obtained from the observations of IUE for a smaller sample of Cepheids (Evans, 1992). To examine this possibility even further, more accurate extinction values would be required, which are planned to be published with the complete third data release of Gaia in 2022.
By fitting the diagrams of the investigated Cepheids with second order polynomials, along with a sinusoidal modulation superimposed when statistically motivated, and then applying the method described by Sterken (2005) we could determine the rates of period change for each of the variable stars. Our results and conclusions on period change rates essentially match those presented by Turner et al. (2006): the values inferred by us are well explained by the evolutionary models discussed in that work and the ratio of Cepheids showing positive and negative period changes is also identical, if one considers the possible selection effects (70% of our sample Cepheids show positive period changes, while this value was 67% in Turner et al. (2006)). The deviations from evolutionary models we find in our sample are also very similar to the previous results: several short period Cepheids exhibit a period change rate that fall between the value ranges expected for first and third crossing Cepheids, while several intermediate period Cepheids show a period change rate that is smaller than predicted by evolutionary models.
As it was discussed by Neilson et al. (2012), the inclusion of convective core overshooting and enhanced mass loss can explain these deviations. Moreover, they showed that the difference between the ratio of stars showing positive and negative period changes for observations and predictions (where the unmodified evolutionary models estimate significantly larger fraction of positive period change Cepheids, namely 85%) can also be explained through mass loss, although they note that there is currently no explanation for large mass loss rate they found to be required. Complementary to this work, Miller et al. (2020) investigated how rotation and convective core overshooting alter the distribution of period change rates, finding that they do not assert significant influence on then, despite being important parameters for the evolution of Cepheids.
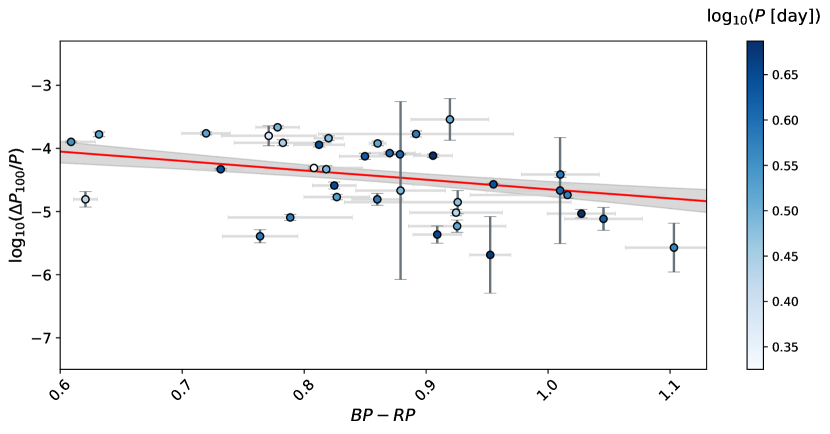
As it was noted by Turner et al. (2006), the period change rate could be an important probe for the estimation of stellar properties. To test this observationally, we correlated the period change rates of Cepheids to their colours for a moderate range of pulsation periods (between 2 and 5 days) as seen in Fig. 23. The period range was chosen based on the CMD, as the relevant effect was visible primarily for short period Cepheids, while for longer periods the scatter on the CMD was too large for detecting a meaningful effect. As seen in the plot, bluer Cepheids exhibit slightly larger period change rates, which decrease toward the red edge of the instability strip. The individual points are coloured by the pulsation period length, which show no significant correlation with either the period change rate or the colour within the considered period range. This agrees well and observationally validates the statement in Turner & Berdnikov (2004), in which they note that at a given pulsation period, Cepheids at the high-temperature edge of the instability strip should exhibit larger rate of period change than those at the low-temperature edge, due to the former having larger masses.
This demonstrates that the period change rate can indeed provide a valuable observational probe for the determination of physical parameters. In addition to the pulsation period, which can be used to estimate both the “vertical” and the “horizontal” position of the Cepheid within the instability strip, and the corresponding physical parameters owing to the period-luminosity and period-colour relations (assuming an underlying mass-luminosity relation and a pulsation model, see, e.g., Beaulieu et al. 2001), the period change rate can independently probe the “horizontal” direction. Since the period and period change rate values are not tightly correlated due to the various crossing modes, mass loss, and convective core overshooting rates, this correlation is not bound to the pulsation period, which is also well shown in Fig. 23. Henceforth, the period change rate could be used to enhance the precision of colour and temperature estimation of Cepheids when coupled with the period values. Further investigation of this correlation is beyond the scope of this work, however we note that it would be worthwhile to analyse to what extent can it be used for the inference of physical properties. Combined with the new data from Gaia it could provide a simple way to constrain the effective temperature of the variables compared to the conventional spectroscopic method, yet it could prove to be more precise than the current, solely colour based empirical relations.
Owing to the long temporal coverage of the newly calculated diagrams one can not only calculate the period change rate, but its acceleration as well: in such cases the resulting diagrams systematically deviate from the parabolic fit, since their complete description would require higher-order polynomials, as it was also noted in previous works (Szabados, 1983; Fernie, 1984; Turner et al., 2006). In our sample, most of the long period Cepheids exhibit such diagrams (most notably, EV Aql, S Vul and SV Vul). Naturally, all Cepheids are expected to show such high order terms in their diagrams, but due to the short observed timeframes these terms are usually negligible for Cepheids that exhibit smaller period change rates.
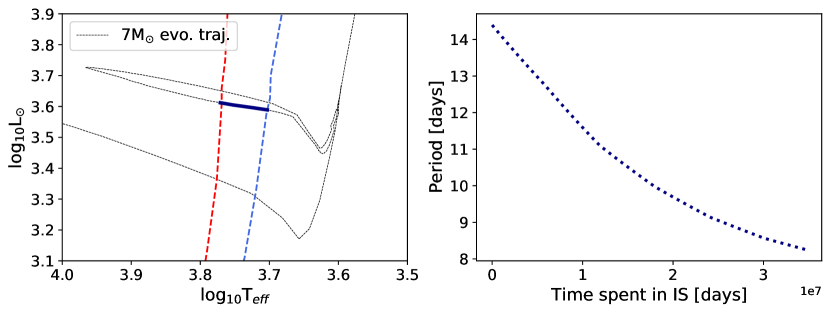
To visualize this expectation we attempted to recover the higher order period change from theoretical models: by adopting the evolutionary trajectory models and instability strip edges from Georgy et al. (2013) and Anderson et al. (2016) respectively, and the period-mass-luminosity-temperature relations of De Somma et al. (2020), we calculated how the pulsation period would change for a single star due to stellar evolution. An example of the results is shown in Fig. 24: the theoretical models also yield non-linearly changing period, which validates the expectation for higher order terms in the values. Currently, the interpretation of these higher order terms is not yet complete, but they will also yield additional valuable information about the pulsation of these stars similarly to the period change rates.
4.2 Period fluctuations
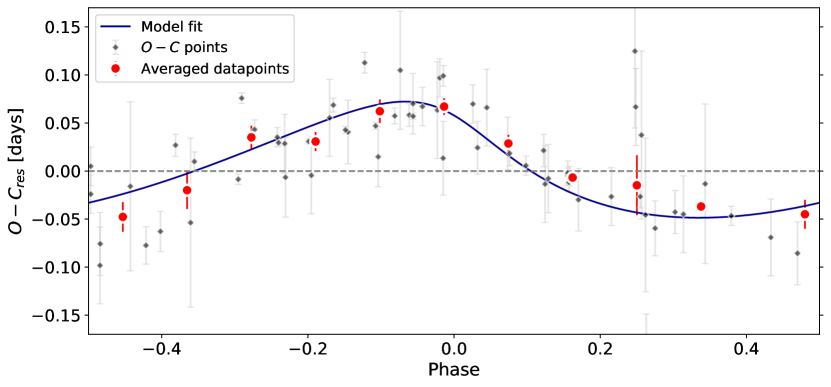
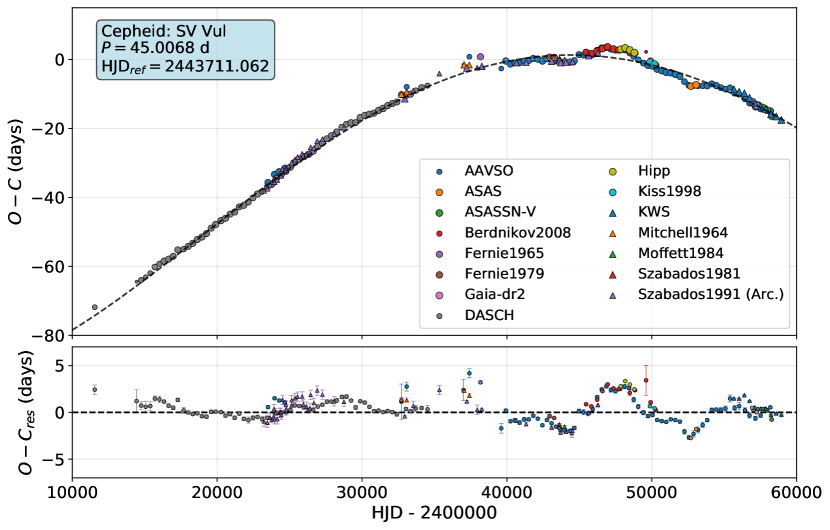
Apart from examining the overall rate of period change for the Cepheids in our sample, the diagrams also made it possible to investigate random fluctuations present in the pulsation. An example for such fluctuation signal can be seen in the diagram of SV Vul (Fig. 25): it shows a long-term trend corresponding to the evolution of the Cepheid and a quasi-periodic wavelike signal superimposed, with varying shape. Such wavelike signals cannot be explained by LiTE, as their amplitudes are too large compared to their period, and the shape of the waves also changes in time. The physical explanation for such modulations is that random fluctuations in the pulsation period accumulate and cause wavelike signals of varying shapes. For long, this was the only classical Cepheid for which fluctuations were detected (Turner et al., 2009). Recently, Rodríguez-Segovia et al. (2021) also found that five additional long period Cepheids in the LMC reliably show such large amplitude fluctuations, highlighting their ubiquity. It was expected that fluctuations are present in most Cepheid variables as well, but detection would require continuous space-based photometry, where consecutive epochs can be observed Turner et al. (2010). Multiple studies attempted to detect and quantify fluctuations this way, as we discussed in Sect. 1.
As we will show below, such period fluctuations are more common among Cepheids than previously thought. It has been shown that longer period variables, like RV Tauri or Mira stars, can exhibit long term quasi-periodic waves in their diagrams due to the period fluctuations, which becomes more prominent for longer pulsation periods (Percy et al., 1997; Percy & Colivas, 1999; Molnár et al., 2019), however, no such conclusions were drawn for classical Cepheids. In the sample of stars we investigated, we found that 51 Cepheid showed wavelike signals in the residual diagrams that most probably originated from fluctuations, apart from the Cepheids that were termed ‘peculiar’ in the previous sections. To select these Cepheids from our sample, we performed F-tests on their diagram fits to analyse the residuals of the models and to check whether they indicate that the use of more complex models (i.e. which also fit for an assumed wavelike modulation) are validated. We compared three different models for the test: the constant period model (linear diagram), the linear period change model (parabolic diagram) and the linear period change plus wavelike modulation (superposition of a parabolic and a sinusoidal change), in which case we simultaneously fit for both the evolutionary changes and the modulation. Table B.1 of the Appendix show the results obtained for the different model pairs. We included Cepheids in the fluctuating sample when the F-test conducted for the comparison of the parabolic and parabolic plus wave fits yielded an F-statistics larger than 10, which means that the more complex model was favoured at a significance level of 0.99 (with the difference between the degrees of freedom of the compared models being ). To remove possible contaminations, or Cepheids for which the fitting code yielded erroneous results, we rejected every star where the period of the sinusoidal fit was either shorter than 3000 days (8-10 times the folding time used for the construction of the diagrams, to avoid sampling effects) or longer than five quarters of the observed time frame (in which case the sinusoidal waveform overfitted the parabolic change).
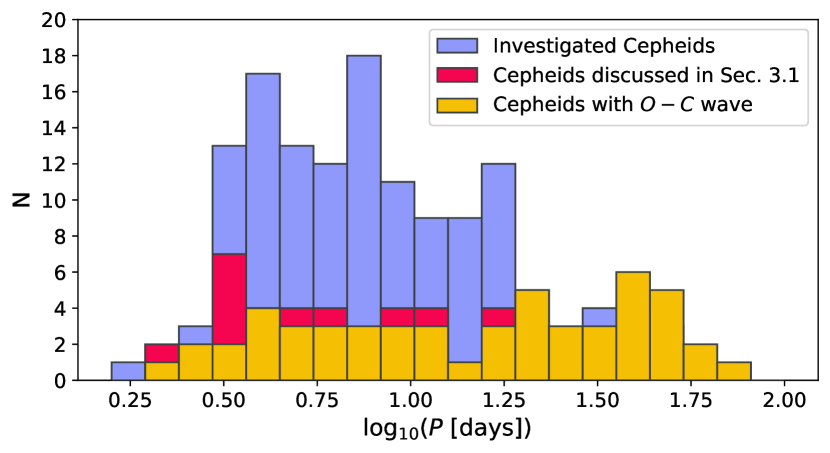
In Fig. 26 we plotted the distribution of the investigated Cepheids according to their pulsation periods along with the information about what fraction of Cepheids show fluctuations in their diagram. As seen on the plot, all long period () Cepheids show fluctuations (with the sole exception being EZ Vel, however the temporal coverage of its photometry did not allow for a detailed fit for the diagram), which was expected based on the behaviour RV Tauri stars with similar periods. The ratio of stars exhibiting such modulations starts to drop for intermediate period stars and falls to a value of 25–40%, which remains approximately the same for shorter period Cepheids too. We suspect that at least a fraction of the stars that were not included in the fluctuating sample also show wavelike modulations of such nature as well, however their overall amplitude was lower than the scatter of the residual diagram, hence they remained below detectability.
It is important to note that the apparently general fact, that all longer period () Cepheids exhibit period fluctuations to some extent, has not been known before, thus it can have important implications for the calibration of the distance ladder via PL relation of Cepheids. Extragalactic Cepheids are generally difficult to observe, as their light curve spans only a few hundred or a thousand days at most, with sparse sampling. Consequently, it is impossible to determine their fluctuation-free, evolution based “true period”, and the resulting period value can be affected by the cumulative effect of the period fluctuations. Whereas the shorter period () population of these Cepheids exhibit only smaller fluctuations and the possible error on the inferred period values remains below a few hundredths of a day, for longer period Cepheids (e.g., for one of the longest period Cepheids in our sample, for S Vul) such fluctuations could lead to a cumulative effect that alters the inferred period by more than 0.5 day, which would then add a detectable term to the final uncertainty. While such effects might not affect the PL relationship significantly due to the use of a larger sample of stars or the inclusion of shorter period variables (for which the period determination is more accurate) as was done in Riess et al. (2019), it could severely increase the uncertainty of the results based entirely on long or ultra-long period Cepheids (e.g., Bird et al. 2009).
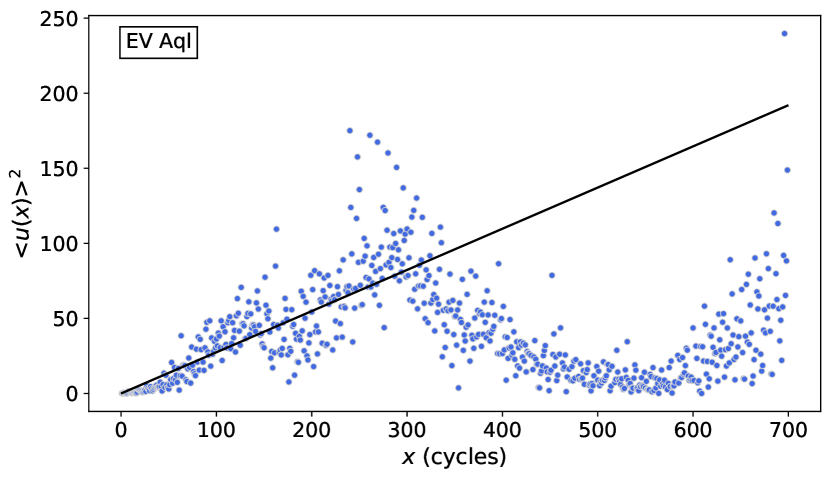
We also measured how the strength and size of these accumulated period fluctuations change for different pulsations periods. For this purpose, we applied the Eddington–Plakidis method (E–P method) (Eddington & Plakidis, 1929) on each Cepheid in our sample that showed signs of fluctuations. According to this method, one must whiten the calculated values for the effect of evolution, then take the absolute values of all delays for each th maximum, , for every possible cycle separation in the residual dataset. According to Eddington & Plakidis (1929), if the irregular signal is present due to the fluctuation of the phase and period at the same time, then the means of all accumulated delays should be related to the random period fluctuation by Eq. 4:
| (4) |
where characterizes the errors in the measured times used for the data points.
We produced Fig. 28 by comparing the resulting period fluctuation parameter (obtained by fitting the E–P diagrams for cycle separations) with the corresponding pulsation period, which shows that there is a significant connection between the size of fluctuations and the pulsation period.
However, the E–P method has two drawbacks which are inherent to its definition, one of which is that one has to manually set what maximal cycle separation is considered for the linear fit described above. There is no statistical background on what one should choose for the maximal cycle separation, and since Cepheids show a very large variation of such E–P diagrams, one has to set this value manually. This makes the method infeasible for large datasets, since one either has to tune this value for each star, or pick a general value, which might not be optimal for every sample member. Due to this, the resulting fluctuation parameter will also be more uncertain, and its value will be based on a modelling choice. An example for this is also shown in Fig. 27: as seen in the figure, multiple ranges could be considered for the fitting of the diagram, which sets a range for the final fluctuation parameter values as well. Additionally, the E-P method also has the disadvantage of not being able to provide an upper limit for the fluctuation parameter, therefore if the diagram is dominated by uncorrelated noise, the resulting E–P diagram will show no structures, unlike in Fig. 27. Hence, no linear fitting can be carried out in those scenarios.
To circumvent this issue, we calculated a correlation diagram similar to Fig. 28 using the result of the diagram fits instead. For each of the Cepheids where fluctuations were found by the F-test, we simply correlated the measured amplitude of the wavelike modulation with the pulsation period of the star. Unlike in the case of the Eddington-Plakidis method, here we were able to determine a detectability limit even when the amplitude of the modulation could not be measured, i.e., when no fluctuations were found: in this case the detectability limit could still be determined as the maximal value of the Fourier spectrum calculated for the residuals after fitting and subtracting the evolutionary changes.
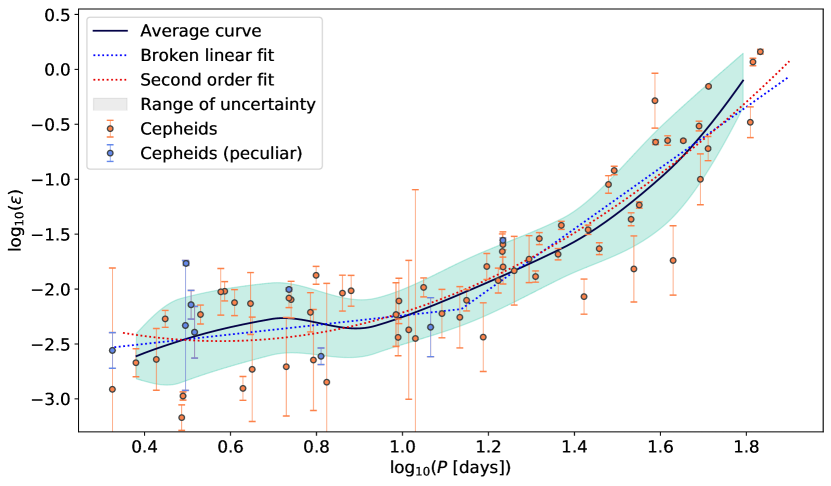
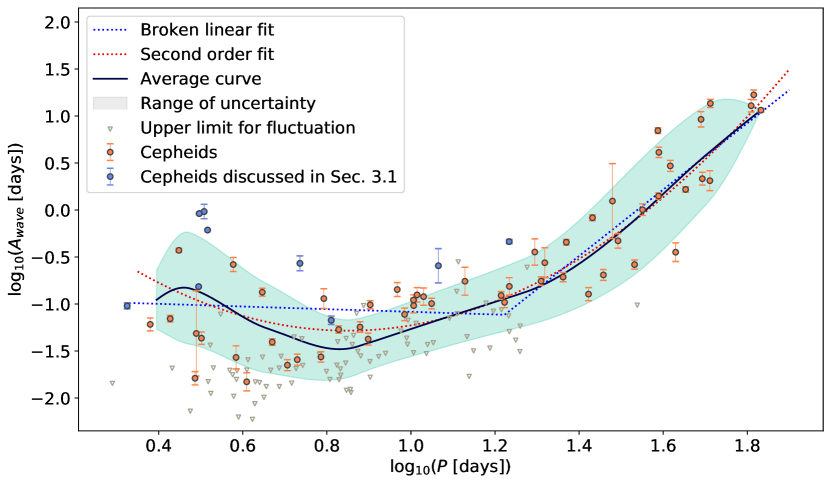
Through this procedure we obtained Fig. 29, which shows similar trends as the Eddington–Plakidis method based diagram, except for the shorter period Cepheids. As expected, the detectability limit drawn out by the non-detections increases slightly with period as the light curves of the Cepheids become more and more complex, thus more difficult to fit, but still, a reasonable amount of fluctuating Cepheids were found throughout the investigated period range, which defines the underlying trend reliably. As it is shown by the average curve in Fig. 29, the amplitude of the fluctuations decreases linearly against the logarithm of the period for longer period Cepheids (), only to reach a minimum for intermediate period Cepheids around a period of and increases again for short period stars. We note that the Cepheids where we found no modulations, and hence are marked as non-detections on the diagram, can significantly influence the position of this minimum. However, the fact that the largest detected fluctuations in the intermediate period range stay well below the maximal ones found for both shorter and longer period Cepheids supports the notion that there is a minimum for these modulations in the period range of bump Cepheids, suggesting a quenching mechanism for these variables. Moreover, Fig. 29 also supports the LiTE explanation described above for the modulation found for RX Aur and Y Oph, as both stars are outliers for the trend defined by the fluctuations.
We also investigated how easing the F-test based constraints affects the results: if we lower the confidence level from 0.99 to 0.95, the F-test based procedure favours the inclusion of further 23 Cepheids into the fluctuation sample. Most of these stars fall in the period range of bump Cepheids, with the amplitudes of the wavelike signals being close or at the noise level of their diagrams. In case these stars are included, the fraction of Cepheids showing fluctuations jumps to a level of 50% instead of 25-40%, and remains constant thorough the lower end of the pulsation period range, suggesting an even higher frequency for the presence of these modulations. In terms of fluctuation strength, since the fluctuation amplitudes are close to the detection limits assumed for these stars in Fig. 29, which were taken into account for the fitting, neither the actual position of the found fluctuation minimum, nor the general trend changes significantly if we ease the constraints.
As seen in the figures, multiple interpretations are possible: since there are two separate point clouds in the resulting plot, we can either assume that the fluctuation features observed in them are of the same origin, or of different ones.
By assuming that the fluctuations detected for short and long period Cepheids are of the same origin, the correlation plot can be fitted by a quadratic function. This fit shows that the size of fluctuations decreases from the longer periods towards shorter periods, reaching a minimum at the lower end of the period range of bump Cepheids, then growing back again for shorter period stars. This picture agrees with the presence of a quenching mechanism for bump Cepheids, and it also follows well the average curve.
If one assumes that the two parts of the fluctuation diagram are of different origins (i.e. the fluctuations are of different nature for long and short period stars), then the plot can be fitted by a broken linear curve. One wing of this broken linear curve on the Eddington-Plakidis based diagram (Fig. 28) shows that for long period Cepheids the fluctuations scale linearly with the pulsation period, which agrees with the findings of Percy & Colivas (1999) for longer period Mira stars, indicating that this fluctuation effect is a similar period fluctuation in both types of variable stars. However, in this case there is no explanation for the short period wing, as this fit would suggest that fluctuations detected for shorter period Cepheids are of different origin than the former one. In the case of the amplitude-based diagram, the broken linear fit shows a similar linear trend for the longer period Cepheids. Based on these fits, the linear scaling present between the fluctuations and the period for long period Cepheids weakens considerably on intermediate and short period ranges, as the level of fluctuations seems not to change as significantly over this range.
The datapoints at short periods () also show a much larger scatter around the model fits compared to other period ranges, with a clear gap in the amplitude distribution (around , where we find several Cepheids with both significantly larger and smaller fluctuations in this period range). This can indicate that there are more than one type of fluctuations present at short periods, one for normal and one for overtone Cepheids, presumably (with smaller and larger fluctuations, respectively). Their comprehensive modelling would require a more complete sample of shorter period Cepheids, but such an analysis is beyond the scope of this paper. Nevertheless, the supposed models show that either the change in the nature of fluctuation signals occurs at, or the overall strength of the fluctuations have a minimal value close to the period range of the bump Cepheids, both of which suggests that the pulsation of the bump Cepheids is subject to less such random fluctuations and provides an additional proof for the increased stability of the pulsation of these stars.
5 Summary
In this work we presented updated or completely new diagrams for a total of 148 Classical Cepheids. Out of these stars, four Cepheids (RX Aur, UY Mon, Y Oph, and AW Per) show signs of possible LiTE (only the case of AW Per and RX Aur has been known before). Further five Cepheids (XZ CMa, UX Car, R Cru, DT Cyg, and BN Pup) exhibit diagrams which either further confirm or raise the question of their binary nature. For the interesting cases of BY Cas, V532 Cyg, DX Gem and VZ CMa we found large amplitude fluctuations influencing the pulsation of the variables, while for IR Cep we found a similarly large amplitude and complex, yet stable wavelike signal superimposed on the evolutionary changes of the star, which could either be caused by fluctuations or binarity. The proper understanding of these peculiar variations would require further analysis of these stars.
By analysing the obtained set of diagrams showing evolutionary changes, we measured the rates of period change for the individual stars and compared these values to those given by stellar evolution models. The ratio of the number of Cepheids showing positive and negative period changes in our random sample agrees with the ratio given by models that include enhanced mass loss. By plotting the CMD of the obtained sample of Cepheids using the recently published Gaia EDR3 data, we could show that the rates of period change do not increase as consistently toward the cooler and brighter stars as one would expect based on the models, but the rates of period change vary systematically from the blue edge to the red edge of the instability strip. Considering this, it possibly yields an observational evidence that the rate of period change carries significant information about the physics of these variables.
After fitting and analysing the obtained diagrams, we found that a significant fraction of the Cepheids in our sample exhibit detectable period fluctuations in the form of quasi-periodic waves, similar to those found in the case of other, longer period pulsating stars. By measuring the strength of the fluctuations using the Eddington-Plakidis method and a model fitting based approach, we found that the period fluctuation scales linearly for longer period Cepheids (in a logarithmic sense), which is similar to the behaviour of Mira stars, while for shorter period Cepheids this scaling significantly weakens or disappears. The presence of such fluctuations and their increasing strength for long period Cepheids can have important implications for PL relation based distance determinations, as they could add an additional uncertainty term to the pulsation period, that was previously unaccounted for. Due to the detection limits set by the scatter in the data, we could only detect these fluctuations in about a third of the investigated short and intermediate period Cepheids. We showed that the explanation and analysis of the dependence of fluctuation strength on the periods of short period Cepheids depends largely on whether one or two fluctuation processes are assumed: in the first case the fluctuation strength shows a minimum in the range of bump Cepheids, then it increases back at short periods, while in the latter case we find that the fluctuation strength depends on only weakly or is independent of the period for shorter period stars. Either way, the scatter among the fluctuation strengths increases for short period Cepheids, which suggests a non-negligible contribution from overtone Cepheids that exhibit larger fluctuation signals. Whichever interpretation is correct, the lack of strongly fluctuating bump Cepheids and the fluctuation minimum found by the joint fit in their period range suggests the increased stability of the pulsation of these stars, which is in agreement with the presence of a quenching mechanism.
Data availability
All source data used for our analysis are openly available online, except for the measurements carried out at the Piszkéstető Observatory, which are published as online material accompanying the article. The resulting files, from which the conclusions were drawn, are also published in the online supplement and will be accessible in an accompanying Vizier table. The data and the code used for our analysis is available on the GitHub page of the author: https://github.com/Csogeza/O-C_extract.
Acknowledgements
We thank the referee for their useful comments that helped to improve this paper. The research was completed with the extensive use of Python, along with the numpy (Harris et al., 2020), scipy (Virtanen et al., 2020) and astropy (Astropy Collaboration et al., 2018) modules, and with the R software (R Core Team, 2020). Some of the data used in the article were made available to the community through the Exoplanet Archive on behalf of the KELT project team. This research made use of NASA’s Astrophysics Data System (ADS). For the data search and retrieval the authors made extensive use of the Vizier, CDS and Simbad websites of the Strasbourg astronomical Data Center (https://cds.u-strasbg.fr/). This work has made use of data from the European Space Agency (ESA) mission Gaia (https://www.cosmos.esa.int/gaia), processed by the Gaia Data Processing and Analysis Consortium (DPAC, https://www.cosmos.esa.int/web/gaia/dpac/consortium). Funding for the DPAC has been provided by national institutions, in particular the institutions participating in the Gaia Multilateral Agreement. We acknowledge with thanks the variable star observations from the AAVSO International Database contributed by observers worldwide and used in this research. The research leading to these results has been supported by the Hungarian National Research, Development and Innovation Office (NKFIH) grants K-129249, GINOP-2.3.2-15-2016-00003 and Élvonal KKP-137523 (‘SeismoLab’), and by the Lendület LP2018-7/2021 grant of the Hungarian Academy of Sciences. Cs. K. acknowledges the support provided from the ÚNKP-20-2 and ÚNKP-21-2 New National Excellence Programs of the Ministry of Innovation and Technology from the source of the National Research, Development and Innovation Fund.
References
- Anders et al. (2019) Anders F., et al., 2019, A&A, 628, A94
- Anderson et al. (2013) Anderson R. I., Eyer L., Mowlavi N., 2013, MNRAS, 434, 2238
- Anderson et al. (2014) Anderson R. I., Ekström S., Georgy C., Meynet G., Mowlavi N., Eyer L., 2014, A&A, 564, A100
- Anderson et al. (2016) Anderson R. I., Saio H., Ekström S., Georgy C., Meynet G., 2016, A&A, 591, A8
- Arellano Ferro (1984) Arellano Ferro A., 1984, MNRAS, 209, 481
- Arellano Ferro et al. (1998) Arellano Ferro A., Rojo Arellano E., González-Bedolla S., Rosenzweig P., 1998, ApJS, 117, 167
- Arp et al. (1959) Arp H., Sandage A., Stephens C., 1959, ApJ, 130, 80
- Asarnova (1957) Asarnova T. A., 1957, Peremennye Zvezdy, 12, 76
- Astropy Collaboration et al. (2018) Astropy Collaboration et al., 2018, AJ, 156, 123
- Babel et al. (1989) Babel J., Burki G., Mayor M., Waelkens C., Chmielewski Y., 1989, A&A, 216, 125
- Bahner & Mavridis (1971) Bahner K., Mavridis L. N., 1971, Ann. Fac. Tech. Univ. Thessaloniki, 5, 65
- Bahner et al. (1962) Bahner K., Hiltner W. A., Kraft R. P., 1962, ApJS, 6, 319
- Bailer-Jones et al. (2021) Bailer-Jones C. A. L., Rybizki J., Fouesneau M., Demleitner M., Andrae R., 2021, AJ, 161, 147
- Balázs-Detre & Detre (1965) Balázs-Detre J., Detre L., 1965, Veroeffentlichungen der Remeis-Sternwarte zu Bamberg, 27, 184
- Barnes et al. (1987) Barnes Thomas G. I., Moffett T. J., Slovak M. H., 1987, ApJS, 65, 307
- Barnes et al. (1997) Barnes T. G. I., Fernley J. A., Frueh M. L., Navas J. G., Moffett T. J., Skillen I., 1997, PASP, 109, 645
- Beaulieu et al. (2001) Beaulieu J. P., Buchler J. R., Kolláth Z., 2001, A&A, 373, 164
- Bellinger et al. (2020) Bellinger E. P., Kanbur S. M., Bhardwaj A., Marconi M., 2020, MNRAS, 491, 4752
- Berdnikov (2008) Berdnikov L. N., 2008, VizieR Online Data Catalog, p. II/285
- Berdnikov (2019a) Berdnikov L. N., 2019a, Astronomy Letters, 45, 435
- Berdnikov (2019b) Berdnikov L. N., 2019b, Astronomy Letters, 45, 593
- Berdnikov (2019c) Berdnikov L. N., 2019c, Astronomy Letters, 45, 677
- Berdnikov & Caldwell (2001) Berdnikov L. N., Caldwell J. A. R., 2001, Journal of Astronomical Data, 7, 3
- Berdnikov & Pastukhova (1994) Berdnikov L. N., Pastukhova E. N., 1994, Astronomy Letters, 20, 479
- Berdnikov & Stevens (2010) Berdnikov L. N., Stevens I. R., 2010, in Sterken C., Samus N., Szabados L., eds, Variable Stars, the Galactic halo and Galaxy Formation. p. 207
- Berdnikov & Turner (2001) Berdnikov L. N., Turner D. G., 2001, Astronomical and Astrophysical Transactions, 19, 689
- Berdnikov & Turner (2004) Berdnikov L. N., Turner D. G., 2004, Astronomical and Astrophysical Transactions, 23, 599
- Berdnikov et al. (1997) Berdnikov L. N., Ignatova V. V., Pastukhova E. N., Turner D. G., 1997, Astronomy Letters, 23, 177
- Berdnikov et al. (2009) Berdnikov L. N., Kniazev A. Y., Kravtsov V. V., Pastukhova E. N., Turner D. G., 2009, VizieR Online Data Catalog, p. J/PAZh/35/348
- Berdnikov et al. (2011) Berdnikov L. N., Kniazev A. Y., Sefako R., Kravtsov V. V., Pastukhova E. N., Zhujko S. V., 2011, VizieR Online Data Catalog, p. J/AZh/88/886
- Berdnikov et al. (2014) Berdnikov L. N., Kniazev A. Y., Sefako R., Kravtsov V. V., Zhujko S. V., 2014, Astronomy Letters, 40, 125
- Berdnikov et al. (2015) Berdnikov L. N., Kniazev A. Y., Sefako R., Dambis A. K., Kravtsov V. V., Zhuiko S. V., 2015, Astronomy Letters, 41, 23
- Berdnikov et al. (2019) Berdnikov L. N., Kniazev A., Dambis A., Kravtsov V. V., 2019, Peremennye Zvezdy, 39, 2
- Bersier (2002) Bersier D., 2002, ApJS, 140, 465
- Bird et al. (2009) Bird J. C., Stanek K. Z., Prieto J. L., 2009, ApJ, 695, 874
- Bono et al. (1999) Bono G., Marconi M., Stellingwerf R. F., 1999, ApJS, 122, 167
- Borgniet et al. (2019) Borgniet S., et al., 2019, A&A, 631, A37
- Buchancowa et al. (1972) Buchancowa N., Wisniewski W., Kunchev P., 1972, Information Bulletin on Variable Stars, 727, 1
- Burki (1985) Burki G., 1985, in Madore B. F., ed., IAU Colloq. 82: Cepheids: Theory and Observation. p. 71
- Burnashev & Burnasheva (2009) Burnashev V. I., Burnasheva B. A., 2009, Bulletin Crimean Astrophysical Observatory, 105, 78
- Casagrande & VandenBerg (2018) Casagrande L., VandenBerg D. A., 2018, MNRAS, 479, L102
- Chen et al. (2015) Chen X., de Grijs R., Deng L., 2015, MNRAS, 446, 1268
- Connolly et al. (1983) Connolly L. P., Palmer L. H., Goodrich B. D., Halbedel W., Africano J. L., Henry G. W., 1983, PASP, 95, 192
- Coulson & Caldwell (1985) Coulson I. M., Caldwell J. A. R., 1985, South African Astronomical Observatory Circular, 9, 5
- Cousins & Lagerweij (1968) Cousins A. W. J., Lagerweij H. C., 1968, Monthly Notes of the Astronomical Society of South Africa, 27, 138
- Cousins & Lagerweij (1971) Cousins A. W. J., Lagerweij H. C., 1971, Monthly Notes of the Astronomical Society of South Africa, 30, 12
- Cox (1998) Cox A. N., 1998, ApJ, 496, 246
- De Somma et al. (2020) De Somma G., Marconi M., Molinaro R., Cignoni M., Musella I., Ripepi V., 2020, ApJS, 247, 30
- Dean (1977) Dean J. F., 1977, Monthly Notes of the Astronomical Society of South Africa, 36, 3
- Dean (1981) Dean J. F., 1981, South African Astronomical Observatory Circular, 6, 10
- Deasy & Wayman (1985) Deasy H. P., Wayman P. A., 1985, MNRAS, 212, 395
- Deeming (1975) Deeming T. J., 1975, Ap&SS, 36, 137
- Derekas et al. (2012) Derekas A., et al., 2012, MNRAS, 425, 1312
- Derekas et al. (2017) Derekas A., et al., 2017, MNRAS, 464, 1553
- Detre (1935) Detre L., 1935, Astronomische Nachrichten, 257, 361
- Diethelm & Tammann (1982) Diethelm R., Tammann G. A., 1982, A&AS, 47, 335
- Eddington & Plakidis (1929) Eddington A. S., Plakidis S., 1929, MNRAS, 90, 65
- Eggen (1951) Eggen O. J., 1951, ApJ, 113, 367
- Eggen (1983) Eggen O. J., 1983, AJ, 88, 998
- Eggen (1985) Eggen O. J., 1985, AJ, 90, 1297
- Eggen et al. (1957) Eggen O. J., Gascoigne S. C. B., Burr E. J., 1957, MNRAS, 117, 406
- Erleksova (1978) Erleksova G. E., 1978, Information Bulletin on Variable Stars, 1460, 1
- Erleksova & Irkaev (1982) Erleksova G. E., Irkaev B. N., 1982, Peremennye Zvezdy, 21, 715
- Evans (1992) Evans N. R., 1992, ApJ, 389, 657
- Evans et al. (2000) Evans N. R., Vinko J., Wahlgren G. M., 2000, AJ, 120, 407
- Evans et al. (2015) Evans N. R., et al., 2015, MNRAS, 446, 4008
- Evans et al. (2016a) Evans N. R., et al., 2016a, AJ, 151, 108
- Evans et al. (2016b) Evans N. R., Bond H. E., Schaefer G. H., Mason B. D., Tingle E., Karovska M., Pillitteri I., 2016b, AJ, 151, 129
- Eyles et al. (2003) Eyles C. J., et al., 2003, Sol. Phys., 217, 319
- Feinstein & Muzzio (1969) Feinstein A., Muzzio J. C., 1969, A&A, 3, 388
- Fernie (1970) Fernie J. D., 1970, AJ, 75, 244
- Fernie (1979) Fernie J. D., 1979, ApJ, 231, 841
- Fernie (1984) Fernie J. D., 1984, in Maeder A., Renzini A., eds, IAUS Vol. 105, Observational Tests of the Stellar Evolution Theory. p. 441
- Fernie (1990a) Fernie J. D., 1990a, PASP, 102, 905
- Fernie (1990b) Fernie J. D., 1990b, ApJ, 354, 295
- Fernie & Garrison (1981) Fernie J. D., Garrison R. G., 1981, PASP, 93, 330
- Fernie et al. (1965) Fernie J. D., Demers S., Marlborough J. M., 1965, AJ, 70, 482
- Fernie et al. (1995) Fernie J. D., Khoshnevissan M. H., Seager S., 1995, AJ, 110, 1326
- Filatov (1957) Filatov G. S., 1957, Peremennye Zvezdy, 11, 474
- Floria & Kukarkina (1953) Floria N. F., Kukarkina N. P., 1953, Trudy Gosudarstvennogo Astronomicheskogo Instituta, 23, 3
- Freedman et al. (2001) Freedman W. L., et al., 2001, ApJ, 553, 47
- Fulton et al. (2018) Fulton B. J., Petigura E. A., Blunt S., Sinukoff E., 2018, PASP, 130, 044504
- Gaia Collaboration (2016) Gaia Collaboration 2016, Astronomy and Astrophysics, 595, A1
- Gaia Collaboration (2018) Gaia Collaboration 2018, Astronomy and Astrophysics, 616, A1
- Gaia Collaboration (2021) Gaia Collaboration 2021, A&A, 649, A1
- Gallenne et al. (2014) Gallenne A., Kervella P., Mérand A., Evans N. R., Girard J. H. V., Gieren W., Pietrzyński G., 2014, A&A, 567, A60
- Gaposchkin (1958) Gaposchkin S., 1958, AJ, 63, 234
- Georgy et al. (2013) Georgy C., et al., 2013, A&A, 558, A103
- Gieren (1981) Gieren W., 1981, ApJS, 47, 315
- Gieren (1985) Gieren W. P., 1985, ApJ, 295, 507
- Gieren et al. (1990) Gieren W. P., Moffett T. J., Barnes Thomas G. I., Matthews J. M., Frueh M. L., 1990, AJ, 99, 1196
- Glushkova et al. (2015) Glushkova E. V., Zabolotskikh M. V., Rastorguev A. S., Grudskaya A. V., Koposov S. E., 2015, Baltic Astronomy, 24, 360
- Gorynya et al. (1994) Gorynya N. A., Samus N. N., Rastorgouev A. S., 1994, Information Bulletin on Variable Stars, 4130, 1
- Gorynya et al. (1996) Gorynya N. A., Rastorguev A. S., Samus N. N., 1996, Astronomy Letters, 22, 33
- Gorynya et al. (1998) Gorynya N. A., Samus’ N. N., Sachkov M. E., Rastorguev A. S., Glushkova E. V., Antipin S. V., 1998, Astronomy Letters, 24, 815
- Grayzeck (1978) Grayzeck E. J., 1978, AJ, 83, 1397
- Grindlay et al. (2012) Grindlay J., Tang S., Los E., Servillat M., 2012, in Griffin E., Hanisch R., Seaman R., eds, IAU Symposium Vol. 285, New Horizons in Time Domain Astronomy. pp 29–34 (arXiv:1211.1051), doi:10.1017/S1743921312000166
- Groenewegen (2020) Groenewegen M. A. T., 2020, A&A, 635, A33
- Groenewegen & Oudmaijer (2000) Groenewegen M. A. T., Oudmaijer R. D., 2000, A&A, 356, 849
- Hacke (1989) Hacke G., 1989, Zentralinstitut fuer Astrophysik Sternwarte Sonneberg Mitteilungen ueber Veraenderliche Sterne, 11, 194
- Hacke & Richert (1990) Hacke G., Richert M., 1990, Veroeffentlichungen der Sternwarte Sonneberg, 4, 336
- Hackstein et al. (2015) Hackstein M., et al., 2015, Astronomische Nachrichten, 336, 590
- Harris (1980) Harris H. C., 1980, PhD thesis, Washington Univ., Seattle.
- Harris et al. (2020) Harris C. R., et al., 2020, Nature, 585, 357–362
- Havlen (1976) Havlen R. J., 1976, A&A, 49, 307
- Heiser (1996) Heiser A. M., 1996, PASP, 108, 603
- Hellerich (1935) Hellerich J., 1935, Astronomische Nachrichten, 256, 221
- Henden (1980) Henden A. A., 1980, MNRAS, 192, 621
- Henden (1996) Henden A. A., 1996, AJ, 112, 2757
- Hoffmeister (1960) Hoffmeister C., 1960, Veroeffentlichungen der Sternwarte Sonneberg, 4, 315
- Howell et al. (2014) Howell S. B., et al., 2014, PASP, 126, 398
- Imbert (1981) Imbert M., 1981, Information Bulletin on Variable Stars, 1983, 1
- Imbert (1999) Imbert M., 1999, A&AS, 140, 79
- Irwin (1961) Irwin J. B., 1961, ApJS, 6, 253
- Kafka (2021) Kafka S., 2021, Observations from the AAVSO International Database,
- Kaltcheva & Golev (2012) Kaltcheva N. T., Golev V. K., 2012, PASP, 124, 128
- Kervella et al. (2019a) Kervella P., et al., 2019a, A&A, 623, A116
- Kervella et al. (2019b) Kervella P., et al., 2019b, A&A, 623, A117
- Kiehl & Hopp (1977) Kiehl M., Hopp U., 1977, Information Bulletin on Variable Stars, 1329, 1
- Kienzle et al. (1999) Kienzle F., Moskalik P., Bersier D., Pont F., 1999, A&A, 341, 818
- Kiss (1998) Kiss L. L., 1998, MNRAS, 297, 825
- Klawitter (1971) Klawitter P., 1971, Information Bulletin on Variable Stars, 548, 1
- Kochanek et al. (2017) Kochanek C. S., et al., 2017, PASP, 129, 104502
- Koukarkina (1954) Koukarkina N. P., 1954, Peremennye Zvezdy, 10, 92
- Kovacs & Szabados (1979) Kovacs G., Szabados L., 1979, Information Bulletin on Variable Stars, 1719, 1
- Kox (1935) Kox H., 1935, Astronomische Nachrichten, 256, 21
- Krebs (1936) Krebs C., 1936, Astronomische Nachrichten, 261, 109
- Kun & Szabados (1988) Kun M., Szabados L., 1988, Information Bulletin on Variable Stars, 3241, 1
- Kurochkin (1954) Kurochkin N. E., 1954, Peremennye Zvezdy, 10, 171
- Kwee (1967) Kwee K. K., 1967, Bull. Astron. Inst. Netherlands, 19, 260
- Landolt (1971) Landolt A. U., 1971, PASP, 83, 43
- Laur et al. (2017) Laur J., Kolka I., Eenmäe T., Tuvikene T., Leedjärv L., 2017, A&A, 598, A108
- Lenz & Breger (2005) Lenz P., Breger M., 2005, Communications in Asteroseismology, 146, 53
- Leonard & Turner (1986) Leonard P. J. T., Turner D. G., 1986, J. R. Astron. Soc. Canada, 80, 240
- Lindegren et al. (2021) Lindegren L., et al., 2021, A&A, 649, A2
- Lloyd Evans (1982) Lloyd Evans T., 1982, MNRAS, 199, 925
- Lombard & Koen (1993) Lombard F., Koen C., 1993, MNRAS, 263, 309
- Madore (1975) Madore B. F., 1975, ApJS, 29, 219
- Madore (1977) Madore B. F., 1977, MNRAS, 178, 505
- Maeder & Meynet (2001) Maeder A., Meynet G., 2001, A&A, 373, 555
- Mahmoud & Szabados (1980) Mahmoud F., Szabados L., 1980, Information Bulletin on Variable Stars, 1895, 1
- Majaess et al. (2012) Majaess D., et al., 2012, A&A, 537, L4
- Malik (1965) Malik M. G., 1965, AJ, 70, 94
- Marconi et al. (2010) Marconi M., et al., 2010, ApJ, 713, 615
- Marschall et al. (1993) Marschall L. A., Seeds M. A., Davis R. J., 1993, AJ, 106, 1123
- Mauder & Schöffel (1968) Mauder H., Schöffel E., 1968, Z. Astrophys., 69, 258
- Meyer (2006) Meyer R., 2006, Open European Journal on Variable Stars, 0051, 1
- Miller & Preston (1964) Miller J., Preston G., 1964, ApJ, 139, 1126
- Miller & Wachmann (1973) Miller W. J., Wachmann A. A., 1973, Ricerche Astronomiche, 8, 367
- Miller et al. (2020) Miller C. L., Neilson H. R., Evans N. R., Engle S. G., Guinan E., 2020, ApJ, 896, 128
- Millis (1969) Millis R. L., 1969, Lowell Observatory Bulletin, 7, 113
- Mitchell et al. (1961) Mitchell R. I., Johnson H. L., Iriarte B., 1961, ApJ, 133, 1083
- Mitchell et al. (1964) Mitchell R. I., Iriarte B., Steinmetz D., Johnson H. L., 1964, Boletin de los Observatorios Tonantzintla y Tacubaya, 3, 153
- Moffett & Barnes (1984) Moffett T. J., Barnes T. G. I., 1984, ApJS, 55, 389
- Molnár et al. (2019) Molnár L., Joyce M., Kiss L. L., 2019, ApJ, 879, 62
- Morokuma et al. (2014) Morokuma T., Tominaga N., Tanaka M., et al., 2014, Publications of the Astronomical Society of Japan, 66, 114
- Neilson & Ignace (2014) Neilson H. R., Ignace R., 2014, A&A, 563, L4
- Neilson et al. (2012) Neilson H. R., Langer N., Engle S. G., Guinan E., Izzard R., 2012, ApJ, 760, L18
- Nijland (1935) Nijland A. A., 1935, Bull. Astron. Inst. Netherlands, 7, 248
- Oja (2011) Oja T., 2011, Journal of Astronomical Data, 17, 1
- Oosterhoff (1935) Oosterhoff P. T., 1935, Harvard College Observatory Bulletin, 900, 9
- Oosterhoff (1943) Oosterhoff P. T., 1943, Bull. Astron. Inst. Netherlands, 9, 399
- Oosterhoff (1960) Oosterhoff P. T., 1960, Bull. Astron. Inst. Netherlands, 15, 199
- Parenago (1956) Parenago P. P., 1956, Peremennye Zvezdy, 11, 236
- Parkhurst (1908) Parkhurst J. A., 1908, ApJ, 28, 278
- Pel (1976) Pel J. W., 1976, A&AS, 24, 413
- Pel (1978) Pel J. W., 1978, A&A, 62, 75
- Pepper et al. (2007) Pepper J., et al., 2007, PASP, 119, 923
- Percy & Colivas (1999) Percy J. R., Colivas T., 1999, PASP, 111, 94
- Percy et al. (1997) Percy J. R., Bezuhly M., Milanowski M., Zsoldos E., 1997, PASP, 109, 264
- Perryman et al. (1997) Perryman M. A. C., Lindegren L., Kovalevsky J., et al., 1997, Astronomy and Astrophysics, 323, L49
- Pingsdorf (1935) Pingsdorf F., 1935, Astronomische Nachrichten, 255, 9
- Plachy et al. (2021) Plachy E., et al., 2021, ApJS, 253, 11
- Pojmanski (2001) Pojmanski G., 2001, in Paczynski B., Chen W.-P., Lemme C., eds, Astronomical Society of the Pacific Conference Series Vol. 246, IAU Colloq. 183: Small Telescope Astronomy on Global Scales. p. 53
- Pollacco et al. (2006) Pollacco D. L., et al., 2006, PASP, 118, 1407
- Pont et al. (1994) Pont F., Burki G., Mayor M., 1994, A&AS, 105, 165
- Poretti et al. (2015) Poretti E., Le Borgne J. F., Rainer M., Baglin A., Benkő J. M., Debosscher J., Weiss W. W., 2015, MNRAS, 454, 849
- R Core Team (2020) R Core Team 2020, R: A Language and Environment for Statistical Computing. R Foundation for Statistical Computing, Vienna, Austria, https://www.R-project.org/
- Reed (1968) Reed G. F., 1968, Information Bulletin on Variable Stars, 285, 1
- Ricker et al. (2015) Ricker G. R., et al., 2015, Journal of Astronomical Telescopes, Instruments, and Systems, 1, 014003
- Riello et al. (2021) Riello M., et al., 2021, A&A, 649, A3
- Riess et al. (2019) Riess A. G., Casertano S., Yuan W., Macri L. M., Scolnic D., 2019, ApJ, 876, 85
- Rodríguez-Segovia et al. (2021) Rodríguez-Segovia N., et al., 2021, arXiv e-prints, p. arXiv:2111.03503
- Romano (1958) Romano G., 1958, Mem. Soc. Astron. Italiana, 29, 465
- Schmidt (1974) Schmidt E. G., 1974, MNRAS, 167, 613
- Schmidt (2015) Schmidt E. G., 2015, ApJ, 813, 29
- Schmidt & Reiswig (1993) Schmidt E. G., Reiswig D. E., 1993, AJ, 106, 2429
- Schmidt et al. (1995) Schmidt E. G., Chab J. R., Reiswig D. E., 1995, AJ, 109, 1239
- Schmidt et al. (2004) Schmidt E. G., Johnston D., Langan S., Lee K. M., 2004, AJ, 128, 1748
- Schmidt et al. (2005) Schmidt E. G., Johnston D., Langan S., Lee K. M., 2005, AJ, 130, 832
- Shappee et al. (2014) Shappee B., Prieto J., Stanek K. Z., et al., 2014, in American Astronomical Society Meeting Abstracts 223. p. 236.03
- Shobbrook (1992) Shobbrook R. R., 1992, MNRAS, 255, 486
- Spreckley & Stevens (2008) Spreckley S. A., Stevens I. R., 2008, MNRAS, 388, 1239
- Sterken (2005) Sterken C., 2005, in Sterken C., ed., Astronomical Society of the Pacific Conference Series Vol. 335, The Light-Time Effect in Astrophysics: Causes and cures of the O-C diagram. p. 3
- Stobie (1970) Stobie R. S., 1970, MNRAS, 148, 1
- Stobie & Balona (1979) Stobie R. S., Balona L. A., 1979, MNRAS, 189, 641
- Storm et al. (2011) Storm J., et al., 2011, A&A, 534, A94
- Strohmeier (1968) Strohmeier W., 1968, Information Bulletin on Variable Stars, 304, 1
- Szabados (1976) Szabados L., 1976, Information Bulletin on Variable Stars, 1107, 1
- Szabados (1977) Szabados L., 1977, Communications of the Konkoly Observatory Hungary, 70, 1
- Szabados (1980) Szabados L., 1980, Communications of the Konkoly Observatory Hungary, 76, 1
- Szabados (1981) Szabados L., 1981, Communications of the Konkoly Observatory Hungary, 77, 1
- Szabados (1983) Szabados L., 1983, Ap&SS, 96, 185
- Szabados (1988) Szabados L., 1988, PASP, 100, 589
- Szabados (1989) Szabados L., 1989, Communications of the Konkoly Observatory Hungary, 94, 1
- Szabados (1991) Szabados L., 1991, Communications of the Konkoly Observatory Hungary, 96, 123
- Szabados (1992) Szabados L., 1992, in McAlister H. A., Hartkopf W. I., eds, Astronomical Society of the Pacific Conference Series Vol. 32, IAU Colloq. 135: Complementary Approaches to Double and Multiple Star Research. p. 255
- Szabados (1993) Szabados L., 1993, in IAU Colloq. 139: New Perspectives on Stellar Pulsation and Pulsating Variable Stars. p. 406
- Szabados (1996) Szabados L., 1996, A&A, 311, 189
- Szabados et al. (2013) Szabados L., Anderson R. I., Derekas A., Kiss L. L., Szalai T., Székely P., Christiansen J. L., 2013, MNRAS, 434, 870
- Szabó et al. (2007) Szabó R., Buchler J. R., Bartee J., 2007, ApJ, 667, 1150
- Turner & Berdnikov (2004) Turner D. G., Berdnikov L. N., 2004, A&A, 423, 335
- Turner et al. (2005) Turner D. G., Savoy J., Derrah J., Abdel-Sabour Abdel-Latif M., Berdnikov L. N., 2005, PASP, 117, 207
- Turner et al. (2006) Turner D. G., Abdel-Sabour Abdel-Latif M., Berdnikov L. N., 2006, PASP, 118, 410
- Turner et al. (2009) Turner D. G., Percy J. R., Colivas T., Berdnikov L. N., Abdel-Latif M. A.-S., 2009, in Guzik J. A., Bradley P. A., eds, American Institute of Physics Conference Series Vol. 1170, Stellar Pulsation: Challenges for Theory and Observation. pp 167–169 (arXiv:0907.2818), doi:10.1063/1.3246435
- Turner et al. (2010) Turner D. G., Berdnikov L. N., Percy J. R., Abdel-Sabour Abdel-Latif M., 2010, Odessa Astronomical Publications, 23, 129
- Udalski et al. (2015) Udalski A., Szymański M. K., Szymański G., 2015, Acta Astron., 65, 1
- Usenko (1990) Usenko I. A., 1990, Kinematika i Fizika Nebesnykh Tel, 6, 91
- Usenko (1992) Usenko I. A., 1992, Information Bulletin on Variable Stars, 3784, 1
- Usenko & Klochkova (2015) Usenko I. A., Klochkova V. G., 2015, Astronomy Letters, 41, 351
- Vinkó (1991) Vinkó J., 1991, Ap&SS, 183, 17
- Vinkó (1993) Vinkó J., 1993, MNRAS, 260, 273
- Virtanen et al. (2020) Virtanen P., et al., 2020, Nature Methods, 17, 261
- Wachmann (1976) Wachmann A. A., 1976, A&AS, 23, 249
- Walker et al. (1991) Walker W. S. G., Herdman G. C. D., Marino B. F., 1991, Proceedings of the Astronomical Society of Australia, 9, 127
- Walraven et al. (1958) Walraven T., Muller A. B., Oosterhoff P. T., 1958, Bull. Astron. Inst. Netherlands, 14, 81
- Walraven et al. (1964) Walraven J. H., Tinbergen J., Walraven T., 1964, Bull. Astron. Inst. Netherlands, 17, 520
- Walter (1943) Walter K., 1943, Astronomische Nachrichten, 273, 277
- Weaver et al. (1960) Weaver H. F., Steinmetz D., Mitchell R., 1960, Lowell Observatory Bulletin, 5, 30
- Welch & Evans (1989) Welch D. L., Evans N. R., 1989, AJ, 97, 1153
- Winkler et al. (2003) Winkler C., Courvoisier T. J. L., Di Cocco G., et al., 2003, Astronomy & Astrophysics, 411, L1
- Woźniak et al. (2004) Woźniak P. R., et al., 2004, AJ, 127, 2436
Appendix A Summary table for Cepheids showing evolutionary changes
In Table A.1 we present the period change rates calculated for the Cepheids showing evolutionary period changes along with the data from Gaia DR3 necessary for the CMD.
| Cepheid | P [d] | P| | [d] | [mas] | References | |||
|---|---|---|---|---|---|---|---|---|
| U Aql | 7.024 | 2.820e-05 | 9.443 | 1.02 | 0.397 | 0.96 | 1,2,3,13,53,58,60,64,75,81,A28 | |
| SZ Aql | 17.141 | 2.267e-04 | 7.986 | 1.755 | 0.614 | 0.421 | 2,3,12,13,55,58,74,75,81,96,A29 | |
| TT Aql | 13.755 | -1.223e-05 | 6.945 | 1.744 | 0.4858 | 0.888 | 1,2,3,12,13,24,53,55,58,60,75,81,97,A29 | |
| EV Aql | 38.671 | -3.213e-03 | 11.191 | 1.931 | 0.705 | -0.285 | 0.029 | 2,3,13,17,49,55,58,81,89,A1 |
| FF Aql | 4.471 | 2.582e-05 | 5.143 | 1.148 | 0.221 | -2.731 | 1.81 | 2,3,13,53,58,60,74,75,81,85,97,98,A5 |
| KL Aql | 6.108 | -3.729e-05 | 10.025 | 1.312 | 0.24 | -2.212 | 0.228 | 2,3,13,43,53,55,58,74,79,90,A25 |
| V336 Aql | 7.304 | 5.232e-05 | 9.321 | 1.666 | 0.67 | 0.47 | 2,3,13,53,55,58,74,81,96,A25 | |
| V493 Aql | 2.988 | 1.407e-05 | 10.572 | 1.7 | 0.777 | 0.4 | 2,3,13,30,53,55,58,74 | |
| V496 Aql | 6.807 | 3.075e-05 | 7.351 | 1.438 | 0.442 | 0.944 | 2,3,13,53,58,74,75,81,A29 | |
| V916 Aql | 13.443 | 1.045e-04 | 10.044 | 2.186 | 1.089 | 0.478 | 2,3,13,17,49,55,58,89 | |
| … | … | … | … | … | … | … | … | … |
| Cepheid | Amplitude [days] | |||
|---|---|---|---|---|
| U Aql | 22.61 | 6.12 | 0.72 | |
| SZ Aql | 60.94 | 17.12 | 1.77 | |
| TT Aql | 6.79 | 10.48 | 11.08 | |
| EV Aql | 91.78 | 315.39 | 205.72 | 6.997 |
| FF Aql | 63.1 | 24.2 | 7.02 | |
| KL Aql | 109.7 | 70.61 | 22.26 | 0.027 |
| V336 Aql | 18.55 | 4.79 | 0.39 | |
| V493 Aql | 5.59 | 9.02 | 8.8 | |
| V496 Aql | 9.98 | 3.54 | 1.33 | |
| V916 Aql | 158.75 | 92.54 | 23.69 | 0.175 |
| … | … | … | … |
| # | Reference | # | Reference | # | Reference |
|---|---|---|---|---|---|
| [1] | AAVSO (Kafka, 2021) | [48] | Harris (1980) | [95] | Szabados (1977) |
| [2] | ASAS (Pojmanski, 2001) | [49] | DASCH (Grindlay et al., 2012) | [96] | Szabados (1980) |
| [3] | ASAS-SN (Shappee et al., 2014) | [50] | Hellerich (1935) | [97] | Szabados (1981) |
| [4] | Abaffy (private comm.) | [51] | Henden (1980) | [98] | Szabados (1991) |
| [5] | Arellano Ferro (1984) | [52] | Henden (1996) | [99] | TESS (Ricker et al., 2015) |
| [6] | Arellano Ferro et al. (1998) | [53] | Hipparcos (Perryman et al., 1997) | [100] | Tabur (private comm.) |
| [7] | Arp et al. (1959) | [54] | Hoffmeister (1960) | [101] | Bahner & Mavridis (1971) |
| [8] | Asarnova (1957) | [55] | IOMC (Winkler et al., 2003) | [102] | Usenko (1992) |
| [9] | Babel et al. (1989) | [56] | Irwin (1961) | [103] | Wachmann (1976) |
| [10] | Bahner et al. (1962) | [57] | Kepler K2 (Howell et al., 2014) | [104] | Walraven et al. (1958) |
| [11] | Barnes et al. (1987) | [58] | KWS (Morokuma et al., 2014) | [105] | Walraven et al. (1964) |
| [12] | Barnes et al. (1997) | [59] | KELT (Pepper et al., 2007) | [106] | Walter (1943) |
| [13] | Berdnikov (2008) | [60] | Kiss (1998) | [107] | Weaver et al. (1960) |
| [14] | Berdnikov et al. (2009) | [61] | Koukarkina (1954) | [108] | Williams (private comm.) |
| [15] | Berdnikov et al. (2011) | [62] | Kovacs & Szabados (1979) | [A1] | Berdnikov & Pastukhova (1994) |
| [16] | Berdnikov et al. (2014) | [63] | Kox (1935) | [A2] | Berdnikov & Turner (2001) |
| [17] | Berdnikov et al. (2015) | [64] | Krebs (1936) | [A3] | Berdnikov & Caldwell (2001) |
| [18] | Berdnikov et al. (2019) | [65] | Kurochkin (1954) | [A4] | Berdnikov & Turner (2004) |
| [19] | Bersier (2002) | [66] | Kwee (1967) | [A5] | Berdnikov et al. (2014) |
| [20] | Bochum (Hackstein et al., 2015) | [67] | Landolt (1971) | [A6] | Berdnikov (2019c) |
| [21] | Buchancowa et al. (1972) | [68] | Laur et al. (2017) | [A7] | Erleksova (1978) |
| [22] | Burnashev & Burnasheva (2009) | [69] | Madore (1975) | [A8] | Erleksova & Irkaev (1982) |
| [23] | Connolly et al. (1983) | [70] | Malik (1965) | [A9] | Fernie (1990a) |
| [24] | Coulson & Caldwell (1985) | [71] | Mauder & Schöffel (1968) | [A10] | Hacke (1989) |
| [25] | Cousins & Lagerweij (1968) | [72] | Millis (1969) | [A11] | Hacke & Richert (1990) |
| [26] | Cousins & Lagerweij (1971) | [73] | Mitchell et al. (1961) | [A12] | Heiser (1996) |
| [27] | Dean (1977) | [74] | Mitchell et al. (1964) | [A13] | Kiehl & Hopp (1977) |
| [28] | Dean (1981) | [75] | Moffett & Barnes (1984) | [A14] | Klawitter (1971) |
| [29] | Detre (1935) | [76] | NSVS (Woźniak et al., 2004) | [A15] | Mahmoud & Szabados (1980) |
| [30] | Diethelm & Tammann (1982) | [77] | Udalski et al. (2015) | [A16] | Meyer (2006) |
| [31] | Eggen (1951) | [78] | Oja (2011) | [A17] | Miller & Wachmann (1973) |
| [32] | Eggen et al. (1957) | [79] | Oosterhoff (1960) | [A18] | Nijland (1935) |
| [33] | Eggen (1983) | [80] | Parkhurst (1908) | [A19] | Oosterhoff (1935) |
| [34] | Eggen (1985) | [81] | Pel (1976) | [A20] | Oosterhoff (1943) |
| [35] | Feinstein & Muzzio (1969) | [82] | Pingsdorf (1935) | [A21] | Parenago (1956) |
| [36] | Fernie et al. (1965) | [83] | Present paper | [A22] | Romano (1958) |
| [37] | Fernie (1970) | [84] | Reed (1968) | [A23] | Strohmeier (1968) |
| [38] | Fernie (1979) | [85] | SMEI (Eyles et al., 2003) | [A24] | Szabados (1977) |
| [39] | Fernie & Garrison (1981) | [86] | SWASP (Pollacco et al., 2006) | [A25] | Szabados (1980) |
| [40] | Fernie et al. (1995) | [87] | Schmidt & Reiswig (1993) | [A26] | Szabados (1981) |
| [41] | Filatov (1957) | [88] | Schmidt et al. (1995) | [A27] | Szabados (1988) |
| [42] | Floria & Kukarkina (1953) | [89] | Schmidt et al. (2004) | [A28] | Szabados (1989) |
| [43] | Gaia DR2 (Gaia Collaboration, 2018) | [90] | Schmidt et al. (2005) | [A29] | Szabados (1991) |
| [44] | Gaposchkin (1958) | [91] | Shobbrook (1992) | [A30] | Szabados et al. (2013) |
| [45] | Gieren (1981) | [92] | Stobie (1970) | [A31] | Vinkó (1991) |
| [46] | Gieren (1985) | [93] | Stobie & Balona (1979) | [A32] | Walker et al. (1991) |
| [47] | Grayzeck (1978) | [94] | Szabados (1976) |