Stress-Testing Cosmic Ray Physics: The Impact of Cosmic Rays on the Surviving Disk of Ram Pressure Stripped Galaxies
Abstract
Cluster spiral galaxies suffer catastrophic losses of the cool, neutral gas component of their interstellar medium due to ram pressure stripping, contributing to the observed quenching of star formation in the disk compared to galaxies in lower density environments. However, the short term effects of ram pressure on the star formation rate and AGN activity of galaxies undergoing stripping remain unclear. Numerical studies have recently demonstrated cosmic rays can dramatically influence galaxy evolution for isolated galaxies, yet their influence on ram pressure stripping remains poorly constrained. We perform the first cosmic-ray magneto-hydrodynamic simulations of an galaxy undergoing ram pressure stripping, including radiative cooling, self-gravity of the gas, star formation, and stellar feedback. We find the microscopic transport of cosmic rays plays a key role in modulating the star formation enhancement experienced by spirals at the outskirts of clusters compared to isolated spirals. Moreover, we find that galaxies undergoing ram pressure stripping exhibit enhanced gas accretion onto their centers, which may explain the prevalence of AGN in these objects. In agreement with observations, we find cosmic rays significantly boost the global radio emission of cluster spirals. Although the gas removal rate is relatively insensitive to cosmic ray physics, we find that cosmic rays significantly modify the phase distribution of the remaining gas disk. These results suggest observations of galaxies undergoing ram pressure stripping may place novel constraints on cosmic-ray calorimetry and transport.
keywords:
cosmic rays – galaxies: clusters: intracluster medium – galaxies: evolution – galaxies: star formation – magnetohydrodynamics – methods: numerical1 Introduction
Galaxies exhibit strikingly different properties depending upon the local density of their environment (Dressler, 1980). Spirals inhabiting high density environments such as clusters (“cluster spirals”) tend to be redder, more anemic in neutral hydrogen gas, have lower star formation rates, and stronger magnetic fields than their more isolated counterparts in the field (Hubble & Humason, 1931; Butcher & Oemler Jr, 1978; Boselli & Gavazzi, 2006).
Multiband observations of relatively isolated star-forming spirals orbiting in cluster environments ubiquitously detect copious amounts of multiphase gas pointing away from cluster center in ‘tail’ structures extending up to 100 kpc (e.g., in X-rays, Sun et al. 2006, 2009; in H, Zhang et al. 2013; in 21-cm emission Oosterloo & van Gorkom 2005; in CO, Jáchym et al. 2017; Moretti et al. 2018; and see the GASP survey for more examples Poggianti et al. 2017b).
The relative motion between the intracluster medium (ICM) and the galaxy’s interstellar medium (ISM) can lead to gas removal from the disk if the ram pressure (RP), , exceeds the gravitational restoring force per unit area, (Gunn & Gott III, 1972; Roediger, 2009). This ram pressure ‘stripping’ (RPS) should lead to eventual quenching of star formation with most of the gas expected to be stripped on the first infall (Jaffé et al., 2015).
However, observations of cluster spirals undergoing RPS can detect moderate enhancements of star formation (Vulcani et al., 2018). This star formation enhancement may be related to observations of high efficiency neutral to molecular gas conversion in RPS galaxies (Moretti et al., 2020a, b), suggesting compression-induced star formation. Moreover, recent observations by the GASP survey suggest the AGN fraction is strongly enhanced relative to the field (Poggianti et al., 2017a; Radovich et al., 2019).
Some hydrodynamical simulations have studied the effect of RP on the surviving gas disk. Schulz & Struck (2001) coined the term “disk annealing", or the compression of the inner surviving disk via angular momentum transport. Tonnesen & Bryan (2009) found that at low RP strengths, more gas was compressed than removed by the ICM, and Tonnesen (2019) argued that early compression could have a long-lasting impact on the amount of gas that is stripped.
Additional simulations have focused on the impact of RP on the star formation rate (SFR) of galaxies, although no consensus has been reached. While many simulations predict that in some cases RP can cause a modest increase in the disk SFR (Kronberger et al., 2008; Steinhauser et al., 2016; Ruggiero & Lima Neto, 2017; Lee et al., 2020), some find that the global SFR is suppressed (Tonnesen & Bryan, 2012; Roediger et al., 2014; Lee et al., 2020), and others find that in a few cases the SF can be boosted by a factor of several (Bekki, 2013). These simulations span a range of galaxy masses, RP strengths, and numerical implementations, and therefore cannot yet be combined into a coherent picture.
A growing body of literature has \colorblackexplored\colorblack the impact of magnetic fields on ram pressure stripped galaxies \colorblackusing numerical simulations\colorblack. While magnetohydrodynamic (MHD) simulations have shown that draping of a magnetized ICM (Lyutikov, 2006; Ruszkowski et al., 2007, 2008; Dursi & Pfrommer, 2008; Pfrommer & Dursi, 2010; Ruszkowski et al., 2014) helps to reproduce the smooth (as opposed to clumpy) morphology of RPS tails in agreement with recent observations (Müller et al., 2021), they find little impact on the gas stripping rate compared to purely hydrodynamic simulations (Ruszkowski et al., 2014). However, Ruszkowski et al. (2014) find an increase in magnetic pressure along the disk due to draping. Similarly, simulations with disk magnetic fields find little impact on the stripping rate as long as the gas surface density is not impacted (Tonnesen & Stone, 2014; Ramos-Martínez et al., 2018). Interestingly, Ramos-Martínez et al. (2018) find magnetized, flared disks act to deflect ICM material towards the galactic center region.
In contrast, the effect of cosmic rays (CR) on RPS remains largely unexamined. Bustard et al. (2020) performed simulations including CR, radiative cooling, and the derived star formation history of the Large Magellanic Cloud. They showed cosmic-ray driven galactic winds in combination with RPS can contribute to the Magellanic Stream. To our knowledge, CR have never been studied for more massive L∗ galaxies in a cluster environment. Yet CR have shown to play a crucial role in the evolution of isolated galaxies (Enßlin et al., 2007; Everett et al., 2008; Uhlig et al., 2012; Booth et al., 2013; Salem & Bryan, 2014; Simpson et al., 2016; Girichidis et al., 2016, 2018; Pfrommer et al., 2017a, b; Wiener et al., 2017a, 2019; Ruszkowski et al., 2017; Farber et al., 2018; Butsky & Quinn, 2018; Heintz & Zweibel, 2018; Holguin et al., 2019; Chan et al., 2019; Ji et al., 2020; Hopkins et al., 2020, 2021; Semenov et al., 2021, see Zweibel 2017 for a review).
Including CR is essential to understanding the physics underlying observations of RPS galaxies. The nonthermal pressure of CR tends to produce disks of larger scale-height, which should be more easily stripped. Likewise, CR driven galactic winds tend to be cooler and higher density than thermal outflows, suggesting more efficient removal of the neutral medium from galaxies. On the other hand, previous work has shown CR suppress the star formation rate in galaxies, as their nonthermal pressure counteracts contraction of gas to star-forming densities. Cosmic ray models with consequently reduced stellar feedback may exhibit weaker outflows, diminishing the amount of gas that is stripped.
Beyond the dynamics of RPS, CR are fundamental towards understanding radio continuum observations of RPS galaxies, the measurements of which indicate a global radio excess compared to the far-infrared (FIR) to radio correlation (FRC) (Dickey & Salpeter, 1984; Beck & Golla, 1988; Yun et al., 2001; Paladino et al., 2006). Since enhanced star formation would boost both the radio and the FIR (Lacki et al., 2010), previous work suggested magnetic compression by the ICM wind on the leading edge of the galaxy could explain the boosted radio emission (Scodeggio & Gavazzi, 1993).
However, Murphy et al. (2009) utilized Spitzer FIR and VLA radio continuum imaging to show a paucity of radio emission on the leading edge of the galaxy’s orbital motion, precisely where one would expect magnetic compression to dominate. Nevertheless, they observe global radio enhancement. The local radio deficits with global radio enhancement was confirmed by Vollmer et al. (2009, 2010, 2013) in Virgo cluster galaxies with multiwaveband measurements. They propose that both the local deficits and global enhancement of radio emission can be explained by variations in the cosmic-ray electron number density.111The radio emission is expected to be produced via synchrotron emission as the CR electrons gyrate along magnetic field lines. Although the magnetic field is compressed on the leading edge, cosmic-ray electrons may be easily stripped and their consequently low density suppresses the radio emission. Meanwhile, shocks driven into the ISM by the interaction with the ICM can re-accelerate CR, boosting the global radio emission. However, Pfrommer & Dursi (2010) suggest magnetic draping can explain the deficits in radio emission.
In this work, we determine the impact of CR and their transport, on properties of galaxies undergoing RPS. The outline of this paper is as follows: In §2 we describe the initial conditions, boundary conditions, galaxy model, and numerical methods utilized to perform this work including magnetohydrodynamics (MHD), CR, radiative cooling, self-gravity of the gas, star formation, and stellar feedback. In §3 we present and discuss our results. In §3.1 we consider the morphological evolution of the simulations we performed, finding CR crucially modify the outflows in isolated galaxies, yet do not evidently modify the morphology when galaxies undergo RPS. Thus, the stripping rates analyzed in §3.2 do not show much difference with or without CR. However, in §3.3 we find cosmic rays protect low-temperature gas from being stripped, possibly helping to explain observations of molecular gas in RPS tails. Cosmic rays dramatically influence star formation, as we show in §3.4. Intriguingly, we find in §3.5 that CR modify the accretion rate onto the galactic center with important implications for observations of AGN in RPS galaxies. The transport of CR fundamentally impacts the radio emission, which we discuss in §3.6. We indicate limitations of our study and directions for future work in §4. Finally, we conclude in §5.
2 Methods
2.1 Numerical Techniques
We performed our simulations using the adaptive mesh refinement MHD code FLASH 4.2.2 (Fryxell et al., 2000; Dubey et al., 2008), with the directionally unsplit staggered mesh (USM) solver (Lee & Deane, 2009; Lee, 2013). The USM is a finite volume, high order Godunov scheme that utilizes constrained transport to satisfy the solenoidal constraint of Maxwell’s equations to machine precision.
Additionally, we include self-gravity, radiative cooling, star formation and feedback as source and sink terms in the MHD equations. We include the passive advection of a concentration variable , used to mark the initial disk gas222We set C = 1 in the disk and zero elsewhere.. We further extend the MHD equations to include CR as a second ultrarelativistic fluid (Yang et al. 2012; Yang et al. 2013; Yang & Ruszkowski 2017; Ruszkowski et al. 2017; Holguin et al. 2019); see Farber et al. (2018) for the system of equations we solve.
To include self-gravity of the baryons (gas and stellar population particles333We utilize static potentials to include the gravitational influence of pre-existing stars; stellar population particles form during the simulation runtime.) we solve the Poisson equation using the Huang & Greengard multigrid solver in FLASH (Huang & Greengard, 1999; Ricker, 2008). The multigrid solver implemented in FLASH extends Huang & Greengard (1999) for compatibility with FLASH’s numerical structure, namely, finite volume discretization of the fluid equations with shared data on an oct-tree mesh, enabling efficient parallelization. That is, the multigrid method utilizes a direct solver for individual mesh blocks; see Ricker (2008) for further details.
We utilized the hybrid scheme for radiative cooling and heating of Gnedin & Kravtsov (2011). The implementation automatically switches between an explicit and implicit solver depending on the timestep constraint, enabling efficient and accurate treatment of radiative cooling and heating. For the rates, we interpolate to the nearest temperature and density using a table generated with Cloudy (Ferland et al., 1998) assuming a constant solar metallicity and a constant metagalactic UV background; see, e.g., Semenov et al. (2021) for further details.
To accelerate the computations we impose a minimum timestep dt yr. We do so while maintaining numerical stability by limiting the bulk and generalized sound speeds to
| (1) |
where is the Courant-Friedrichs-Lewy number and is the width of a cell.
We impose the speed limit via dissipation of thermal and CR energy such that the generalized sound speed obeys the speed limit and similarly for the bulk speed.444\colorblackNote that ensuring dt yr is equivalent to a ceiling of 104 km s-1 at our best resolution. Since the maximum inflow speed is about ten times smaller, we don’t expect our simulations to be impacted by the bulk speed limiter.\colorblack Rather than limiting the Alfven speed directly, we utilize the hybrid Riemann solver implemented in FLASH, as modified to utilize the HLLC Riemann solver in smooth regions and the LLF Riemann solver in shock-detected regions for increased numerical stability (Dongwook Lee, priv. comm., 2020).
We perform our simulations in a box of dimensions (-32 kpc, 32 kpc)3 with the galaxy centered at the origin with the spin axis pointing in the -direction. We uniformly resolve |z| < 4 kpc with 7 levels of refinement such that our galactic disk achieves a resolution of 127 pc and resolution degrades away from the galactic disk to a base grid with 4 levels of refinement and a physical resolution of 1 kpc.
Note that our box is relatively small to minimize the resolution elements covering |z| < 4 kpc; we adopt such a step-wise refinement pattern to avoid “corners” of different resolution elements, which we found produced spuriously reflected waves and generated unphysical structures in the magnetic field.
We employ diode boundary conditions (modified to prevent inflow while including self-gravity, see Appendix B) on all box faces. For the FaceOn and EdgeOn runs, after waiting 40 Myr to allow the initial conditions to relax, we inject a wind through the -z and -y boundaries, respectively, following the parameters of Ruszkowski et al. (2014). That is, we model an ICM wind with a density of n cm-3, temperature T K, magnetic field strength of 2 G perpendicular to the wind, zero along the direction of the wind, and a maximum wind speed of 1300 km/s. We use an accelerating profile of the wind speed to model the orbital motion of the galaxy falling towards the center of the cluster (Tonnesen, 2019), following the model of Ruszkowski et al. (2014), namely where
| (2) |
with and Myr. That is, the wind reaches maximum velocity at 158 Myr (since we delay onset of the wind 40 Myr) and is constant thereafter. See Table 1 for a list of the parameters employed in this study.
| Name | Value |
|---|---|
| yr | |
| 1 cm-3 | |
| 1051 erg | |
| 0.717 | |
| 0.1 | |
| 3 cm2 s-1 | |
| 0 | |
| 1011 M⊙ | |
| 1010 M⊙ | |
| 1011 M⊙ | |
| 1.1 1011 M⊙ | |
| 4 kpc | |
| 7 kpc | |
| 0.4 kpc | |
| 0.25 kpc | |
| 0.4 kpc | |
| Rdisk | 26 kpc |
| B0,x | 1 G |
| a0 | 103 |
| 9.2 cm-3 | |
| T0,CGM | 4.15 K |
| nwind | 5 cm-3 |
| Twind | 7 K |
| vmax,wind | 1300 km/s |
| B⟂,wind,1 | 2 G |
| B⟂,wind,2 | 2 G |
| B∥,wind | 0 |
| Lbox | 64.8 kpc |
| dxmin | 127 pc |
| dxmax | 1 kpc |
| |z|dx,min | 4 kpc |
2.1.1 Star Formation and Feedback
We employ the star formation and stellar feedback prescriptions used in the ART (Kravtsov, 1999; Kravtsov et al., 2002; Rudd et al., 2008; Gnedin & Kravtsov, 2011) simulations of galaxy evolution (Semenov et al., 2016, 2017, 2018, 2021). That is, we permit gas to form stars when the gas density exceeds a critical value = 1 cm-3 with the star formation rate density parameterized to match the Kennicutt-Schmidt relation (Schmidt, 1959; Kennicutt Jr, 1998):
| (3) |
where is the star formation efficiency per free-fall time . We set = 0.01 in agreement with observationally inferred low local star formation and long galactic depletion times of star-forming gas (see, Krumholz & Tan 2007; Leroy et al. 2017; Semenov et al. 2018).
When the gas density of a cell exceeds the minimum density for star formation we create a stellar population particle with the mass proportional to , where is the number of occurrence, drawn from a Poisson distribution, characterized by the expected value . However, we limit the value of to not exceed , where M⊙ is the minimum stellar population mass we enforce to avoid creating a computationally intractably large number of particles. We also require the total stellar population particle mass not to exceed to avoid consuming all the gas in the cell. Upon creation of the stellar population particle, we remove its mass from the gas in the cell it inhabits.
For 40 Myr immediately succeeding the creation of a stellar population particle we apply feedback from massive stars, modeling proto-stellar jets, massive stellar winds and radiation pressure, preceding type II supernovae. We sample our stellar population particles with a Chabrier IMF to determine the contribution from massive stars 8 M⊙. For each massive star we inject 0.1 erg as cosmic-ray energy, as well as thermal energy and momentum according to the subgrid model of Martizzi et al. (2015).
The Martizzi et al. (2015) momentum feedback subgrid model takes into account local conditions and our resolution to inject the appropriate amount of momentum produced during the (unresolved) Sedov-Taylor phase (see also Walch & Naab 2015; Kim & Ostriker 2015; Iffrig & Hennebelle 2015). We boost the injected momentum by a factor of 5 to account for the unresolved clustering of supernovae (Gentry et al., 2017, 2019), the influence of CR on the supernova momentum deposition (Diesing & Caprioli, 2018) and to account for advection errors (Agertz et al., 2013; Semenov et al., 2018).
2.1.2 Cosmic Ray Models
We bracket the parameter space of CR transport and calorimetry via three cases: (1) No CR (NoCR), i.e., modeling the case of complete calorimetry. (2) CR that simply advect with the thermal gas (ADV). This case models unresolved tangled structure of the magnetic field in the galactic disk, preventing CR from escaping into the circumgalactic medium (CGM) or effectively a strong suppression of cosmic-ray diffusion and cooling near star formation sites (Semenov et al., 2021). (3) Cosmic rays anisotropically diffuse along magnetic field lines with a diffusion coefficient parallel to the magnetic field of cm2 s-1 and zero perpendicular diffusion (DIF). We note that these three cases are meant to bracket the possible results of more detailed CR transport modeling, which remains highly uncertain (see the dozens of models of Hopkins et al. 2021).555That is, ADV can represent the limiting case of very slow CR transport, NoCR models the limit of very fast transport, and the diffusion coefficient adopted for DIF is a moderate value that should be near the peak wind driving efficincy (Salem & Bryan, 2014) and is motivated by models of cosmic-ray propagation (see Grenier et al. 2015 and references therein).
2.2 Galaxy Model
We model a massive spiral galaxy with a flat rotation curve km/s, composed of a gaseous disk, hot halo, stellar disk, stellar bulge, and dark matter halo initially in hydrostatic equilibrium (see Tonnesen & Bryan 2009; Tonnesen & Bryan 2010).
To directly follow Roediger & Brüggen (2006) we use a Plummer-Kuzmin potential for the stellar disk (Miyamoto & Nagai, 1975), a Hernquist profile for the stellar bulge (Hernquist, 1993), and a Burkert (1995) potential for the dark matter halo 666This potential is consistent with observed rotation curves (Trachternach et al., 2008). (see Table 1 for the masses and scale lengths of each component).
We employ the same magnetic field configuration initial conditions as model TORL of Tonnesen & Stone (2014). Namely, we initialize the magnetic field to be weak in the galactic central region (where the velocity field changes rapidly), peaking in strength a few kpc from the galactic center, diminishing gradually with increasing galactic radius, and set to zero outside the disk. That is, we employ the following vector potential (with set to a constant outside the disk)
| (4) |
| (5) |
| (6) |
Note that the cutoff in magnetic field strength at the disk-edge ensures the magnetic pressure is subdominant to the thermal pressure, reducing disk expansion as well as growth of the magnetic field due to shear between the disk and the CGM.
The plasma beta, which is the ratio of thermal to magnetic pressures, ranges from 100 to a maximum of 2 in the disk midplane a few kpc from the galactic center region (see Figure 2 of Tonnesen & Stone 2014). Since the magnetic pressure is subdominant to the thermal pressure the magnetic field does not have a strong effect on the disk. The chosen magnetic field morphology enables easier comparison to our previous work (Tonnesen & Stone, 2014) as it is reproducible, reduce variability due to instabilities, and are divergence-free.
3 Results & Discussion
We begin the presentation of our results in Section 3.1 by graphically illustrating the nine runs we have analyzed and indicating their morphological evolution in Figures 1 through 3. Then we explore the impact of CR on the stripping rates in Section 3.2 and the gas phase distribution in Section 3.3. In Section 3.4 we discuss the impact of CR and their feedback on the star formation rate in galaxies undergoing RPS at cluster outskirts. We consider the impact of CR on the accretion of gas toward the galactic center in 3.5. See Table 2 for our nomenclature.
| Name | Description |
|---|---|
| thermal fraction of SN energy. | |
| cosmic-ray fraction of SN energy. | |
| dx | cell width. |
| MHD | Magnetohydrodynamics. |
| USM | Unsplit Staggered Mesh. |
| RPS | Ram Pressure Stripping. |
| SFR | Star Formation Rate. |
| SNe | Supernovae. |
| ICM | Intra-cluster Medium. |
| CGM | Circum-galactic Medium. |
| Isolated | No ICM wind. |
| FaceOn | ICM wind parallel to galactic spin axis. |
| EdgeOn | ICM wind perpendicular to galactic spin axis. |
| NoCR | No cosmic rays. |
| ADV | Cosmic rays only advect. |
| DIF | Cosmic rays advect and diffuse. |
3.1 Galactic Morphology
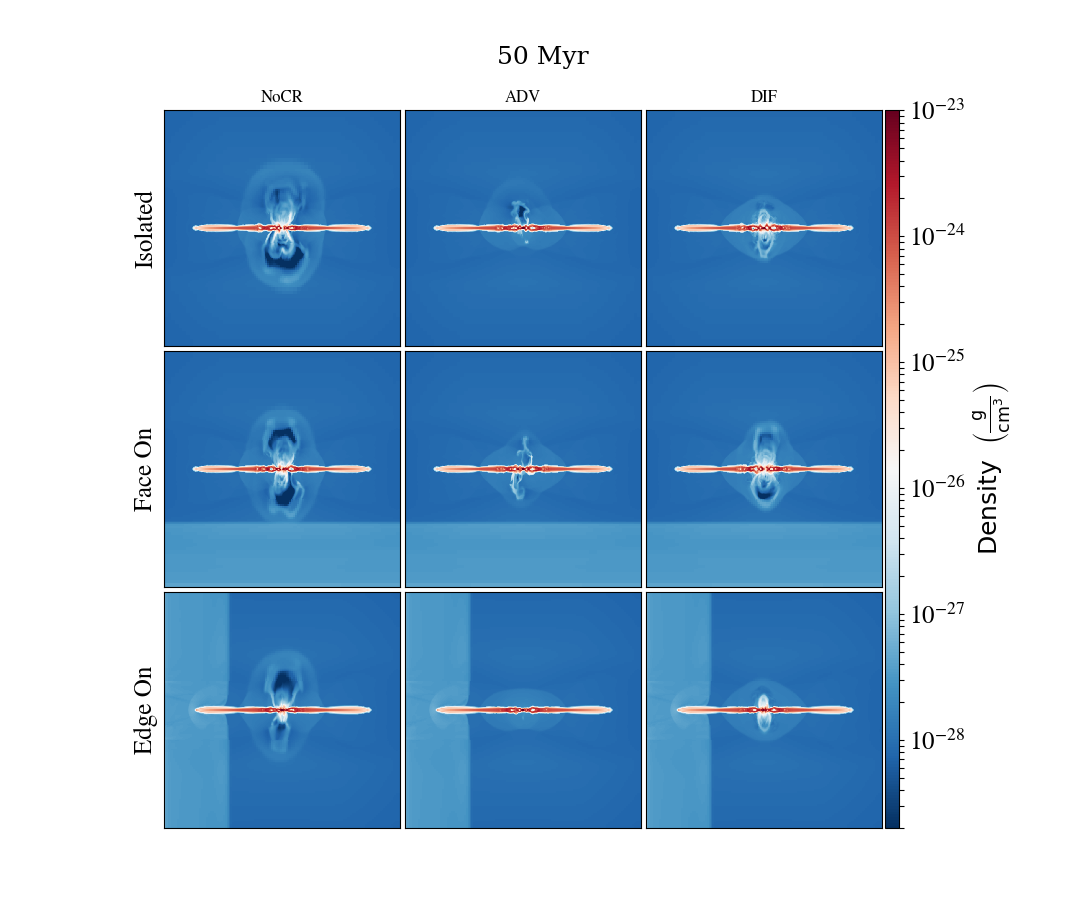
In this section we analyze the morphological evolution of galactic disks. We performed a grid of nine simulations, composed of three CR models and three galaxy models. We performed simulations (a) without CR (NoCR), (b) where CR purely advect with the gas (ADV), and (c) including the anisotropic diffusion of CR along magnetic field lines (DIF see Section 2.1.2 for further details). For each CR model we simulated (i) field galaxies not subject to any ICM wind (Isolated), and galaxies falling into a cluster such that the spin axis points (ii) face-on (FaceOn) or (iii) orthogonal to (EdgeOn) the direction of the orbital motion.
In all cases, the gas distribution collapses towards the midplane as a result of radiative cooling removing thermal pressure support. The resulting high densities at the midplane allow stars to form, whose feedback begins to launch a nuclear outflow (see Section 2.1.1 for further details on our star formation and feedback methods). After 40 Myr the star formation and feedback cycle is well underway yet still quite similar for all physics cases (see Figure 6). At this time we turn on the ICM wind (for non-Isolated runs). At 50 Myr (see Figure 1) the ICM wind has just begun to interact with the FaceOn & EdgeOn runs. At this time, the NoCR runs have the most extended outflow structure while the ADV runs have a relatively weak wind.
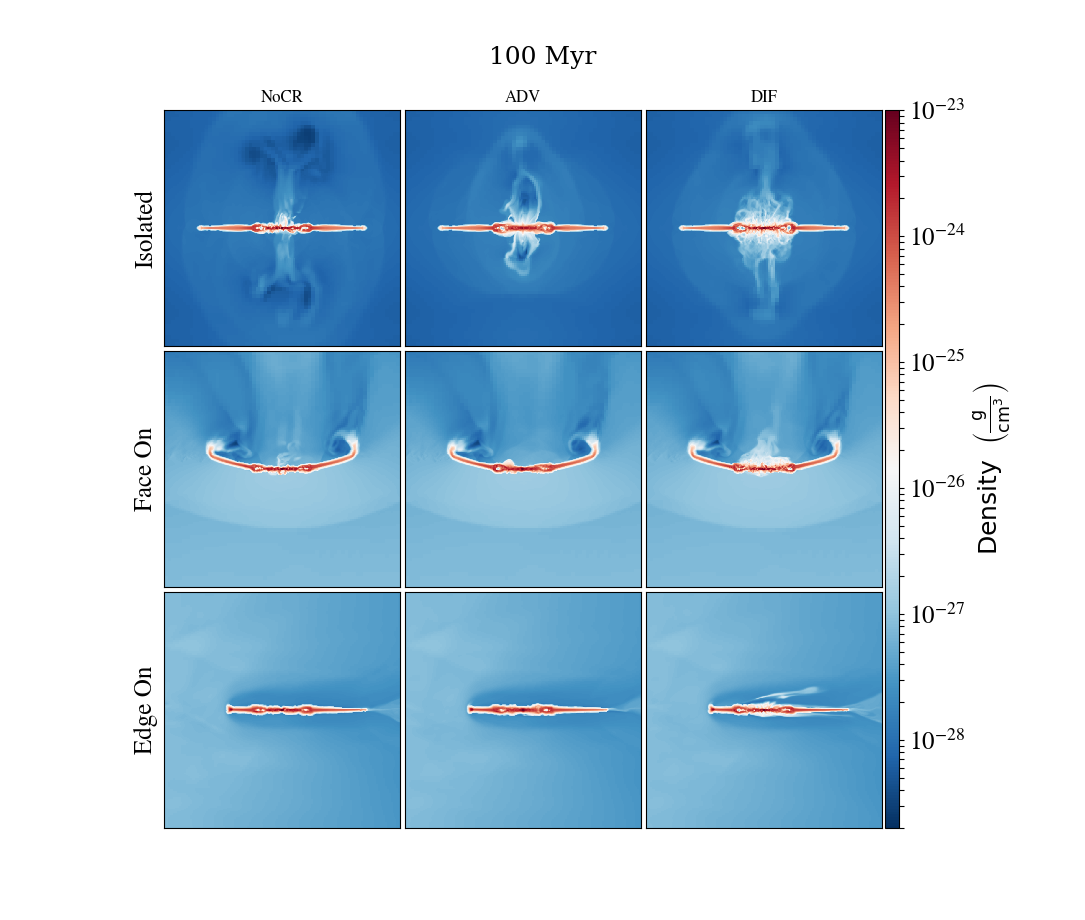
As expected from the classical Gunn & Gott model for RPS, the ensuing ISM-ICM interaction proceeds from the outermost radii of the disk, where gas is beginning to be stripped by 100 Myr (see Figure 2). The Isolated runs have now developed more extended galactic wind structures into the CGM. Note the DIF run has developed a frothy higher density galactic wind structure compared to the relatively low density “mushroom” ejecta of the NoCR case, while the weaker galactic wind in the ADV case has not propagated as far into the CGM as NoCR or DIF. The higher density outflow driven with CR is consistent with previous models of isolated galaxies with cosmic-ray feedback (see Girichidis et al. 2018).
Meanwhile, cases with an ICM wind are beginning to diverge from their Isolated galaxy counterparts. Most noticeable is the higher density of the ICM ( g cm-3) compared to the CGM ( g cm-3). In the FaceOn runs the development of a bowshock 20 kpc upstream of the disk is quite evident. Moreover, RPS has begun to affect the disks: the outermost portion of the disks are slightly bowed downstream from the RP of the colliding ICM wind.
For the EdgeOn runs the disks are slightly pushed downstream at 100 Myr (see Fig. 2), with notably absent galactic wind bubbles – stripping of galactic wind material has been “caught-in-the-act” for the DIF case. Otherwise the galaxies in the EdgeOn case do not appear very disturbed.
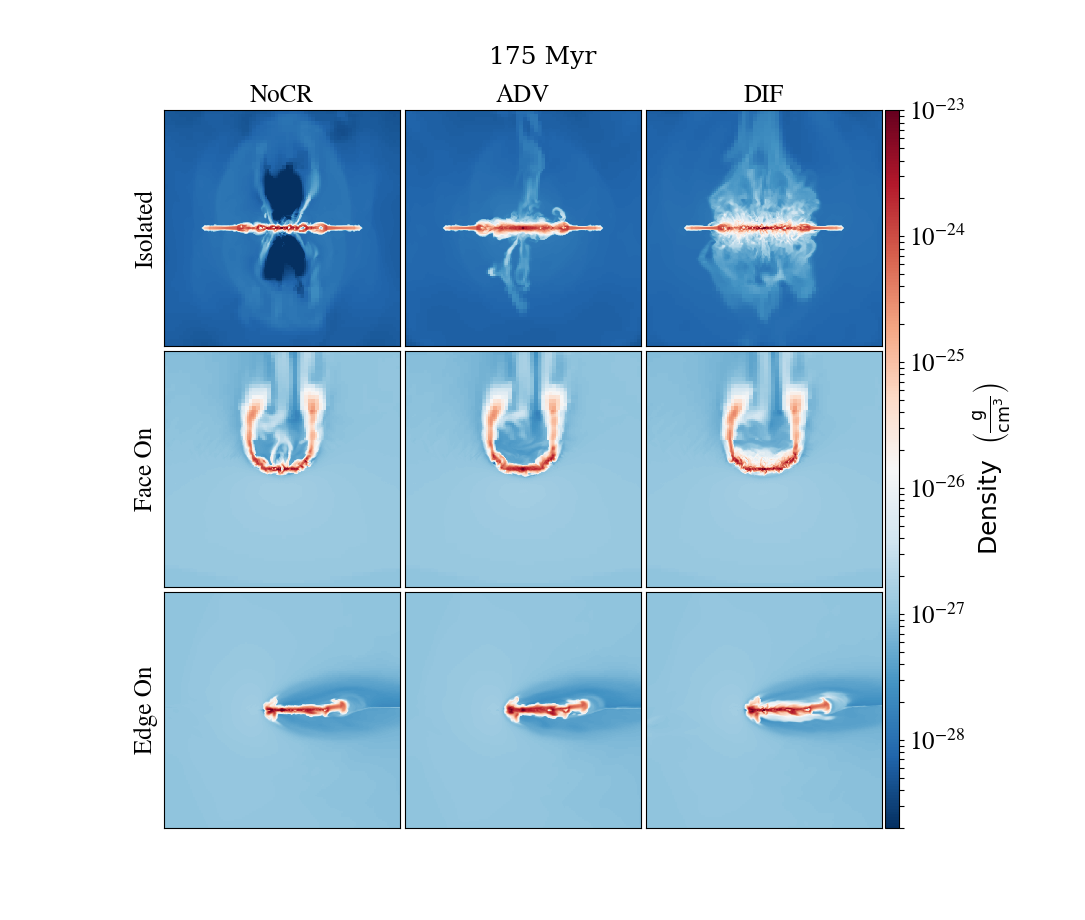
As the ICM-ISM interaction proceeds, the FaceOn and EdgeOn cases diverge more drastically from the Isolated galaxies. At 175 Myr (see Figure 3) the galactic winds of the Isolated runs’ have further developed. The NoCR run has evacuated a large scale, biconical, low density ( g cm-3) cavity from its nuclear region into the CGM, in shape reminiscent to the Fermi bubbles (Su et al., 2010). In contrast, the DIF run has developed a frothy, disk-wide outflow whose relatively high-density ( g cm-3) is in better agreement with observations of the CGM (Werk et al., 2013). Note that stellar feedback similarly occurs to a larger radius in the disk now in the NoCR case as can be noted by the slightly thicker disk compared to the disk outskirts. In the ADV case, the outflow has largely shut off and the gas at large scale heights from the disk is returning in a fountain flow. The main impact of cosmic-ray feedback in this case is the thickening of the gaseous disk due to the nonthermal pressure provided by CR, which efficiently suppresses star formation.
Meanwhile, the pushing of the now maximum RP wind (see Section 2.1 for the acceleration profile) has bowed back the FaceOn disks. Stripping from the ends of the warped disk gas downstream (and out of the computational domain) is evident possibly forming a tail structure (but studying the RPS tail is beyond the scope of this work). The high-density disk gas for the FaceOn-ADV run is thicker than the other physics cases. Reminiscent of the frothy outflow of the Isolated disk, the FaceOn-DIF case exhibits a low density skin of gas surrounding the higher density midplane gas as seen in white in our slices. The low density skin possesses a larger scale height downstream, as it is protected by the “shadow” of the disk.
While the FaceOn disks are severely warped downstream, the EdgeOn disks appear to exhibit a fairly strong compression on the leading edge, forming a comet-like structure with a distinct high density “head” just upstream of (stellar) galactic center and a tail of dense disk gas downstream. Again, the ADV run exhibits a somewhat thicker structure of dense disk gas while the DIF galaxy possess a low density skin, as an outflow (which is rapidly stripped) is driven by diffusing CR.
While we have indicated the most salient differences between our CR physics cases, the most striking observation is how relatively similar the morphology is for galaxies subjected to RPS. This is shocking especially after one considers the radical differences of the galactic winds of the Isolated cases. Nevertheless, previous studies have found RPS proceeds at a rate largely unaffected by nonthermal forces (e.g., magnetic fields, see Tonnesen & Stone 2014; Ruszkowski et al. 2014), as suggested by the good agreement between observations and the Gunn & Gott criterion. In the next section, we investigate the impact of CR on the RPS rate.
3.2 Stripping
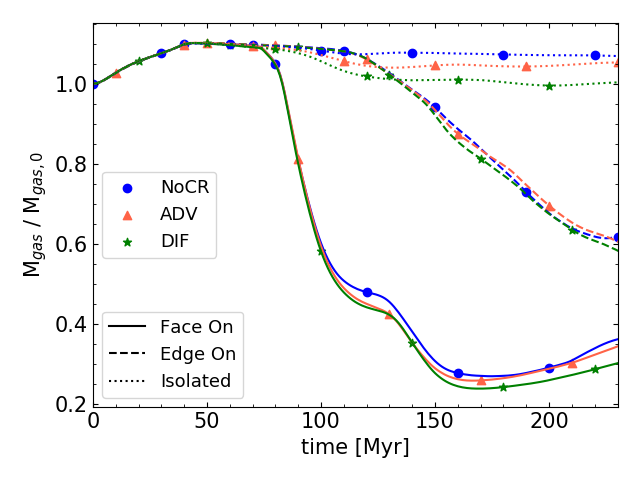
To determine the impact of CR physics on the RPS rate, we investigate the amount of gas remaining in the disk in our simulations. We define disk gas as possessing a tracer fraction contained within a cylinder of radius 28.6 kpc and height 1 kpc from the disk midplane.
In Figure 8 we show the mass in the disk as a function of time for our nine simulations. We utilize solid, dashed, and dotted lines to indicate the FaceOn, EdgeOn, and Isolated runs while \colorblackblue circles, red triangles, and green stars\colorblack represent NoCR, ADV, and DIF physics cases. During the first 40 Myr the disk mass increases due to radiative cooling induced collapse onto the disk midplane. The disk mass stabilizes until 75 Myr when the impact of the ICM wind begins to differentiate the evolution.
From 75-150 Myr the FaceOn runs are efficiently stripped of 80% of their disk mass. As some stripped material enters the “shadow” of the remaining disk and is protected from acceleration to the escape velocity, some material falls back onto the disk from 175-230 Myr. In contrast, the EdgeOn runs are more slowly stripped (maintaining 90% of their initial disk gas mass by 150 Myr and 60% by 230 Myr) owing to the reduced cross-section for ISM-ICM interaction, in agreement with previous work (Roediger & Brüggen, 2006; Jáchym et al., 2009). The EdgeOn runs lack a fallback episode owing to the lack of protective “shadow.”
Meanwhile, the Isolated runs maintain most of their disk mass as expected with the disk gas mass loss due primarily to galactic winds. Interestingly, the ADV run ejects more disk gas mass initially than the NoCR run due to the contrast between the hot, low density cavities driven in the NoCR case compared to the ADV case (see Figure 3). Both ADV and DIF runs exhibit periodic fountain flows (see the oscillatory behavior of the dotted lines) or accretion dominating over the outflow, whereas the NoCR disk gas mass is monotonically decreasing.
As anticipated from the largely similar evolution of the NoCR, ADV, and DIF cases of the FaceOn and EdgeOn runs (see Figures 1-3), the stripping rates do not differ widely between the physics cases (not more than 15%, see Figure 8). However, knowing that the Isolated runs produce quite distinct galactic wind structures, the fact that CR play a minor role in the removal of gas from RPS galaxies is quite surprising. Nevertheless, we find CR physics does play a role in modifying the temperature-density phase space of cluster spirals, which we discuss next.
3.3 Gas Phase Distribution in the Disk
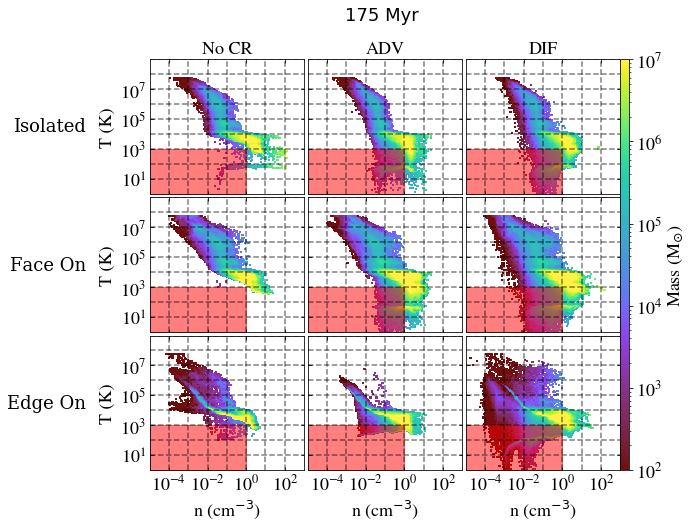
While the morphology and stripping rates are similar across our three cosmic-ray physics cases (NoCR, ADV, and DIF), examining the galactic disk in detail suggests CR play an interesting role in modifying galactic properties. We start with the phase space distributions of disk999Note that we select ‘disk’ gas by applying a concentration threshold of and require gas to fit within a cylinder of radius 28.6 kpc and height 1 kpc from the midplane. gas temperature and density at 175 Myr in Figure 5. The columns from left-right show NoCR, ADV, and DIF physics cases respectively, and the rows from top-bottom display Isolated, FaceOn, and EdgeOn runs.
In agreement with previous work, the Isolated runs (top row) indicate that including CR permits the presence of low-density, low-temperature gas, as CR provide nonthermal pressure support (Ji et al., 2020; Butsky et al., 2020). Note the low temperature ridge at K \colorblackis weak in NoCR runs (supported only by magnetic pressure in those cases)\colorblack. The low temperature ridge is dimmer (less yellow) for the DIF run related to less CR pressure in the disk supporting that gas. The ridge has a low-mass component extending to lower temperatures in the DIF case related to adiabatic cooling of the galactic wind.
Note that once the wind has impacted the galaxies, we expect that low-density gas will be preferentially removed due to its lower restoring force. Indeed, in the NoCR run this is clearly seen in both the FaceOn and EdgeOn runs at all temperatures. We also see a small increase in the amount of dense gas, particularly in the EdgeOn run, in agreement with our visual impression of gas compression in Figures 1-3.
However, the gas distribution is somewhat different in the stripped galaxies with CR. While above 104 K, low density gas seems to be removed, at cooler temperatures more low-density gas survives than in the NoCR wind runs \colorblack(highlighted by the red boxes)\colorblack. We can understand this by the low-temperature ridge in the isolated versus wind runs.
The low temperature ridge is at slightly lower temperatures when RPS is turned on due to enhanced nonthermal pressures. An elevated magnetic field strength due to compression of the disk is the source of nonthermal pressure in the NoCR case. The low temperature ridge gets brighter when including CR and is brighter for ADV than DIF related to the concentration of CR in the disk. As we will show, CR production is enhanced due to increased SFRs with RP. The low temperature feature extends to lower temperature in the DIF case due to CR outside the disk. Although CR are swept away quickly in the EdgeOn case (as seen in Figure 3), they are also constantly replenished by star formation and subsequent feedback. In summary, the inclusion of CRs allows low-temperature, low-density gas to survive in ram pressure disks due to an increase in non-thermal pressure.
The NoCR runs show that RPS efficiently strips low density gas. However, galaxies subjected to RPS (middle and bottom rows) including CR (middle and right columns) contain low density gas that is otherwise stripped in the NoCR runs (left column; bottom left portion of each plot).
Probably the most interesting result is that RPS increases the amount of low-temperature gas and this RPS-induced is effect is stronger when CR are included (see §5).
3.4 Star Formation
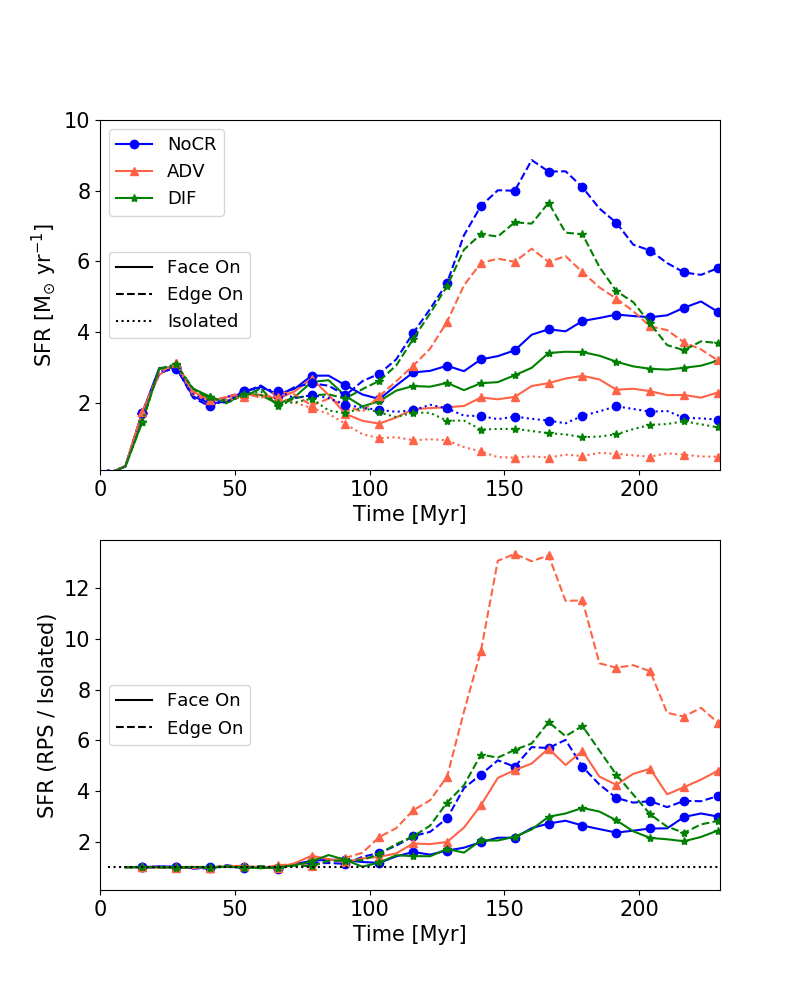
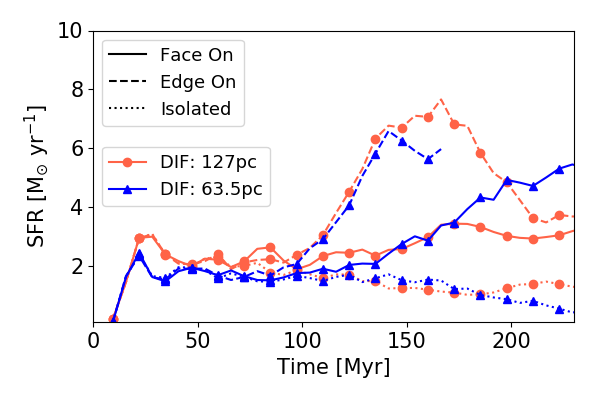
Let us begin by examining the physical SFR in the top panel of Figure 6. As previously, we use \colorblackblue circles, red triangles, and green stars\colorblack to respectively indicate NoCR, ADV, and DIF cases while solid, dashed, and dotted lines refer to the ICM wind cases of FaceOn, EdgeOn, and Isolated. All physics cases and ICM wind runs have similar SFR up to roughly 100 Myr. After that point, the ICM-ISM interaction begins to take effect with the SFRs clearly diverging. For all ICM wind runs NoCR, DIF, and ADV clearly have the highest to lowest respective SFRs with the EdgeOn runs exhibiting demonstrably higher SFR than FaceOn runs at 175 Myr \colorblack(see App. A for a discussion of convergence)\colorblack.
Comparing the SFR of RPS galaxies to their isolated counterparts is more readily achieved looking at ratios in the bottom panel of Figure 6. Again, we observe significant departures in the SFRs of different ICM wind or cosmic-ray physics cases only after 100 Myr. Subsequently, FaceOn-DIF and FaceOn-NoCR show moderate enhancement of SFR over their Isolated counterparts in best agreement with observations ( 0.2 dex enhancement of star formation, see Vulcani et al. 2018).
The FaceOn-ADV run achieves peaks of 4-6 times the value of Isolated-ADV (which is largely quiescent due to the buildup of cosmic-ray energy). The NoCR-EdgeOn run similarly initially attains a boost 4 times the Isolated run at 175 Myr. The EdgeOn-ADV run shows the most dramatic boost in SFR, exceeding an order of magnitude at 175 Myr. Since a fluid dominated by CR has an adiabatic index of 4/3 whereas a thermal plasma has an adiabatic index of 5/3, the CR fluid is more compressible. Thus, when the ICM wind impacts the disk in the ADV run which is dominated by cosmic-pressure, there is a larger increase in the density than the DIF or NoCR cases, explaining the boost in SFR.
Clearly the EdgeOn-ADV run is inconsistent with the much more modest boosts in star formation found by Vulcani et al. (2018); in fact, all the EdgeOn runs appear to be inconsistent with observations. Roediger & Brüggen (2006) found inclination makes a minor difference to RPS until 60o, suggesting most spiral galaxies falling into a cluster can be modeled as FaceOn. Although both FaceOn-DIF and FaceOn-NoCR are consistent with observed SFR enhancements, the degeneracy may be broken when we consider the evolution of mass at the galactic center below.
3.5 Feeding the AGN: Accretion onto the Galactic Center
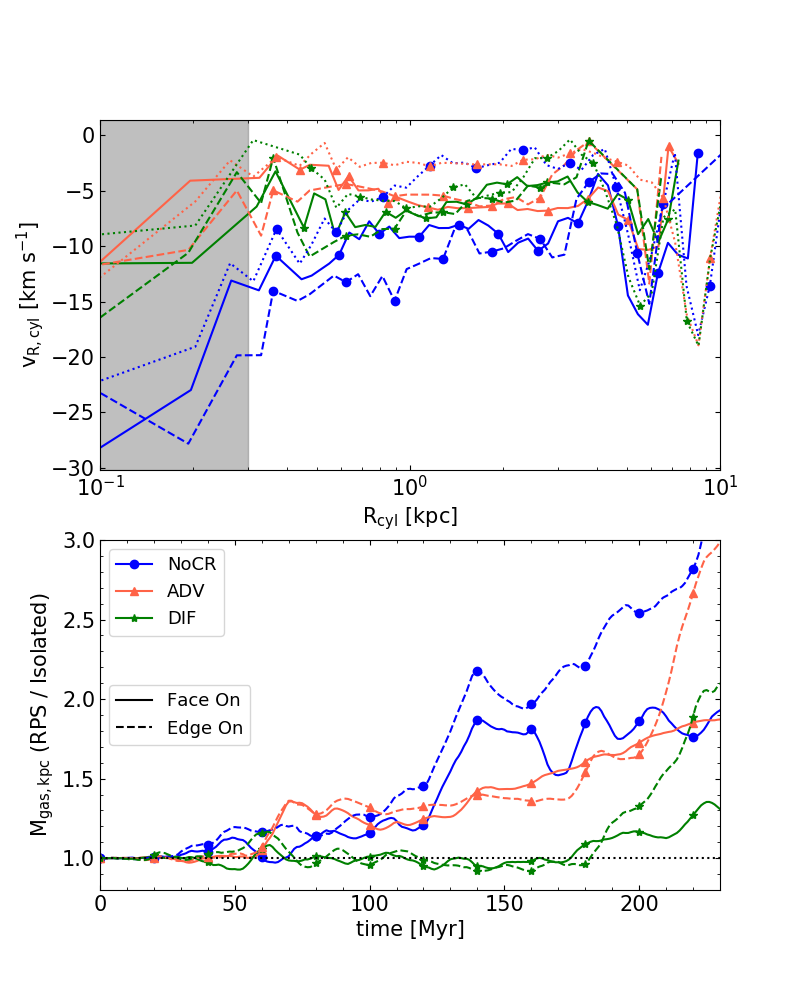
While the SFR plots appear degenerate between the DIF and NoCR models, the galactic accretion rate (Figure 7) appears to tell a different story. The top panel indicates the accretion rate of material flowing in the disk plane towards the galactic center. That is, we select disk gas (tracer concentration within a cylinder of radius 28.6 kpc and height 1 kpc from the midplane) and take a one-dimensional profile of the radially inward flowing velocity. We time-average the radial velocity at each radius from 100 - 230 Myr101010The SFR begins to divrge between the different runs at 100 Myr. We confirmed our results averaging 50 - 230 Myr. . We indicate the NoCR, ADV, and DIF models as \colorblackblue circles, red triangles, and green stars\colorblack, with the FaceOn, EdgeOn, and Isolated galaxies marked as solid, dashed, and dotted. In general, we see that RPS galaxies have enhanced accretion rates, in qualitative agreement with observations finding RPS galaxies have much higher AGN fractions than galaxies in the field (Poggianti et al., 2017a; Radovich et al., 2019). Moreover, the runs with CR appear to suppress galactic accretion, as the NoCR run clearly has the strongest accretion rate independent of inclination. Together with the SFR results, this suggests CR must be more weakly coupled to the disk gas. That is, either CR are transported faster or they rapidly experience strong Coulomb and hadronic losses. \colorblackThe accretion rate for the Isolated runs appear to be consistent with recent cosmological models that also find cosmic rays suppress accretion (Trapp et al., 2021).\colorblack
For a clearer picture of the accretion onto the galactic center, we show in the bottom panel of Figure 7 the time evolution of the gas111111\colorblackNote that the mass converted into stars is relatively modest and does not impact our conclusions.\colorblack mass within a sphere of radius 1 kpc emanating from the galactic center as a ratio of RPS runs to their Isolated counterparts. \colorblackFor example, we indicate with a blue solid curve the central 1 kpc gas mass for the ratio of FaceOn-NoCR to Isolated-NoCR.\colorblack Until about 100 Myr, the galactic central mass is largely indistinguishable between ICM wind types and CR physics cases (20% difference). Subsequently, the ISM-ICM interaction drives accretion towards the galactic central region. \colorblackThe nonthermal pressure of CR suppress accretion and as a result, the central gas mass is nearly double for FaceOn-NoCR compared to FaceOn-DIF.\colorblack In general, the NoCR runs exhibit the largest central masses followed by the ADV and then DIF runs.
At the end of our simulations, the DIF run has the least mass accreted in the galactic center. This may suggest CR suffer strong calorimetric losses, or that the diffusion coefficient must be much faster to reduce the coupling to disk gas, if strong accretion is required to match observations of high AGN fraction in RPS galaxies. However, we note that although weaker, the DIF RPS runs nevertheless have an elevated accreted mass in the galactic center compared to Isolated \colorblack(that is, the ratio is greater than one)\colorblack; it would be interesting if future work can tease out the required accretion to trigger AGN.
Note that even in the Isolated runs the galactic center mass increases by a factor of two for cosmic-ray runs and a factor of four for NoCR (not shown here). Our magnetized disk is subject to the magnetorotational instability (MRI; Balbus & Hawley 1991) beyond 4 kpc where the angular velocity begins to diminish radially outward (Hawley & Balbus, 1999). Since the MRI growth rate is proportional to orbital frequency, growth is strongest for the inner parts of the disk (e.g., 120 Myr at 4 kpc and 800 Myr at the disk edge; for more discussion see Tonnesen & Stone 2014). We also expect gravitational torques (i.e., self-gravity) to transport angular momentum. Thus, we expect some accretion of mass towards the galactic center even for Isolated. Moreover, since the magnetic field in the disk is strengthened for disks subjected to RPS (see middle panel of Figure 8), the increase in accretion for RPS runs compared to Isolated could be due to more efficient MRI.
The enhanced accretion of NoCR runs over those with CR, particularly over DIF runs, is potentially constraining of CR transport and calorimetry.
3.6 Radio Emission
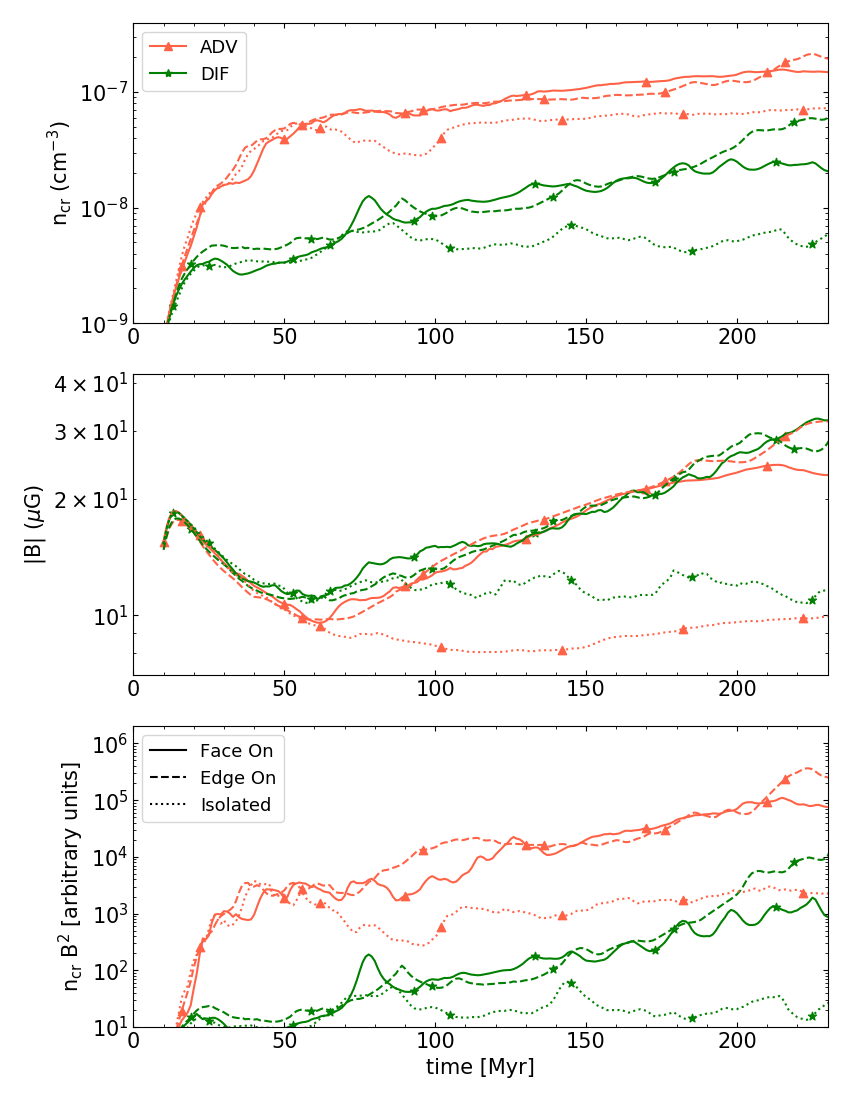
RPS galaxies are observed to possess enhanced global radio emission, existing as outliers to the otherwise very tight FRC (Murphy et al., 2009; Vollmer et al., 2013). However, it is unclear if the excess compared to the FRC is due to stronger magnetic fields, elevated CR number densities , or both. In Figure 8 we determine the relative contribution of these components to a synchrotron radio emission proxy ().
In the top panel of Figure 8 we see that RPS elevates the by a factor of a few for ADV runs and about one magnitude for DIF runs compared to their Isolated galaxy counterparts, likely related to RPS boosting the SFR (see Figure 6). We highlight that the lower for DIF compared to ADV must be due to the transport of CR out of the galactic disk, as more CR are injected for the DIF run (it has a higher SFR than ADV). Similarly, the boost in is very similar in the FaceOn and EdgeOn runs even though the boost in SFR is different, again suggesting transport dominates the evolution. Surprisingly, ADV has a smaller boost in despite having a larger boost in SFR than DIFfor runs including RPS. This may suggest fewer CR are stripped in the DIF case. Clearly, exploring the boost in represents an interesting avenue for future research.
Yet the elevated radio emission in RPS galaxies is not only due to the elevated CR number density; in the middle panel of Figure 8 we see that the magnetic field strength is similarly boosted by a factor of a few. We also note that the magnetic field strength in the NoCRruns are boosted by a similar amount. It is somewhat surprising that the magnetic field strength is so similar for all runs with a wind, independent of CR transport or wind orientation. On the one hand, one would expect stronger magnetic field strengths for the EdgeOn runs as they exhibit higher SFRs (see top panel of Figure 6). On the other hand, compression of the disk magnetic field should be more effective for the FaceOn run, given the larger cross-sectional area of the galaxy presented to the ICM wind. We plan on disentangling these effects in future work.
However, since the synchrotron emission depends steeply on the magnetic field strength, the combined effect is a boost of two to three magnitudes, as seen in the bottom panel of Figure 8.
Clearly, CR transport plays a crucial role in driving the radio emission. We neglect more detailed analysis such as considering spatial maps of the radio emission with comparison to observations of local deficits observed by Murphy et al. (2009) as our CR model follows the protons whereas electrons generate the radio emission via synchrotron emission. Future work will use a spectral treatment of CR (Yang & Ruszkowski, 2017) to directly model the propagation and cooling of CR primary electrons, as well as the generation of secondaries.
3.7 Implications for Jellyfish Galaxies
Recent observations have discovered multiphase tails of stripped gas, extending up to 100 kpc from the disk (see Poggianti et al. 2017b). Detections of molecular gas and star formation (e.g., Moretti et al. 2018) in these tails are difficult to reconcile with theoretical work suggesting dense gas is not readily stripped (e.g., Tonnesen & Bryan 2012). Regardless of the removal, cold, molecular gas should be rapidly heated and mixed with the ambient hot ICM (Cowie & McKee 1977; McKee & Cowie 1977; Balbus & McKee 1982; Stone & Norman 1992; Klein et al. 1994; Mac Low et al. 1994; Xu & Stone 1995). In contrast, the presence of star formation suggests stripped gas not only survives but attains sufficient mass to induce gravitational collapse.
High resolution 3D cloud-crushing simulations suggest efficient radiative cooling enable clouds to not only survive but grow in mass (Gronke & Oh, 2018; Gronke & Oh, 2020; Sparre et al., 2020; Li et al., 2020; Kanjilal et al., 2021; Abruzzo et al., 2021, Farber & Gronke 2021). Tonnesen & Bryan (2021) study the survival of cold clouds in RPS tails, finding the fate of cold gas may depend on ICM properties. Even in the destruction regime, molecular material may form on short time scales when dust is present (Girichidis et al., 2021).
We find that CR provide nonthermal pressure support for a diffuse molecular phase (see Figure 5). At later times when a galaxy encounters the higher density of cluster cores, it is likely this diffuse molecular gas will be stripped, even if dense molecular cores remain unperturbed. If blobs of diffuse molecular gas are sufficiently large to satisfy the Farber & Gronke criteria then these clouds may grow in mass and eventually become starforming. However, the impact of CR on cloud crushing remains relatively unexplored (see Wiener et al. 2017b, 2019; Brüggen & Scannapieco 2020; Bustard & Zweibel 2021). In future work, we will explore these issues in greater depth.
4 Caveats and Future Work
Resolution. Our physical resolution of 127 pc is similar to that used in previous works including magnetic fields (Tonnesen & Stone, 2014; Ruszkowski et al., 2014; Ramos-Martínez et al., 2018). Although we include nonthermal physics and stellar feedback neglected by previous hydrodynamical studies, it is true such hydro studies were performed at high resolution (40 pc) limiting the ability to compare with our work. We plan on running higher resolution models in future work.
Box Size. Our relatively small box size (64 kpc)3 and resolution degrading from the galactic disk limits our ability to study the fate of stripped gas: do CR enable stripping of diffuse molecular material that can survive and compose observed molecular tails? Do CR couple with the stripped gas? How do observed radio tails constrain CR transport? We plan to investigate such stimulating problems in future work.
Wind Profile. We utilized a relatively simple model for the relative motion between our simulated galaxy and ICM. That is, we assume a fixed magnetic field strength, density and temperature. We do vary the wind velocity, modeling the galaxy falling from rest into the cluster; however, we have a constant wind for 150 Myr (for the ICM wind details, see §2.1). In reality, a galaxy falling into a cluster should sample a hotter, denser, and faster wind as it plunges towards the center of the cluster and diminishing thereafter. We note that the time we simulate the galaxy only traverses 0.3 Mpc. Thus, our galaxy samples cluster outskirts and our model is not implausible.
blackMomentum Feedback. We utilized a momentum boost factor of 5 to account for unresolved clustering of supernovae as well as to account for advection errors. While observations clearly find the average kinetic energy ejected by supernovae to be erg, the coupling with the ambient ISM is highly uncertain. Several idealized, high-resolution studies have investigated the impact that clustered supernovae have on the momentum injected (coupled) to the ISM per supernova with varying results. Kim & Ostriker (2015) find previous generations of bubbles decrease the injected momentum by a factor of two (similar to Pittard 2019). Meanwhile, Walch & Naab (2015) find the momentum injected should be at least 25% higher than the case of isolated supernovae, with Gentry et al. (2017) finding up to an order of magnitude larger and Keller et al. (2014) about five times larger. Additionally, Diesing & Caprioli (2018) find that cosmic rays may boost the momentum injected by up to an order of magnitude. Recently, Montero et al. (2021) performed 3D cosmic-ray magnetohydrodynamic simulations of isolated supernovae in homogeneous medium and found including cosmic rays increases the momentum deposition at least 50% with a higher impact at lower ambient densities (as would be the case for clustered supernovae). Thus, our choice of a boost factor of five is within the plausible range, which will hopefully be more tightly constrained by future work. Moreover, since our results are based on comparisons between different runs with all runs using the same boost factor, we do not expect our results to be impacted.\colorblack
Neglected Physics. Cosmic rays are efficiently coupled to thermal plasma by scattering off waves they self-excite. The distribution of CR thus drifts with respect to the thermal plasma at the local Alfven velocity (Kulsrud & Pearce, 1969; Zweibel, 2017). However, wave damping processes such as ion-neutral friction (Kulsrud & Cesarsky, 1971; Farber et al., 2018; Bustard & Zweibel, 2021), turbulent damping (Farmer & Goldreich, 2004; Lazarian, 2016; Holguin et al., 2019), linear Landau damping (Wiener et al., 2018) and nonlinear Landau damping (Kulsrud, 2005) enable CR to stream super-alfvenically and enable CR to heat the gas (mediated by the growth and subsequent damping of hydromagnetic waves).
Our neglect of CR streaming in addition to collisional loss processes (e.g., Coulomb and hadronic) will reduce the CR energy, transferring it to the thermal gas. However, our NoCR runs can effectively model CR losses proceeding very rapidly and thus comparison between the NoCR, ADV, and DIF simulations should bracket the inclusion of CR losses. The enhanced transport of CR away from the cold, dense mid-plane due to ion-neutral damping may help to reduce CR suppression of the centralized accretion flow we observe in our simulations, see Figure 7.
However, significant uncertainties in CR transport remain (Hopkins et al., 2021). Recent work suggests CR may not completely decouple in the neutral medium (due to the “bottleneck” effect; Wiener et al. 2017b, 2019; Bustard & Zweibel 2021) if pressure anisotropy can act as an efficient mechanism to grow hydromagnetic waves (Zweibel, 2020). Even in the absence of pressure anisotropy, dust grains may grow (or damp, depending on their transport relative to the Alven speed) hydromagnetic waves, even in molecular phases of low ionization fraction (Squire et al., 2021). Exploring detailed models of (novel) cosmic-ray transport is beyond the scope of this work. Importantly, our results suggest CR transport can be effectively constrained in RPS studies, motivating future work on this topic.
We additionally ignore physics such as radiation pressure, anisotropic conduction, viscosity, and interactions with external galaxies as they are beyond the scope of this paper.
5 Conclusions
We performed the first cosmic-ray MHD simulations of an cluster galaxy subjected to ram pressure stripping, including radiative cooling, self-gravity of the gas, star formation, and stellar feedback. Our main conclusions are summarized as follows.
-
1.
Cosmic rays do not dramatically change the ram pressure stripping rate. This is true for the extreme cases of pure cosmic ray advection and diffusion without collisional losses and independent of the galaxy’s inclination to the ICM wind. In all cases the stripping rates do not differ more than 15% in the 230 Myr of evolution we simulate.
-
2.
The nonthermal pressure provided by cosmic rays permits a stable low temperature, low density phase, which persists even with ram pressure stripping. Since low density gas is typically preferentially stripped, the additional cosmic ray pressure likely supports this gas against ram pressure stripping. Interestingly, ram pressure stripping increases the amount of low-temperature gas in disks surviving both face-on and edge-on winds, particularly when cosmic rays are included.
-
3.
The observed moderate enhancement of star formation for cluster spirals undergoing ram pressure stripping places strong constraints on our models. Most of our simulations exhibit too large of a boost, attaining values 4-6 times greater for ram pressure stripped galaxies compared to isolated ones. We highlight that all of the ADV simulations over-enhance SFRs with respect to observations, while the FaceOn-NoCR and FaceOn-DIF models are in plausible agreement with the observed enhancement.
-
4.
We find that cosmic rays suppress accretion of gas along the disk towards the midplane, even in isolated cases. Conversely, observations of cluster spirals indicating a high AGN fraction and bulge-dominated spirals (density-morphology relation) suggest enhanced gas accumulation in the nuclear region of galaxies undergoing ram pressure stripping. These observations appear to favor cosmic rays suffering rapid catastrophic losses or very efficient transport out of the disk. We suggest observations of ram pressure stripped galaxies may place novel constraints on cosmic-ray physics.
-
5.
In agreement with radio observations, our galaxy models suggest ram pressure stripped galaxies boast enhanced radio emission compared to their counterparts in the field. We find magnetic field strengths boosted by a factor of a few, and cosmic ray number densities enhanced by a factor of ten for the diffusion model and by a factor of a few for the advection model. Cosmic ray transport thus may play a crucial role in understanding the enhanced radio emission above the far-infrared to radio correlation for cluster spirals.
Acknowledgements
RJF gratefully acknowledges Dongwook Lee for helpful discussions.
RJF thanks the Kavli Institute for Theoretical Physics for hospitality during part of this project as part of the Graduate Fellowship Program. This research was supported in part by the National Science Foundation under Grant No. NSF PHY-1748958. MR acknowledges support from NSF Collaborative Research Grants AST-1715140 and AST-2009227 and NASA grants 80NSSC20K1541 and 80NSSC20K1583. ST acknowledges support from the Center for Computational Astrophysics at the Flatiron Institute, which is supported by the Simons Foundation. This project utilized the visualization and data analysis package yt (Turk et al., 2010); we are grateful to the yt community for their support.
Data Availability
The simulation and data analysis scripts utilized to obtain the results presented in this paper will be shared on reasonable request to the corresponding author.
References
- Abruzzo et al. (2021) Abruzzo M. W., Bryan G. L., Fielding D. B., 2021, arXiv preprint arXiv:2101.10344
- Agertz et al. (2013) Agertz O., Kravtsov A. V., Leitner S. N., Gnedin N. Y., 2013, The Astrophysical Journal, 770, 25
- Balbus & Hawley (1991) Balbus S. A., Hawley J. F., 1991, The Astrophysical Journal, 376, 214
- Balbus & McKee (1982) Balbus S. A., McKee C. F., 1982, The Astrophysical Journal, 252, 529
- Beck & Golla (1988) Beck R., Golla G., 1988, Astronomy and Astrophysics, 191, L9
- Bekki (2013) Bekki K., 2013, Monthly Notices of the Royal Astronomical Society, 438, 444
- Booth et al. (2013) Booth C., Agertz O., Kravtsov A. V., Gnedin N. Y., 2013, The Astrophysical Journal Letters, 777, L16
- Boselli & Gavazzi (2006) Boselli A., Gavazzi G., 2006, Publications of the Astronomical Society of the Pacific, 118, 517
- Brüggen & Scannapieco (2020) Brüggen M., Scannapieco E., 2020, The Astrophysical Journal, 905, 19
- Burkert (1995) Burkert A., 1995, The Astrophysical Journal Letters, 447, L25
- Bustard & Zweibel (2021) Bustard C., Zweibel E. G., 2021, The Astrophysical Journal, 913, 106
- Bustard et al. (2020) Bustard C., Zweibel E. G., D’Onghia E., Gallagher III J., Farber R., 2020, The Astrophysical Journal, 893, 29
- Butcher & Oemler Jr (1978) Butcher H., Oemler Jr A., 1978, The Astrophysical Journal, 226, 559
- Butsky & Quinn (2018) Butsky I. S., Quinn T. R., 2018, The Astrophysical Journal, 868, 108
- Butsky et al. (2020) Butsky I. S., Fielding D. B., Hayward C. C., Hummels C. B., Quinn T. R., Werk J. K., 2020, The Astrophysical Journal, 903, 77
- Chan et al. (2019) Chan T. K., Kereš D., Hopkins P. F., Quataert E., Su K.-Y., Hayward C. C., Faucher C.-A., Ere G., 2019, MNRAS, 488, 3716
- Cowie & McKee (1977) Cowie L. L., McKee C. F., 1977, The Astrophysical Journal, 211, 135
- Dickey & Salpeter (1984) Dickey J., Salpeter E., 1984, The Astrophysical Journal, 284, 461
- Diesing & Caprioli (2018) Diesing R., Caprioli D., 2018, Physical review letters, 121, 091101
- Dressler (1980) Dressler A., 1980, The Astrophysical Journal, 236, 351
- Dubey et al. (2008) Dubey A., Reid L. B., Fisher R., 2008, Physica Scripta, 2008, 14046
- Dursi & Pfrommer (2008) Dursi L., Pfrommer C., 2008, The Astrophysical Journal, 677, 993
- Enßlin et al. (2007) Enßlin T. A., Pfrommer C., Springel V., Jubelgas M., 2007, Astronomy & Astrophysics, 473, 41
- Everett et al. (2008) Everett J. E., Zweibel E. G., Benjamin R. A., McCammon D., Rocks L., Gallagher III J. S., 2008, The Astrophysical Journal, 674, 258
- Farber et al. (2018) Farber R., Ruszkowski M., Yang H.-Y., Zweibel E. G., 2018, The Astrophysical Journal, 856, 112
- Farmer & Goldreich (2004) Farmer A. J., Goldreich P., 2004, The Astrophysical Journal, 604, 671
- Ferland et al. (1998) Ferland G., Korista K., Verner D., Ferguson J., Kingdon J., Verner E., 1998, Publications of the Astronomical Society of the Pacific, 110, 761
- Fryxell et al. (2000) Fryxell B., et al., 2000, The Astrophysical Journal Supplement Series, 131, 273
- Gentry et al. (2017) Gentry E. S., Krumholz M. R., Dekel A., Madau P., 2017, Monthly Notices of the Royal Astronomical Society, 465, 2471
- Gentry et al. (2019) Gentry E. S., Krumholz M. R., Madau P., Lupi A., 2019, Monthly Notices of the Royal Astronomical Society, 483, 3647
- Girichidis et al. (2016) Girichidis P., et al., 2016, The Astrophysical Journal Letters, 816, L19
- Girichidis et al. (2018) Girichidis P., Naab T., Hanasz M., Walch S., 2018, Monthly Notices of the Royal Astronomical Society, 479, 3042
- Girichidis et al. (2021) Girichidis P., Naab T., Walch S., Berlok T., 2021, arXiv preprint arXiv:2101.08269
- Gnedin & Kravtsov (2011) Gnedin N. Y., Kravtsov A. V., 2011, The Astrophysical Journal, 728, 88
- Grenier et al. (2015) Grenier I. A., Black J. H., Strong A. W., 2015, Annual Review of Astronomy and Astrophysics, 53, 199
- Gronke & Oh (2018) Gronke M., Oh S. P., 2018, Monthly Notices of the Royal Astronomical Society: Letters, 480, L111–L115
- Gronke & Oh (2020) Gronke M., Oh S. P., 2020, Monthly Notices of the Royal Astronomical Society, 492, 1970
- Gunn & Gott III (1972) Gunn J. E., Gott III J. R., 1972, The Astrophysical Journal, 176, 1
- Hawley & Balbus (1999) Hawley J. F., Balbus S. A., 1999, Physics of Plasmas, 6, 4444
- Heintz & Zweibel (2018) Heintz E., Zweibel E. G., 2018, The Astrophysical Journal, 860, 97
- Hernquist (1993) Hernquist L., 1993, The Astrophysical Journal Supplement Series, 86, 389
- Holguin et al. (2019) Holguin F., Ruszkowski M., Lazarian A., Farber R., Yang H. K., 2019, Monthly Notices of the Royal Astronomical Society, 490, 1271
- Hopkins et al. (2020) Hopkins P. F., et al., 2020, Monthly Notices of the Royal Astronomical Society, 492, 3465
- Hopkins et al. (2021) Hopkins P. F., Squire J., Chan T., Quataert E., Ji S., Kereš D., Faucher-Giguère C.-A., 2021, Monthly Notices of the Royal Astronomical Society, 501, 4184
- Huang & Greengard (1999) Huang J., Greengard L., 1999, SIAM Journal on Scientific Computing, 21, 1551
- Hubble & Humason (1931) Hubble E., Humason M. L., 1931, The Astrophysical Journal, 74, 43
- Iffrig & Hennebelle (2015) Iffrig O., Hennebelle P., 2015, Astronomy & Astrophysics, 576, A95
- Jáchym et al. (2009) Jáchym P., Köppen J., Palouš J., Combes F., 2009, Astronomy & Astrophysics, 500, 693
- Jáchym et al. (2017) Jáchym P., et al., 2017, The Astrophysical Journal, 839, 114
- Jaffé et al. (2015) Jaffé Y. L., Smith R., Candlish G. N., Poggianti B. M., Sheen Y.-K., Verheijen M. A., 2015, Monthly Notices of the Royal Astronomical Society, 448, 1715
- Ji et al. (2020) Ji S., et al., 2020, Monthly Notices of the Royal Astronomical Society, 496, 4221
- Kanjilal et al. (2021) Kanjilal V., Dutta A., Sharma P., 2021, Monthly Notices of the Royal Astronomical Society, 501, 1143
- Keller et al. (2014) Keller B., Wadsley J., Benincasa S., Couchman H., 2014, Monthly Notices of the Royal Astronomical Society, 442, 3013
- Kennicutt Jr (1998) Kennicutt Jr R. C., 1998, The Astrophysical Journal, 498, 541
- Kim & Ostriker (2015) Kim C.-G., Ostriker E. C., 2015, The Astrophysical Journal, 802, 99
- Kim & Ostriker (2017) Kim C.-G., Ostriker E. C., 2017, The Astrophysical Journal, 846, 133
- Klein et al. (1994) Klein R. I., McKee C. F., Colella P., 1994, The Astrophysical Journal, 420, 213
- Kravtsov (1999) Kravtsov A., 1999, PhD thesis, New Mexico State Univ.
- Kravtsov et al. (2002) Kravtsov A. V., Klypin A., Hoffman Y., 2002, The Astrophysical Journal, 571, 563
- Kronberger et al. (2008) Kronberger T., Kapferer W., Ferrari C., Unterguggenberger S., Schindler S., 2008, Astronomy & Astrophysics, 481, 337
- Krumholz & Tan (2007) Krumholz M. R., Tan J. C., 2007, The Astrophysical Journal, 654, 304
- Kulsrud (2005) Kulsrud R. M., 2005, RM Kulsrud
- Kulsrud & Cesarsky (1971) Kulsrud R., Cesarsky C., 1971, Astrophysical Letters, 8, 189
- Kulsrud & Pearce (1969) Kulsrud R., Pearce W. P., 1969, The Astrophysical Journal, 156, 445
- Lacki et al. (2010) Lacki B. C., Thompson T. A., Quataert E., 2010, The Astrophysical Journal, 717, 1
- Lazarian (2016) Lazarian A., 2016, The Astrophysical Journal, 833, 131
- Lee (2013) Lee D., 2013, Journal of Computational Physics, 243, 269
- Lee & Deane (2009) Lee D., Deane A. E., 2009, Journal of Computational Physics, 228
- Lee et al. (2020) Lee J., Kimm T., Katz H., Rosdahl J., Devriendt J., Slyz A., 2020, The Astrophysical Journal, 905, 31
- Leroy et al. (2017) Leroy A. K., et al., 2017, The Astrophysical Journal, 846, 71
- Li et al. (2020) Li Z., Hopkins P. F., Squire J., Hummels C., 2020, Monthly Notices of the Royal Astronomical Society, 492, 1841
- Lyutikov (2006) Lyutikov M., 2006, Monthly Notices of the Royal Astronomical Society, 373, 73
- Mac Low et al. (1994) Mac Low M.-M., McKee C. F., Klein R. I., Stone J. M., Norman M. L., 1994, The Astrophysical Journal, 433, 757
- Martizzi et al. (2015) Martizzi D., Faucher-Giguère C.-A., Quataert E., 2015, Monthly Notices of the Royal Astronomical Society, 450, 504
- McKee & Cowie (1977) McKee C. F., Cowie L. L., 1977, The Astrophysical Journal, 215, 213
- Miyamoto & Nagai (1975) Miyamoto M., Nagai R., 1975, Publications of the Astronomical Society of Japan, 27, 533
- Montero et al. (2021) Montero F. R., Martin-Alvarez S., Sijacki D., Slyz A., Devriendt J., Dubois Y., 2021, arXiv preprint arXiv:2110.09862
- Moretti et al. (2018) Moretti A., et al., 2018, Monthly Notices of the Royal Astronomical Society, 480, 2508
- Moretti et al. (2020a) Moretti A., et al., 2020a, The Astrophysical Journal, 889, 9
- Moretti et al. (2020b) Moretti A., et al., 2020b, The Astrophysical Journal Letters, 897, L30
- Müller et al. (2021) Müller A., et al., 2021, Nature Astronomy, 5, 159
- Murphy et al. (2009) Murphy E. J., Kenney J. D. P., Helou G., Chung A., Howell J. H., 2009, The Astrophysical Journal, 694, 1435
- Oosterloo & van Gorkom (2005) Oosterloo T., van Gorkom J., 2005, Astronomy & Astrophysics, 437, L19
- Paladino et al. (2006) Paladino R., Murgia M., Helfer T. T., Wong T., Ekers R., Blitz L., Gregorini L., Moscadelli L., 2006, Astronomy and Astrophysics, 456, 847
- Pfrommer & Dursi (2010) Pfrommer C., Dursi J., 2010, Nature Physics, 6, 520
- Pfrommer et al. (2017a) Pfrommer C., Pakmor R., Schaal K., Simpson C., Springel V., 2017a, Monthly Notices of the Royal Astronomical Society, 465, 4500
- Pfrommer et al. (2017b) Pfrommer C., Pakmor R., Simpson C. M., Springel V., 2017b, The Astrophysical Journal Letters, 847, L13
- Pittard (2019) Pittard J. M., 2019, Monthly Notices of the Royal Astronomical Society, 488, 3376
- Poggianti et al. (2017a) Poggianti B. M., et al., 2017a, Nature, 548, 304
- Poggianti et al. (2017b) Poggianti B. M., et al., 2017b, The Astrophysical Journal, 844, 48
- Radovich et al. (2019) Radovich M., Poggianti B., Jaffé Y. L., Moretti A., Bettoni D., Gullieuszik M., Vulcani B., Fritz J., 2019, Monthly Notices of the Royal Astronomical Society, 486, 486
- Ramos-Martínez et al. (2018) Ramos-Martínez M., Gómez G. C., Pérez-Villegas Á., 2018, Monthly Notices of the Royal Astronomical Society, 476, 3781
- Ricker (2008) Ricker P., 2008, The Astrophysical Journal Supplement Series, 176, 293
- Roediger (2009) Roediger E., 2009, Astronomische Nachrichten: Astronomical Notes, 330, 888
- Roediger & Brüggen (2006) Roediger E., Brüggen M., 2006, Monthly Notices of the Royal Astronomical Society, 369, 567
- Roediger et al. (2014) Roediger E., Brüggen M., Owers M., Ebeling H., Sun M., 2014, Monthly Notices of the Royal Astronomical Society: Letters, 443, L114
- Rudd et al. (2008) Rudd D. H., Zentner A. R., Kravtsov A. V., 2008, The Astrophysical Journal, 672, 19
- Ruggiero & Lima Neto (2017) Ruggiero R., Lima Neto G. B., 2017, Monthly Notices of the Royal Astronomical Society, 468, 4107
- Ruszkowski et al. (2007) Ruszkowski M., Enßlin T., Brüggen M., Heinz S., Pfrommer C., 2007, Monthly Notices of the Royal Astronomical Society, 378, 662
- Ruszkowski et al. (2008) Ruszkowski M., Enßlin T., Brüggen M., Begelman M., Churazov E., 2008, Monthly Notices of the Royal Astronomical Society, 383, 1359
- Ruszkowski et al. (2014) Ruszkowski M., Brüggen M., Lee D., Shin M.-S., 2014, The Astrophysical Journal, 784, 75
- Ruszkowski et al. (2017) Ruszkowski M., Yang H.-Y. K., Zweibel E., 2017, The Astrophysical Journal, 834, 208
- Salem & Bryan (2014) Salem M., Bryan G. L., 2014, Monthly Notices of the Royal Astronomical Society, 437, 3312
- Schmidt (1959) Schmidt M., 1959, The astrophysical journal, 129, 243
- Schulz & Struck (2001) Schulz S., Struck C., 2001, Monthly Notices of the Royal Astronomical Society, 328, 185
- Scodeggio & Gavazzi (1993) Scodeggio M., Gavazzi G., 1993, The Astrophysical Journal, 409, 110
- Semenov et al. (2016) Semenov V. A., Kravtsov A. V., Gnedin N. Y., 2016, The Astrophysical Journal, 826, 200
- Semenov et al. (2017) Semenov V. A., Kravtsov A. V., Gnedin N. Y., 2017, The Astrophysical Journal, 845, 133
- Semenov et al. (2018) Semenov V. A., Kravtsov A. V., Gnedin N. Y., 2018, The Astrophysical Journal, 861, 4
- Semenov et al. (2021) Semenov V. A., Kravtsov A. V., Caprioli D., 2021, The Astrophysical Journal, 910, 126
- Simpson et al. (2016) Simpson C. M., Pakmor R., Marinacci F., Pfrommer C., Springel V., Glover S. C., Clark P. C., Smith R. J., 2016, The Astrophysical Journal Letters, 827, L29
- Sparre et al. (2020) Sparre M., Pfrommer C., Ehlert K., 2020, Monthly Notices of the Royal Astronomical Society, 499, 4261
- Squire et al. (2021) Squire J., Hopkins P. F., Quataert E., Kempski P., 2021, MNRAS, 502, 2630
- Steinhauser et al. (2016) Steinhauser D., Schindler S., Springel V., 2016, Astronomy & Astrophysics, 591, A51
- Stone & Norman (1992) Stone J. M., Norman M. L., 1992, The Astrophysical Journal, 173, 17
- Su et al. (2010) Su M., Slatyer T. R., Finkbeiner D. P., 2010, The Astrophysical Journal, 724, 1044
- Sun et al. (2006) Sun M., Jones C., Forman W., Nulsen P., Donahue M., Voit G., 2006, The Astrophysical Journal Letters, 637, L81
- Sun et al. (2009) Sun M., Donahue M., Roediger E., Nulsen P., Voit G., Sarazin C., Forman W., Jones C., 2009, The Astrophysical Journal, 708, 946
- Tonnesen (2019) Tonnesen S., 2019, The Astrophysical Journal, 874, 161
- Tonnesen & Bryan (2009) Tonnesen S., Bryan G. L., 2009, The Astrophysical Journal, 694, 789
- Tonnesen & Bryan (2010) Tonnesen S., Bryan G. L., 2010, The Astrophysical Journal, 709, 1203
- Tonnesen & Bryan (2012) Tonnesen S., Bryan G. L., 2012, Monthly Notices of the Royal Astronomical Society, 422, 1609
- Tonnesen & Bryan (2021) Tonnesen S., Bryan G. L., 2021, The Astrophysical Journal, 911, 68
- Tonnesen & Stone (2014) Tonnesen S., Stone J., 2014, The Astrophysical Journal, 795, 148
- Trachternach et al. (2008) Trachternach C., De Blok W., Walter F., Brinks E., Kennicutt Jr R., 2008, The Astronomical Journal, 136, 2720
- Trapp et al. (2021) Trapp C., et al., 2021, arXiv preprint arXiv:2105.11472
- Turk et al. (2010) Turk M. J., Smith B. D., Oishi J. S., Skory S., Skillman S. W., Abel T., Norman M. L., 2010, ApJS, 192, 9
- Uhlig et al. (2012) Uhlig M., Pfrommer C., Sharma M., Nath B. B., Enßlin T., Springel V., 2012, Monthly Notices of the Royal Astronomical Society, 423, 2374
- Vollmer et al. (2009) Vollmer B., Soida M., Chung A., Chemin L., Braine J., Boselli A., Beck R., 2009, Astronomy and Astrophysics, 496, 669
- Vollmer et al. (2010) Vollmer B., Soida M., Chung A., Beck R., Urbanik M., Chyży K. T., Otmianowska-Mazur K., Gorkom J. H. V., 2010, Astronomy and Astrophysics, 512, A36
- Vollmer et al. (2013) Vollmer B., Soida M., Beck R., Chung A., Urbanik M., Chyży K. T., Otmianowska-Mazur K., Kenney J. D. P., 2013, Astronomy and Astrophysics, 553, A116
- Vulcani et al. (2018) Vulcani B., et al., 2018, The Astrophysical Journal Letters, 866, L25
- Walch & Naab (2015) Walch S., Naab T., 2015, Monthly Notices of the Royal Astronomical Society, 451, 2757
- Werk et al. (2013) Werk J. K., Prochaska J. X., Thom C., Tumlinson J., Tripp T. M., O’Meara J. M., Peeples M. S., 2013, The Astrophysical Journal Supplement Series, 204, 17
- Wiener et al. (2017a) Wiener J., Pfrommer C., Oh S. P., 2017a, MNRAS, 467, 906
- Wiener et al. (2017b) Wiener J., Pfrommer C., Oh S. P., 2017b, Monthly Notices of the Royal Astronomical Society, 467, 906
- Wiener et al. (2018) Wiener J., Zweibel E. G., Oh S. P., 2018, Monthly Notices of the Royal Astronomical Society, 473, 3095
- Wiener et al. (2019) Wiener J., Zweibel E. G., Ruszkowski M., 2019, MNRAS, 489, 205
- Xu & Stone (1995) Xu J., Stone J. M., 1995, The Astrophysical Journal, 454, 172
- Yang & Ruszkowski (2017) Yang H.-Y., Ruszkowski M., 2017, The Astrophysical Journal, 850, 2
- Yang et al. (2012) Yang H.-Y., Ruszkowski M., Ricker P., Zweibel E., Lee D., 2012, The Astrophysical Journal, 761, 185
- Yang et al. (2013) Yang H.-Y. K., Ruszkowski M., Zweibel E., 2013, Monthly Notices of the Royal Astronomical Society, 436, 2734
- Yun et al. (2001) Yun M. S., Reddy N. A., Condon J. J., 2001, The Astrophysical Journal, 554, 803
- Zhang et al. (2013) Zhang B., et al., 2013, The Astrophysical Journal, 777, 122
- Zweibel (2017) Zweibel E. G., 2017, Physics of Plasmas, 24, 055402
- Zweibel (2020) Zweibel E. G., 2020, The Astrophysical Journal, 890, 67
Appendix A Convergence
blackDue to computational expense, we are somewhat limited in physical resolution 127 pc in the runs presented above. We expect the accretion rate towards the center of the galaxy to be unresolved and hence we caution interpretation of the central regions of Figure\colorblack 7 \colorblackwith a grey region.\colorblack
blackAlthough the expense was rather large, we managed to perform simulations of the DIF runs at 63 pc resolution to test convergence. Note that the EdgeOn run was the most expensive due to the enhanced star formation rate. Nevertheless, we were able to run the EdgeOn case to the peak in star formation at 175 Myr. We find rather good agreement in the star formation history across resolution, as shown in Figure\colorblack 9.
blackImportantly, the results are qualitatively the same: EdgeOn boosts SFRs more than FaceOn stripping. In detail, however, the FaceOn-DIF run at higher resolution attains a stronger burst at > 175 Myr, whereas the Isolated-DIF run at higher resolution exhibits lower SFR. The combined effect is a boost in star formation due to ram pressure stripping beyond the observed range. However, we had similarly disfavored the FaceOn-DIF run based on the accretion rate plot, so our end results are not impacted, even if the details are a bit different. Nevertheless, the SFR is quite similar in comparing the fiducial and high resolution runs for most of the simulated time for most of the physics and wind cases. This is rather surprising as high-resolution ISM slab simulations suggest star formation rates don’t converge until 8 pc resolution\colorblack (Kim & Ostriker, 2017).
Appendix B True Diode Boundary Conditions
Diode boundary conditions allow material to flow out of the computational domain but are intended to prevent inflow. In FLASH, boundary conditions apply conditions to cell-centered values of ghost cells which border the physical computational domain. The default diode boundary condition implementation in FLASH simply replaces the velocity component component normal to the boundary with zero when it is negative. However, since the Riemann problem solves for the fluxes at cell interfaces to update hydrodynamic terms, even if the ghost cell-centered velocity is zero, an inflowing velocity at the ultimate interior cell (UIC) will result in an inflow accross the interface. This problem generically leads to non-conservation of mass when gravitational acceleration is present (as well as similar acceleration profiles).
Therefore, we apply the diode condition to the UIC cells, guaranteeing the flux across the physical domain boundary does not permit inflows. This simple, yet effective modification ensured conservation of mass. In our test, we initialized an box with a static gas of uniform temperature K and density g cm-3. We turned off magnetic fields, cooling and heating, and star formation and feedback. However, we maintained the static potentials described in Section 2.1. In Figure 10 we show default (corrected) diode boundary conditions with solid blue (red dashed) curves, with the corrected diode boundary conditions indicating marked improvement.
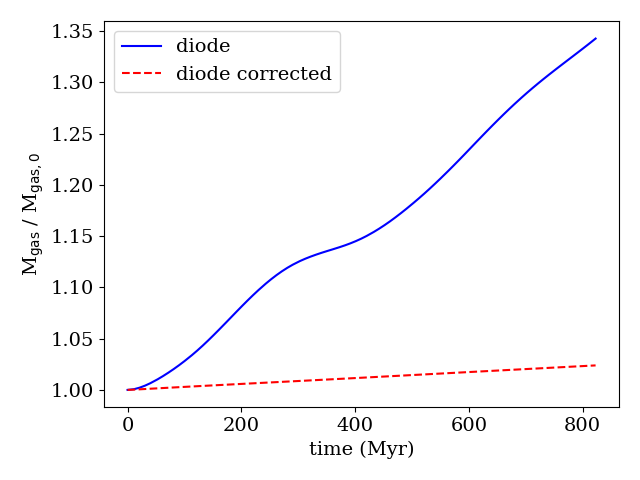
We note that with large box sizes and higher resolution such that the acceleration at the UIC vanishes, non-conservation of mass also vanishes. Related to computational constraints, we were unable to perform our fiducial simulations in larger box sizes (except at lower resolution).