Optical and NIR data and modelling of nova V5668 Sgr
Abstract
We present HST optical images, Keck-OSIRIS NIR IFS data cubes and Keck-NIRC2 NIR images of nova V5668 Sgr from 2016 to 2019. The observations indicate enhanced emission at the polar caps and equatorial torus for low ionization lines, and enhanced high ionization emission lines only at the polar caps. The radial velocities are compatible with a homogeneous expansion velocity of v=590 km s-1 and a system inclination angle of 24. These values were used to estimate an expansion parallax distance of 1200 400 pc. The NIRC2 data indicate the presence of dust in 2016 and 2017, but no dust emission could be detected in 2019. The observational data were used for assembling 3D photoionization models of the ejecta. The model results indicate that the central source has a temperature of K and a luminosity of erg s-1 in August of 2017 (2.4 years post eruption), and that the shell has a mass of M☉. The models also suggest an anisotropy of the ionizing flux, possibly by the contribution from a luminous accretion disc.
keywords:
circumstellar matter – infrared: stars – novae, cataclysmic variables – stars: individual(V5668 Sgr) – stars: abundances – line: formation1 Introduction
Nova eruptions are powered by nuclear fusion that ignites at the bottom of a hydrogen-rich shell on the surface of an accreting white dwarf in a binary system (Bode & Evans, 2008; Starrfield et al., 1972, 2016). The eruption leads to ejection of this shell mixed with the white dwarf material at velocities of hundreds to thousands of km s-1. The ejected gas often presents complex structures due to the combination of the velocity distribution, instabilities and nonuniform mass loss. Clumps, asymmetries and bipolar structures are commonly observed in nova shells (Ribeiro et al., 2009; Moraes & Diaz, 2009) and may play a key role in the evaluation of the physical and chemical parameters of novae. Although condensed regions of gas in the shell are necessary to explain the range of ionization states observed in nova spectra, most modelling of nova shells adopt simplistic density profiles, such as power-law functions. The discrepancy of the modelled and observed mass distributions can lead to inaccuracies in derived shell masses and chemical abundances, among other properties. Accurate estimates of the ejecta masses and abundances are needed to understand how novae contribute to chemical evolution of the Galaxy, especially for such species as 7Li (Izzo et al., 2015) and 26Al (José et al., 1997), and if white dwarfs in nova systems can evolve to type Ia supernovae (Nomoto & Kondo, 1991).
Considering the expansion velocities of hundreds to thousands of km s-1, the ejecta of many novae can be resolved with high-resolution imaging a few years after eruption. The study of resolved nova shells can provide valuable insights into the process of nova eruption and the development of the observed structures in the ionized shell. The formation and evolution of clumps and their relation to shocks along with the overall geometry and mass distribution of the ejecta are just a few of the outstanding questions in nova eruption physics (Steinberg & Metzger, 2020; Aydi et al., 2020). Likewise, the different morphologies frequently observed for distinct lines in spectral data cubes require investigations to clarify if their origin lies mostly in a density gradient (derived from anisotropic ejecta distribution, shocks and other processes), an abundance gradient, or an anisotropy of the ionizing photon field.
The data cubes produced by Integral Field Spectroscopy (IFS) are powerful observational tools to gather multiple types of information from different sections of the shell simultaneously (for example see Lyke & Campbell, 2009). The use of spatially resolved spectroscopy allied to photoionization models has proved to provide deeper insights into the nova ejecta structure compared to the unidimensional line-of-sight treatment (Evans et al., 1992; Takeda et al., 2018).
V5668 Sgr (Nova Sagittarii 2015b) was detected on March 15, 2015 by (Seach, 2015) and was extensively observed across the electromagnetic spectrum. In the early phase of the eruption, the nova spectra presented 7Be lines (Tajitsu et al., 2016), revisiting the discussion of novae as possible important contributors to Galactic lithium. V5668 Sgr was one of the first few novae detected in high-energy ( MeV) gamma-rays, in the early phase of eruption (Cheung et al., 2016). The link between gamma-ray and optical variabilities observed in some novae and the presence of gamma-ray emission accompanying the optical variability in V5668 Sgr are believed to result from internal shocks in colliding shells of multiple ejecta (Li et al., 2017). Dust formation was detected around days after the eruption, reaching maximum grain condensation around day , followed by grain (at least partial) destruction by day . Concomitant with the dust observation, during the period of days, soft ( keV) and hard ( keV) X-ray emission was also detected (Gehrz et al., 2018). In later stages of the eruption, ALMA observations showed that the gas was condensed in small ( cm) clumps in the shell (Diaz et al., 2018). All these events make V5668 Sgr an especially interesting target, that can be used to study possible correlations between different time-lapsed processes.
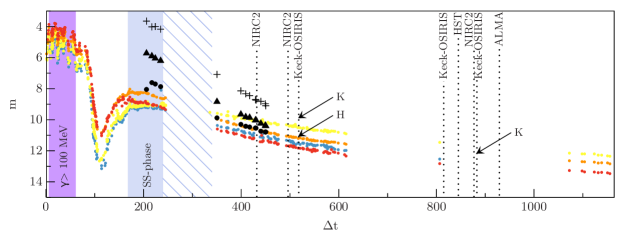
In this paper, we present Hubble Space Telescope (HST) optical images and near-infrared Keck-OSIRIS IFS data and Keck-NIRC2 imaging of V5668 Sgr, observed in the period of days after detection. Along with the analysis of the imaging and spectroscopic evolution, we provide estimates of the physical and chemical properties obtained through 3D photoionization models. The optical and NIR light curves of V5668 Sgr are displayed in Figure 1, with indications of our observations and the previous cited events.
2 HST data
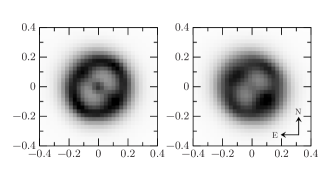
We obtained Hubble Space Telescope Wide Field Camera 3 images in the HN ii] (F657N) and [O iii] 5007 Å (F502N) narrow filters, displayed in Figure 2. The observation was made at t = 844 days, on 2017 July 06 as part of HST-GO-14787. The total fluxes for each filter, including the continuum emission and central source emission, are f and f erg cm-2 s-1. These fluxes were measured in the pipeline-processed drizzled images and are not dereddened. Direct measurements of field stars in the images at native resolution indicate that the stellar PSFs have FWHMs of 79 and 83 milliarcseconds in the F657N and F502N filters, respectively.
In both filters the remnant appears as a boxy ellipsoid with a major axis aligned SE-NW and a minor axis running NE-SW that appears to terminate in two knots of brighter emission. We interpreted these knots as polar emission, suggesting distinct densities in the equatorial and polar regions or an anisotropy of the ionizing field, or both. Additional NIR IFS analysis provides further support for the hypothesis of anisotropic ionization, which will be discussed in section 9.
By fitting gaussian functions to the peaks of the radial profiles extracted along the minor and major axes, we find the remnant diameters to be of 0.28 x 0.34 arcsec in F657N and 0.25 x 0.32 arcsec in F502N. The full width at 10 per cent maximum (FW0.1M) extends fairly circularly to 0.6 arcsec in all directions. The central point source is distinctly stronger in F657N, since forbidden transitions do not occur in the dense central source and the continuum emission is weak on the observing dates.
3 Keck-OSIRIS data
Spatially resolved spectra of V5668 Sgr were obtained with Keck-OSIRIS IFU spectrograph on three different epochs. For all dates, we used a laser guide star adaptive optics (LGSAO) system to achieve the image quality of mas, sampled at 35 mas per IFU lenslet. On 2016 August 13, we obtained data in H and K bands, with 2 exposures of 60 s for H broad band, and 2 exposures of 60 s for each K moderate band filter (Kn1, Kn2, Kn3, Kn4 and Kn5). On 2017 June 06, we observed the nova using Kn2 and Kn3, with 2 exposures of 300 s for each filter, and on 2017 August 13, we used Kn1, Kn2, Kn3 and Kn5 filters, with 2 exposures of 300 s for each filter. The spectral resolution is R 3800 or 79 km s-1 in the K band. The data were reduced with the OSIRIS Data Reduction Pipelines.
The telluric correction was performed using HD 189920 standard in the first two epochs, and using HIP 106329 in the third. The same standards were used to calibrate the flux of Keck-OSIRIS spectra based on their H and Ks 2MASS magnitudes (Cutri et al., 2003). Considering the sensitivity differences between the narrow band filters and the errors in the telluric magnitude, we expect the errors of our derived magnitudes for V5668 Sgr to be in the order of 0.3 mag. The shell integrated flux calibrated spectra of V5668 Sgr are displayed in Figures 3 and 4, for H and K bands respectively. The integrated H and K magnitudes of V5668 Sgr are displayed in Figure 1 where they can be compared to previous JHK observed magnitudes. For further analysis, we will apply a reddening correction assuming E(B-V)=0.2, on the basis of E(B-V)=0.2-0.3 suggested in the literature (Schlafly & Finkbeiner, 2011; Kuin et al., 2015; Gehrz et al., 2018).
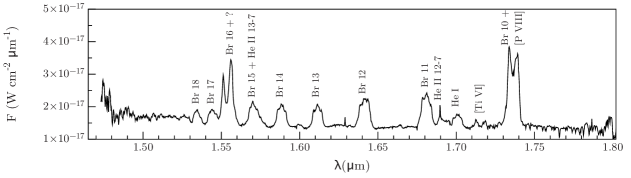
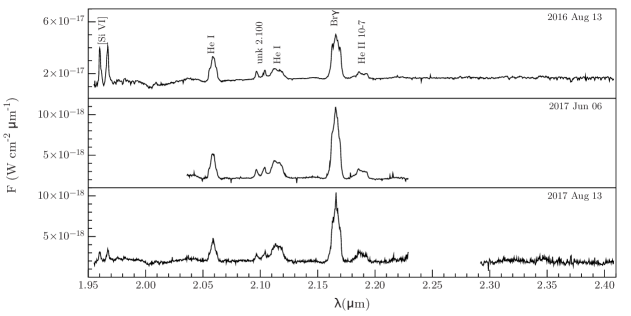
The integrated spectra show the Brackett series along the H and K bands, as well as He i and He ii transitions and a few forbidden lines. As has been observed in previous V5668 Sgr integrated spectra (Gehrz et al., 2018; Woodward et al., 2017), there are two types of line profiles: the the combination of a central peaked emission with a double peaked feature, and the purely double peaked lines. The first line structure is seen in the Brackett and He i lines that are not blended with forbidden lines. The second one is attributed to the forbidden and higher-ionization transitions, such as [Si vi], [Ti vi], [P viii] and the unidentified lines at 2.100 µm and 1.555 µm, and possibly to the He ii line at 2.189 µm, although the asymmetry of this feature and its high flux relative to the recombination flux expected from He i 2.058 µm intensity suggest the presence of another transition with close wavelength. It is interesting to notice the absence of the [Ca viii] emission line, which was present in earlier (t days) spectra (Gehrz et al., 2018). The [Ca viii] line requires a slightly lower ionization energy (147.3 eV) than [Si vi] (205.3 eV), that is still observed in the spectra, but a lower transition probability (A=0.72 s-1) than [Si vi] (A=2.38 s-1) (Kramida et al., 2020). The narrow interval of possible physical parameters of the ionizing source in order to reproduce the observed spectrum turns out to be an important constraint in the photoionization modelling of the shell.
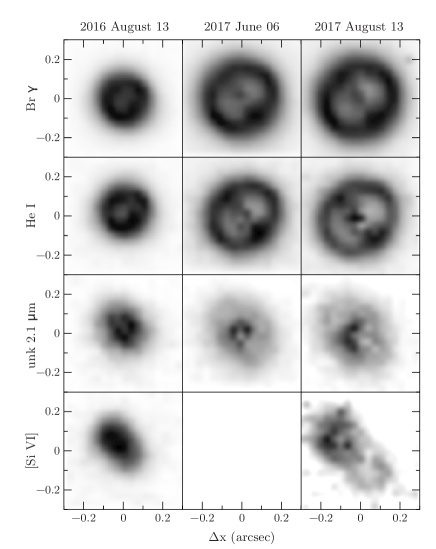
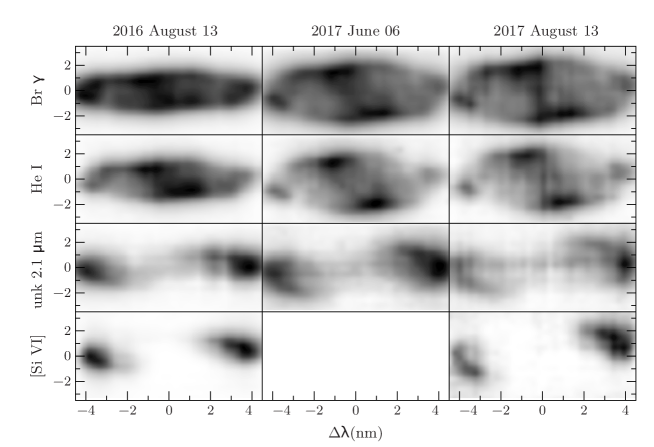
The spatially resolved spectra allows us to identify the structures responsible for these different emission line features observed in 1D spectra. The large scale shell structure observed in the permitted lines is composed of polar caps and an equatorial torus, while the forbidden lines present only the polar caps emission. It is important to stress that although we are considering this large scale smooth geometry, ALMA high spatial resolution radio observations have shown that these structures are actually a result of an unresolved clumpy gas distribution (Diaz et al., 2018). The temporal evolution of the integrated images in four different emission lines are shown in Figure 5, with their corresponding spectral profiles in Figure 6. We note the similarity of the structures for the permitted transitions of Br and He i 2.058 µm, that also matches the general structure of HST H image. For all epochs, the He i shell radii correspond to per cent of the Br radii, which can be explained by the difference in ionization energies.
For the unidentified line at 2.100 µm and the [Si vi] line, the polar emission becomes evident through the spectral profile. The absence of an equatorial torus and the stronger polar emission when compared to the other lines may imply the presence of an anisotropic ionizing source that enhances the ionization at polar caps. In this scenario, the [O iii] HST image presents strong polar emission and an equatorial torus because [O iii] has an intermediate ionization (54.9 eV) between He i and [Si vi]. For [Si vi], with much higher ionization energy (205.3 eV), the polar caps emission completely dominate. Since the unidentified line at 2.100 µm has an emission profile similar to the [Si vi], it probably comes from a highly ionized ion, with energy significantly higher than 55 eV. A similar feature was noticed in the shell of V723 Cas (Lyke & Campbell, 2009), in which the [Al ix] emission presented a bipolar shape, while lower ionization transitions, such as [Si vi] and [Ca viii], presented both equatorial torus and polar caps structures. In the case of V723 Cas, the Br emission was too faint and dominated by the central source contribution, thus the shell emission morphology could not be defined. Regarding the shell size, the mean angular radius of Br brighter structures is mas. The HWHM is mas and the total radius is mas.
4 NIRC2 data
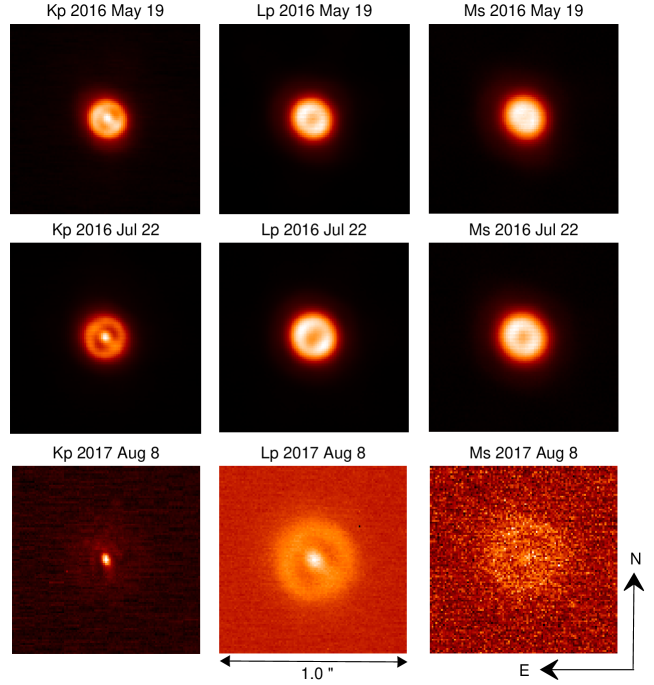
V5668 Sgr was observed with the the LGSAO assisted instrument on Keck II, the Near InfraRed Camera-2, NIRC2, in May of 2016 (t = 431 days), in July of 2016 (t = 495 days), August of 2017 (t = 876 days), and August of 2019 (t = 1613 days). NIRC2 has sensitivity in the thermal IR out to µm and this capability was used to map the dust emission in the ejecta of V5668 Sgr as show in Figure 7. The warm dust emitted brightly with a black-body equivalent temperature of 500 K in 2016, faded and cooled significantly by 2017 to less than 400 K, and was not detected in 2019 in the L-prime ( µm) and Ms ( µm) filter band-passes. The black-body equivalent temperatures were based on KLM aperture photometry of a small section of the nova shell only, with the central source excluded from the aperture. Previous estimates of dust temperature of V5668 Sgr were made by Gehrz et al. (2018) for several dates until t 400 days. They found values ranging from 700 to 1100 K, with a temperature of 97116 K at day 399. Their results may be overestimated because of the central source contribution, especially in the K band, as we can see in NIRC2 images. The high spatial resolution AO data enables our measurements to distinguish the flux in the ejecta from that of the central source. The nebular expansion and morphology of the dust matches closely with that of the gas as resolved in the HST and OSIRIS data.
5 Expansion parallax
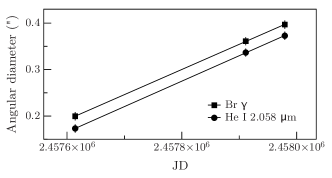
Using OSIRIS data from the three epochs, we were able to estimate the expansion rate of the torus component, using Br and He i 2.058 µm lines. The torus shape is elliptical due to projection effects, therefore we used average values of the major and minor axes measured at the line’s peak intensity. For both Br and He i features, we measured an expansion rate for the angular diameter of arcsec year-1 (Figure 8). The same analysis could not be applied to the polar caps structures because the blueshift and redshift components overlap near the center, making it difficult to determine the angular distance between the caps.
| Date | unk µm | [Si vi] | Br | He i µm |
|---|---|---|---|---|
| 2016-08-13 | 567 | 536 | 548 | 521 |
| 2017-06-06 | 518 | - | 557 | 545 |
| 2017-08-13 | 535 | 552 | 516 | 545 |
| Date | Br | He i µm |
|---|---|---|
| 2016-08-13 | 262 | 227 |
| 2017-06-06 | 247 | 236 |
| 2017-08-13 | 231 | 228 |
The lack of detected eclipses and orbital velocity for V5668 Sgr may indicate that it is a low-inclination system. This scenario favours the interpretation of a spherical expansion, in which the expansion velocity is isotropic. The assumption of a spherical expansion may introduce errors in the distance determination (Wade et al., 2000), especially when there are no evidences of the shell geometry, but the results of the photoionization models described in section 8 corroborate an approximately spherical shell rather than a prolate one. The dust distribution observed in NIRC2 images, with bright polar emission in 2016, also indicates that the matter is not expanding faster in the poles, otherwise we would expect to have a lower grain density in these regions.
Assuming a spherical expansion, the radial velocities are given by the projections of the expansion velocity in different angles. Therefore, we measured the radial velocities of the polar caps for four emission lines in all epochs (Table 1), obtaining a mean value of radial velocity v 16 km s-1. The values in the table correspond to the highest value of Doppler displacement measured in the blueshift and redshift peaks of the lines, and the error corresponds to the standard deviation of the measurements. We considered a uniform expansion velocity for all of our observations, with temporal variations attributed to instrumental uncertainties rather than to acceleration and deceleration of the gas. We repeated the analysis for the equatorial component (Table 2), with the highest velocity from the single peaked component of the lines, for which we estimated v 14 km s-1. These values lead to an inclination angle of and an expansion velocity of 18 km s-1. This velocity is slightly higher than the expansion velocity of km s-1 assumed by Banerjee et al. (2016) by measuring the HWHM of Br line in a 2015 1D spectrum.
Correcting the projection effect for the expansion rate measured for the angular diameter, we obtained a radial expansion rate of arcsec year-1. By combining the expansion velocity and the expansion rate, we derived a distance of 0.4 kpc. Gehrz et al. (2018) found the same distance value of kpc from MMRD relation, while Banerjee et al. (2016) estimated a distance of kpc assuming a blackbody angular diameter and the previously cited expansion velocity. Gordon et al. (2021) found a larger value for the distance of kpc using their extinction estimates allied to a 3D Galactic reddening map (Chen et al., 2019), with the uncertainty in the 3D dust distribution being the likely source of the discrepancy. By the date of this writing, there were no Gaia data available for this object.
6 Hydrogen density map
Once we assumed a spherical expansion and estimated the distance, we were able to convert the spectral axis into a third position axis, building a 3D hydrogen emission map from the Br data cube. We considered ionization equilibrium recombination (Osterbrock & Ferland, 2006) in order to convert the line emission map into a density distribution, assuming optically thin lines. The result for August 13 2017, the latest date of OSIRIS data, is displayed in Figure 9, with two views of the 3D shell. The resulting density map is converted into a spherical grid, with 70 radial steps, 9 polar angle steps and a maximum of 8 azimuthal angle steps.
It is important to stress that the observed geometry of the shell from imaging is usually assumed to correspond directly to the gas distribution, but distinct processes generate distinct emissivity functions of density. For the recombination process of hydrogen, for instance, the emissivity scales approximately with the squared density, which explains the differences between our density grid and the hydrogen images. Another caveat is that the neutral gas is neglected, which can affect the mass estimates especially in the presence of clumps.
7 Abundances
The NIR spectra of V5668 Sgr exhibit numerous bright He i emission lines, which are especially important for constraining the photoionization models in the presence of H i recombination. The theoretical recombination flux ratio between He i 2.058 µm and Br (Hummer & Storey, 1987) was used to infer the He abundance because other He i and He ii lines seem blended. This procedure was applied to all Keck-OSIRIS line fluxes and also to the NIR spectra fluxes published by Gehrz et al. (2018). We noticed a decrease in this flux ratio with time, suggesting the presence of significant neutral He in the later phases. Therefore we adopted the highest (and earlier in time) flux ratio, that lead us to nn. This is a high He abundance for a nova (Gehrz et al. 1998; while even more extreme values are found in the literature, Schwarz et al. 2001), suggesting the presence of a He-rich companion.
As mentioned above, V5668 Sgr presented measurable 7Be in the early spectra. 7Be is produced during the thermonuclear runaway, in the reaction 3He(,)7Be, and decays through electron capture into 7Li after a period of 53.2 days (Audi et al., 2003). Molaro et al. (2016) derived N(7Be)/N(Ca) , which leads to N(Li) N(Li)☉, while Tajitsu et al. (2016) found a lower abundance ratio of N(7Be ii)/N(Ca ii) , or X(7Be)/X(Ca) . However, recent discussions about the calculation of 7Be abundance through absorption lines indicate that these values may be overestimated (Chugai & Kudryashov, 2020). We adopted the ratio of N(7Be ii)/N(Ca ii) as an upper limit, although our spectra do not show any Li emission lines in order to directly evaluate this abundance.
The carbon abundance was set assuming that most of the carbon dust estimated by Gehrz et al. (2018) was completely depleted by the time of our models, which could be slightly overestimated since we still observe dust in 2017 NIRC2 images. On the other hand, considering that the gas carbon abundance is expected to be higher than the grains’ abundance, our estimate is probably a lower limit. For N and O abundances, average C, N and O for novae were used to calculate the N/C and O/C ratios. These values were scaled with the estimated carbon abundance, leading to log(nn, log(nn and log(nn. The resulting O/C ratio is lower than 1, which is compatible with the formation of amorphous carbon dust (Gehrz et al., 2018). All the other metal abundances including Ne were set as solar values (Asplund et al., 2009).
8 rainy3d photoionization models
The photoionization models were performed with the code rainy3d (Moraes & Diaz, 2011), which runs cloudy (Ferland et al., 2013) as a subroutine. rainy3d is capable of describing the local and integrated spectrum for an arbitrary mass distribution with the approximation of radial radiative transfer. The parallelized calculations presented here were performed at the Santos Dumont 5 petaflop supercomputer facility. We used HST data from July 2017 and OSIRIS data from August 2017 for the modelling, in order to combine the optical and NIR information of the same epoch, considering that the central source would not have significantly cooled down in one month. The main input parameters are described in Table 3. We varied the physical properties of the central source, namely the temperature and luminosity, over the extended value ranges found in classical novae. Unfortunately, there are no contemporary data in X-rays or EUV for constraining the ionizing source properties at the time. We have adopted the Rauch NLTE hot high-gravity stellar atmosphere grid (Rauch, 2003) for the central source SED.
The shell mass was varied around the recombination mass estimated from the integrated hydrogen density grid. Although that was varied, we fixed the density gradient as the one described in section 6. We sampled the shell mass in 7 steps within the interval of to M☉, the central source temperature in 7 steps within the range of 80,000 to 210,000 K, and the central source luminosity in 5 steps from to erg s-1.
| Distance (pc) | |
|---|---|
| E(B-V) | |
| TemperatureCS (K) | |
| LuminosityCS (erg s-1) | |
| Massshell (M☉) | |
| rin (cm) | |
| rout (cm) |
A list of observed emission lines fluxes are compared with the integrated fluxes obtained from the models. We also included emission lines typically observed in the NIR region of nova spectra but not observed in our Keck-OSIRIS data in order to constrain our models. The values are displayed in Table 4. The NIR lines fluxes presented as upper limits are either lines that are not observed or lines possibly blended with unidentified transitions. Based on the HST filter widths and the expansion velocity, we estimated that the F657N total flux would be an upper limit for the combination of H, [N ii] 6548.05 Å 6583.45 Å and He ii 6559.91 Å fluxes. On the other hand, the integrated flux from F502N HST image should be dominated only by the [O iii] 5006.84 Å flux.
| [N ii] 6548.05 Å + He ii 6559.91 Å | |
|---|---|
| + H 6562.81 Å + [N ii] 6583.45 Å | |
| [O iii] 5006.84 Å | |
| [Si vi] 1.96247 µm | |
| He ii 2.03725 µm | |
| He i 2.05813 µm | |
| He i 2.11303 µm | |
| Br 2.16551 µm | |
| He ii 2.18843 µm | |
| [Ca viii] 2.32117 µm | |
| He ii 2.34631 µm |
In order to analyse how an anisotropic ionizing field would influence the observed morphologies, we also performed models with an accretion disc. The geometrically thin, optically thick, multi-temperature standard disc (Frank et al., 2002) was aligned to the equatorial region in a this model grid. A very simplistic model of the disc is considered. For instance, it does not consider scattering of photons from the central source, limb darkening effects and the disc flare. In our estimates for the disc luminosity and SED, we have assumed a white dwarf mass of 1.1 M☉ (Gehrz et al., 2018), which has a linear effect in the disc luminosity and temperature, and we varied the mass transfer rate in a wide interval from to M☉ year-1. We also varied the spherical central source luminosity from to erg s-1, but we fixed the other physical and chemical parameters of the shell to the best-fitting values from previous models.
9 Results and discussion
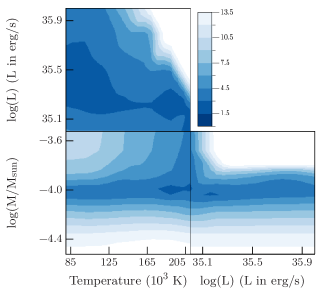
The emission line fluxes predicted by our model grid with isotropic ionization are shown in Figure 10, as contour maps of weighted and reduced as functions of the shell mass and central source luminosity and temperature. The minimum values, related to the dark-colored regions, point towards a best-fitting solution with T=188,000 K, L=1.6 erg s-1 and M=6.3 M☉. Assuming the valley widths around minimum values as upper limits for the uncertainties, we obtain uncertainties of erg/s for the luminosity and K for the temperature of the central source. We note that the shell mass has more influence in the results than the central source parameters. The estimated shell mass is compatible with other values previously obtained by other authors using different data and methods, such as M=2.4 M☉ (Gehrz et al., 2018) and M= M☉ (Banerjee et al., 2016). The derived central source luminosity is compatible with the luminosity of a hot pseudo-photosphere on a white dwarf with 1.1 M☉, as was also found by Gehrz et al. (2018).
In our best-fitting model, all line fluxes and line flux upper limits are compatible within a 30 per cent uncertainty in absolute fluxes, with the exception of Br and [Si vi]. The modelled Br and [Si vi] fluxes are a factor of 5 and 2.5 below the observed fluxes respectively. The direct increase in the ionization level would brighten the non-detected [Ca viii] line, and as we already varied the shell mass, one could suggest that the chosen abundances may be wrong. In fact, when we slightly change the Si abundance from the solar value of log(nSi/nH) =-4.49 to log(nSi/nH) =-4.2, the [Si vi] model flux becomes compatible with the observed one. The increase of Br flux can also be achieved by lowering the He abundance relative to H in the shell, which increases the H mass fraction. When we lowered the He abundance to log(nHe/nH) =-0.7, maintaining the modelled He i and He ii line fluxes compatible with the observations, we were able to obtain a higher Br flux of , which is a better fit but still lower than the observed flux of erg s-1 cm-2. The exact carbon and oxygen abundances are also unknown and can affect the model’s results. As described in section 7, we used a carbon abundance corresponding to the estimate of the maximum carbon dust mass produced in the ejecta (Gehrz et al., 2018). The increase of this abundance would favour the cooling processes of the gas, and would not contribute to the increase of H or Si fluxes in the models.
Although we obtained a reasonable fitting of total emitted fluxes in these models, we could not achieve the difference in the morphology displayed by [Si vi] and Br lines. For both lines, the 3D models show the equatorial region more prominent than the polar caps (see Figures 11 and 12). For Br emissivity map, we note that the shell is slightly asymmetric, with the lower half brighter than the upper half. For [Si vi] however, the modelled morphology is not compatible with the observation. These results indicate that the density gradient is not enough to explain the distinct structures in the nova shell.
In our models with anisotropic ionization generated by an accretion disc, we analysed the different morphologies produced by all luminosity weighted combinations for the ionizing source. We found that the bipolar aspect of [Si vi] only starts to appear in the models where the accretion disc is more luminous than the central component, and it is best observed for the models with Ṁ= M☉ year-1 (Figure 13). However, an accretion disc with such a high mass transfer rate is hot and possibly thick at outer borders, resembling the discs obscuring the direct view of the white dwarf in some persistent and post-nova supersoft sources (Ness et al., 2012, 2013; Sokolovsky et al., 2021). Probably, its precise SED and vertical structure, and thus its effect on the shell ionization can not be predicted with our simplified standard disc assumptions (Frank et al., 2002). We would expect this disc to produce an enhanced anisotropy in the ionizing field due to its shape, significantly lowering the ionization parameter in the shell equatorial region. This effect was already observed in nova V723 Cas (Lyke & Campbell, 2009), in which the [Al ix] line, exclusively polar, strengthens later in the shell development, perhaps as the disc reforms and hard UV is directed to the poles. Studies of novae, dwarf novae and supersoft sources show that accretion discs either survive the nova event or reform quickly, in timescales as short as 30 days (Starrfield et al., 2004; Retter et al., 1997; Hernanz & Sala, 2002).
The structures of the ionized shell observed in the lower luminosity models were not only incompatible with the highly ionized polar caps, but were also similar to an oblate spheroid since the ionization parameter rapidly decays with the distance to the gas.
A reestablished luminous accretion disc has been considered as part of the ionizing source in other novae, such as V723 Cas (Takeda et al., 2018) and HR Del (Moraes & Diaz, 2009). In the case of V723 Cas the disc was found to be crucial in describing the observed ionization structure of the shell.
Alternatively to the presence of a disc, one could also try to explain the different geometries observed for the different transitions in Keck data with a non-uniform distribution of chemical elements within the shell. However, due to the mixing and convection processes during the eruption, this scenario seems unlikely to occur.
The three-dimensional analysis of nova remnants highlights the difficulties in interpreting the observed structures in the shell. The influences of mass distribution, abundance gradient and ionizing field in the geometry of the ionized gas are not fully understood, nor are the processes responsible for them. The combination of the eruption process, shocks, winds and interaction with pre-existing circumstellar gas could explain a large variety of shell structures that could be studied using 3D hydrodynamic simulations.
In the case of V5668 Sgr as a nova that had detected gamma-ray emission in the early phase of eruption, the analysis of the shock is especially important for the understanding of the gas dynamics and the shell structure. The amplification of magnetic fields in internal (Chomiuk et al., 2014) or external shocks (Abdo et al., 2010) is the currently accepted mechanism for explaining non-thermal radio emission from novae. Its observed fast variability and flaring phenomena (Nyamai et al., 2021) suggests rapidly changing of shear velocities and/or density contrasts in the shocking flow, leading to a complex anisotropic emission scenario. A relation of such variability in synchrotron emission and peculiar clump velocities inside the shell has yet to be found. Precise synoptic astrometry of condensations combined with high resolution 2D spectroscopy may be able to address the formation of shocks associated with runaway clumps. On the other hand, secondary eruptions and the pre-existing circumbinary gas distribution are also correlated with the non-thermal temporal behaviour.
10 Conclusions
We present HST optical images and Keck-OSIRIS and Keck-NIRC2 NIR data from the evolved remnant of nova V5668 Sgr. The IFS data permitted the estimate of a parallax distance of 1200 400 pc, assuming an isotropic expansion velocity that lead to v=590 km s-1 and a system inclination angle of 24.
The observed gas structures in all data are different depending on the ionization of the emission line. For the highly ionized transitions, the shell presents enhanced polar caps, while for the lower ionization lines the shell also presents strong equatorial emission. Our photoionization models suggest that this anisotropy of the ionizing field may be due to the presence of a luminous reestablished accretion disc. The dust distribution follows the gas distribution between 2016 and 2017, with black-body temperatures close to K. We could not detect dust emission in 2019.
Our best-fitting models for August of 2017 indicate that the central source has a temperature of K and a luminosity of erg s-1, and that the shell has a total ejected mass of M☉. Even though we were able to reproduce the observed integrated line fluxes, we could not obtain the observed shell structures, possibly due to the limitations of our accretion disc modelling.
Acknowledgements
We thank São Paulo Research Foundation (FAPESP) for the support under grant 2019/08341-8 and CNPq funding under grant #305657. J.D.L. was supported in part by grant HST-GO-14787.010-A. We also acknowledge with thanks the variable star observations from the AAVSO International Database contributed by observers worldwide and used in this research. The authors acknowledge the National Laboratory for Scientific Computing (LNCC/MCTI, Brazil) for providing HPC resources of the SDumont supercomputer, which have contributed to the research results reported within this paper. URL: http://sdumont.lncc.br
This research is based, in part, on observations made with the NASA/ESA Hubble Space Telescope obtained from the Space Telescope Science Institute, which is operated by the Association of Universities for Research in Astronomy, Inc., under NASA contract NAS 5-26555. These observations are associated with program 14787.
This publication makes use of data products from the Two Micron All Sky Survey, which is a joint project of the University of Massachusetts and the Infrared Processing and Analysis Center/California Institute of Technology, funded by the National Aeronautics and Space Administration and the National Science Foundation.
Some of the data presented herein were obtained at the W. M. Keck Observatory, which is operated as a scientific partnership among the California Institute of Technology, the University of California and the National Aeronautics and Space Administration. The Observatory was made possible by the generous financial support of the W. M. Keck Foundation.
The authors wish to recognize and acknowledge the very significant cultural role and reverence that the summit of Maunakea has always had within the indigenous Hawaiian community. We are most fortunate to have the opportunity to conduct observations from this mountain.
The work of K.V.S. was supported by the National Science Foundation under Grant No. AST-1751874 and NASA grants NASA/NuSTAR 80NSSC21K0277, NASA/Fermi 80NSSC20K1535, and NASA/Swift 80NSSC21K0173 and from a Cottrell Scholarship from the Research Corporation. We acknowledge support from the Packard Foundation.
We would like to thank the reviewer, whose comments and suggestions were important to improve our manuscript. We would also like to acknowledge V. A. R. M. Ribeiro for his useful contributions to the discussion of the results.
Data Availability
The NIR data underlying this article are available in Keck Observatory Archive (KOA) at https://koa.ipac.caltech.edu/, and can be accessed with program IDs K386, K253, K281OL, K214N2L. The HST optical data are available in MAST at https://mast.stsci.edu/search/hst/ui/#/, and can be accessed with the proposal ID 14787.
References
- Abdo et al. (2010) Abdo A. A., et al., 2010, Science, 329, 817
- Asplund et al. (2009) Asplund M., Grevesse N., Sauval A. J., Scott P., 2009, ARA&A, 47, 481
- Audi et al. (2003) Audi G., Bersillon O., Blachot J., Wapstra A. H., 2003, Nuclear Phys. A, 729, 3
- Aydi et al. (2020) Aydi E., et al., 2020, ApJ, 905, 62
- Banerjee et al. (2016) Banerjee D. P. K., Srivastava M. K., Ashok N. M., Venkataraman V., 2016, MNRAS, 455, L109
- Bode & Evans (2008) Bode M., Evans A., 2008, Classical Novae. Cambridge Astrophysics, Cambridge University Press
- Chen et al. (2019) Chen B. Q., et al., 2019, MNRAS, 483, 4277
- Cheung et al. (2016) Cheung C. C., et al., 2016, ApJ, 826, 142
- Chomiuk et al. (2014) Chomiuk L., et al., 2014, Nature, 514, 339
- Chugai & Kudryashov (2020) Chugai N. N., Kudryashov A. D., 2020, Astronomy Letters, 46, 92
- Cutri et al. (2003) Cutri R. M., et al., 2003, VizieR Online Data Catalog, p. II/246
- Diaz et al. (2018) Diaz M. P., Abraham Z., Ribeiro V. A. R. M., Beaklini P. P. B., Takeda L., 2018, MNRAS, 480, L54
- Evans et al. (1992) Evans A., Bode M. F., Duerbeck H. W., Seitter W. C., 1992, MNRAS, 258, 7P
- Ferland et al. (2013) Ferland G. J., et al., 2013, Rev. Mex. Astron. Astrofis., 49, 137
- Frank et al. (2002) Frank J., King A., Raine D., et al., 2002, Accretion power in astrophysics. Cambridge university press
- Gehrz et al. (1998) Gehrz R. D., Truran J. W., Williams R. E., Starrfield S., 1998, PASP, 110, 3
- Gehrz et al. (2018) Gehrz R. D., et al., 2018, ApJ, 858, 78
- Gordon et al. (2021) Gordon A. C., Aydi E., Page K. L., Li K.-L., Chomiuk L., Sokolovsky K. V., Mukai K., Seitz J., 2021, ApJ, 910, 134
- Hernanz & Sala (2002) Hernanz M., Sala G., 2002, Science, 298, 393
- Hummer & Storey (1987) Hummer D. G., Storey P. J., 1987, MNRAS, 224, 801
- Izzo et al. (2015) Izzo L., et al., 2015, ApJ, 808, L14
- José et al. (1997) José J., Hernanz M., Coc A., 1997, ApJ, 479, L55
- Kramida et al. (2020) Kramida A., Yu. Ralchenko Reader J., and NIST ASD Team 2020, NIST Atomic Spectra Database (ver. 5.8), [Online]. Available: https://physics.nist.gov/asd [2021, May 3]. National Institute of Standards and Technology, Gaithersburg, MD.
- Kuin et al. (2015) Kuin P., Page K., Osborne J., Shore S., Schwarz G., Walter F., 2015, The Astronomer’s Telegram, 8275, 1
- Li et al. (2017) Li K.-L., et al., 2017, Nature Astronomy, 1, 697
- Lyke & Campbell (2009) Lyke J. E., Campbell R. D., 2009, AJ, 138, 1090
- Molaro et al. (2016) Molaro P., Izzo L., Mason E., Bonifacio P., Della Valle M., 2016, MNRAS, 463, L117
- Moraes & Diaz (2009) Moraes M., Diaz M., 2009, AJ, 138, 1541
- Moraes & Diaz (2011) Moraes M., Diaz M., 2011, PASP, 123, 844
- Ness et al. (2012) Ness J. U., et al., 2012, ApJ, 745, 43
- Ness et al. (2013) Ness J. U., et al., 2013, A&A, 559, A50
- Nomoto & Kondo (1991) Nomoto K., Kondo Y., 1991, ApJ, 367, L19
- Nyamai et al. (2021) Nyamai M. M., Chomiuk L., Ribeiro V. A. R. M., Woudt P. A., Strader J., Sokolovsky K. V., 2021, MNRAS, 501, 1394
- Osterbrock & Ferland (2006) Osterbrock D., Ferland G., 2006, Astrophysics Of Gas Nebulae and Active Galactic Nuclei. University Science Books
- Rauch (2003) Rauch T., 2003, A&A, 403, 709
- Retter et al. (1997) Retter A., Leibowitz E. M., Ofek E. O., 1997, MNRAS, 286, 745
- Ribeiro et al. (2009) Ribeiro V. A. R. M., Bode M. F., Darnley M. J., Harman 2009, ApJ, 703, 1955
- Schlafly & Finkbeiner (2011) Schlafly E. F., Finkbeiner D. P., 2011, ApJ, 737, 103
- Schwarz et al. (2001) Schwarz G. J., Shore S. N., Starrfield S., Hauschildt P. H., Della Valle M., Baron E., 2001, MNRAS, 320, 103
- Seach (2015) Seach J., 2015, Central Bureau Electronic Telegrams,4080
- Sokolovsky et al. (2021) Sokolovsky K. V., et al., 2021, arXiv e-prints, p. arXiv:2108.03241
- Starrfield et al. (1972) Starrfield S., Truran J. W., Sparks W. M., Kutter G. S., 1972, ApJ, 176, 169
- Starrfield et al. (2004) Starrfield S., Timmes F. X., Hix W. R., Sion E. M., Sparks W. M., Dwyer S. J., 2004, ApJ, 612, L53
- Starrfield et al. (2016) Starrfield S., Iliadis C., Hix W. R., 2016, PASP, 128, 051001
- Steinberg & Metzger (2020) Steinberg E., Metzger B. D., 2020, MNRAS, 491, 4232
- Tajitsu et al. (2016) Tajitsu A., Sadakane K., Naito H., Arai A., Kawakita H., Aoki W., 2016, ApJ, 818, 191
- Takeda et al. (2018) Takeda L., Diaz M., Campbell R., Lyke J., 2018, MNRAS, 473, 355
- Wade et al. (2000) Wade R. A., Harlow J. J. B., Ciardullo R., 2000, PASP, 112, 614
- Woodward et al. (2017) Woodward C. E., Wagner R. M., Starrfield S., 2017, The Astronomer’s Telegram, 10557, 1