Rate Distortion Theory for Descriptive Statistics
Abstract
Rate distortion theory was developed for optimizing lossy compression of data, but it also has a lot of applications in statistics. In this paper we will see how rate distortion theory can be used to analyze a complicated data set involving orientations of early Islamic mosques. The analysis involves testing, identification of outliers, choice of compression rate, calculation of optimal reconstruction points, and assigning “descriptive confidence regions” to the reconstruction points. In this paper the focus will be on the methods, so the integrity of the data set and the interpretation of the results will not be discussed.
I Introduction
Rate distortion theory was introduced by Shannon as a tool for lossy compression. His goal was to compress an information source to a rate that could be sent through a communication channel with limited capacity. Applications of ideas from rate distortion theory for testing Goodness-of-Fit was studied in [1, 2]. The purpose of the present paper is to demonstrate that rate distortion theory can be used to solve a variety of statistical problems. The advantage of these methods is that they are descriptive in nature, which implies that we only need to make minimal assumptions about how the data were generated.
To illustrate our method we have analyzed data on the orientation of early mosques. A database with information on the orientation of 160 early mosques has been compiled by D. Gibson [3]. In this paper we will not discuss the integrity of the data in the database except that we have excluded the ancient mosque in Aqaba where it is unclear which wall was the qibla wall.
The data is analyzed using rate distortion theory and the calculations are done with the R program. There was a rate distortion package for the R program [4], but that package was not maintained. In addition we need extra features for the type of analysis explained in the present paper. For this reason we have developed a new package for R version 4.1.2 for solving rate distortion problems. The software is developed as a general purpose package and incorporates the Blahut-Arimoto algorithm and the package is still in development but the present version is available online [5]. When fully developed and documented the package will be uploaded to CRAN. The specific data set has been analyzed using a R worksheet that can also be downloaded [6].
II Historical background
According to the Islamic traditions Islam was founded in 622 CE, but the history of early Islam was only written down several hundred years later. According to these traditions the Muslims were praying facing Jerusalem until Prophet Muhammad in 624 CE received a revelation commanding him to face towards the Sacred Mosque (Mashid al-Ḥarām). Now-a-days Muslims pray facing Mecca in Saudi Arabia where Mashid al-Ḥarām is located. Inside the Sacred Mosque there is a building called the Ka’ba, which is at the center of the spiritual life of the Muslims.
The Qur’an (Q2:143-144) states that the direction of prayer (qibla) should be towards Mashid al-Ḥarām, but it is not mention where Mashid al-Ḥarām is located. The Ka’ba is mentioned as a destiny of pilgrimage, but it is not mentioned that the Ka’ba is within Mashid al-Ḥarām. Around 700 CE the Christian author Jacob of Edessa wrote that the Arabs pray towards the Ka’ba, but it does not describe where the Ka’ba was located. Instead the text explains that the Arabs in Egypt face east, and the Arabs in Kufa pray facing west [7, 8]. This does not fit with a Ka’ba in Mecca, but it is known that there were a number of ka’bas at different locations in the Arabia [9, 10, p. 24].
Early Muslim scholars were aware that many of the oldest mosques did not face Mecca in Saudi Arabia. One theory is that the early Muslims did not know the exact direction towards Mecca. Given their ability to navigate through the desert this is seems less likely [11]. There are a lot of indications that Islam has its origin in north western Arabia rather that in the area around Mecca [12, 13], and the earliest reference to Mecca outside the Qur’an dates as late as 743 CE [14]. There is even an old theory that Petra in Jordan was the birthplace of Prophet Muhammad rather than Mecca [15].
We will use orientations of old mosques to provide information on the qiblas used during the formative years of Islam. Typically a mosque has a long qibla wall with a mihrab (prayer niche) in the middle. Muslims face the mihrab and qibla wall when praying. Many early mosques have a qibla that appears to be inconsistent with a direction facing Mecca in Saudi Arabia.
The Islamic traditions were written during the Abbassid dynasty and before that dynasty came into power there had been several civil wars. In the written accounts the authors openly admit that they have been selective in their choice of narrative. Since the written accounts are late and biased towards the ruling Abbasids it is very difficult to judge which parts of these accounts are historically sound. Here we will restrict our attention to the period before the Abbasid revolution in year 750 CE where this Abbasid dynasty came into power. We will subdivide the period in an early period from 622CE to the reforms of the Umayyad Caliph ’Abd al-Malik around 700 CE and a late period from 700 CE to the Abbaside revolution in 750 CE.
III Distortion
In this paper qibla is a theory that assigns a certain bearing to each possible location of a mosque. We will compare the qibla bearing with the measured orientation of an ancient site. Both the qibla bearing and the orientation can be given as a number of degrees measured clockwise from geographical north. Normally the orientation will deviate from the qibla bearing that was intended by the people who built the mosque. Four main reasons for this are:
-
1.
The architect may not have been able to determine the qibla bearing exactly.
-
2.
Local obstacles or other practical problems may have influenced the orientation of the site.
-
3.
The original structure may now be a ruin or it has been rebuilt so that the original orientation is difficult to determine.
-
4.
Sometimes it is difficult to measure the orientation as discussed in [11].
We have to quantify how much the orientation deviates from the qibla bearing of the site. As distortion measure we use
This is the standard method for measuring distortion (also called dispersion) in directional statistics [16, Sec. 2.3]. Circular variance can be translated to circular standard deviation using
The distribution with specified mean direction and specified circular standard deviation that maximize entropy is a von Mises distribution [17]. Thus, using to calculate distortion correspond to using the von Mises distributions as our basic error model.
IV Calculation of the rate distortion function
As source alphabet we use the sites given by their geographical coordinates and their bearing. As reconstruction points we use points given by their coordinates. The distortion of a site and a point is given by of the difference between the orientation of the site and bearing from the site to the reconstruction point. We note that the source alphabet is discrete but the reconstruction alphabet is continuous. we run the following algorithm in order to calculate the rate distortion function.
-
1.
We create a number of random probability vectors over the source alphabet. These probability vectors are chosen according to a Dirichlet distribution.
-
2.
For each probability vector over the source alphabet the optimal reconstruction point for these weights is calculated using the Nelder Mead algorithm.
- 3.
-
4.
If one of the reconstruction points has probability close to zero, it is removed.
-
5.
If the conditional distributions of source points given two different reconstruction points are close together then one of the reconstruction points is removed.
-
6.
For each reconstruction point we replace the reconstruction point by a new reconstruction point that is optimal with respect to the joint distribution, and go back to to step 3.
The algorithm stops when running 3. to 6. gives an improvement of the rate below a certain threshold. The Blahut Arimoto algorithm is iterated until the improvement is below a threshold that is 1/10 of the threshold used as stopping rule for iterating 3. to 6.
V Test of great circles vs. rhumb lines
D. Gibson has compared the orientations of the mosques with the geodesic directions [11], but he has been criticized that calculations of great circles was not developed in the formative years of Islam [20, 21]. A method called the Indian Circle is described in old documents and corresponds to determination of bearings along rhumb lines [22]. Calculations based on great circles involve trigonometric formulas and astronomical observation that were developed by Muslim scholars later than the period that is the focus of this paper, but in principle a bearing may be determined by other means than calculations. Using bearings based on rhumb lines has the advantage that mosques that have the same orientation can be represented by a very distant reconstruction point.
The question is whether we should base the subsequent calculations on bearings calculated along great circles taking the curvature of earth into account or whether we should calculate bearings along rhumb lines corresponding to a flat earth. Formally, a statistical test is a binary decision based on data, so we should test great circles versus rhumb lines. Our decision criteria is simple: we choose the model that gives the best compression.
On Figure 1 we compare the rate distortion curve when the bearings are based on great circles with the rate distortion curve based on bearings along rhumb lines. For the great circle distortion we have plotted a lower bound based on the tangents to the rate distortion curve. For the distortion based on the rhumb lines we have plotted an upper bound by plotting the cords between achievable rate distortion pairs.
As we see the rhumb line distortion gives smaller values of the distortion than the great circle distortion for rates less than approximately 0.3 nats. For greater rates the two curves are very close together. The reason that two distortion measures are so similar for high rates appear to be that the optimal reconstruction points bifurcate and that the bifurcations tend to blur out the difference between the two distortion measures.
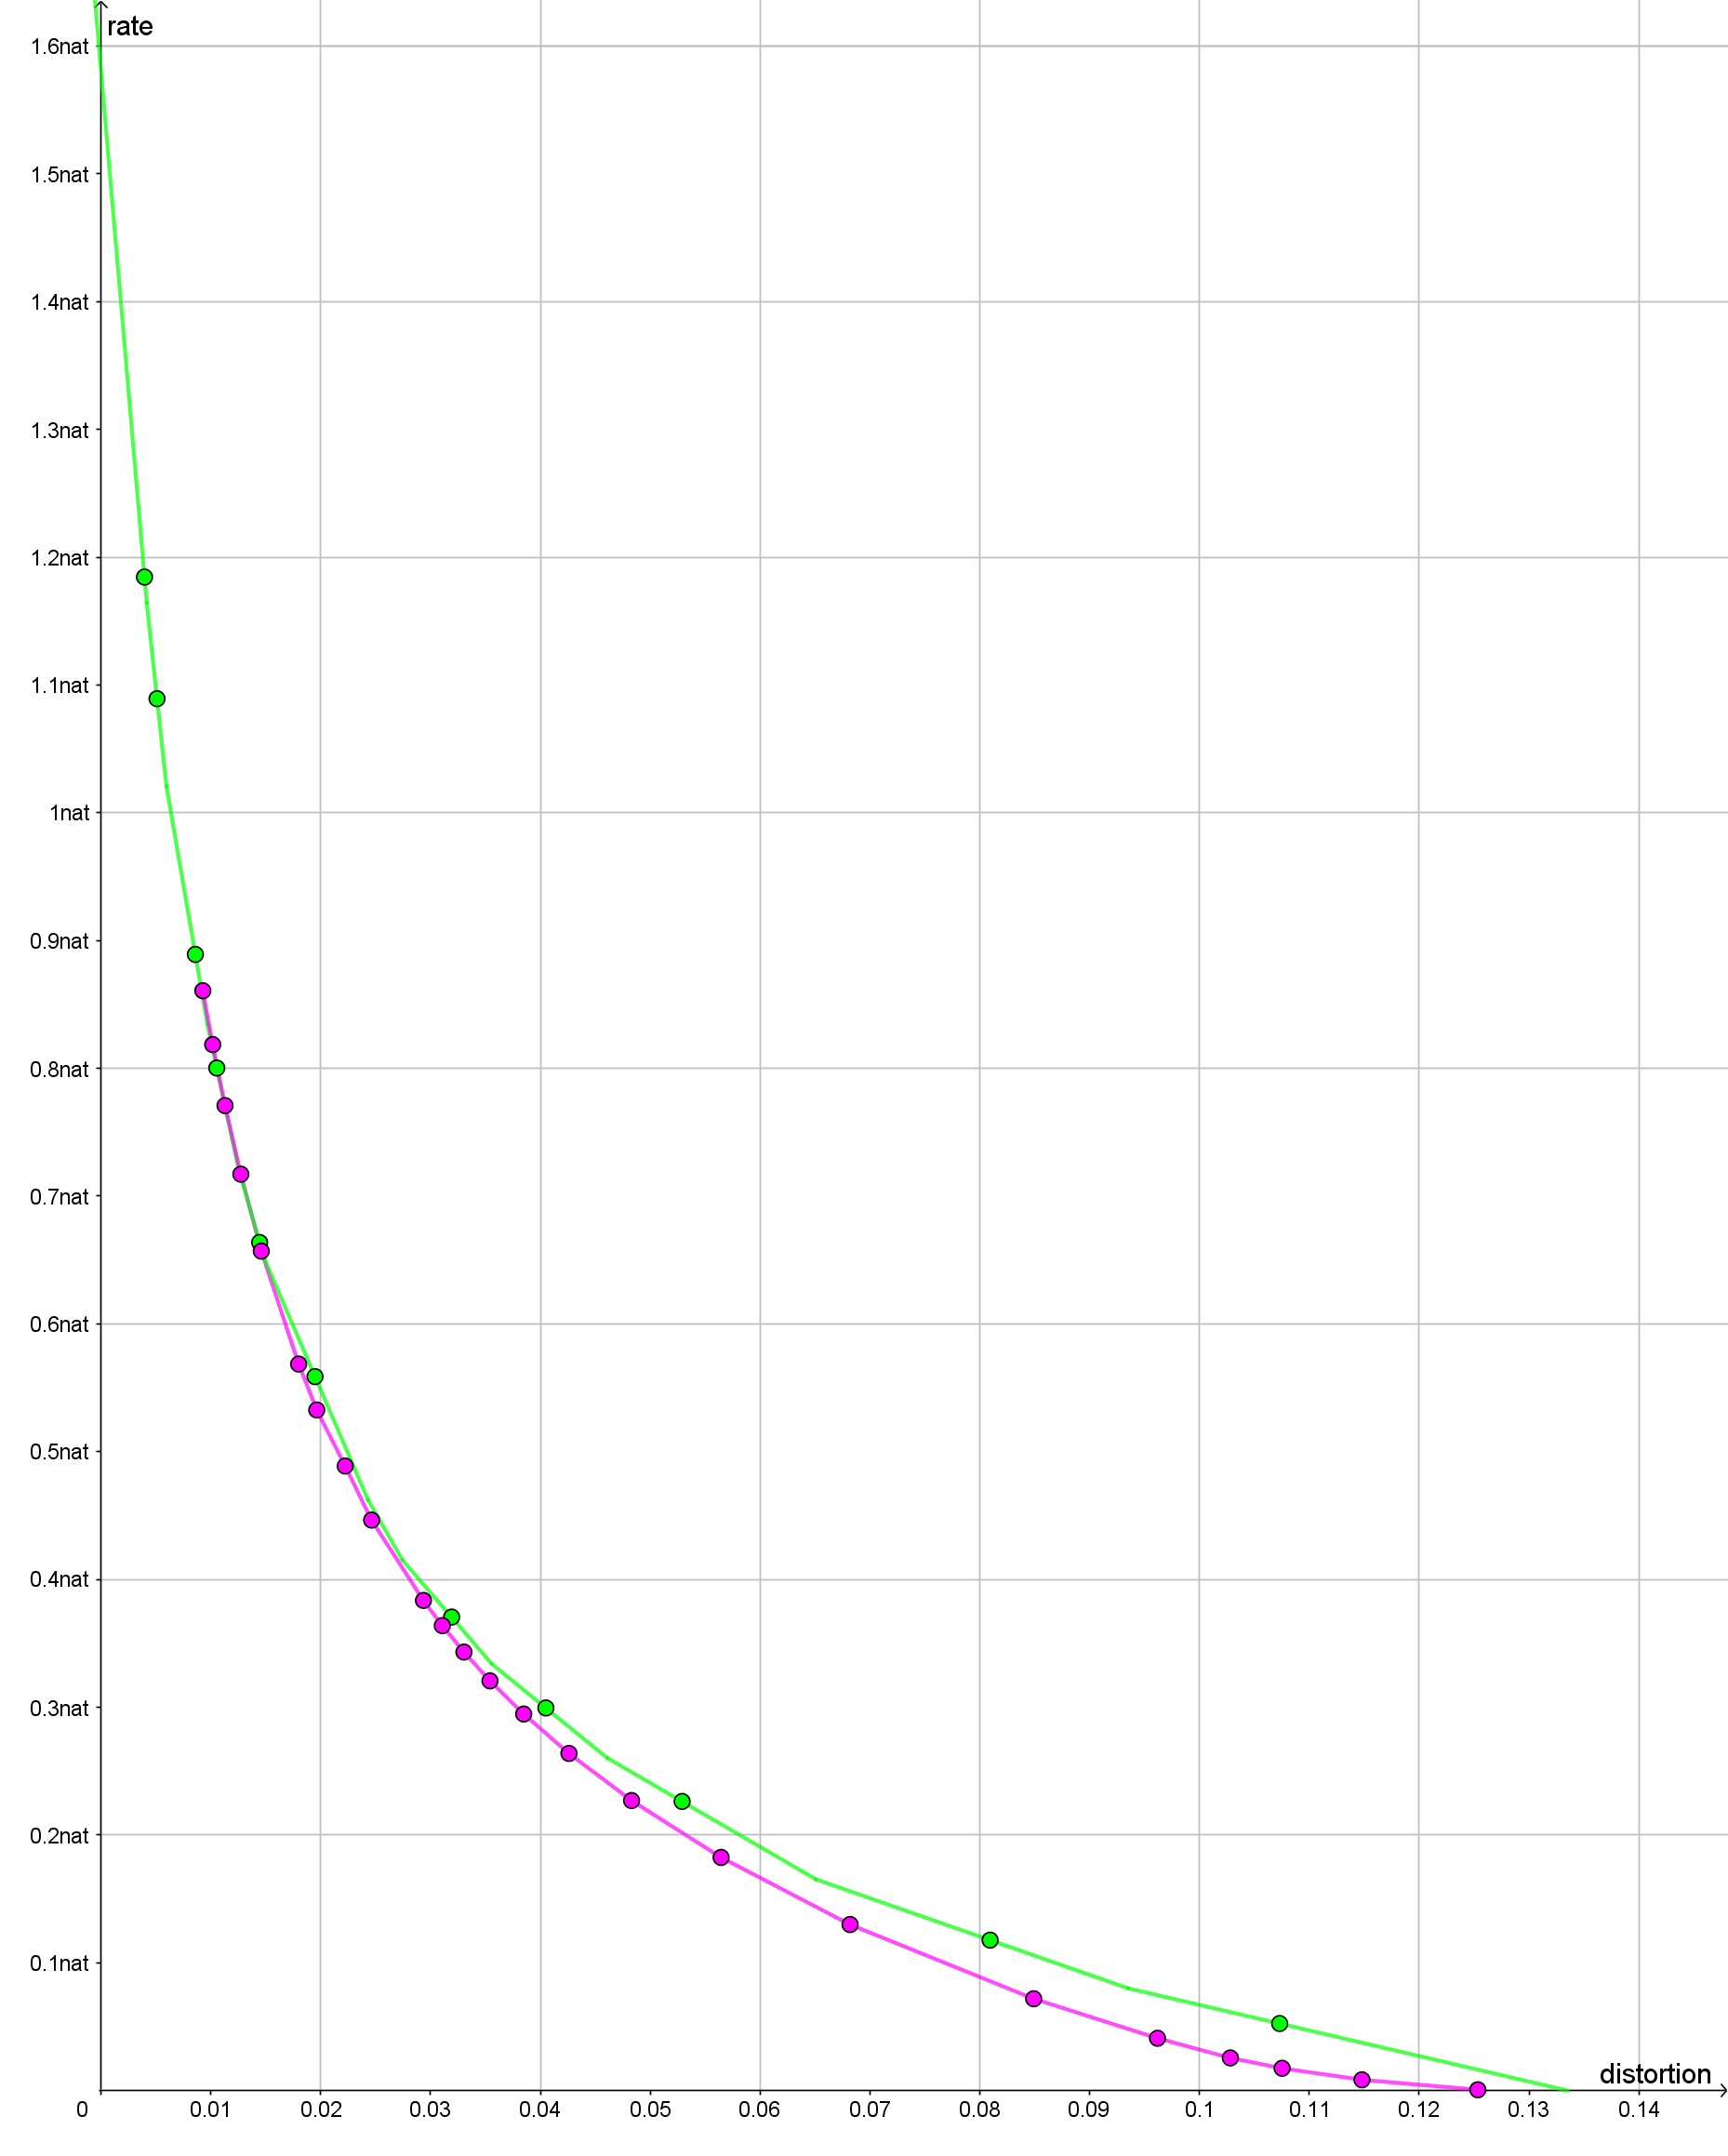
Since the bearings based on rhumb lines give a slightly better fit with data we will use bearings based on rhumb in the rest of this paper.
VI Outlier detection for sites before 700 CE
The rate distortion curve is parametrized by its slope For each slope we get a list of reconstruction points and a joint distribution of sites and reconstruction points. Both the reconstruction points and the joint distribution will depend on the rate, but the individual reconstruction points are quite robust to changes in the rate. If we increase the rate the reconstruction point will split into a large number of reconstruction points each with little weight. If we decrease the rate then reconstruction points will merge together. It requires a little experimentation to find a rate that gives interesting result. Here we will use the slope . Further justification of this value will be given in Section VII.
First we will make a rate distortion analysis on the set of the 20 sites that are dated prior to year 700 CE. If we compress with slope we get a mean distortion of 0.00395 corresponding to a circular standard deviation of At this slope the rate is 0.4840 nats. We get the following reconstruction points.
| Rec. point | Latitude | Longitude | Weight | Distortion |
|---|---|---|---|---|
| Pe | 77.16 % | 0.00446 | ||
| Ma | 15.34 % | 0.00266 | ||
| SG | 7.50 % | 0.00134 |
In order to identify these reconstruction points we make a table of the conditional probabilities of the reconstruction points given the site.
| Site | Pe | Ma | SG |
|---|---|---|---|
| Massawa Mosque | 100.0 | 0.0 | 0.0 |
| Huaisheng Mosque | 86.9 | 0.1 | 13.0 |
| Hama Great Mosque | 91.1 | 8.9 | 0.0 |
| Palmyra Congregational | 92.2 | 7.8 | 0.0 |
| Amr ibn -Al-As | 100.0 | 0.0 | 0.0 |
| Sidi Ghanem | 0.0 | 0.0 | 100.0 |
| Graveyard of Sidi ’Ukba | 0.1 | 58.2 | 41.7 |
| Qasr Humeima | 100.0 | 0.0 | 0.0 |
| Zawailah | 0.0 | 100.0 | 0.0 |
| Dome of the Chain | 100.0 | 0.0 | 0.0 |
| Ka’ba | 100.0 | 0.0 | 0.0 |
| Qasr El-Bai’j | 79.2 | 29.6 | 0.0 |
| Um Jimal Later Castellum | 84.7 | 15.3 | 0.0 |
| Kathisma Church | 100.0 | 0.0 | 0.0 |
| Qasr Mushash | 86.1 | 13.9 | 0.0 |
| Seven Sleepers Mosque | 92.1 | 7.9 | 0.0 |
| Husn Umayyad Mosque | 97.4 | 2.6 | 0.0 |
| Zeila Qiblatain Mosque (Rt) | 100.0 | 0.0 | 0.0 |
| Zeila Qiblatain Mosque (Lft) | 100.0 | 0.0 | 0.0 |
First we observe that the Sidi Ghanem mosque is the only mosque that has a significant contribution to the reconstruction point SG. The mosque has been rebuilt many times and it is not clear which wall was the original qibla wall of this mosque [23]. Compared with the rest of the data set we consider Sidi Ghanem as an outlier and we remove in from the data set.
If the Sidi Ghanem mosque is removed from the data set Graveyard of Sidi ’Ukba will get about 99.9 % probability of reconstruction point Ma and 0.1 % probability of reconstruction point Pe. Thus the reconstruction point Ma essentially only have contributions from the Graveyard of Sidi ’Ukba and the Zawaila Congretional Mosque. The rest of the sites only give marginal contributions to this reconstruction point. These two sites and Sidi Ghanem all lie in Magreb, i.e. North Africa to west of Egypt. Gibson has classified all sites in his database in Magreb as having the “parallel qibla” [11]. Since there are only these three sites in the Magreb from this early period, we can only observe that their qiblas are significantly different from the qiblas from the rest of the sites. Here we will consider these three sites as outliers of the data set, i.e. they are so untypical that we will remove them from the data set and analyze the rest of the data set without them.
VII Determination of rate and reconstruction point
When the outliers have been removed and we use as the value of the slope we get a single reconstruction point with coordinates . The mean distortion for these early sites is 0.00481 corresponding to a circular standard deviation of If the slope is lowered the optimal reconstruction point starts to bifurcate into a number of optimal reconstruction points that are located very close to each other as illustrated in Table III. This is a strong indication that compression with leads to compression of the noise rather than the signal.
| Rec. point | Latitude | Longitude | Weight | Distortion |
|---|---|---|---|---|
| Pe1 | 99.87 % | 0.00481 | ||
| Pe2 | 0.13 % | 0.00498 |
VIII Calculation of a descriptive confidence region
The use of confidence regions is widely used in statistics, but due to the complexity of the data and the model we do not have formulas for calculating such confidence regions. Instead we will use bootstrap techniques as described in [24, Sec. 5.2] to calculate a region that resembles the well-known notion of a confidence region. The interpretation is closely related to the notion of cross validation.
The optimal reconstruction point Pe is obtained by minimizing the mean distortion where each of the 17 sites has weight 1. One may argue that a large congressional mosque should have larger weight than a small rural mosque. If a mosque has two qiblas one may ask if each of the two qiblas should have the same weight as a mosque with a single qibla. One may also ask if a mosque is rebuilt with the same qibla should count as one or two. Finally some may question the dating of some of the mosques. They may argue that some of the mosques should be removed from the data set. One of the main purposes in natural sciences for making controlled experiments is to obtain exchange-ability of the individual results. Exchange-ability implies that all data points should have the same weight. In humanities we often face the problem that data is not collected by controlled experiments. Therefore there is no default reason why all sites should have the same weight. We will examine what happens if we randomly assign weights to the sites before we calculate the optimal reconstruction point.
The random weights are assigned be re-sampling. From the 17 sites we sample 17 sites with replacement. In such a bootstrap sample only about 67 % of the original sites will appear and some of the sites will appear several times such that the sites in the bootstrap sample will have multiplicities that sum to 17. This corresponds to assigning random integer weights to the sites. For this bootstrap sample we find the optimal reconstruction point where the mean distortion is calculated with weights of the sites given by the multiplicity specified by the bootstrap sample. In principle we should go through all possible re-samples. Then we approximate the distribution of reconstruction points by a 2 dimensional Gaussian distribution. Finally we calculate the ellipse that contains 95 % of probability mass of the 2 dimensional Gaussian distribution and this will be our descriptive confidence region.
If the same procedure is used for a binomial distribution one will get the formula for calculation of the z-interval of the success probability.
Instead of going through all ways of re-sampling we just randomly take 10000 re-samples and base our calculations on that. Bootstrap re-sampling is implemented by the bootstrap package in the R program. The resulting descriptive confidence region is depicted in Figure 3. The descriptive confidence region is closely confined around the ancient city of Petra. Inside the region there are no obvious alternative candidates for an early Islamic qibla.
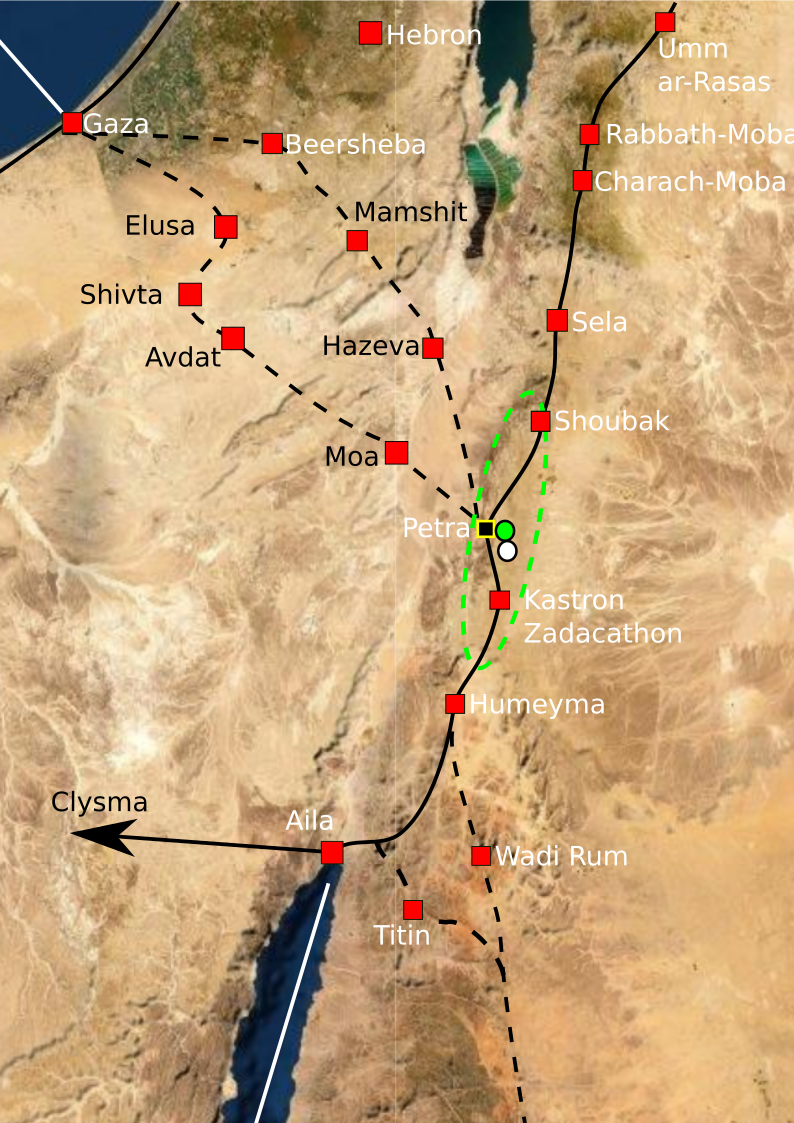
Around 700 CE Jacob of Edessa stated that the mhaggriiye (Arabs) pray towards the Ka’ba. Since the optimal reconstruction point is consistent with the text of Jacob of Edessa, we believe that he refers to the qibla associated with cluster Pe. There must have existed a Ka’ba in the confidence region around the reconstruction point Pe before 700 CE.
As our descriptive confidence method shows the conclusion will not alter if we remove a few of the sites from the data set or if we gave the sites slightly different weights. One problem about this analysis is that it may suffer from selection bias. In this period the mosques do not have mihrabs so the identification of whether a site has a qibla may have been effected by how the building is oriented compared with Petra and Mecca. For this reason we will use the later mosques to cross validate our temporary conclusion that early Muslims outside Magreb used Petra as qibla.
IX Cross validation using later mosques
The analysis of mosques from before 700 CE suggests that the early Muslims were able to determine the qibla with a mean distortion of 0.00481 corresponding to a circular standard deviation of Now we can compress the data involving all sites before 750 CE using the same distortion level. A short summery of the results are as follows:
-
•
All the mosques in the Magreb appear as outliers and are removed from the data set.
-
•
The reconstruction point Pe associated with Petra appear again with approximately the same coordinates and the same confidence region.
-
•
A reconstruction point Je appears with Jerusalem as qibla. Only a single mosque at Qasr Tuba is associated with this qibla with high confidence. A few other mosques could also have had this qibla.
-
•
Two new reconstruction points emerge south and south east of Petra. If the slope is increased to then these two reconstruction points merge into a single reconstruction point that we will label Ru.
One may conjecture that the early Muslims were, for some unknown reason, not able to determine the bearing to the reconstruction point Ru with the same precision as the mosques facing Petra. The result can be seen in Table IV. With this compression the distortion of the reconstruction point Ru is 0.01329 corresponding to a circular standard deviation of The mosques associated with the reconstruction point Ru are approximately the same as the ones that D. Gibson classified as having “the between qibla” [11]. According to Dan Gibson’s theories “the between qibla” was used because of political tensions between the ruling Umayyad dynasty and the Abbas family that would later establish the Abbasid dynasty. According to his theories the mosques that used “the between qibla” used the bisector or median between the bearing to Petra and the bearing to Mecca.
| Rec. point | Latitude | Longitude | Weight | Distortion |
|---|---|---|---|---|
| Je | 2.57 % | 0.00662 | ||
| Pe | 34.01 % | 0.01134 | ||
| Ru | 63.42 % | 0.01329 |
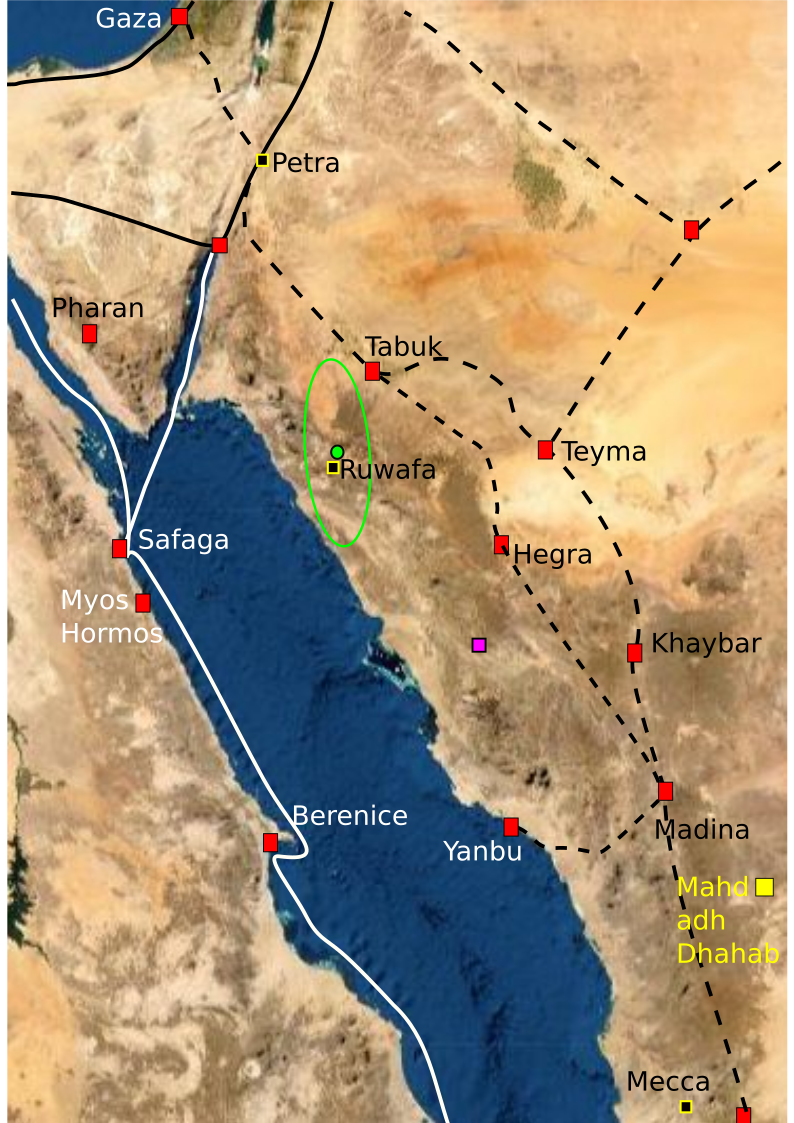
In order to calculate a confidence region for the reconstruction point Ru we fix the reconstruction points for the cluster Pe to Petra and fix the reconstruction point of the cluster Je to the Dome of the Rock in Jerusalem. With these reconstruction points fixed we calculate the optimal reconstruction point of cluster Ru and calculate a confidence region around this point. The confidence region for cluster Ru is illustrated in Figure 4. The confidence region does not contain any ancient settlements and it does not intersect any of the ancient trade routes. The confidence region does not contain the midpoint between Petra and Mecca as suggested by D. Gibson. The optimal reconstruction point is located at . The only site of archaeological relevance within the confidence region is the Ruwāfa Temple that lies completely isolated in the desert [25, p. 44-49]. The temple has not been excavated, but some interesting inscriptions reveal that it was built around 160 CE for Ilah (older version of Allah). The observation that the Ruwāfa Temple is almost at the optimal reconstruction point is new knowledge and it is still far from clear how this result should be interpreted.
We can test Gibson’s “between qibla” versus our “Ruwāfa qibla” in the same way as we tested great circles versus rhumb lines and the result is that “Ruwāfa qibla” gives a much better description of the data than the “between qibla”. It is surprising that none of our reconstruction points lie near Mecca. For instance there is an rock inscription that testify that Mashid al-Haram was built (or rebuilt) in Mecca in 698 CE [26, p. 111], and there are some mosques before the Abbaside revolution that seem to face Mecca, but they are so few that they do not lead to a separate reconstruction point.
Acknowlegment
I thank Dan Gibson and Kristoffer Damgaard for useful comments on a draft of this paper.
References
- [1] P. Harremoës, “Testing Goodness-of-Fit via rate distortion,” in Information Theory Workshop, Volos, Greece, 2009. IEEE, 2009, pp. 17–21. [Online]. Available: http://arxiv.org/abs/0903.5426
- [2] ——, “The rate distortion test of normality,” in 2019 IEEE International Symposium on Information Theory (ISIT). IEEE, Jul. 2019, pp. 241–245.
- [3] D. Gibson, “Early Islamic qibla database,” Jan. 2021. [Online]. Available: https://figshare.com/articles/dataset/Early_Islamic_Qibla_Database/13570655
- [4] C. R. Sims. Ratedistortion: Routines for solving rate-distortion problems. Package for R program. Not updated. [Online]. Available: https://rdrr.io/cran/RateDistortion/
- [5] P. Harremoës. ArimotoBlahut.R. Package for rate distortion calculations in R. [Online]. Available: http://www.harremoes.dk/Peter/ArimotoBlahut.R
- [6] ——. QiblaScript.R. Worksheet for analyzing qibla data in R. [Online]. Available: http://www.harremoes.dk/Peter/QiblaScript.R
- [7] K. Rignell, Letter from Jacob of Edessa to John the Stylite of Litarab concerning ecclesiastical canons. Lund: Gleerup, 1979.
- [8] R. G. Hoyland, Seeing Islam As Others Saw It. Gorgias Press, 2019.
- [9] H. ibn al Kalbi, The Book of Idols, ser. Princeton Oriental Studies. Princeton University Press, 1952, vol. 14, translated by Nabih Amin Faris.
- [10] G. E. V. Grunebaum, Classical Islam. Taylor & Francis Ltd., 2017.
- [11] D. Gibson, Early Islamic Qiblas. Vancouver: Scholars Press, 2017.
- [12] P. Crone, Meccan Trade and the Rise of Islam. New Jersey: Gorgias Press, 1987.
- [13] M. A. Khan, The Unveiling Origin of Mecca. AuthorHouse, 2021.
- [14] A. J. al Tamimi, “The Byzantine-Arabic chronicle: Full translation and analysis.” Aug. 2019. [Online]. Available: http://www.aymennjawad.org/23129/the-byzantine-arabic-chronicle-full-translation
- [15] J. H. Hottinger, Historia orientalis, quae ex variis orientalium monumentis collecta. Bodmer., 1651. [Online]. Available: https://play.google.com/books/reader?id=9XJBAAAAcAAJ&pg=GBS.PA138&hl=da
- [16] K. V. Mardia and P. E. Jupp, Directional Statistics, ser. Wiley Series in Probability and Statistics. Wiley, 2000.
- [17] P. Harremoës, “Information theory for angular data,” in Proceedings Information Theory Workshop, Cairo. IEEE, Jan. 2010, pp. 181–185. [Online]. Available: www.harremoes.dk/Peter/1569245443.pdf
- [18] R. E. Blahut, “Computation of channel capacity and rate-distortion functions,” IEEE Trans. Inform. Theory, vol. 18, pp. 460–473, 1972.
- [19] T. M. Cover and J. A. Thomas, Elements of Information Theory. Wiley, 1991.
- [20] D. A. King, “From Petra back to Makka - from "pibla" back to qibla,” Online on https://muslimheritage.com/pibla-back-to-qibla/, Aug. 2017.
- [21] ——, “The Petra fallacy - early mosques do face the Sacred Kaaba in Mecca but Dan Gibson doesn’t know how / comparing historical orientations with modern directions can lead to false results,” Published at https://muslimheritage.com/the-petra-fallacy/, Sep. 2020.
- [22] D. Gibson, “Navigation and the qibla: 5: The Indian circle,” Youtube video, Jan. 2021. [Online]. Available: https://www.youtube.com/watch?v=hEm65krB6W8&list=PLneIIflWyUahE4fg25U9jr1km1gXusDtm&index=35&t=6s&ab_channel=DanGibson
- [23] ——, “Sidi Ghanem Mosque,” 2018. [Online]. Available: https://nabataea.net/explore/cities_and_sites/sidi-ghanem-mosque/
- [24] J. Voss, An Introduction to Statistical Computing. Wiley, 2014.
- [25] M. C. A. Macdonald, Arabs and Empires before Islam. Oxford University Press, 2015, ch. Arabs and Empires before the Sixth Century, pp. 11–89.
- [26] A. Amine, L’islam de Pétra Réponse à la thèse de Dan Gibson: Présentation & Revue critique. BoD - Books on Demand, 2020.