Disk Tearing Leads to Low and High Frequency Quasi Periodic Oscillations in a GRMHD Simulation of a Thin Accretion Disk
Abstract
Black hole X-ray binaries (BHXRBs) display a wide range of variability phenomena, from long duration spectral state changes to short-term broadband variability and quasi-periodic oscillations (QPOs). A particularly puzzling aspect is the production of QPOs, which – if properly understood – could be used as a powerful diagnostic tool of black hole accretion and evolution. In this work we analyse a high resolution three-dimensional general relativistic magnetohydrodynamic simulation of a geometrically thin accretion disk which is tilted by with respect to the black hole spin axis. We find that the Lense-Thirring torque from the rapidly spinning 10 black hole causes several sub-disks to tear off within gravitational radii. Tearing occurs in cycles on timescales of seconds. During each tearing cycle the inner sub-disk precesses for 1-5 periods before it falls into the black hole. We find a precession frequency of , consistent with observed low-frequency QPOs. In addition, we find a high frequency QPO (HFQPO) with centroid frequency of Hz in the power spectra of the mass-weighted radius of the inner disk. This signal is caused by radial epicyclic oscillations of a dense ring of gas at the tearing radius, which strongly suggests a corresponding modulation of the X-ray lightcurve and may thus explain some of the observed HFQPOs.
keywords:
accretion, accretion discs – black hole physics – MHD – galaxies: jets – methods: numerical1 Introduction
Quasi periodic oscillations (QPOs) appear to be a common characteristic of accreting systems. First discovered in the lightcurves of accreting neutron stars (van der Klis et al., 1985), QPOs have now been detected in a variety of systems including active galactic nuclei (AGN), low-mass and high-mass X-ray binaries, ultraluminous X-ray sources and tidal disruption events (Mucciarelli et al., 2006; Gierliński et al., 2008; Pasham et al., 2019; Smith et al., 2021). QPOs take the form of more or less narrow peaks (, where is the centroid frequency and is the full width at half maximum around the centroid frequency) in the power density spectra of the lightcurve (e.g. Barret et al., 2005, for a discussion of high coherence QPOs). In the case of AGN, QPOs have been detected throughout the entire electromagnetic spectrum from radio to gamma-rays (e.g. Ackermann et al., 2015; Kidger et al., 1992; Zhang & Wang, 2021), but they are most prominent in X-ray lightcurves of accreting stellar mass black holes and neutron stars.
In this work we focus on QPOs in stellar mass black hole X-ray binaries (BHXRBs). QPOs in BHXRBs are categorised as either high frequency QPOs (HFQPOs) if their centroid frequency is between Hz (e.g. Remillard et al., 2003), and low frequency QPOs (LFQPOs) if their centroid frequency is between Hz and their properties are generally associated with the spectral state of the source (van der Klis, 2006; Gierliński et al., 2008; Ingram & Motta, 2019; Remillard et al., 2006). While LFQPOs are a common feature of BHXRBs, HFQPOs are rare and have only been detected in a handful of sources e.g. GRO J1655-40 (Remillard et al., 1999; Strohmayer, 2001b; Remillard et al., 2006), H1743-322 (Homan et al., 2005b; Remillard et al., 2006), XTE J1550-564 (Homan et al., 2001; Miller et al., 2001; Remillard et al., 2002a) and GRS 1915105 (Morgan et al., 1997; Strohmayer, 2001b; Belloni et al., 2006) with frequencies spanning a few tens of Hz up to Hz. HFQPOs are of particular interest since they are believed to originate very close to the black hole (BH), as supported by their high coherence and short timescales, and can thus be used to probe the innermost region of the accretion flow where strong gravity plays an important role. Moreover, the frequencies of HFQPOs can be remarkably stable upon sizeable changes of the X-ray luminosity (Remillard et al., 2002b; Homan et al., 2005a). Once the physical mechanism behind both low and high frequency QPOs are sufficiently understood, QPOs have the potential to encode the mass and spin of the black hole (e.g. Stuchlík et al., 2006) in addition to constraining the structure of the disk (when mass and spin are known through other methods).
There is currently no consensus on the origin of QPOs in BHXRBs, though numerous models have been proposed to explain the origin of low and high frequency QPOs. These models can be broadly divided into two categories (e.g. van den Eijnden et al., 2016) based on the origin of the observed X-ray variability: Geometric models, in which a constant intrinsic X-ray flux is modulated by changes in the apparent geometry of the accretion flow in a quasi-periodic manner, or those based on the intrinsic variability of the X-ray emitting plasma. Intrinsic models associate QPOs with changes in the mass accretion rate (Tagger & Pellat, 1999), standing shocks/waves (Chakrabarti et al., 2005; Tagger & Pellat, 1999), or some form of oscillation or perturbation in the disk (e.g. the adiabatic perturbations in discoseismic models, see Okazaki et al., 1987; Nowak & Wagoner, 1991, 1993; Rezzolla et al., 2003; de Avellar et al., 2018; Dewberry et al., 2020; Wagoner et al., 2001; O’Neill et al., 2009), a nonlinear resonance condition within the accretion disk (e.g. Abramowicz & Kluźniak, 2001; Kluzniak & Abramowicz, 2002; Remillard et al., 2006; Kato, 2004; Török et al., 2011, 2005; Belloni & Stella, 2014), oscillations at the Bardeen-Petterson alignment radius (Fragile et al., 2001), or a breathing mode (Dexter & Blaes, 2014). The observed ratios of simultaneous HFQPOs (typically 3:2) have particularly motivated the idea that HFQPOs are the result of a resonance condition within the disk (Abramowicz & Kluźniak, 2001; Kato, 2004).
There is increasing evidence for the geometric origin of some QPOs, such as the dependence of LFQPO amplitude on the inclination of the binary orbit (Heil et al., 2015; Motta et al., 2015), phase lag dependence on inclination for type-C LFQPOs (van den Eijnden et al., 2017) and the modulation of the equivalent width of the iron line with the phase of a type-C QPO detected in H1743-322 (Ingram et al., 2016) (also GRS 1915105, see Ingram & van der Klis, 2015; Ingram et al., 2016; Nathan et al., 2022). Models based on geometric effects invoke a wide range of mechanisms for QPO production often resulting from the misalignment between the BH spin axis and the binary orbit. One such model is the relativistic precession model (RPM) proposed by Stella & Vietri (1998); Stella et al. (1999); Fragile et al. (2016) in which the warping of space-time results in nodal precession and periastron precession of a test mass in a Keplerian orbit (e.g. an orbiting hotspot in the disk as in Schnittman & Bertschinger, 2004, see also Beheshtipour et al., 2016) give rise to LFQPOs and HFQPOs respectively. Ingram et al. (2009) (see also Ingram & Done, 2011, 2012) extended the RPM model from the original framework of test particle orbits in an accretion disk, by applying the model to truncated (Esin et al., 1997) accretion disks. Ingram et al. (2009) proposed that type-C LFQPOs (see Remillard et al., 2002a, for a classification of BH-XRB QPOs) can be produced by Lense-Thirring precession of the entire hot geometrically thick component (the corona) of the truncated accretion disk. The RPM model predicts not only the frequency, but also the common association of LFQPOs with the hard component () in the steep powerlaw state (Churazov et al., 2001; Remillard et al., 2006) and is one of the leading models of QPO production. Several groups have observed Lense-Thirring precession of geometrically thick disks in GRMHD simulations (Fragile & Blaes, 2008; Fragile & Anninos, 2005; Fragile et al., 2007; Liska et al., 2018; Liska et al., 2019a), however it was unclear how such a precessing disk forms, and, what determines its size and precession frequency. Disk tearing, a process where a smaller precessing disk tears off from a larger non-precessing disk, was postulated as a possible solution and observed in recent SPH (e.g. Nixon et al. 2012; Nealon et al. 2015) and GRMHD simulations (Liska et al., 2019b, 2021).
In this paper we analyse an extremely high resolution GRMHD simulation of a highly tilted geometrically thin accretion disk, which was first presented in Liska et al. (2019b). In this simulation the disk was found to tear and precess, making it an attractive dataset to look for signatures of precession induced QPOs. In Section 2 we describe the numerical setup. In Section 3 we describe the evolution of the disk and QPO signatures. In Section 4 we compare our work to previous numerical studies and observations before concluding in Section 5.
2 Numerical and Physical Setup
In this work we model the evolution of a very thin accretion disk of aspect ratio around a rapidly spinning black hole with spin parameter . This scaleheight is maintained throughout the simulation by cooling the disk to its target temperature as described in Noble et al. (2009). In the initial conditions, we initialise the velocities as Keplerian and tilt the disk by with respect to the horizontal equatorial plane of the black hole. The disk has an inner radius of and outer radius of . The radial surface density profile scales as while the vertical density profile is modeled by a Gaussian profile with a full-width half maximum (FWHM) equal to the local scale-height of the disk.
The disk is initially threaded with a purely toroidal magnetic field with vector potential given by . This vector potential is normalised to yield an approximately uniform plasma-, where and are the gas and magnetic pressures respectively, such that the disk remains gas pressure dominated. Namely, if the disk would become magnetic pressure dominated, it would be unable to achieve the targeted scaleheight. On the other hand, if the magnetic field would be weaker, we would need to run the simulation for much longer to achieve mass inflow equilibrium in the inner .
The simulation was conducted using the GPU-accelerated GRMHD code H-AMR (Liska et al., 2019b). H-AMR is a massively parallel 3D GRMHD code based on the methods developed in the GRMHD code HARM2D (Gammie et al., 2003; Noble et al., 2006). H-AMR has been extensively modified from these original sources in order to increase the code’s speed and robustness through numerous features including adaptive mesh refinement (AMR), local adaptive time-stepping (LAT), and GPU accelerations. H-AMR utilises a staggered grid for constrained transport of magnetic fields as described in (Gardiner & Stone, 2005) and solves the GRMHD equations of motion in conservative form in arbitrary (fixed) spacetimes. H-AMR uses a finite volume, shock-capturing Godunov-based HLLE scheme, with second order spatial accuracy (PPM reconstruction of primitive variables, Colella & Woodward, 1984), and second order accurate time evolution.
The simulation was performed on a logarithmic spherical-polar grid in a Kerr-Schild foliation and uses outflow boundary conditions in the radial direction, transmissive boundary conditions in the -direction and periodic boundary conditions in the -direction. The inner boundary was placed just inside the event horizon at and the outer boundary at . The simulation was conducted with an extremely high resolution grid, featuring a maximum effective resolution in the disk beyond . The grid resolution gradually drops to the base resolution of at in order to increase the timestep by an order of magnitude (Liska et al., 2019b). The grid uses 3 levels of adaptive mesh refinement (AMR) and 5 levels of LAT. In addition, to prevent the timestep becoming limited by the Courant condition (Courant et al., 1928) in , we reduce the azimuthal resolution progressively from to within of each pole.
| Event | Duration | Tearing radius at | Tearing radius at | ||
|---|---|---|---|---|---|
| E1 | 1216 | 2027 | 811 | 7.8 | 13 |
| E2 | 5876 | 8852 | 2976 | 10 | 14 |
| E3 | 13618 | 18839 | 5221 | 11 | 18 |
| E4 | 25903 | 27152 | 1249 | 10 | 13 |
| E5 | 31715 | 33013 | 1298 | 9 | 13 |
| E6 | 39922 | 40827 | 905 | 7.5 | 13 |
| E7 | 47138 | 89420 | 42282 | 14.6 | 20 |
| E8 | 93878 | 95089 | 1211 | 7.4 | 10 |
| E9 | 96290 | 101800 | 5510 | 10.5 | 13 |
| E10 | 113318 | 140183 | 26865 | 13 | 19 |
3 Simulation overview
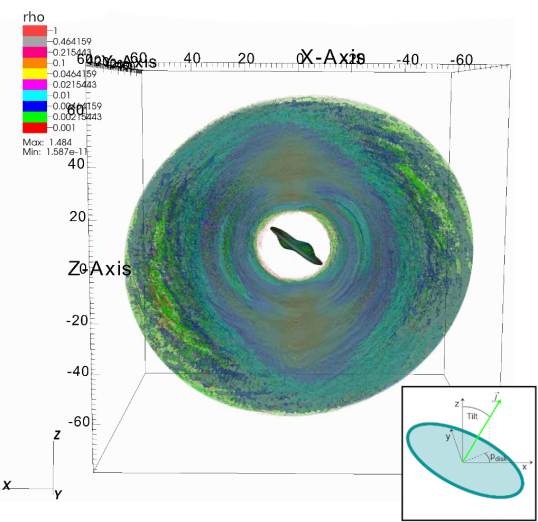
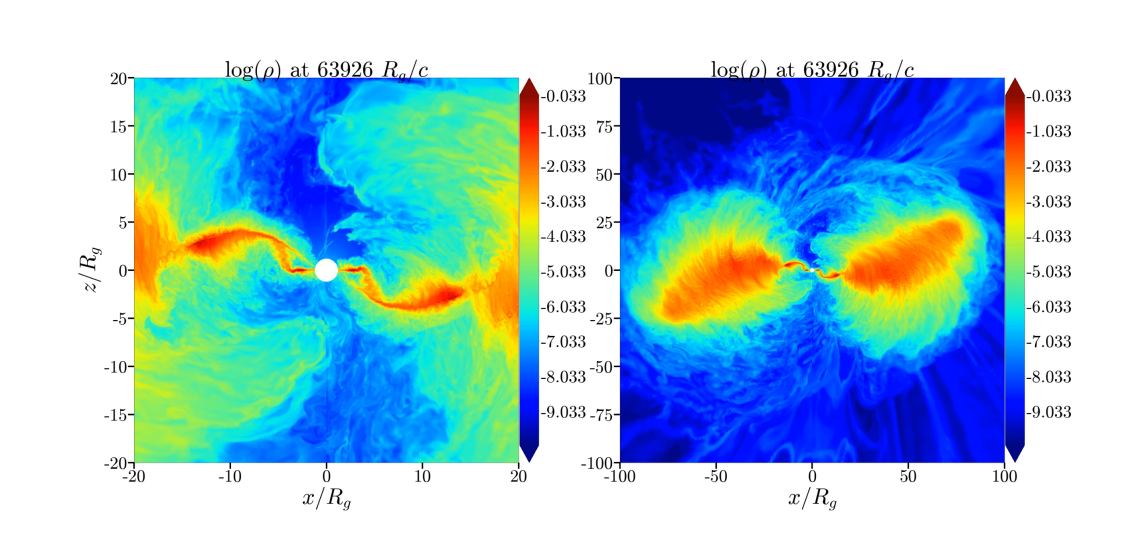
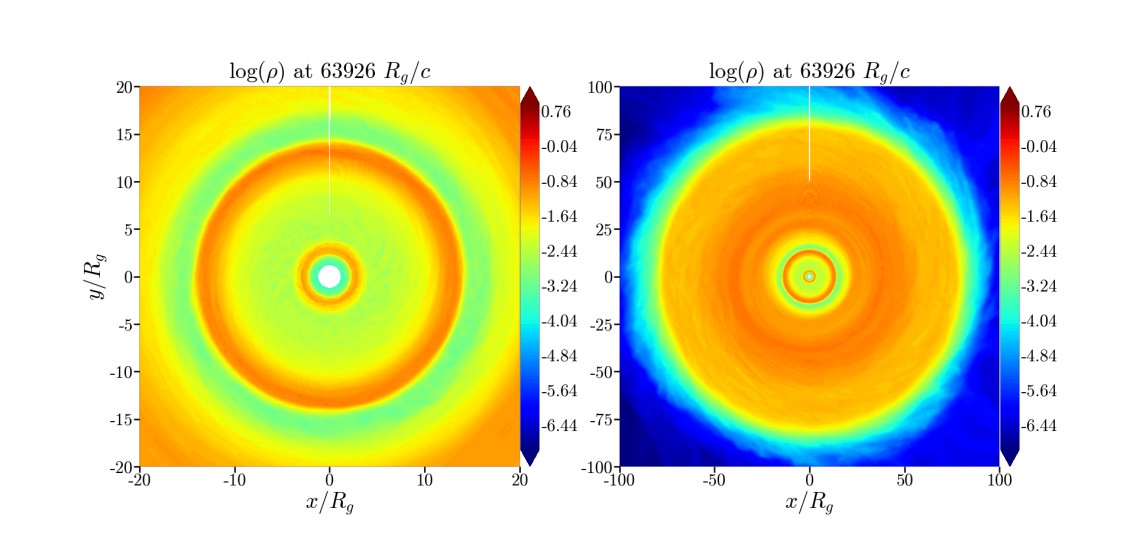
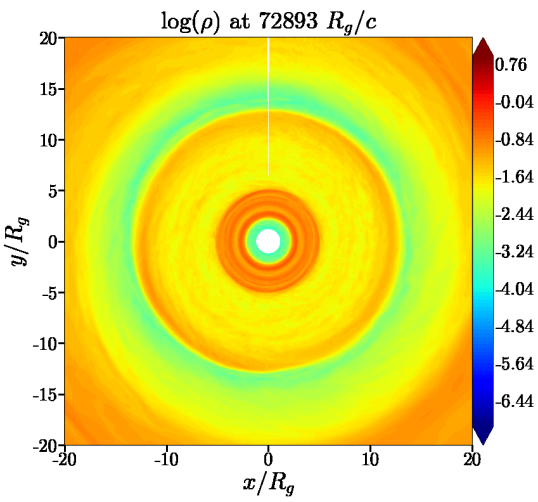
The disk tears at places where the viscous stresses cannot provide rapid enough angular momentum transport to counteract the (effective) differential Lense-Thirring torque from the warping of space-time by the spinning black hole (e.g. Nixon et al., 2012). In our simulation, disk tearing generally results in one precessing sub-disk which is decoupled from the outer disk and precesses independently for precession cycles before aligning and/or being accreted by the black hole (Liska et al., 2019b). A total of 10 such tearing cycles occur in the simulation and their associated times, duration of the tearing cycle and radius at which the disk tears are give in Table 1. To get a sense of the geometry, a 3D rendering of simulation is shown during the longest tearing cycle (E7) in Figure 1 and a corresponding movie can be inspected on the following YouTube channel. Tearing cycle E7 is further illustrated in Figure 2 which shows a transverse slice of the vertically integrated density in a coordinate system aligned with the local angular momentum vector.
Throughout the whole simulation, no large scale poloidal magnetic flux is generated, which leads to the absence of any relativistic jets (Blandford & Znajek, 1977). This suggests that our simulation is applicable to the jet-less high-soft state of BHXRBs. In previous work, it was demonstrated that geometrically thick accretion disks are able to convert toroidal magnetic flux into poloidal magnetic flux on a timescale, advect it inwards from , and launch powerful jets (Liska et al., 2020). It is unclear if either of these two processes can occur in a geometrically thin accretion disk (e.g. Lubow et al. 1994). Since the viscous time for thin disks is times longer than for the much thicker disk presented in Liska et al. (2020), answering such questions will require much longer GRMHD simulations than presented in this work.
3.1 Disk Tearing
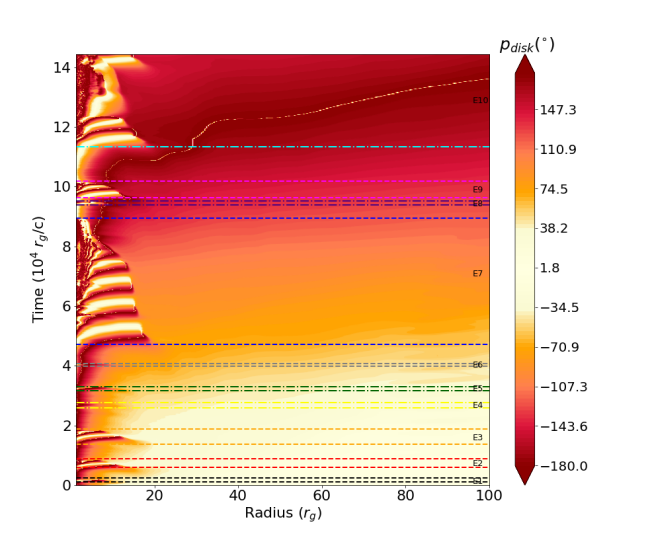
To better understand the disk tearing process we plot in Figure 3 the space-time diagrams of the radial mass flux ,
| (1) |
where is the mass density, is the radial component of the four-velocity and is the determinant of the four-metric, the average density given by
| (2) |
and the tilt angle , and precession angle . Calculation of the disk tilt and precession angle is outlined in Fragile & Anninos 2005; Liska et al. 2019c and the geometry is sketched in the inset of Figure 1. The disk tear is identifiable as a sharp discontinuity in precession and tilt angles. All events are associated with dense rings that initially form within . As the material moves inwards through the strongly warped regions of the disk, the inner ring also moves inwards and a tear develops when the outer edge of the ring is at e.g. for the longest duration tearing cycles E7 and E10. Subsequently, the inner sub-disk starts precessing independently of the outer disk. This tearing process goes along with a burst in accretion onto the black hole around for tearing event E7 and around for tearing event E10. The recurrence-time of these tearing events is set by the ring formation time at larger distances.
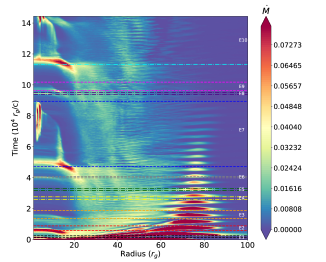
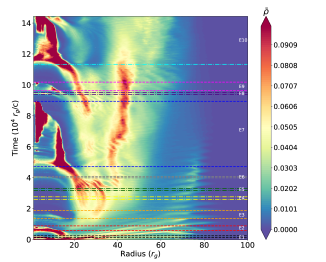
In addition to the inward-moving rings that are associated with tearing events, we observe one other prominent long-lived feature at in the space-time diagram of the average density, which corresponds to the outer dense ring in the lower right panel of Figure 2. Naively, one might think this feature will develop into a full tear on a timescale much longer than the runtime of this simulation. However, since this feature almost disappears at the onset of tearing event E10, this is an unlikely scenario.
We speculate that the density enhancements found in rings are caused by the enhanced energy dissipation and angular momentum transport in the strongly warped regions just outside of these rings. As illustrated by the profiles of and , this causes gas to be fed from the adjacent regions leading to a sharp drop in density behind the torn off inner disk.
Material progresses from one torn off sub-disk to the other via streamers that, depending on the relative phase angles of the rings, can provide efficient means of angular momentum cancellation. This shortens the accretion time of the inner disk and prevents the inner sub-disk from viscously spreading, which was shown to inhibit disk precession in previous work (Liska et al., 2018). Interestingly, as can be seen in the averaged density of Figure 3, angular momentum cancellation does not cause the inner sub-disk to shrink in radial size immediately. Instead, it first depletes the ring formed at the tearing radius of gas. This allows the inner sub-disk to precess with a semi-constant frequency before it is consumed by the black hole.
The space-time diagrams of radial mass flux and density also demonstrate a strong oscillatory signal in the outer regions which we attribute to the initial conditions: as the disk warp propagates outwards, and the outer edge of the disk establishes radial force balance, the outer disk picks up oscillations. After an adjustment time of these oscillations disappear within a radius of before fully disappearing after . Similar breathing mode oscillations, eventually attributed to the initial conditions, were observed in other work (Mishra et al., 2019).
3.2 Disk Alignment
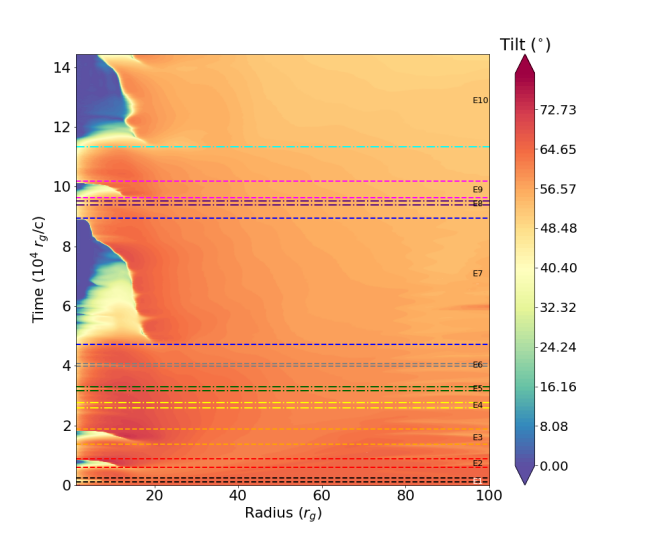
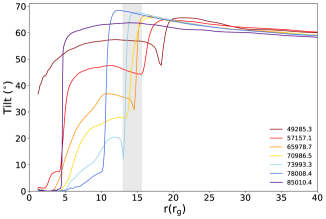
We observe alignment of the disk with the black hole spin axis during all tearing events. To understand the alignment process, we plot in Figure 4 the tilt as function of radius for various snapshots during tearing cycle E7. In this figure we can discern two physical process leading to alignment of the disk.
The first process is the classical Bardeen & Petterson (1975) (hereafter: BP) effect which forces the inner regions of the disk to align with the black hole spin axis111In fact, this simulation comprised the first demonstration of Bardeen-Petterson alignment in the absence of a large-scale poloidal magnetic field (Liska et al., 2019b).. BP alignment occurs inside-out within the inner of the disk and leads to almost full alignment between disk and black hole spin. Interestingly, BP alignment is accompanied by a density increase in the aligned portion of the disk as can be seen in E7, E9 and E10. We speculate that the absence of a warp in the aligned portion of the disk reduces the inflow speed of the gas, which increases the density.
In addition to the BP effect, the disk also exhibits a global alignment mode where the disk aligns outside-in with the black hole spin axis on a timescale similar to the accretion time of the inner sub-disk. This global alignment mode is driven by angular momentum mixing in warps and when streamers deposit misaligned gas from the outer disk into the inner (precessing) sub-disk, which leads to the cancellation of perpendicular angular momentum and causes alignment (Liska et al., 2019c; Liska et al., 2021). We will quantify the relative contribution of these two processes in future work.
3.3 Detection of a HFQPO at the Tearing Radius
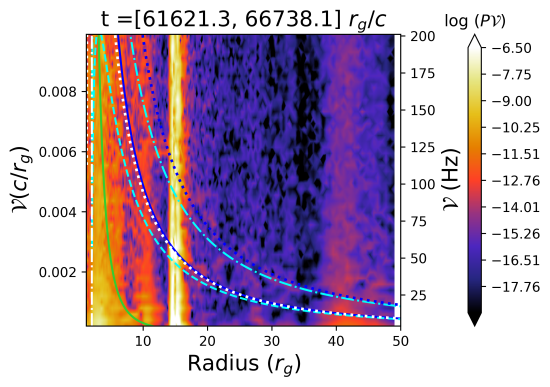
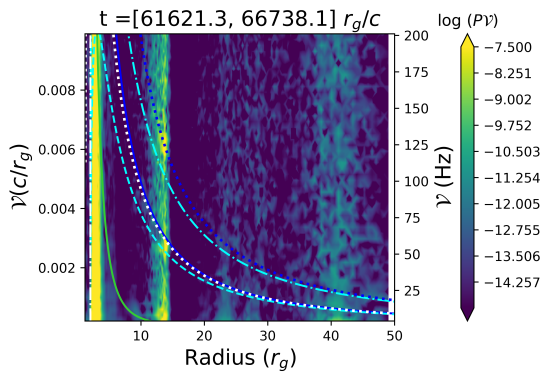
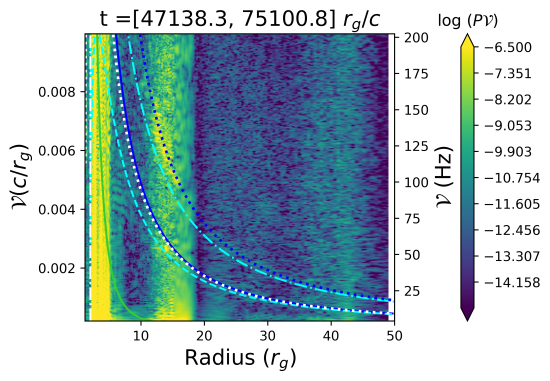
To identify oscillatory signals in the simulation, we use the radial mass flux given in equation 1. In order to probe the structure of the variability in the simulation, we compute the power spectral density (PSD) of the radial mass flux. For each spherical shell in the numerical grid, the PSDs are computed similarly to Hogg & Reynolds (2016) using , where is the Fourier transform of the time-series (in a given radial shell) of the radial mass flux . In practise, we apply the numpy fft function which implements a discrete Fourier transform (Cooley & Tukey, 1965) and the reported PSDs are proportional to the variance of the signal. The time-series have a cadence of resulting in a Nyquist frequency of (for a black hole). In Figure 5 we show PSDs across spherical shells for the inner of the disk, for time periods in which the disk does not tear (bottom panel) and at times during the longest tearing cycle E7 (top two panels). We also overplot curves showing the characteristic frequencies (e.g. Nowak & Lehr, 1998) on top of the PSDs in Figure 5; the Keplerian frequency (solid blue curve) given by
| (3) |
the radial epicyclic frequency (dashed cyan curve) given by
| (4) |
and the Lense-Thirring precession frequency (solid green curve)
| (5) |
where is the black hole spin and is the radius and units are set such that 222We note that the characteristic frequencies listed here are for aligned accretion flows. Approximate expressions for inclined orbits have been presented by Sibgatullin (2001). We have used the available relations to check that for the typical tearing radii (e.g. ), inclination leads to a negligible shift of the Keplerian and radial epicyclic frequencies (in fact away from each other)..
All PSDs show signatures of enhanced variability throughout most of the disk near radial epicyclic or nearby Keplerian frequencies (shown as cyan dashed- and blue solid lines which are nearby at large radii). In the absence of disk tearing, we find a depression in the spectral power within the inner of the disk, with regions of highest power coinciding with larger radii () and low frequency. The low central power in absence of tearing is consistent with the low densities in the inner regions during these time intervals (c.f. Figure 3). During the disk tearing cycle E7, we find an enhancement in the spectral power across all frequencies at radii close to the position of the tearing radius ( during time window in which the PSD is computed). Importantly, the epicyclic signal at the tearing radius is boosted most strongly, giving rise to a 55 Hz signal if scaled to a BH (bright yellow feature at and 55 Hz). This feature, which we identify as a HFQPO, is clearly seen in both the top two panels of Figure 5, and is notably absent in the PSD in which the disk does not tear (bottom panel of Figure 5).
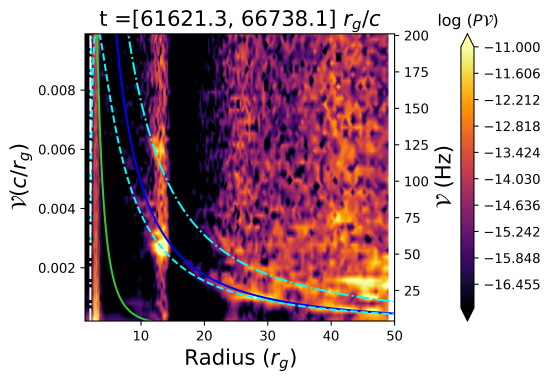
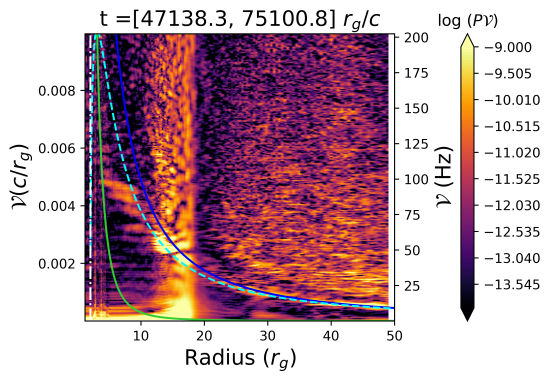
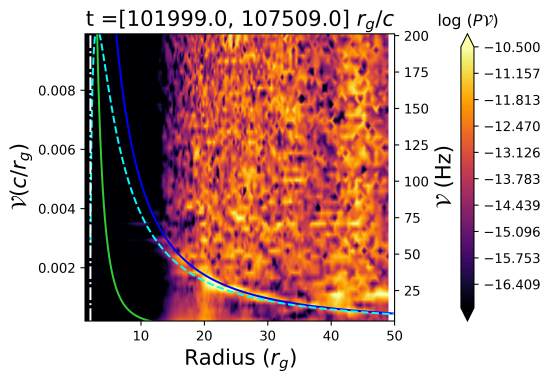
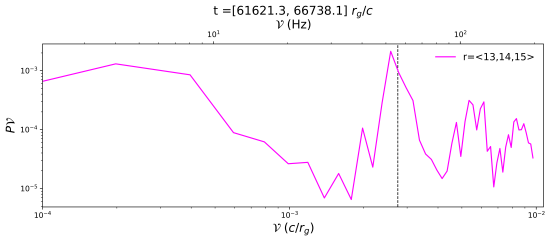
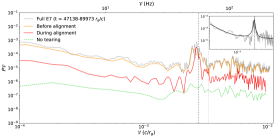
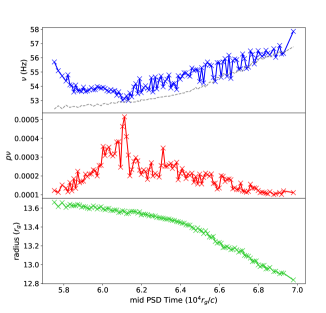
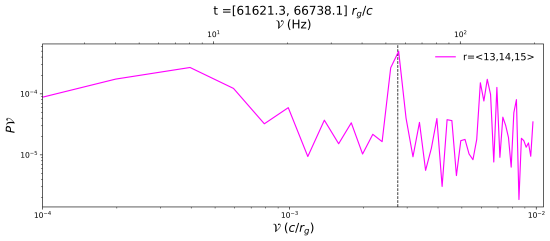
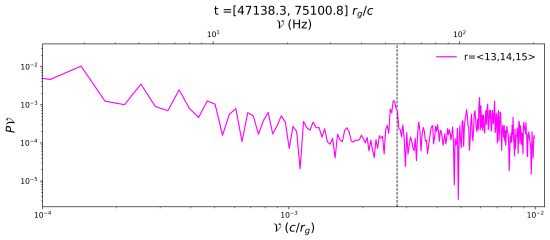
Figure 6 shows power spectra averaged over three discrete radii, 13, 14 and 15 , for cycle E7. These radii correspond to locations at or near the position of the tearing radius during the time period in which the HFQPOs are present in tearing cycle E7. The HFQPO clearly stands out as a distinct peak with a centroid frequency of Hz and a quality factor of . The centroid frequency is well described by the radial epicyclic frequency at (dashed vertical line, i.e. roughly the current position of the tearing radius). In Figure 7 we show the evolution of the frequency, spectral power and radius at which the 55 Hz HFQPO is triggered as a function of time. We track the evolution by fitting a 2D Gaussian to the 55 Hz HFQPO feature in the 2D PSDs of the radial mass flux (such as those shown in Figure 5). The PSDs used for the fits are computed using a fixed time window of size (same as the top panel of Figure 5), and are computed every across a time period roughly corresponding to the time during which the 55 Hz HFQPO is a stable feature in the PSDs. The centroid frequency of the 55 Hz QPO (top panel of Figure 7) varies by only a few percent, increasing over its lifetime, and is found to have an average frequency of Hz over this time.
The bottom panel of Figure 7 shows that the radial position at which the HFQPO is triggered moves inwards towards the BH, by , correlated with the small increase in the centroid frequency of the HFQPO over its lifetime. To relate the HFQPO to disk tearing, we inspect the tilt angle for rapid changes in the radial location of the tearing radius (see e.g. Figure 4). The disk initially tears at at the start of the tearing cycle E7. The tearing radius then moves inwards until it settles between (shown by the vertical grey band in 4) for the entire period in which the HFQPO signatures are present. The small variation in tearing radius is consistent with the small variation found for the radius at which the HFQPO is triggered, thus highlighting the dependence of the evolution of the HFQPOs centroid frequency, and location at which it is triggered, on the evolution of the disk tearing radius.
We find that the spectral power (middle panel Figure 7) initially increases over time before reaching a maximum, which may indicate that the triggering mechanism takes some time to setup. The spectral power of the HFQPO then begins a slow decay back to a power similar to what the HFQPO had when it was first stable.
Comparing the Hz HFQPO signal in Figure 6 to the power spectrum computed for times during which the disk does not tear (green curve in Figure 6), we find that spectral power is strongly enhanced during disk tearing. The QPO signature is present during disk tearing regardless of whether the inner sub-disk is partly aligned with the black hole or not (orange and red curves), however, as also illustrated in figure 4 the tear moves in rapidly once partial alignment has reached the tearing radius . This marks the end of the HFQPO signatures in the power spectra and PSDs.
Interestingly, we also see evidence for a, albeit weaker, harmonic signal throughout the disk. During disk tearing, this harmonic is boosted to result in a weaker HFQPO at Hz (see localised yellow region at 110 Hz along the dash-dot cyan curve in in top panel of Figure 5). The 110 Hz HFQPO has weaker spectral power compared to the 55 Hz feature, as can be seen in the top panel of Figure 5. Thus the 110 Hz QPO becomes more difficult to identify when the PSDs are computed over large time windows (e.g. middle panel of Figure 5) and when averaging the power spectra over multiple radii (e.g. Figure 6). Similarly to the Hz peak, the harmonic HFQPO is only found to vary by a few Hz during its lifetime. The presence of simultaneous HFQPO peaks with a 1:2 ratio found in this work is consistent with the observed ratios of HFQPOs (e.g. GRS 1915+105 Belloni & Altamirano, 2013), however, we have not observed the more common 2:3 resonance in the PSDs of the radial mass flux.
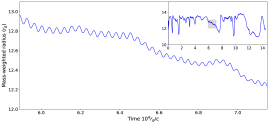
The variations in the radial mass flux are indicative of a radial oscillation or “breathing mode” of the inner disk. This feature can be seen in the animation of the vertically integrated disk density provided on the following YouTube channel. The inner sub-disk has formed a pronounced dense ring extending out to the tearing radius where rapid oscillations with a period corresponding to the Hz HFQPO can be identified. The ring shows no discernible eccentricity. To quantify this motion further, we compute the mass-weighted radius as
| (6) |
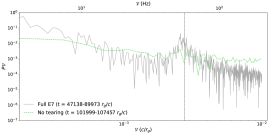
where the radial integration is performed between and to capture the ring. Figure 8 shows the time evolution of and its associated PSD. The oscillations seen before in the radial mass flux are clearly present in the motion of the barycenter, indicating that the ring performs a global breathing oscillation. No prominent frequency is observed in the control volume in the absence of tearing (see green curves for comparison).
3.4 Detection of a LFQPO of the inner sub-disk
Once a tear has developed, the inner and outer disk precess independently with a frequency given by the local Lense-Thirring (LT) torque and angular momentum of the sub-disk (e.g. Liska et al., 2019c; Liska et al., 2021). This leads to a rapid precession of the inner disk as seen in the precession angle shown in Figure 3. Since the inner disk is warped, a phase lag occurs where the inner parts () lead before the outer parts. However, the precession frequency is essentially constant throughout the entire sub-disk. Thus we characterise the precession as warped solid body. There are several further important observations to be made: a) the precession increases in frequency as the tear moves inwards, b) the density of the disk is highly peaked towards its edge suggesting that the precession frequency can be approximated from test particle motion at the tearing radius. We test this hypothesis in Figure 9, where we compare the phase of the sub-disk with the analytic prediction from the nodal precession frequency (see e.g. Lewin & van der Klis, 2010) .
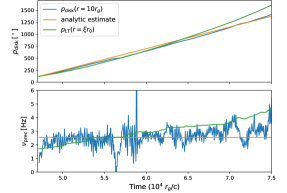
The actual precession angle of the disk has been extracted at , however, due to the solid-body nature of the sub-disk, the radius does not matter much. We overlay two curves: first, we show an analytic estimate of the precession frequency based on the integrated misaligned angular momentum divided by the integrated Lense-Thirring torque as in Liska et al. (2019c). This results in a period of which recovers the average period with very good accuracy. Second, we show the nodal precession with “effective radius” where is the instantaneous tearing radius and the parameter is a coefficient that accounts for the moment of inertia of the inner disk. If the ring were infinitely thin and located at , we would have . We find that the actual precession behaviour is quite well captured by . As the time progresses, the frequency increases from to which is quite well captured by the model that takes the shrinking of the tearing radius into account.
4 Discussion
In our simulation, disk tearing is associated with the formation of rings with enhanced density and we observe that a tear always occurs behind such a ring. For the large tearing cycles E7 and E10, the ring lasts for the majority of the tear (around ) and the tearing radius remains nearly constant. During this time, the inner disk performs several full precession cycles and many radial epicyclic oscillations. This results in well defined HFQPO and LFQPO signals which we extract from the PSDs of radial mass flux and disk precession angle respectively. We will now discuss our findings in the context of previous work and in relation to X-ray timing observations.
4.1 Comparisons to previous work
A number of numerical studies have previously been performed to look for evidence of QPOs in simulations, with a few showing some evidence for the generation of QPOs. For example Kato (2004) find a promising signature of twin HFQPOs in their pseudo-Newtonian MHD simulations thought to be produced by the resonance between the epicyclic and Keplerian frequencies. Schnittman et al. (2006) found excess power by ray tracing a three dimensional global GRMHD simulation of an accreting Schwarzschild black hole indicative of a HFQPO pair with a 2:3 frequency ratio. However, since this excess power is orders of magnitude weaker than in observed HFQPOs, this work highlights the need for further simulations.
Evidence for epicyclic modes in tilted disks was previously found by Fragile & Blaes (2008) who analysed a GRMHD simulation of a () tilted, geometrically thick () disk around a Kerr black hole. In their study, it is argued that epicyclic modes are driven by pressure gradients attributed to the warping of the disk. Henisey et al. (2009) analyse this simulation further and find enhanced (radial) bands of power at frequencies below the orbital frequency, which they interpret as inertial (or acoustic) modes. It is argued that these modes could in principle explain the frequency range of HFQPOs in BHXRBs, but these authors do not find a clear HFQPO signature. The most important difference to our study is that the disk of Fragile & Blaes (2008); Henisey et al. (2009) is much thicker and does not tear.
The radially extended regions of high power along the radial epicyclic curve shown in Figure 5 have similarly been found in the PSDs (e.g. of the fluid three velocity) generated from the viscous, radiative hydrodynamic 2D simulation of aligned thin disks around a Schwarzschild black hole analysed in Mishra et al. (2019, 2020). In Mishra et al. (2019) they find radially extended regions of high power along the radial epicyclic curve. Mishra et al. (2020) also report local enhancements of the variability manifested as “stripes” in the PSDs, one of which is identified as a trapped g-mode (their Figures 1&4). These features are promising, however it remains to be seen which of the numerous modes are robust against damping by the magnetorotational-driven turbulence.
A model that bears some resemblance with our simulation was proposed by Fragile et al. (2001) who postulate that the Bardeen-Petterson effect in thin tilted disks may result in the generation of QPOs via material passing through the transition region (Bardeen-Petterson transition radius) between the resulting aligned inner and misaligned outer sub-disks. If the midplanes of the inner and outer sub-disks differ by moderately large angles () then the sub-disks are almost disconnected. It is speculated that material can then be accreted from the outer sub-disk to the aligned inner sub-disk via a tenuous stream of matter or in the form of clumps of gas, both of which may lead to shock heating when this accreted material hits the outer edge of the inner-sub disk. In this picture, the shock heated gas that then orbits the black hole at a radius just inside the Bardeen-Petterson transition radius, is responsible for generating QPOs with frequencies close to the Keplerian orbital frequency.
While some of the features just described are borne out of our simulation, we find that the dynamical evolution unfolds differently: rather than forming an outward-moving alignment radius, our disk undergoes cyclic tearing events. During these cycles, we find the inner disk does indeed align with the black hole, however, the alignment in itself cannot be responsible for the QPO generation as the the QPOs are triggered before alignment occurs. This is seen by the presence of the 55 Hz HFQPO peak in the orange curve in Figure 6, in which the PSD is computed during a time period prior to Bardeen-Petterson alignment. Our simulation, instead, shows that the signal (with radial epicyclic-, not keplerian- frequencies) is associated with the tearing radius and likely caused by differential precession between the two disks.
4.2 Towards a unified QPO mechanism
Disk tearing in tilted accretion flows has the potential to unify QPO production in BHXRBs, provided that precession driven LFQPOs can be produced (via disk precession e.g. Stella & Vietri, 1998; Ingram et al., 2009; Ingram & van der Klis, 2015; Miller & Homan, 2005; Fragile & Anninos, 2005; Veledina et al., 2013 and/or jet precession driven by the precession of the innermost regions of the accretion flow (Liska et al., 2018) e.g. type-B LFQPOs Liska et al., 2018; Kylafis & Reig, 2019, see also Stevens & Uttley, 2016; Kalamkar et al., 2016). In the popular relativistic precession model for LFQPOs proposed by Ingram et al. (2009), the generation of a type-C LFQPO is attributed to the solid body precession of the hot, geometrically thick inner flow of a truncated accretion disk. In this picture the frequency of the LFQPO is given by the Lense-Thirring precession frequency and the frequency evolution governed by the evolution of the truncation radius– as the truncation radius moves inwards during an outburst, the precession increases causing the LFQPO to increase. In the simulation we present here the onset of disk tearing leads to the self-consistent generation of a precessing inner sub-disk that undergoes solid body precession and an analysis of the precession angle reveals that the inner sub-disk undergoes nearly 5 precession periods with a period of . This frequency indicates that the inner sub-disk could potentially produce a precession driven LFQPO with a frequency of Hz (for a black hole), consistent with the range of LFQPO frequencies predicted by e.g. the Lense-Thirring precession driven model of Ingram et al. (2009). Thus a LFQPO could be triggered during a time window that overlaps with that in which the HFQPOs are observed (the HFQPO signatures are seen during the time window ). As discussed further in Appendix B, such a simultaneous detection would allow one to put constraints on the black hole spin assuming the black hole mass is known through other means.
4.3 Observational considerations
We have demonstrated that disk tearing followed by LT-precession of the inner disk self-consistently explains a single LFQPO peak in addition to a HFQPO peak and its harmonic. While this is very promising, XRBs typically display a rich phenomenology of Type-A, Type-B and Type-C LFQPOs. The absence of Type-B QPOs is expected, since Type-B QPOs might be associated with a jet (e.g. Remillard & McClintock, 2006; Ingram & Motta, 2019; Marcel et al., 2020), which is absent in our simulation. GRMHD Simulations have already demonstrated that jets can precess and lead to quasi-periodic emission (Liska et al., 2018). In addition, they have demonstrated that during tearing events the jet can get deflected when it crosses the midplane of the outer disk, which can lead to interesting phenomenology not captured in this work (Liska et al., 2021).
One potential problem in our model is that the longest tearing cycles have life and recurrence times of , which is extremely short compared to the time during which QPOs are detected. In addition, the disk in our simulation tears over a range of radii (), which leads to a broad spectrum of periods. At first sight this seems to be problematic for our model. However, recent observations have shown that LFQPOs decohere after a few cycles (van den Eijnden et al., 2016), which would be expected if QPO emission is in fact made up out of many stochastically distributed tearing events. In addition, tearing events occurring at much smaller radii than the fundamental radius of live very short and rarely complete more than one precession period. For example, tearing events E7 and E10 take up half of the simulation time, while all of the other tearing events combined only take up of the simulation time. Of these other tearing events only E2, E3 and E9 complete more than one precession period. Longer duration GRMHD simulations, which establish mass inflow equilibrium to a much larger radius, will be needed to verify that disk tearing will not lead to more than a modest broadening of the observed QPO peaks.
One particularly challenging aspect is the detection of a HFQPO peak at 450 Hz in GRO J1655-40, which, most likely, lies above the maximum radial epicyclic frequency (Strohmayer, 2001a). An intriguing possibility is that different physical mechanisms can be responsible for different HFQPOs. Namely, our work does not exclude the possiblity that some HFQPOs are caused by trapped discoseismic p- and g- modes (e.g. Kato 2004) or other physical mechanisms (e.g. Kluzniak & Abramowicz 2002). In fact, figure 10 shows the formation of concentric, high density rings in the BP-aligned portion of the disk within our simulations, which remain stable over extended periods of time. It is conceivable that these high-density rings trap discoseismic modes in the inner disk. As proposed in Kato (2004), the resonant coupling between such p-modes and g-modes and a warp might lead to oscillations in the disk with a frequency substantially above the maximum radial-epicyclic frequency. In future work we plan to test this interesting hypothesis.
Another puzzling aspect is the detection of HFQPO pairs in a 3:2 frequency ratio in various sources (e.g. Ingram & Motta, 2019). In the literature these 3:2 frequency ratios were explained by the resonant coupling of the radial and vertical epicyclic and/or Keplerian frequencies at certain radii (e.g. Kluzniak & Abramowicz, 2002; Abramowicz & Kluźniak, 2001) or discoseismic modes in a warp (e.g. Kato, 2004). However, there is no evidence for either a vertical epicyclic and/or Keplerian oscillation in the power spectra of radial mass flux, midplane density, and scaleheight of the disk in a 3:2 ratio (see Appendix C). Here we propose that such ratios may be explained by a corona, which sandwiches the accretion disk, but is not present in our simulations. Recent radiative GRMHD simulations have, for example, demonstrated that large scale magnetic fields can pressure support a geometrically thick corona-like structure around a very thin, radiation pressure supported, accretion disk (Lančová et al., 2019). Since the corona is much thicker (e.g. Liska et al. 2019a), it is conceivable that the center of the dense ring of gas associated with the corona extends to smaller radii away from the tearing radius. This might increase the coronal oscillation frequency. However, to explain a 3:2 frequency ratio between the disk and corona generated HFQPO, the corona would need to have a specific geometry that favours such ratios. This can be tested by the next-generation of radiative GRMHD simulations.
In addition, while LFQPOs are observed in various spectral states and evolve over a wide range of frequencies, HFQPOs are only seen in specific states at very specific frequencies that do not seem to evolve (e.g. Ingram & Motta 2019). This implies, within the framework of our model, that a very narrow range of spectral states have favourable conditions for HFQPOs. Future radiative GRMHD will be required to test if changes in the disk geometry, such as the motion of the truncation radius, and/or the presence of large scale magnetic flux, will lead to damping and/or decoherence of the HFQPO in certain spectral states. Some evidence for this was presented in Motta et al. (2014), which suggested that broad lower-frequency features in the power spectrum of GRO-J1655 may eventually shift to higher frequencies and evolve into narrow HFQPO peaks.
4.4 Misalignment in XRBs
The QPO mechanism presented in this work falls under the class of models that are based on the misalignment between the angular momentum of binary system and that of the black hole (e.g. Stella & Vietri, 1998; Fragile et al., 2001; Ingram & Motta, 2019, and references therein). While it is conceivable that accretion disks in AGN are considerably misaligned due to the randomness of gas infall and binary black hole mergers (e.g. Volonteri et al., 2005), this is not entirely clear for XRBs. Namely, one would expect that the black hole and it’s companion would have formed out of the same cloud of gas, and, that their spins further align with the orbit plane during the binary evolution. However, a black hole in an XRB can become substantially misaligned due to natal supernova kicks (Fragos et al., 2010; Martin et al., 2010; Jonker & Nelemans, 2004; Salvesen & Pokawanvit, 2020) or multi-body interactions (e.g. Antonini et al., 2018; Fragione & Kocsis, 2020). Though such processes are not expected to reproduce the extreme misalignment angles assumed in this work, analytical arguments and SPH simulations do suggest that accretion disks, which are thinner than presented in this work, can tear at much smaller tilt angles (e.g. Nixon et al. 2012; Nealon et al. 2015; Doǧan et al. 2018; Raj et al. 2021). Thus we expect that the results presented in this paper are applicable to a wide variety of systems.
5 Conclusions
In this work we have presented the first GRMHD simulation of a geometrically thin (), highly tilted () accretion disk around a rapidly spinning BH (), which was threaded by a toroidal magnetic field. The absence of any Blandford & Znajek (1977) jet suggests that this simulation is primarily applicable to the soft-intermediate and high-soft states of BHXRBs (e.g. Fender et al. 2004). The unprecedented resolution of cells allowed us to study the structure and dynamics of the disk with unprecedented accuracy.
We found that the (effective) differential Lense-Thirring torque exerted by the spinning BH on the disk causes the disk to tear times over . During each tearing cycle a subdisk of size forms and starts precessing. The precession of the inner sub-disk is well described as “warped solid body”, with a precession frequency that is given by the nodal precession frequency , where is the tearing radius and the parameter accounts for the moment of inertia in the disk. We find that gives a good match with the measured precession frequencies of Hz. Since the precession frequency remains relatively stable during each tearing cycle, the modulation in flux received from this precessing sub-disk is expected to give rise to coherent LFQPO emission.
In addition, disk tearing drives a global radial epicyclic oscillation of a dense ring of gas at the tearing radius. This translates into two HFQPO signatures in the radial mass flux during tearing cycle E7: A fundamental peak with centroid frequency Hz and quality factor of , alongside a weaker first harmonic overtone with centroid frequency Hz (once scaled to a black hole mass of ). In addition, we find a second HFQPO peak with centroid frequency Hz and no harmonic during tearing cycle E10. In future work we will demonstrate that this radial-epicyclic oscillation indeed translates into an observable HFQPO signature using general relativistic ray-tracing (West, Liska, Musoke et al in prep), and put unique constraints on the viewing angles under which this HFQPO is visible.
The overall lifetime of each tearing cycle is delimited by the accretion timescale of the inner sub-disk. This suggests that the observed low and high frequency QPO emission must be a summation of the quasi-periodic emission generated during separate tearing events and predicts similar coherence intervals for low and high frequency QPOs (e.g. van den Eijnden et al. 2016). Longer duration GRMHD simulations will be necessary to verify that both of these statements are accurate.
In this work we used a simplified prescription (Noble et al., 2009) to artificially cool the disk to the targeted scale-height. This cooling function assumes that Coulomb collisions equilibrate the temperature between ions and electrons, and, thus that the disk can cool efficiently. We note that a more accurate treatment of the radiative processes alongside the inclusion of two-temperature thermodynamics might allow a self-consistent vertical disk structure to form, potentially leading to the generation of a hot (precessing) two-temperature inner torus surrounded by a cool, thin accretion disk (i.e. a ’Truncated’ accretion disk, Esin et al., 1997; Ingram et al., 2009, e.g.). Such a precessing torus could potentially emit hard, Comptonized, radiation. We plan to explore this interesting possibility in future work.
Acknowledgements
An award of computer time was provided by the Innovative and Novel Computational Impact on Theory and Experiment (INCITE) program under award PHY129. This research used resources of the Oak Ridge Leadership Computing Facility, which is a DOE Office of Science User Facility supported under Contract DE-AC05-00OR22725. GM is supported by a Netherlands Research School for Astronomy (NOVA), Virtual Institute of Accretion (VIA) postdoctoral fellowship. ML was supported by the John Harvard Distinguished Science Fellowship. We acknowledge the SURFsara data processing facility SPIDER (Symbiotic Platform(s) for Interoperable Data Extraction and Redistribution) under award EINF 1120 for postprocessing of simulation data. A. I. acknowledges support from the Royal Society. GM, ML and OP thank Alexander Tchekhovskoy, Henric Krawczynski and Andrew West for insightful discussions.
This work has utilised the Stingray Python library for spectral timing: DOI: 10.5281/zenodo.4881255 (Bachetti et al., 2021), LMFIT: Non-Linear Least-Square Minimization and Curve-Fitting for Python package DOI: 10.5281/zenodo.11813, NumPy (Harris et al., 2020), Matplotlib (Hunter, 2007) and SciPy (Virtanen et al., 2020).
Data Availability
Processed simulation data will be made available at DOI:10.5281/zenodo.5830266.
References
- Abramowicz & Kluźniak (2001) Abramowicz M. A., Kluźniak W., 2001, A&A, 374, L19
- Ackermann et al. (2015) Ackermann M., et al., 2015, ApJ, 813, L41
- Antonini et al. (2018) Antonini F., Rodriguez C. L., Petrovich C., Fischer C. L., 2018, MNRAS, 480, L58
- Bachetti et al. (2021) Bachetti M., et al., 2021, StingraySoftware/stingray: Version 0.3. Zenodo, doi:10.5281/zenodo.4881255, https://doi.org/10.5281/zenodo.4881255
- Bardeen & Petterson (1975) Bardeen J. M., Petterson J. A., 1975, ApJ, 195, L65
- Barret et al. (2005) Barret D., Kluźniak W., Olive J. F., Paltani S., Skinner G. K., 2005, MNRAS, 357, 1288
- Beheshtipour et al. (2016) Beheshtipour B., Hoormann J. K., Krawczynski H., 2016, ApJ, 826, 203
- Belloni & Altamirano (2013) Belloni T. M., Altamirano D., 2013, MNRAS, 432, 19
- Belloni & Stella (2014) Belloni T. M., Stella L., 2014, Space Sci. Rev., 183, 43
- Belloni et al. (2006) Belloni T., Soleri P., Casella P., Méndez M., Migliari S., 2006, MNRAS, 369, 305
- Blandford & Znajek (1977) Blandford R. D., Znajek R. L., 1977, MNRAS, 179, 433
- Chakrabarti et al. (2005) Chakrabarti S. K., Nandi A., Debnath D., Sarkar R., Datta B. G., 2005, arXiv e-prints, pp astro–ph/0508024
- Churazov et al. (2001) Churazov E., Gilfanov M., Revnivtsev M., 2001, MNRAS, 321, 759
- Colella & Woodward (1984) Colella P., Woodward P. R., 1984, Journal of Computational Physics, 54, 174
- Cooley & Tukey (1965) Cooley J., Tukey J., 1965, Mathematics of Computation, 19, 297
- Courant et al. (1928) Courant R., Friedrichs K., Lewy H., 1928, Mathematische Annalen, 100, 32
- Dewberry et al. (2020) Dewberry J. W., Latter H. N., Ogilvie G. I., Fromang S., 2020, MNRAS, 497, 435
- Dexter & Blaes (2014) Dexter J., Blaes O., 2014, MNRAS, 438, 3352
- Doǧan et al. (2018) Doǧan S., Nixon C. J., King A. R., Pringle J. E., 2018, MNRAS, 476, 1519
- Esin et al. (1997) Esin A. A., McClintock J. E., Narayan R., 1997, ApJ, 489, 865
- Fender et al. (2004) Fender R. P., Belloni T. M., Gallo E., 2004, MNRAS, 355, 1105
- Fragile & Anninos (2005) Fragile P. C., Anninos P., 2005, ApJ, 623, 347
- Fragile & Blaes (2008) Fragile P. C., Blaes O. M., 2008, ApJ, 687, 757
- Fragile et al. (2001) Fragile P. C., Mathews G. J., Wilson J. R., 2001, ApJ, 553, 955
- Fragile et al. (2007) Fragile P. C., Blaes O. M., Anninos P., Salmonson J. D., 2007, ApJ, 668, 417
- Fragile et al. (2016) Fragile P. C., Straub O., Blaes O., 2016, MNRAS, 461, 1356
- Fragione & Kocsis (2020) Fragione G., Kocsis B., 2020, MNRAS, 493, 3920
- Fragos et al. (2010) Fragos T., Tremmel M., Rantsiou E., Belczynski K., 2010, ApJ, 719, L79
- Gammie et al. (2003) Gammie C. F., McKinney J. C., Tóth G., 2003, ApJ, 589, 444
- Gardiner & Stone (2005) Gardiner T. A., Stone J. M., 2005, Journal of Computational Physics, 205, 509
- Gierliński et al. (2008) Gierliński M., Middleton M., Ward M., Done C., 2008, Nature, 455, 369
- Harris et al. (2020) Harris C. R., et al., 2020, Nature, 585, 357
- Heil et al. (2015) Heil L. M., Uttley P., Klein-Wolt M., 2015, MNRAS, 448, 3348
- Henisey et al. (2009) Henisey K. B., Blaes O. M., Fragile P. C., Ferreira B. T., 2009, ApJ, 706, 705
- Hogg & Reynolds (2016) Hogg J. D., Reynolds C. S., 2016, ApJ, 826, 40
- Homan et al. (2001) Homan J., Wijnands R., van der Klis M., Belloni T., van Paradijs J., Klein-Wolt M., Fender R., Méndez M., 2001, ApJS, 132, 377
- Homan et al. (2005a) Homan J., Miller J. M., Wijnands R., van der Klis M., Belloni T., Steeghs D., Lewin W. H. G., 2005a, ApJ, 623, 383
- Homan et al. (2005b) Homan J., Miller J. M., Wijnands R., van der Klis M., Belloni T., Steeghs D., Lewin W. H. G., 2005b, ApJ, 623, 383
- Hunter (2007) Hunter J. D., 2007, Computing in Science and Engineering, 9, 90
- Ingram & Done (2011) Ingram A., Done C., 2011, MNRAS, 415, 2323
- Ingram & Done (2012) Ingram A., Done C., 2012, MNRAS, 419, 2369
- Ingram & Motta (2019) Ingram A. R., Motta S. E., 2019, New Astronomy Reviews, 85, 101524
- Ingram & van der Klis (2015) Ingram A., van der Klis M., 2015, MNRAS, 446, 3516
- Ingram et al. (2009) Ingram A., Done C., Fragile P. C., 2009, MNRAS: Letters, 397, L101
- Ingram et al. (2016) Ingram A., van der Klis M., Middleton M., Done C., Altamirano D., Heil L., Uttley P., Axelsson M., 2016, MNRAS, 461, 1967
- Jonker & Nelemans (2004) Jonker P. G., Nelemans G., 2004, MNRAS, 354, 355
- Kalamkar et al. (2016) Kalamkar M., Casella P., Uttley P., O’Brien K., Russell D., Maccarone T., van der Klis M., Vincentelli F., 2016, MNRAS, 460, 3284
- Kato (2004) Kato Y., 2004, PASJ, 56, 931
- Kidger et al. (1992) Kidger M., Takalo L., Sillanpaa A., 1992, Astronomy and Astrophysics, Vol. 264, p. 32-36 (1992), 264, 32
- Kluzniak & Abramowicz (2002) Kluzniak W., Abramowicz M. A., 2002, arXiv e-prints, pp astro–ph/0203314
- Kylafis & Reig (2019) Kylafis N. D., Reig P., 2019, in High Energy Phenomena in Relativistic Outflows VII. p. 37 (arXiv:1911.11975)
- Lančová et al. (2019) Lančová D., et al., 2019, ApJ, 884, L37
- Lewin & van der Klis (2010) Lewin W., van der Klis M., 2010, Compact Stellar X-ray Sources. Cambridge Astrophysics Series, https://ui.adsabs.harvard.edu/abs/2010csxs.book.....L
- Liska et al. (2018) Liska M., Hesp C., Tchekhovskoy A., Ingram A., van der Klis M., Markoff S., 2018, MNRAS, 474, L81
- Liska et al. (2019a) Liska M., Hesp C., Tchekhovskoy A., Ingram A., van der Klis M., Markoff S. B., 2019a, arXiv e-prints, p. arXiv:1901.05970
- Liska et al. (2019b) Liska M., et al., 2019b, arXiv e-prints, p. arXiv:1912.10192
- Liska et al. (2019c) Liska M., Tchekhovskoy A., Ingram A., van der Klis M., 2019c, MNRAS, 487, 550
- Liska et al. (2020) Liska M., Tchekhovskoy A., Quataert E., 2020, MNRAS, 494, 3656
- Liska et al. (2021) Liska M., Hesp C., Tchekhovskoy A., Ingram A., van der Klis M., Markoff S. B., Van Moer M., 2021, MNRAS, 507, 983
- Lubow et al. (1994) Lubow S. H., Papaloizou J. C. B., Pringle J. E., 1994, MNRAS, 267, 235
- Marcel et al. (2020) Marcel G., et al., 2020, A&A, 640, A18
- Martin et al. (2010) Martin R. G., Tout C. A., Pringle J. E., 2010, MNRAS, 401, 1514
- Miller & Homan (2005) Miller J. M., Homan J., 2005, ApJ, 618, L107
- Miller et al. (2001) Miller J. M., et al., 2001, ApJ, 563, 928
- Mishra et al. (2019) Mishra B., Kluźniak W., Fragile P. C., 2019, MNRAS, 483, 4811
- Mishra et al. (2020) Mishra B., Kluźniak W., Fragile P. C., 2020, MNRAS, 497, 1066
- Morgan et al. (1997) Morgan E. H., Remillard R. A., Greiner J., 1997, ApJ, 482, 993
- Motta et al. (2014) Motta S. E., Belloni T. M., Stella L., Muñoz-Darias T., Fender R., 2014, MNRAS, 437, 2554
- Motta et al. (2015) Motta S. E., Casella P., Henze M., Muñoz-Darias T., Sanna A., Fender R., Belloni T., 2015, MNRAS, 447, 2059
- Mucciarelli et al. (2006) Mucciarelli P., Casella P., Belloni T., Zampieri L., Ranalli P., 2006, MNRAS, 365, 1123
- Nathan et al. (2022) Nathan E., et al., 2022, arXiv e-prints, p. arXiv:2201.01765
- Nealon et al. (2015) Nealon R., Price D. J., Nixon C. J., 2015, MNRAS, 448, 1526
- Nixon et al. (2012) Nixon C., King A., Price D., Frank J., 2012, ApJ, 757, L24
- Noble et al. (2006) Noble S. C., Gammie C. F., McKinney J. C., Zanna L. D., 2006, The Astrophysical Journal, 641, 626
- Noble et al. (2009) Noble S. C., Krolik J. H., Hawley J. F., 2009, ApJ, 692, 411
- Nowak & Lehr (1998) Nowak M. A., Lehr D. E., 1998, in Abramowicz M. A., Björnsson G., Pringle J. E., eds, Theory of Black Hole Accretion Disks. pp 233–253 (arXiv:astro-ph/9812004)
- Nowak & Wagoner (1991) Nowak M. A., Wagoner R. V., 1991, ApJ, 378, 656
- Nowak & Wagoner (1993) Nowak M. A., Wagoner R. V., 1993, ApJ, 418, 187
- O’Neill et al. (2009) O’Neill S. M., Reynolds C. S., Miller M. C., 2009, ApJ, 693, 1100
- Okazaki et al. (1987) Okazaki A. T., Kato S., Fukue J., 1987, PASJ, 39, 457
- Pasham et al. (2019) Pasham D. R., et al., 2019, Science, 363, 531
- Raj et al. (2021) Raj A., Nixon C. J., Doğan S., 2021, ApJ, 909, 81
- Remillard & McClintock (2006) Remillard R. A., McClintock J. E., 2006, ARA&A, 44, 49
- Remillard et al. (1999) Remillard R. A., Morgan E. H., McClintock J. E., Bailyn C. D., Orosz J. A., 1999, ApJ, 522, 397
- Remillard et al. (2002a) Remillard R. A., Sobczak G. J., Muno M. P., McClintock J. E., 2002a, ApJ, 564, 962
- Remillard et al. (2002b) Remillard R. A., Muno M. P., McClintock J. E., Orosz J. A., 2002b, ApJ, 580, 1030
- Remillard et al. (2003) Remillard R., Muno M., McClintock J. E., Orosz J., 2003, in Durouchoux P., Fuchs Y., Rodriguez J., eds, New Views on Microquasars. p. 57 (arXiv:astro-ph/0208402)
- Remillard et al. (2006) Remillard R. A., McClintock J. E., Orosz J. A., Levine A. M., 2006, ApJ, 637, 1002
- Rezzolla et al. (2003) Rezzolla L., Yoshida S., Maccarone T. J., Zanotti O., 2003, MNRAS, 344, L37
- Salvesen & Pokawanvit (2020) Salvesen G., Pokawanvit S., 2020, MNRAS, 495, 2179
- Schnittman & Bertschinger (2004) Schnittman J., Bertschinger E., 2004, in Kaaret P., Lamb F. K., Swank J. H., eds, American Institute of Physics Conference Series Vol. 714, X-ray Timing 2003: Rossi and Beyond. pp 40–43 (arXiv:astro-ph/0312406), doi:10.1063/1.1780996
- Schnittman et al. (2006) Schnittman J. D., Krolik J. H., Hawley J. F., 2006, ApJ, 651, 1031
- Sibgatullin (2001) Sibgatullin N. R., 2001, Astronomy Letters, 27, 799
- Smith et al. (2021) Smith K. L., Tandon C. R., Wagoner R. V., 2021, ApJ, 906, 92
- Stella & Vietri (1998) Stella L., Vietri M., 1998, ApJ, 492, L59
- Stella et al. (1999) Stella L., Vietri M., Morsink S. M., 1999, ApJ, 524, L63
- Stevens & Uttley (2016) Stevens A. L., Uttley P., 2016, MNRAS, 460, 2796
- Strohmayer (2001a) Strohmayer T. E., 2001a, ApJ, 552, L49
- Strohmayer (2001b) Strohmayer T. E., 2001b, ApJ, 554, L169
- Stuchlík et al. (2006) Stuchlík Z., Kotrlová A., Török G., 2006, ApJ, 637, 1002
- Tagger & Pellat (1999) Tagger M., Pellat R., 1999, A&A, 349, 1003
- Török et al. (2005) Török G., Abramowicz M. A., Kluźniak W., Stuchlík Z., 2005, A&A, 436, 1
- Török et al. (2011) Török G., Kotrlová A., Šrámková E., Stuchlík Z., 2011, A&A, 531, A59
- Veledina et al. (2013) Veledina A., Poutanen J., Ingram A., 2013, ApJ, 778, 165
- Virtanen et al. (2020) Virtanen P., et al., 2020, Nature Methods, 17, 261
- Volonteri et al. (2005) Volonteri M., Madau P., Quataert E., Rees M. J., 2005, ApJ, 620, 69
- Wagoner et al. (2001) Wagoner R. V., Silbergleit A. S., Ortega-Rodríguez M., 2001, ApJ, 559, L25
- Zhang & Wang (2021) Zhang P., Wang Z., 2021, ApJ, 914, 1
- de Avellar et al. (2018) de Avellar M. G. B., Porth O., Younsi Z., Rezzolla L., 2018, MNRAS, 474, 3967
- van den Eijnden et al. (2016) van den Eijnden J., Ingram A., Uttley P., 2016, MNRAS, 458, 3655
- van den Eijnden et al. (2017) van den Eijnden J., Ingram A., Uttley P., Motta S. E., Belloni T. M., Gardenier D. W., 2017, MNRAS, 464, 2643
- van der Klis (2006) van der Klis M., 2006, Advances in Space Research, 38, 2675
- van der Klis et al. (1985) van der Klis M., Jansen F., van Paradijs J., Lewin W. H. G., van den Heuvel E. P. J., Trumper J. E., Szatjno M., 1985, Nature, 316, 225
Appendix A QPOs in tearing cycle E10
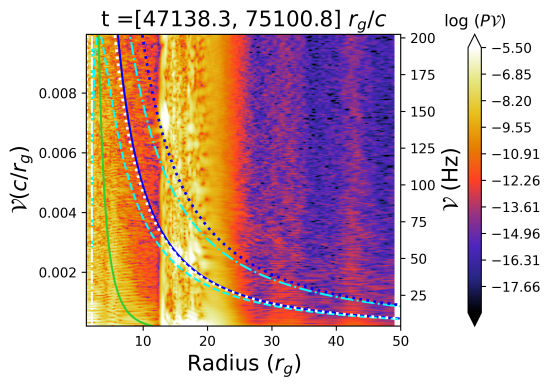
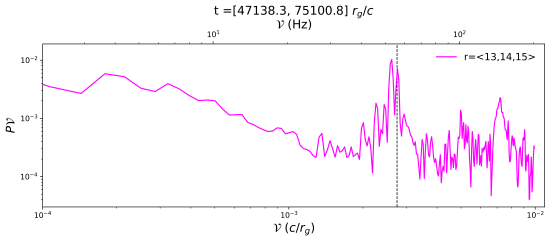
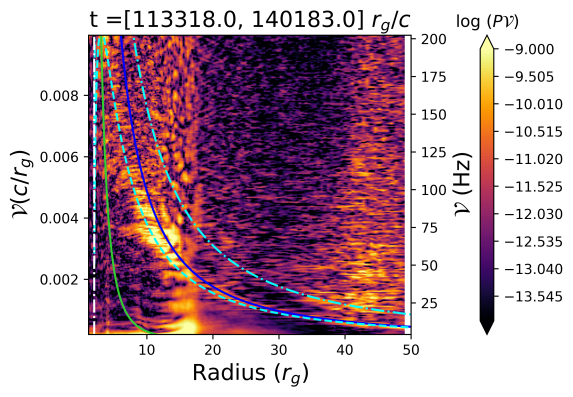
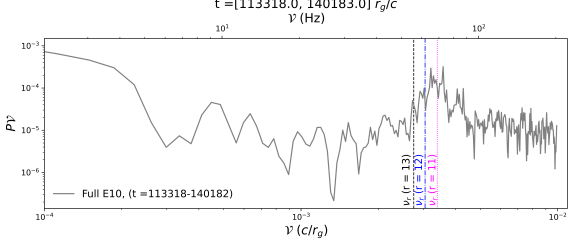
In Figure 11 we show PSDs computed during tearing cycle E10 () listed in Table 1. In the top panel of Figure 11 we find a region of enhanced power on the radial epicyclic frequency curve (dashed cyan) at a location of with a frequency of Hz. This feature corresponds to a HFQPO peak with a centroid frequency Hz as shown on the power spectrum in the bottom panel of Figure 11 which shows the power spectrum averaged over three discrete radii and . These radii correspond to locations at or near the position of the tearing radius during the time period in which the HFQPO is present in tearing cycle E10. The HFQPO peak in cycle E10 is broader and, since it is triggered at a smaller radius, has a higher frequency than the Hz HFQPO found in cycle E7 (Figure 6). During the time period in which the HFQPO is triggered in cycle E10 the tearing radius remains roughly fixed at and the centroid frequency of the peak roughly corresponds to the radial epicyclic frequency at , as shown by the vertical dashed magenta curve in the bottom panel of Figure 11. We note that the simulation ends before tearing cycle E10 is complete.
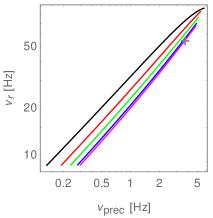
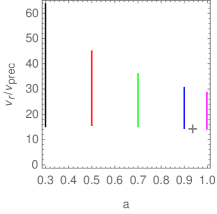
Appendix B Simultaneous low- and high-frequency QPOs and black hole spin
In this paper we have argued that disk tearing can give rise to both LFQPO (due to relativistic precession of the inner sub-disk) and HFQPO (due to epicyclic motion at the edge of the inner sub-disk).
For a given black hole mass, this implies a relation between the two types of QPOs that only depends on the angular momentum of the inner sub-disk and the black hole spin. In Figure 12, we show the frequencies for a range of black hole spin against the tearing radius. Since the HFQPO often occur in pairs with frequency ratio 2:3, we give two HFQPO curves (dotted) corresponding to 2x and 3x the radial epicyclic frequency . The precession frequency follows from the angular momentum distribution of the inner sub-disk which in principle can be extracted from the simulations. For illustrative purposes, here we simply follow Ingram et al. (2009) and model the disk with surface density , , inner radius and adopt (see Ingram et al. (2009) for a discussion of these parameters). The HFQPO depend very little on spin and range from for tearing radii between and .
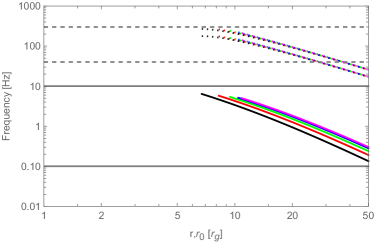
Under these assumptions, when the black hole mass is known, a simultaneous determination of and will uniquely determine the black hole spin as illustrated in the left panel of Figure 13. The constraint is however less strong if the black hole mass is unknown. This is illustrated in the right panel of Figure 13 which shows the adopted frequency ratios as function of the black hole spin for tearing radii . It is evident from the figure that certain values of are incompatible with certain black hole spins. For example, rules out all spins above . Setting a prior on black hole mass will further tighten this constraint for a given set of observed frequencies.
Appendix C Ancillary PSDs for tearing cycle E7
Here we present PSDs of complementary quantities for cycle E7. In principle, an inspection of the PSDs for different quantities (e.g. density, pressure and out-of-plane velocity) can help in identifying the (discoseismic-) modes, however such an investigation is beyond the scope of this work. Figures 14 and 15 show PSDs of the averaged density for the same time interval as in the upper and middle panels of Figure 5. In addition to the characteristic frequency curves shown in Figure 5 we also overplot the vertical epicyclic frequency (e.g. Nowak & Lehr, 1998) given by
| (7) |
Figures 16 and 17 give the corresponding PSDs of the scale height. Overall, the PSDs are similar to the PSD of discussed in Section 3.3, most importantly the signal is visible in all quantities we have checked. However it is also apparent that the spectra shown here seem to have stronger harmonics at two times the Keplerian frequency. A more detailed investigation is left for future work.