Tc-rich M stars: platypuses of low-mass star evolution
Abstract
The technetium-rich (Tc-rich) M stars reported in the literature ([Little-Marenin & Little (1979)]; [Uttenthaler et al. (2013)]) are puzzling objects since no isotope of technetium has a half-life longer than a few million years, and 99Tc, the longest-lived isotope along the s-process path, is expected to be detected only in thermally-pulsing stars enriched with other s-process elements (like zirconium). Carbon should also be enriched, since it is dredged up at the same time, after each thermal pulse on the asymptotic giant branch (AGB). However, these Tc-enriched objects are classified as M stars, meaning that they neither have any significant zirconium enhancement (otherwise they would be tagged as S-type stars) nor any large carbon overabundance (in which case they would be carbon stars).
Here we present the first detailed chemical analysis of a Tc-rich M-type star, namely S Her. We first confirm the detection of the Tc lines, and then analyze its carbon and s-process abundances, and draw conclusions on its evolutionary status. Understanding these Tc-rich M stars is an important step to constrain the threshold luminosity for the first occurrence of the third dredge-up and the composition of s-process ejecta during the very first thermal pulses on the AGB.
keywords:
Stars: abundances – Stars: AGB and post-AGB – Hertzsprung-Russell and C-M diagrams – Nuclear reactions, nucleosynthesis, abundances – Stars: interiors1 Introduction
The resonance lines of the radioactive element technetium (Tc) (i.e., having no stable isotopes) were first identified in several S-type stars by [Merrill (1952)]. The isotope 99Tc is the only one to be located along the path of the slow neutron-capture nucleosynthesis (s-process) occurring in the interior of asymptotic giant branch (AGB) stars. 99Tc has a half-life of about 2 x 10⁵ yr. Along with carbon and other s-process elements, 99Tc is brought to the surface of AGB stars by a mixing process called the third dredge-up (TDU; Iben & Renzini 1983). The detection of Tc in some – but not all – S stars led to the discovery that these evolved stars come in two flavors: the Tc-rich stars (also known as ‘intrinsic’ S stars) are genuine thermally-pulsing AGB stars, while the Tc-poor stars111More information on Tc-poor S stars can be found in [Jorissen et al. (1988), Jorissen et al. (1993), Jorissen et al. (1988, 1993)], [Van Eck et al. (1999), Van Eck et al. (2000b), Van Eck & Jorissen (1999, 2000b)], [Van Eck et al. (2000a)] and [Shetye et al. (2018)]. (also known as ‘extrinsic’ S stars) owe their s-process enhancement to a binary interaction with a former AGB companion ([Iben & Renzini (1983), Iben & Renzini 1983], [Jorissen et al. (1993), Jorissen et al. 1993]). Hence, the presence of Tc is a very sensitive probe of the TDU and AGB nucleosynthesis.
Stars experiencing the TDU are expected to show at their surface an amount of carbon and of s-process elements increasing with the number of thermal pulses and should evolve according to the spectral sequence M MS S SC C stars. The spectral classification from M to S is based on the identification in M stars of TiO bands only and of TiO and ZrO bands in S-type stars (where Zr originates from the s-process enhancement). The Tc-rich nature of some Mira variables of spectral type M was discovered by [Little-Marenin & Little (1979)] and [Little et al. (1987)]. The Tc-rich M stars constitute an interesting group of stars because they show clear signatures of Tc but no presence of ZrO bands. Hence, the Tc-rich M stars could be the first objects on the AGB to undergo a TDU, where the Tc can be detected in the spectrum before enhancements of other s-process elements become measurable ([Goriely & Mowlavi (2000)]).
Despite their importance, a detailed spectroscopic investigation of the Tc-rich M stars is still lacking. The spectroscopic investigation of a large-sample of M stars is currently on-going, and will be published in a forthcoming paper (Shetye et al.. in prep.). In the current work, we discuss the pilot study of the Tc-rich M star S Her. S Her was first identified as a Tc-rich MS star by [Little et al. (1987)]. [Keenan et al. (1974)] classified it as M4-7.5Se. In the current work, we confirm the presence of Tc from a high-resolution spectrum of S Her. We then examine its s-process element abundances and report our findings in Section 3.
2 Spectral Analysis
We collected high-resolution spectra of S Her with the HERMES spectrograph ([Raskin et al. (2011), Raskin et al. 2011]) mounted on the 1.2m Mercator Telescope at the Roque de Los Muchachos Observatory, La Palma (Canary Islands). HERMES spectra have a spectral resolution of R = 85 000 and a wavelength coverage 380–900 nm. The HERMES spectra of S Her used in the current analysis have a signal-to-noise ratio of 60 in the band to ensure the accurate determination of the stellar parameters and of the chemical abundances. It is important to keep in mind that the Tc-rich Mira M stars experience severe stellar variability, making their spectral analysis difficult with 1D, static model atmospheres. According to the AAVSO222https://www.aavso.org/ International Database, S Her has a peak-to-peak variability in the band of roughly 5 magnitudes.
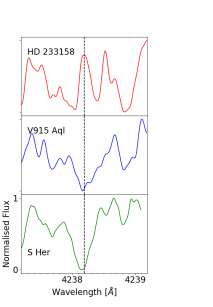
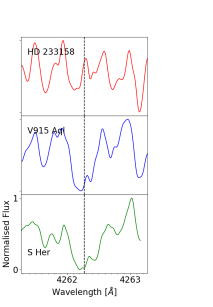
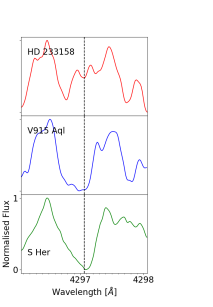
The initial step in the spectral analysis of S Her was to confirm the presence of Tc in its spectrum. We used the three Tc I resonance lines located at 4238.19, 4262.27 and 4297.06 Å. In Figure 1, we compare the three Tc lines of S Her with an extrinsic (top panel) as well as an intrinsic (middle panel) S star from [Shetye et al. (2021)]. From Figure 1, we report an unambiguous detection of Tc in the spectrum of S Her, hence making it a good candidate for our case study of Tc-rich M stars.
The stellar parameters of S Her are determined using the method described in [Shetye et al. (2018)]. This method was developed for the stellar-parameter derivation of S stars and was applied on a large sample of Tc-rich S stars ([Shetye et al. (2019), Shetye et al. (2020), Shetye et al. (2021), Shetye et al. 2019, 2020, 2021]). We refer the reader to [Shetye et al. (2018)] for details. In summary, this method compares the high-resolution HERMES spectra to a grid of synthetic S-star MARCS model spectra ([Van Eck et al. (2017), Van Eck et al. 2017]). This grid spans a large range in effective temperatures, in surface gravities, and most importantly in the carbon/oxygen ratios and the s-process enhancement levels, the latter two being relevant parameters since they impact significantly thermally-pulsing AGB star spectra. Furthermore, we located S Her in a color-color diagram using the photometric indices and as described in Section 3 and Figure 5 of [Van Eck et al. (2017)]. This photometric estimate of the stellar parameters is consistent with the spectroscopic one. The adopted parameters are listed in Table 1.
We used the atomic line lists provided by [Shetye et al. (2018), Shetye et al. (2021), Shetye et al. (2018, 2021)] for the investigation of s-process abundances in S Her. The results of the abundance analysis of a selection of heavy elements are described in the next section.
| Teff | log g | [Fe/H] | C/O | [s/Fe] | |
| (K) | (dex) | (dex) | (dex) | (L⊙) | |
| 2700 | 0.0 | 0.0 | 0.5 | 1.0 | 4200 |
Notes:
1 The method to derive the atmospheric parameters is described in Section 2.
2 The luminosity was derived using the Gaia eDR3 parallax and the same method as described in [Shetye et al. (2018), Shetye et al. (2021), Shetye et al. (2018, 2021)].
3 Implications
3.1 The chemical status of S Her
According to Figure 1, S Her is undoubtedly a Tc-rich M star. The detection of Tc is an unambiguous evidence for the occurrence of the third dredge-up and s-process nucleosynthesis. The presence of Tc in AGB stars undergoing TDU episodes is usually accompanied by an overabundance in other s-process elements. Even though S Her shows clear Tc lines, our analysis could not detect any enrichment in other s-process elements. The match between the observed and synthetic spectra in many spectral windows is however far too bad to derive abundances. Conversely, in the wavelength regions where the match is acceptable, there are either very few s-process lines present or they are not good abundance probes given the low temperature of S Her. In conclusion, the low temperature of S Her and its large stellar variability make the derivation of s-process abundances extremely challenging (even almost impossible!).
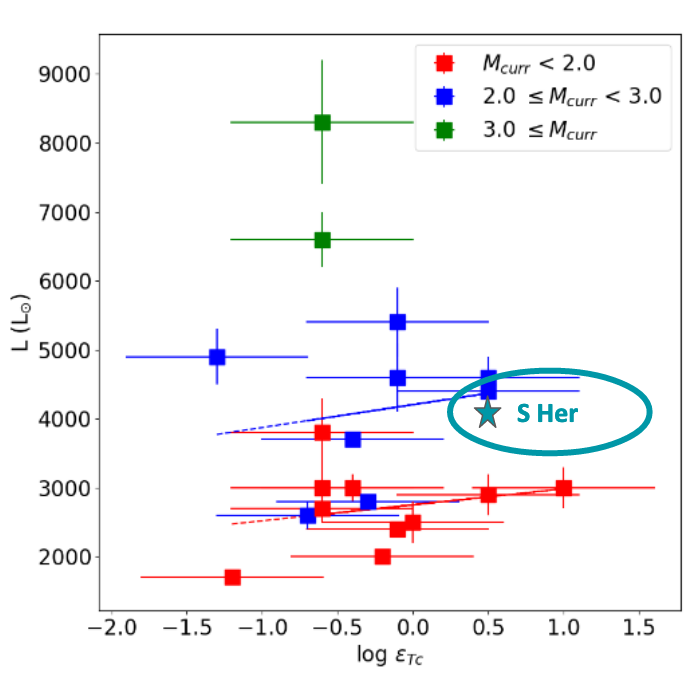
The spectral window including the Tc line regions is well reproduced by the synthetic spectra. We used the 4262.27 Å Tc I line to derive the Tc abundance. This line is the least blended line amongst the three available Tc lines ([Little-Marenin & Little (1979), Little-Marenin et al. 1979]; [Shetye et al. (2021), Shetye et al. 2021]). We derived an upper limit of log +0.5 dex on the Tc abundance of S Her. In Figure 2, we compare the location of S Her in the luminosity vs Tc abundance diagram from [Shetye et al. (2021)]. Surprisingly, this upper limit for the Tc abundance in the M star S Her is comparable with the highest Tc abundances encountered in S-type stars from the sample of [Shetye et al. (2021)].
3.2 S Her and R Dor
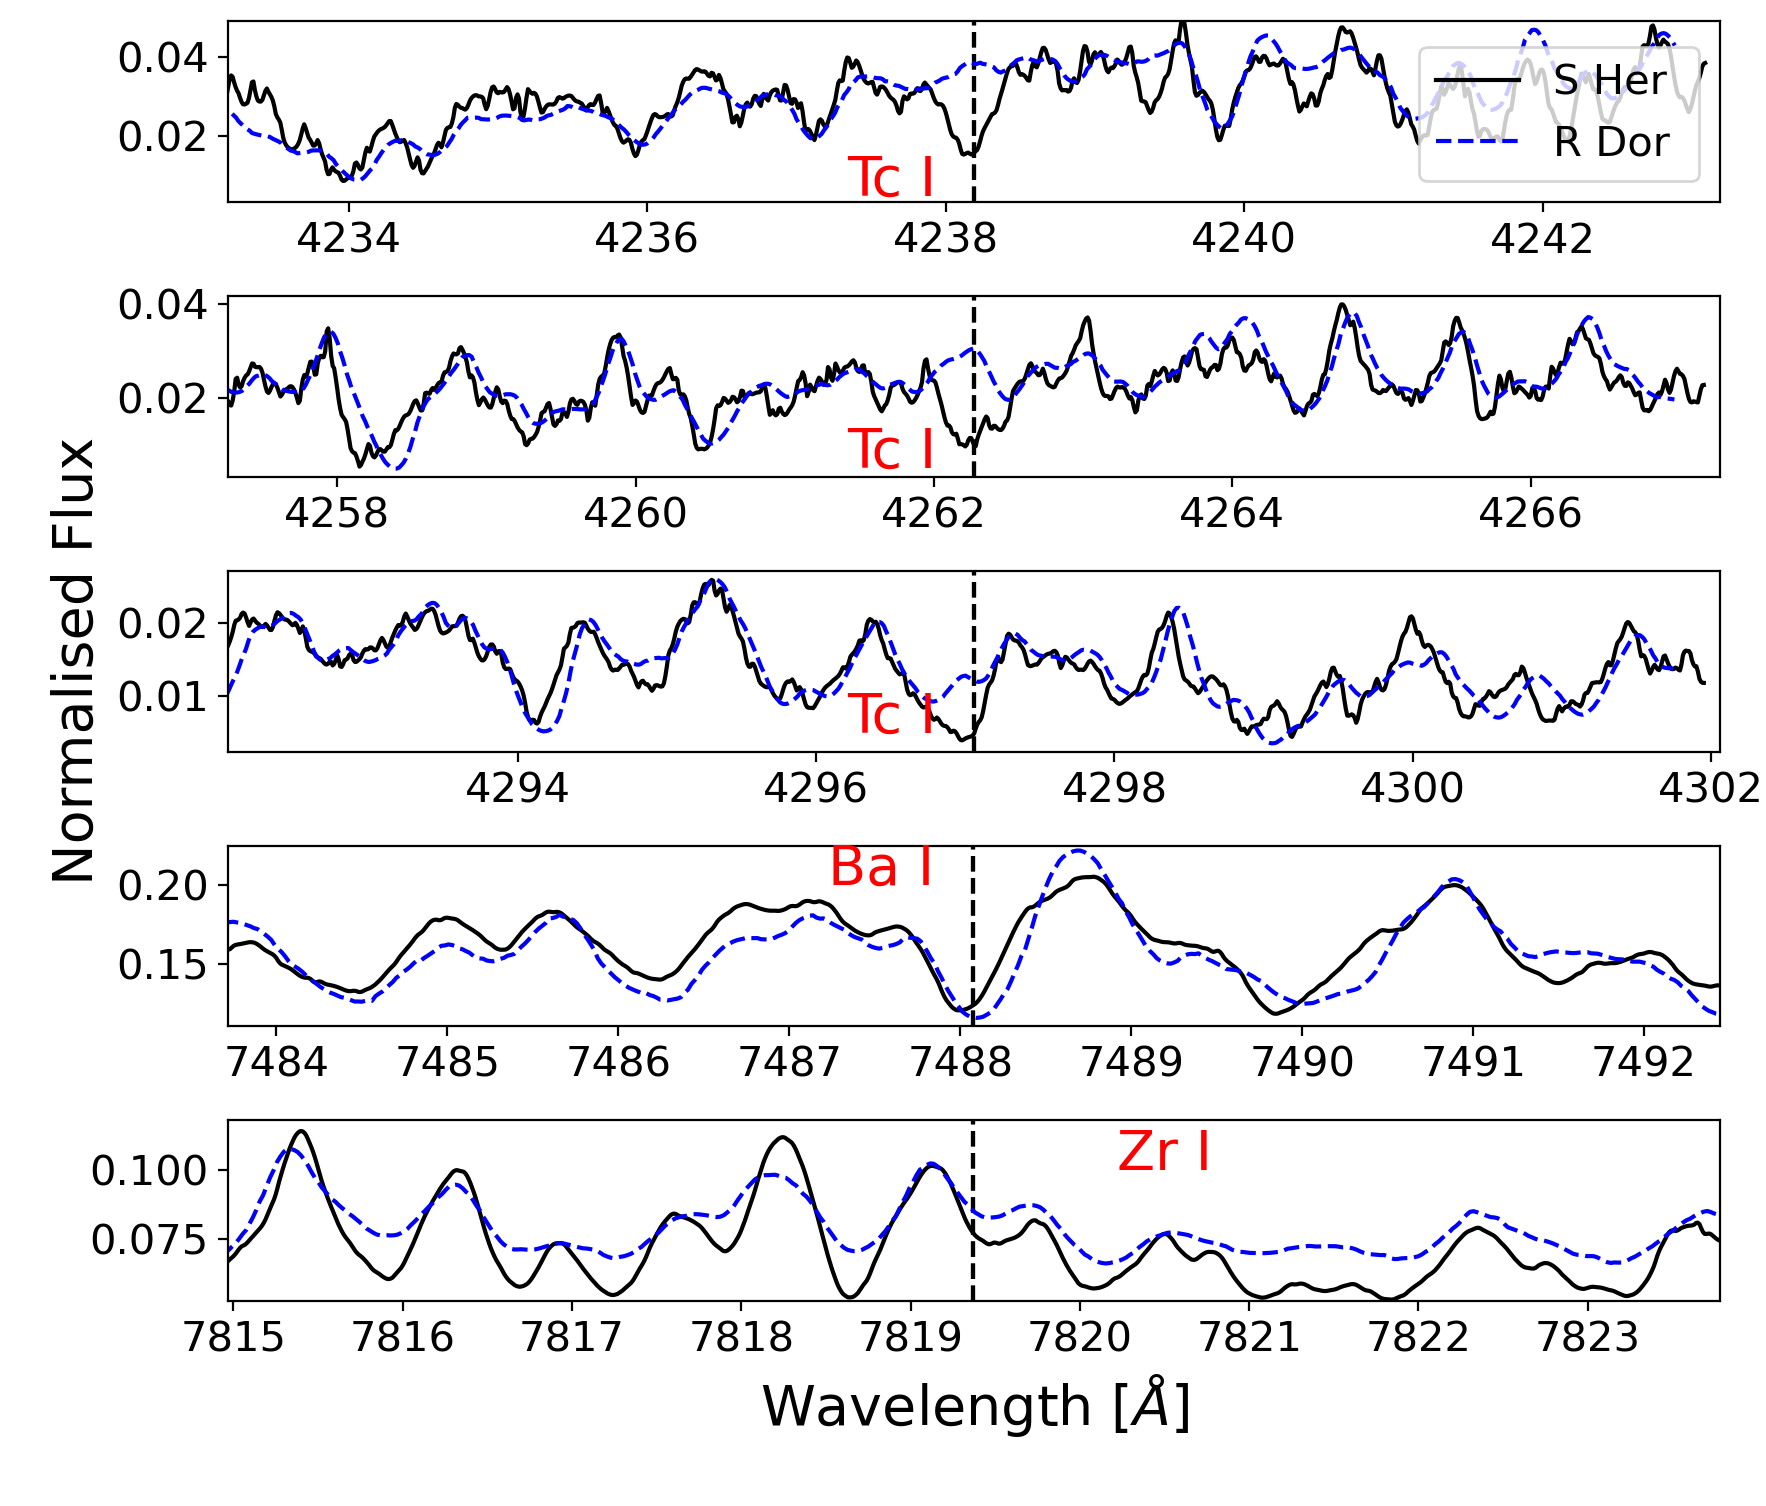
Considering the above-mentioned difficulties faced by spectral synthesis to derive abundances we decided to consider a differential analysis instead. We looked for an M-type giant star with properties similar to those of S Her (mainly in terms of its effective temperature and variability). We found that the stellar parameters of R Dor, classified as M8III:e by [Keenan & McNeil (1989)], are very similar to those of S Her. The UVES333https://www.eso.org/sci/observing/tools/uvespop/interface.html spectrum of R Dor shows exceptional resemblance with that of S Her, according to Figure 3 which compares lines from Tc and other s-process elements in R Dor and S Her. From the first three panels of Figure 3, it is obvious that the spectra of R Dor and S Her are identical except for the Tc lines. As shown above, S Her is clearly a Tc-rich M star while R Dor is not Tc-rich. For Ba and Zr lines, the difference is not as clear (panels 4 and 5 of Figure 3). We also inspected some r-process element lines and found no clear difference either between R Dor and S Her.
4 Prospects
The Tc-rich M stars constitute an intriguing class of AGB stars. It remains difficult to decide whether the non-detection of overabundances for other s-process elements (apart from Tc) in S Her is spurious and results from the complexity of optical spectra of Mira variables or if Tc-rich M stars are truly AGB stars caught just after their first thermal pulse and with no s-process signature other than the presence of Tc. Nevertheless, Tc-rich M stars might carry clues about the luminosity of the first occurrence of the TDU and its dependence on the mass and metallicity of the stars. But such clues remain to be unfolded.
In the future, investigating the Tc-rich M stars should proceed along the following avenues:
- Going to infrared spectroscopy
The optical spectra of oxygen-rich AGB stars are dominated by molecules making the atomic diagnostics quite difficult. The near-infrared regions have been successfully used for the chemical analysis of AGB stars ([Smith & Lambert (1985), Smith & Lambert (1990), Smith & Lambert 1985, 1990]). It will be interesting to study the near-IR spectral windows, with the goal of finding some s-process lines as well as getting constraints on the carbon isotopic ratio. A combined study of optical (for Tc) and infrared spectra
thus appears
essential.
- Large-scale chemical investigation of Tc-rich M stars
The chemical
pattern of S Her
is quite puzzling. The presence of Tc without
any other s-process overabundances might either be a special characteristic of S Her or be common among Tc-rich M stars. Hence, a large-scale study of M stars (Shetye et al., in prep.) will
be important to check for a possible diversity among the Tc-rich M stars.
Furthermore, the derived chemical abundances of such a sample of Tc-rich M stars can be used for a quantitative comparison between observations and stellar evolution models.
- A spectroscopic investigation using non-static AGB model atmospheres
The current poor agreement between the synthetic and observed spectra of Tc-rich M stars could be resolved by making use of non-static AGB models. In the future, abundance analysis using 3D hydrodynamic models should be attempted.
Acknowledgements
LS and SG are FNRS senior research associates. SVE thanks Fondation ULB for its support. Based on observations obtained with the Mercator Telescope and the HERMES spectrograph, which is supported by the Research Foundation – Flanders (FWO), Belgium, the Research Council of KU Leuven, Belgium, the Fonds National de la Recherche Scientifique (F.R.S.-FNRS), Belgium, the Royal Observatory of Belgium, the Observatoire de Genève, Switzerland and the Thüringer Landessternwarte Tautenburg, Germany.
References
- [Goriely & Mowlavi (2000)] Goriely, S. and Mowlavi, N. 2000, A&A, 362, 599G
- [Iben & Renzini (1983)] Iben, I., Jr. and Renzini, A. 1983, ARA&A, 21, 271I
- [Jorissen et al. (1988)] Jorissen, A. and Mayor, M. 1988, A&A, 198, 187J
- [Jorissen et al. (1993)] Jorissen, A., Frayer, D. T., Johnson, H. R., Mayor, M. & Smith, V. V. 1993, A&A, 271, 463J
- [Keenan et al. (1974)] Keenan, P. C., Garrison, R. F., & Deutsch, A. J. 1974, ApJS, 28, 271
- [Keenan & McNeil (1989)] Keenan, P. C. & McNeil, R. C. 1989, ApJS, 71, 245
- [Little-Marenin & Little (1979)] Little-Marenin, I. R. and Little, S. J. 1979, AJ, 84, 1374L
- [Little et al. (1987)] Little, S. J., Little-Marenin, I. R., & Bauer, W. H. 1987, AJ, 94, 981L
- [Merrill (1952)] Merrill, P. W. 1952, ApJ, 116, 21M
- [Raskin et al. (2011)] Raskin, G., van Winckel, H., Hensberge, H., Jorissen, A., Lehmann, H., Waelkens, C., Avila, G., de Cuyper, J. -P., Degroote, P., Dubosson, R., Dumortier, L., Frémat, Y., Laux, U., Michaud, B., Morren, J., Perez Padilla, J., Pessemier, W., Prins, S., Smolders, K., van Eck, S., & Winkler, J. 2011, A&A, 526A, 69R
- [Shetye et al. (2018)] Shetye, S., Van Eck, S., Jorissen, A., Van Winckel, H., Siess, L., Goriely, S., Escorza, A., Karinkuzhi, D., & Plez, B. 2018, A&A, 620A, 148S
- [Shetye et al. (2019)] Shetye, S., Goriely, S., Siess, L., Van Eck, S., Jorissen, A. & Van Winckel, H. 2019, A&A, 625L, 1S
- [Shetye et al. (2020)] Shetye, S., Van Eck, S., Goriely, S., Siess, L., Jorissen, A., Escorza, A., & Van Winckel, H. 2020, A&A, 635L, 6S
- [Shetye et al. (2021)] Shetye, S., and Van Eck, S., Jorissen, A., Goriely, S., Siess, L., Van Winckel, H., Plez, B., Godefroid, M., & Wallerstein, G. 2021, A&A, 650A, 118S
- [Smith & Lambert (1985)] Smith, V. V. and Lambert, D. L. 1985, ApJ, 294, 326S
- [Smith & Lambert (1990)] Smith, V. V. and Lambert, D. L. 1990, ApJ, 294, 326S
- [Uttenthaler et al. (2013)] Uttenthaler, S. 2013, A&A, 556A, 38U
- [Van Eck et al. (1999)] Van Eck, S. and Jorissen, A. 1999, A&A, 345, 127V
- [Van Eck et al. (2000a)] Van Eck, S. and Jorissen, A. and Udry, S. and Mayor, M. and Burki, G. and Burnet, M. & Catchpole, R. 2000a, A&AS, 145, 51V
- [Van Eck et al. (2000b)] Van Eck, S. and Jorissen, A. 2000b, A&A, 360, 196V
- [Van Eck et al. (2017)] Van Eck, S., Neyskens, P., Jorissen, A., Plez, B., Edvardsson, B., Eriksson, K., Gustafsson, B., Jørgensen, & Nordlund, A. 2018, A&A, 601A, 10V