A survey of high- galaxies: SERRA simulations
Abstract
We introduce serra, a suite of zoom-in high-resolution (, at ) cosmological simulations including non-equilibrium chemistry and on-the-fly radiative transfer. The outputs are post-processed to derive galaxy UV+FIR continuum and emission line properties. Results are compared with available multi-wavelength data to constrain the physical properties (e.g., star formation rates, stellar/gas/dust mass, metallicity) of high-redshift galaxies. This flagship paper focuses on the sub-sample, including 202 galaxies with stellar mass , and specific star formation ranging from in young, low-mass galaxies to for older, massive ones. At this redshift, serra galaxies are typically bursty, i.e. they are located above the Schmidt-Kennicutt relation by a factor , consistent with recent findings for [O ] and [C ] emitters at high-. They also show relatively large IRX values as a result of their compact/clumpy morphology effectively blocking the stellar UV luminosity. Note that this conclusion might be affected by insufficient spatial resolution at the molecular cloud level. We confirm that early galaxies lie on the standard [C ] relation; their observed ratios can be reproduced by a part of the serra galaxies without the need of a top-heavy IMF and/or anomalous C/O abundances. [O ] line intensities are similar to local ones, making ALMA high- detections challenging but feasible ( for an SFR of ).
keywords:
galaxies: high-redshift, formation, evolution, ISM – infrared: general – methods: numerical1 Introduction
Understanding the properties of galaxies in the Epoch of the Reionization (EoR, redshift ) is an urgent quest in modern physical cosmology. In the last decades, optical/near infrared (IR) surveys have been used to identify galaxies, measure their star formation rates, and follow their stellar mass build-up up to (Dunlop, 2013; Bouwens et al., 2015; Oesch et al., 2018). These data, in turn, inform cosmic reionization and metal enrichment models (see Dayal & Ferrara, 2018; Maiolino & Mannucci, 2019, for recent reviews).
Despite such magnificent progress, we know very little about a key component of the galactic ecosystem, i.e. the interstellar medium (ISM) of the early, “normal”, star-forming () galaxy population. While James Webb Space Telescope (JWST) is about to give us access to the strong emission lines typically used to characterise the ISM properties at low- (e.g. Kewley & Dopita, 2002; Curti et al., 2017), possibly augmented by machine learning analysis techniques (Ucci et al., 2019), a complementary approach consists of using Far Infrared (FIR) lines.
The Atacama Large Millimeter/submillimeter Array (ALMA) has enabled such exploration, in particular by exploiting the prominent (Stacey et al., 1991) [C ] m line. The earliest investigations of targets reported a mix of upper limits (Ouchi et al., 2013; Kanekar et al., 2013; Ota et al., 2014; Schaerer et al., 2015) and detections (Capak et al., 2015; Maiolino et al., 2015; Watson et al., 2015; Willott et al., 2015). After such pioneering stage, [C ] is now routinely observed both in Lyman Break Galaxy (LBG, Carniani et al., 2017, 2018a; Smit et al., 2018; Hashimoto et al., 2019; Bakx et al., 2020), Lyman Alpha Emitters (LAE, Matthee et al., 2017; Carniani et al., 2018b; Harikane et al., 2018), and in gravitationally lensed, low mass objects (Pentericci et al., 2016; Knudsen et al., 2016; Bradac et al., 2017). Today, FIR surveys containing hundreds of galaxies are being produced and analysed, both at just after ( Le Fèvre et al., 2020, alpine) and well within ( Bouwens et al., 2021, rebels) the EoR.
Locally, it has been shown (e.g. Cormier et al., 2015) that [C ] traces essentially all ISM phases (cold/warm neutral, ionized) thus carrying very valuable and diverse information (see also Olsen et al., 2018). Initially, the comparison between EoR (Carniani et al., 2018a; Schaerer et al., 2020) and local (De Looze et al., 2014; Herrera-Camus et al., 2015, 2018) data has mostly concentrated on the [C ]-SFR relation. Theoretical works followed the same path, by focusing on the interpretation of such relation and its connection with the burstiness of the star formation process (Ferrara et al., 2019; Pallottini et al., 2019; Vallini et al., 2020), parameterized via a deviation from the locally observed Schmidt-Kennicutt (Schmidt, 1959; Kennicutt, 1998) relation, and/or other parameters such as the ISM metallicity, density and interstellar radiation field (Vallini et al., 2013, 2015; Katz et al., 2017; Olsen et al., 2017; Pallottini et al., 2017a, b; Popping et al., 2019).
The investigation of early galaxies via [C ] line has nevertheless brought some genuine surprises, the most conspicuous of which is the detection of extended (up to 10 kpc) [C ] halos around these sources. Such halos have been first discovered in stacking experiments (Fujimoto et al., 2019; Ginolfi et al., 2020), and later confirmed individually in the most massive galaxies of the alpine sample (Fujimoto et al., 2020). A tantalising explanation of this feature is that [C ] halos are created by supernovae- and/or AGN-driven outflows (Pizzati et al., 2020) transporting carbon and other heavy elements in the circumgalactic medium. Notably, the [C ] line in these sources often shows extended wings produced by fast outflowing gas (Gallerani et al., 2018; Ginolfi et al., 2020).
We finally mention that [C ] observations are becoming deep enough to perform kinematic analysis (Jones et al., 2017; Smit et al., 2018; Schaerer et al., 2020), and interpreting via sophisticated models (Kohandel et al., 2019, 2020): accurate rotation curves might allow us to set constraints on the role and amount of dark matter in these objects.
Given the multi-component origin of the [C ] emission, complementary probes arising from a specific ISM phase are very valuable. Fortunately, the [O ] m, uniquely tracing dense ionised regions of the ISM, is observable and comes into rescue. Searches for such line (Inoue et al., 2016a; Carniani et al., 2017; Laporte et al., 2017a; Tamura et al., 2019; Hashimoto et al., 2019; Carniani et al., 2020) have motivated interpretations of the observed morphological differences with respect to [C ] (Pallottini et al., 2019; Carniani et al., 2020; Harikane et al., 2020; Arata et al., 2020), and its use as a proxy for metallicity (Olsen et al., 2015; Inoue et al., 2016a; Vallini et al., 2017).
The molecular gas content and InterStellar Radiation Field (ISRF) can instead be probed via CO roto-vibrational lines (Vallini et al., 2018; Vallini et al., 2019). High- CO lines can also be used to explore the possible presence of X-ray sources and shocks in these galaxies (Gallerani et al., 2014; Vallini et al., 2019). However, CO emission is faint and it has only been detected in few EoR objects (Pavesi et al., 2019; D’Odorico et al., 2018), sometimes in a serendipitous manner (Feruglio et al., 2018).
As for the dust FIR continuum emission, it entails considerable uncertainties as the dust mass and temperature are degenerate and often hard to determine in high- sources (e.g. Fudamoto et al., 2020; Faisst et al., 2020). Available ALMA observations sample the FIR regime with very few data points (sometimes even a single one) making it hard to break the degeneracy. Some theoretical works predict that dust should be warmer at high- (Behrens et al., 2018; Liang et al., 2019; Sommovigo et al., 2020, 2021; Di Mascia et al., 2021); others claim that dust production is more efficient early on (Mancini et al., 2015; Popping et al., 2017). To make progress, it would be necessary to probe wavelengths blue-ward of the black-body peak by means of mid-infrared observations. Given the cancellation of the SPICA (Space Infrared Telescope for Cosmology and Astrophysics Spinoglio et al., 2017; Egami et al., 2018) and OST (Origins Space Telescope Cooray et al., 2020) missions, novel strategies must be urgently devised.
To conclude, the study of the ISM of EoR galaxies is in its infancy. The investigation of the ISM is crucial to answering key open physical questions concerning these sources: what is their star formation efficiency? how various (mechanical, radiative, chemical) feedback processes affect the thermal, dynamical, and turbulent state of the ISM? what is the amount of dust, metals, and molecular gas in these systems? These questions could be finally attacked by combining ALMA and JWST data.
From a theoretical point of view, progressively more refined and physics-rich numerical simulations represent an indispensable guideline and tool. Since we would like to resolve the ISM down to the Molecular Clouds (MC) level, suitable simulations should reach a (baryonic) mass resolution , and be able to probe scales. While not as critical as for simulations that aim at studying the reionization process (e.g. croc Gnedin 2014, coda ii Ocvirk et al. 2020, sphinx Rosdahl et al. 2018), the ISRF is an important physical ingredient for early galaxy evolution (Katz et al., 2017; Trebitsch et al., 2017; Pallottini et al., 2019). Thus, radiative transfer should be consistently implemented.
As smaller scales are resolved, a better prescription of unresolved (sub-grid) processes must be included with respect to coarser large-scale cosmological simulations (mass resolution and scales, e.g. eagle Schaller et al. 2015, bluetides (Feng et al., 2016), illustris-tng Pillepich et al. 2018, and thesan Kannan et al. 2022), in order to properly account for the turbulent structure of the ISM, its chemical state, and stellar feedback (Agertz et al., 2013; Agertz & Kravtsov, 2015; Hopkins et al., 2014; Pallottini et al., 2017a, b; Lupi, 2019). This makes it demanding to simulate large galaxy sample in an unbiased cosmological volume with high resolution and a variety of sub-grid models111See, e.g. the “normal” volume of the renaissance from O’Shea et al. (2015a), where the simulation focuses on a region and it is stopped around ..
A more efficient option is to perform multiple zoom-in simulations, as done e.g. in Ma et al. (2018, see fire-2 for the models), Ceverino et al. (2017, firstlight), and Lovell et al. (2021, flares). With some efforts (see in particular Lovell et al., 2021), multiple zoom-in simulations can be used to construct a composite sample that is representative of the parent cosmological volume used for the zoom-in.
In this paper we present serra222serra means greenhouse in Italian. You might notice that galaxies are named after flowers (and some also look alike)., a suite of multiple zoom-in cosmological simulations targeting galaxies at . Each simulation follows the evolution of galaxies in a cosmological environment by employing a radiation-hydrodynamic code that is coupled to a non-equilibrium chemical network. In the present work, we analyse the results from 10 simulations focusing at , for a total of 202 galaxies. Here, we do not aim at building a fully unbiased cosmological galaxy sample. Rather, we intend to mimic a survey targeting galaxies that are luminous enough to be detected and characterised with current (Hubble Space Telescope and ALMA) and upcoming instruments (JWST). Paralleling current [C ] observational campaigns with ALMA (Le Fèvre et al., 2020; Bouwens et al., 2021), we can then reconstruct at a later stage the statistical properties (Béthermin et al., 2020) of our sample, at the same time spotting interesting or peculiar objects (Loiacono et al., 2021; Fudamoto et al., 2021).
Most of the assumptions and techniques adopted in serra have already been developed in previous works. In Pallottini et al. (2017a) we focused on the modelling of stellar feedback; Pallottini et al. (2017b) showed the impact of non-equilibrium chemistry; in (Pallottini et al., 2019) we analysed the impact of radiation-hydrodynamical effects. Advanced line and continuum emission models, a foundational feature of serra, are based on Vallini et al. (2015); Vallini et al. (2019) and Behrens et al. (2018), respectively. The simulation results are post-processed to produce synthetic data cubes (Kohandel et al., 2020), which can be directly and fairly compared with observations (Behrens et al., 2018; Zanella et al., 2021; Gelli et al., 2021).
The paper plan is as follows. In Sec. 2, We summarise the main features and assumptions of the serra simulations. In Sec. 3, we present our results. We analyse the stellar mass build up and time evolution of the simulated galaxies (Sec.s 3.1 and 3.2). Focusing on the sample, we study the halo-mass stellar mass relation (Sec.s 3.3 and 3.3.1), the Schmidt-Kennicutt relation (Sec. 3.4), and the size-mass relation (Sec. 3.5) Then (Sec. 3.6), we explore the main FIR and UV properties, treating both continuum (Sec.s 3.6.1 and 3.6.2) and line (Sec. 3.6.3) emission. Sec. 4 provides a summary.
2 Numerical simulations
In serra the dynamical evolution of dark matter (DM), gas, and stars is simulated with a customised version of the Adaptive Mesh Refinement (AMR) code ramses333https://bitbucket.org/rteyssie/ramses (Teyssier, 2002). ramses follows the gas evolution with a second-order Godunov scheme; DM and stars are treated with a multigrid particle-mesh solver (Guillet & Teyssier, 2011). Radiative transfer is solved on-the-fly using ramses-rt (Rosdahl et al., 2013), which implements photon advection using a momentum-based framework with M1 closure for the Eddington tensor (Aubert & Teyssier, 2008). While photon transport is handled by ramses-rt, the system of equations regulating gas-photon interactions (including the gas thermal evolution) is generated via krome444https://bitbucket.org/tgrassi/krome (Grassi et al., 2014) adopting a non-equilibrium chemical network (Bovino et al., 2016; Pallottini et al., 2017b). The coupling between krome and ramses-rt is done by sub-cycling the absorption step in order to assure convergence (see also Decataldo et al., 2019; Pallottini et al., 2019).
Critical to a fair comparison with observations is the production of line and continuum emission. This is done in post-processing by adopting multiple models. Emission lines are calculated by interpolating grids of models obtained from the photo-ionization code cloudy c17555https://www.nublado.org (Ferland et al., 2017), by extending Vallini et al. (2017) models as described in Pallottini et al. (2019). Attenuated UV and continuum FIR emission is computed via the Monte Carlo code skirt V8666https://www.skirt.ugent.be (Baes & Camps, 2015; Camps & Baes, 2015), using the modelling from Behrens et al. (2018).
In the following, we summarize the main features of the numerical set-up (Sec. 2.1), radiation hydrodynamics (Sec. 2.2), stellar modelling (Sec. 2.3), galaxy identification and emission properties (Sec. 2.4).
2.1 Set-up
We generate cosmological initial conditions (IC) assuming parameters compatible with Planck results777CDM model with vacuum, matter, and baryon densities in units of the critical density , , , Hubble constant , spectral index , and (Planck Collaboration et al., 2014).. IC are computed with music (Hahn & Abel, 2011) at for a cosmological volume of , which will contain halos with masses at (Murray et al., 2013, adopting a Sheth & Tormen 1999 halo mass function). The base grid has 8 levels, equivalent to a gas (DM) mass of (). We run a total of 11 simulations and for each simulation we prepare distinct IC; we then evolve the volume down to . We use hop (Eisenstein & Hu, 1998) to extract halo catalogues and select a target among the most massive halos in the simulated cosmological volume. These have (corresponding to sigma fluctuations), and thus they are resolved with about particles in the coarse runs.
Using hop we select the minimum ellipsoid enveloping about times the halo virial radius (), and trace it back to . Halos with have virial radii of . A comoving trace back radius of about is typically obtained. We select such Lagrangian volume at and using music we produce multimass IC, i.e. we progressively add concentric layers of increasing mass resolution around the target. We reach 11 levels in the zoom-in region, i.e. a gas (DM) mass of (). Such Lagrangian volume is then evolved at and the main halo is resolved with about DM particles in these zoom-in runs.
In the zoom-in region we set 6 additional AMR levels (thus 17 in total), that are enabled via a Lagrangian-like criterion. This allows us to reach spatial scales of () at () in the densest regions, i.e. the most refined cells have mass and size typical of Galactic MCs (, Federrath & Klessen, 2013).
Adopting a trace back radius of typically ensures negligible contamination for the central halo (Onorbe et al., 2014). However, here we are also interested in other galaxies in the proximity of the target. For this reason we perform the target selection and trace back procedure two times (cfr. with Fiacconi et al., 2015). This limits the contamination levels to () for the target (surrounding) halos in the zoom-in region; from the analysis we exclude galaxies with a contamination of within . With this threshold, the resulting sample has an average888When giving averages, we are quoting the median value of the distribution with errors based on the values of and of the dataset. contamination level of () when considering (). Further, the apparently higher contamination of some of the galaxies in the simulations (Onorbe et al., 2014) is mostly due to the adopted definition, i.e. we are considering all DM particles within (of the host DM) from the centre of a galaxy, while is adopted in most works.
2.2 Radiation hydrodynamics
2.2.1 Gas and dust composition
The chemical network in the simulations includes H, H+, H-, He, He+, He++, H2, H and electrons. Each of these species is tracked individually, and evolves according to the chemical processes described in Sec. 2.2.3. Metallicity () is tracked as the sum of heavy elements, and we assume solar abundance ratios of the different metal species (Asplund et al., 2009). Numerically, metallicity is treated as a passively advected scalar; and stars act as a source of metals and reprocessed material (Sec. 2.3). Dust evolution is not explicitly tracked during simulation. We make the assumption that the dust-to-gas mass ratio scales with metallicity, i.e. , where for the Milky Way (MW, e.g. Hirashita & Ferrara, 2002). For chemical reactions involving dust and radiation absorption, we assume a MW-like grain size distribution (Weingartner & Draine, 2001).
Individual ICs for the various chemical species are computed accounting for the chemistry in a primordial Universe (Galli & Palla, 1998). We adopt an initial metallicity floor since at our resolution does not allow us to track the formation of first stars (see Wise et al., 2012; O’Shea et al., 2015b; Smith et al., 2018). Such floor only marginally affects the gas cooling time (see also Sec. 2.2.3), and it is compatible with the metallicity of the intergalactic medium (IGM) in cosmological simulations (e.g. Pallottini et al., 2014; Maio & Tescari, 2015; Jaacks et al., 2018). Such setup is fully described in Pallottini et al. (2017b).
2.2.2 Photons
In ramses-rt, photons are treated as a fluid sharing the same AMR structure of the gas. Photons are divided into energy bins, whose density and velocity fields are tracked separately.
As done in (Pallottini et al., 2019), in serra, we follow 5 photon bins in the range999For He and He+ we assume collisional ionisation only.. The first two energy bins cover the Habing (1968) band101010In this paper, the Habing flux is indicated in unit of , the MW value. , which regulates the temperature of the ISM and photo-dissociation regions (PDR); of the two, the higher energy bin is specific for the Lyman-Werner radiation (), which photo-dissociates via the two-step Solomon process (Stecher & Williams, 1967). The last three energy bins cover the H-ionising photons up to the first ionisation level of He (). For H-ionising photons, the energy width is chosen such that the bins have the same number of photons when the spectral energy distribution (SED) is averaged over a selected fiducial stellar population – i.e. age and assuming Bruzual & Charlot (2003) photoionization models – since these stars dominate the spectrum of a galaxy with an exponentially rising SFR (e.g. Pallottini et al., 2017b).
Gas and dust represent sinks for the radiation (Sec. 2.2.3) while stars act as sources (Sec. 2.3.2). We neglect the cosmic UV background (UVB) contribution, since the typical ISM densities are sufficiently large to ensure an efficient self-shielding (Gnedin, 2010). In the EoR, the UVB produces a statistically negligible hydrogen ionisation for gas with density , i.e. close to those found in the outskirts of early galaxies (Rahmati et al., 2013; Chardin et al., 2018). We do not account for recombination radiation, i.e. we assume that recombination photons are absorbed “on the spot” (Rosdahl et al., 2013).
Both ramses and ramses-rt have explicit schemes, thus the time step of a fluid with velocity is limited by the Courant condition (Courant et al., 1928), i.e. . As radiation and gas evolution are coupled, the maximum speed is selected, i.e. the speed of light. To limit the computational load, we consider the reduced speed of light approximation to propagate wave-fronts (Gnedin & Abel, 2001).
The reduced speed of light approach might produce artefacts in regions where the dissociation/ionisation front propagation is faster than the reduced speed of light, , used in the simulation. For instance, in reionization studies allows to resolve the cosmological I-front propagation, yielding little variations on global reionization histories (Gnedin 2016, see also Deparis et al. 2019, where the effect is explored in the range). For PDR regions, the speed of the wave-front can be estimated as
| (1) |
where we have used the typical values expected for high- galaxies where the photon-to-baryon ratio is particularly high, e.g. as in the case of a newly born star cluster in a typical GMC.
In Pallottini et al. (2019), we adopted a conservative value of ; however, there we also noted that the PDR region size is set by the dust optical depth . This yields
| (2) |
implying that PDR are typically unresolved in our simulations. The PDR region is established in a time
| (3) |
then the propagation of the front slow down below . Depending on the dust amount and the ISRF value, reducing the speed of light to a value lower then is expected to affect only the evolution in a fraction of , as we also show in Decataldo et al. (2019). A different situation is when radiation breaks out of the birth clouds and impacts the rest of the galaxy; after a cluster would produce in its surrounding a ISRF of ; assuming the SN feedback has cleared out the gas, we expect gas densities of the order of , thus from eq. 1 it follows that , i.e. the reduced speed of light approximation breaks down (see Gnedin, 2016, for a similar issue); however, the PDR region is already established in (eq. 3); thus, the situation is expected to be relatively rare in our simulations111111A similar reasoning applies also to H ionizing photons, since they are scarcely emitted after the stars producing them turn into SNs.. Moreover, the breakdown of the approximation is not expected to affect satellites, as the dominant contribution to the ISRF is generated in situ, because of geometrical dilution (Gelli & al., in prep., 2022).
Further, in Lupi et al. (2020) we adopted the same initial conditions used in Pallottini et al. (2019), but with a different numerical code, and a lower speed of light, i.e. . We noted no large differences in properties of the target galaxy in the two zoom-in (e.g. SFR, , average ISM density, ISRF value, etc). This is consistent with what found in Hopkins et al. (2020), where variation of are shown to affect the ISM properties trough a slight variation of the radiation pressure efficiency.
For this reason, we adopt in the present, which – with respect to Pallottini et al. (2019) – also allow us to zoom-in relatively larger Lagrangian volumes and higher sigma fluctuations by spending roughly the same computational time.
2.2.3 Chemical processes
Our krome-powered non-equilibrium network follows a total of 48 reactions121212The reactions, their rates, and corresponding references are listed in App. B of Bovino et al. (2016): we use reactions from 1 to 31 and 53, 54, from 58 to 61, and from P1 to P9; the rates are reported in Tab. B.1, Tab. B.2, and Tab. 2 of Bovino et al. (2016), respectively., including photo-chemistry, dust processes, and cosmic-ray-induced reactions (Pallottini et al., 2017b, see Bovino et al. 2016 for the original implementation).
Molecular hydrogen is particularly important in serra, since it determines the star formation process (Sec. 2.3.1). Formation of H2 is possible both in gas-phase and on dust grain surfaces. The formation rate of on dust grains is approximated following Jura (1975):
| (4) |
where and are the total and hydrogen gas densities, respectively. Note that the dust-channel is dominant with respect to the gas-phase formation channel for , i.e. for most of the lifetime of a typical EoR galaxy (Pallottini et al., 2017b).
Cosmic-rays are not explicitly tracked in the simulation (cfr. Dubois & Commerçon, 2016; Pfrommer et al., 2017). Similarly to what is done in Pallottini et al. (2017b, 2019), we assume a cosmic-ray hydrogen ionisation – and associated Columb heating – rate proportional to the global SFR (Valle et al., 2002) and normalised to the MW value (Webber, 1998, see Ivlev et al. 2015; Padovani et al. 2018 for the spectral dependence), i.e. . Note that the global SFR is computed by averaging over the stellar mass formed in the whole simulation in the last , and it is typically dominated by the target galaxy in the zoom-in region (see also Pallottini et al., 2017a). Note that this likely overestimates the ionization and heating from cosmic-rays; while it is possible to track the cosmic-ray field consistently (Farcy et al., 2022), we leave such modification for a future work.
Using on-the-fly radiative transfer, absorption is done on a cell by cell basis. The process depends on the abundance of each single species, dust amount, and the selected MW grain size distribution131313A different assumption on the dust distribution can give relevant effects on the observed SED (Behrens et al., 2018), however it typically gives only minor differences for the chemical network; for instance adopting a Small Magellanic Cloud or MW composition have average differences of , that goes up to for energy bins that contribute neither to dissociation nor to H ionization (Pallottini et al., 2019).. Cross-sections for gas processes are directly taken from the reaction rates of the network. For photoreactions, in each radiation bin the relative cross-section is pre-computed and averaged on the SED of the fiducial stellar population. The self-shielding of from photo-dissociation is accounted given the column density, temperature and turbulence (Richings et al., 2014).
krome solves the chemical and thermal evolution by adopting dlsodes (Hindmarsh, 2019), an implicit solver that takes advantage of the sparsity of Jacobian matrix associated with an astrophysical chemical network. As noted in Pallottini et al. (2019), in its current version krome evolves chemical species by assuming that the radiation field is constant in a time step; to account for absorption associated with chemical processes, we sub-cycle the absorption step in order to assure convergence (Decataldo et al., 2019, in particular see the benchmarks in their Appendix).
2.2.4 Gas thermodynamics
We model both the evolution of thermal and turbulent (or non-thermal) energy content of the gas.
Thermal energy can change due to radiative cooling and heating which are computed using krome and accounting for the local ISRF. Extra thermal energy inputs are due to stellar feedback (e.g. SNe and winds, see Sec. 2.3.2). Since metal species are not followed individually, we use the equilibrium metal line cooling function calculated via cloudy (Ferland et al., 2013) with a Haardt & Madau (2012) UV background141414This is inconsistent, for a discussion see Pallottini et al. (2017b) and Emerick et al. (2019, in particular App. D), the latter showing that the largest difference can be found for gas with .. Following cooling from individual metal species can modify the thermodynamics of the low density ISM (Gnedin & Hollon, 2012; Capelo et al., 2018), since the cooling function typically changes by a factor (Bovino et al., 2016). Such effect might be important to correctly compute emission lines strengths, particularly for some lines (Lupi et al., 2020). To overcome this problem and to reach a better accuracy, in serra we perform this computation in post-processing (Sec. 2.4.2 and 2.4.3). Dust cooling is not explicitly included since it gives a minor contribution to the gas temperature for (Bovino et al., 2016, see their Fig. 3). Note that the cosmic microwave background (CMB) effectively sets a temperature floor for the gas. Its inclusion is fully described in Pallottini et al. (2017b).
The non-thermal energy density of the gas is treated as a passively advected variable (Agertz & Kravtsov, 2015), that is sourced by stellar feedback (e.g. SNe, winds, and radiation pressure, see Sec. 2.3.2). Once turbulence is injected in the gas, it can dissipate at a rate (Teyssier et al., 2013, see eq. 2)
| (5) |
where is the dissipation time scale. This can be written as the eddy turn-over scale (Mac Low, 1999)
| (6) |
where is the turbulent velocity dispersion. More refined turbulence models are available (Scannapieco & Brüggen, 2010; Iapichino et al., 2017; Engels et al., 2019), and have been successfully used in zoom-in simulation (Semenov et al., 2016, 2018). However, they have not been adopted in the present since the resulting SFR efficiencies are comparable (Pallottini et al., 2017a).
2.3 Stars
Stellar particles in the simulation have a minimum mass of , the gas mass resolution in the zoom-in region. Thus, a single star particle in our simulations should be rather seen as a proxy for a “stellar cluster”. We assume a Kroupa (2001) Initial Mass Function (IMF). We keep track of the metallicity and age of each stellar particle. This information is used to compute chemical, radiative and mechanical feedback via starburst99 (Leitherer et al., 1999), by adopting evolutionary tracks of stellar population from padova (Bertelli et al., 1994) library, that covers the metallicity range.
2.3.1 Star formation
Stars form according to a Schmidt-Kennicutt relation (Schmidt, 1959; Kennicutt, 1998) that depends on the molecular hydrogen density ():
| (7) |
where is the local star formation rate density, the efficiency, the proton mass, the mean molecular weight, and the local free-fall time. The efficiency is set to , i.e. adopting the average value observed for MCs (Murray, 2011, see also Agertz et al. 2013).
Eq. 7 is solved stochastically at each time step in each cell (size ) (Rasera & Teyssier, 2006; Dubois & Teyssier, 2008), by forming a new star particle with mass , with an integer drawn from a Poisson distribution characterised by mean
| (8) |
For numerical stability no more than half of the cell mass is allowed to turn into stars. The stellar metallicity, , is set equal to the gas metallicity, , of the spawning gas cell.
2.3.2 Stellar feedback
Stellar energy inputs, chemical yields, and photon production depend both on metallicity and age of the stellar cluster, according to the padova tracks. Stellar feedback includes SNe, winds from massive stars, and radiation pressure (see also Agertz et al., 2013).
Depending on the kind of feedback, stellar energy input can be both thermal and kinetic, and we account for the dissipation of energy in MCs for SN blastwaves (Ostriker & McKee, 1988) and OB/AGB stellar winds (Weaver et al., 1977). The relative fraction of thermal and kinetic energy depends on the SN blast stage: energy conserving Sedov-Taylor stage (about 70% thermal, 30% kinetic), shell formation stage, and pressure driven snowplow (about 15% thermal and 35% kinetic). This is detailed in Sec. 2.4 and Appendix A of Pallottini et al. (2017a).
2.4 Post-processing
After each individual zoom-in simulation is completed, we identify galaxies and compute their emission properties. Each simulation outputs multiple snapshots equispaced in redshift () for and equispaced in time () for ; this setup gives a total of about 70 snapshots per simulation. In each snapshot, apart from the central target, there are about galaxies in the zoom-in region, depending on environment and redshift.
2.4.1 Identification
To identify DM halos and galaxies we use rockstar-galaxies151515https://bitbucket.org/pbehroozi/rockstar-galaxies (Behroozi et al., 2013a), a clustering algorithm that performs a phase-space identification for multi-mass simulations. It uses a friend-of-friend algorithm that adopts a metric accounting for both spatial and velocity separations. We treat separately DM and stellar particles, and allow rockstar-galaxies to identify groups with a minimum number of () DM (stars) particles. While rockstar-galaxies provides the linking relations between sub-halo (satellites) and halo (main galaxy), in the present paper we treat each galaxy as an individual object. We note that using a typical parameterisation for the phase-space distances is too coarse to allow a complete and robust identification of dwarf satellites of high- galaxies (cfr. Gelli et al., 2020).
To identify progenitors/descendants through cosmic time, we use an algorithm similar to mergertree (Knebe et al., 2013). First, we produce all the galaxy/DM halo catalogues of each snapshot. For each consecutive couple of snapshots, we cross match the galaxies/DM halos identified in the two catalogues.
Given two snapshots at redshift , the halo A at is flagged as a progenitor of the halo B at if their intersection has DM (20 stellar) particles. The main progenitor of B is the halo A that maximises the merit function (Srisawat et al., 2013). Using the progenitor list for each couple of consecutive snapshots, we can build the full progenitor/descendant graph for each galaxy and halo. If two galaxies keep exchanging mass (e.g. during a merger spanning multiple snapshots), we supplement our progenitors search by cross-matching the progenitor catalogue with the descendant catalogue. The latter is obtained by looking for halos in snapshot that are descendant halos in snapshot , with the same procedure outlined above. Considering only particle IDs in the progenitor/descendant identification is prone to a potential misidentification of progenitors/descendants (Srisawat et al., 2013) and can be avoided by adding dynamical information (see e.g. consistent-trees from Behroozi et al. 2013b). However, i) the fine time sampling of our snapshots ameliorate the problem and ii) we scarcely use such information in the present study, thus we will consider such treatment in future work.
Finally, we label a galaxy by the name of the simulation, number of the snapshot, and stellar halo ID, and we often indicate it with a specific name.161616When a specific name is chosen for a galaxy, it is propagated through the main progenitor and descendant branch of its graph. For instance, “Freesia” is the most massive galaxy in serra00: it has been identified at and its main characteristics have been described in Pallottini et al. (2019).
2.4.2 Line emission
Line emission is calculated on a cell by cell basis by using cloudy models. We use grids of cloudy models for density, metallicity, radiation field intensity, as a function of the column density, which is used as a stopping criterion for the calculation. We account for the turbulent and clumpy structure of the interstellar medium (ISM), by parameterising the underlying distribution as a function of the gas Mach number (Vallini et al., 2017, 2018), expressing the thermal to turbulent energy ratio. We have two grids of cloudy models, in which the impinging SED includes – does not include – ionising radiation ( eV). We consider radiation to be ionising in those cells that i) contain young () stars or ii) have a ionisation parameter larger then .
Every grid is composed of 17 density bins (), 8 metallicity bins (), and 12 ISRF intensity bins (), for a total of 1632 distinct models per grid. For the SED of the impinging radiation field on the slab of gas of interest in cloudy, we use our fiducial SED with stellar age of and solar metallicity, i.e. the stellar population is the primary contributor to the interstellar radiation field in our simulated galaxies. Note that in the post-processing via cloudy, the spectrum is not limited to 24.59 eV. The full setup is described in Pallottini et al. (2019), while in Lupi et al. (2020) a detailed analysis of different emission line models is reported (see Olsen et al., 2018, for additional discussion).
Line emission products can be spatially resolved maps or Hyperspectral Data cubes, i.e. line spectra in a position – position – line of sight velocity space (Kohandel et al., 2020). Given a field of view and a line of sight, for optically thin lines (e.g. FIR lines such as [C ] 158m) we can directly sum the contribution of all the gas cells in the field of view. For optically thick lines (e.g. C ] 1909A∘) we should consider the radiative transfer trough dust (see Behrens et al., 2019, for the additional efforts needed for Ly). Unattenuated (de-reddened) emission lines can be readily calculated and approximate treatments for the attenuation can give reliable estimates (Gelli et al., 2021), however we defer more refined implementations to future work.
2.4.3 Continuum emission
Continuum emission is generated by using skirt, a Monte Carlo based code that computes the radiative transfer process in dusty media. The setup adopted here is fully described in Behrens et al. (2018) and we summarise it as follows.
The spatial distribution of the light sources is taken from the position of the stellar clusters (particles) in the simulations; for each cluster, we use its metallicity and age to compute the stellar SED, by adopting Bruzual & Charlot (2003) models and a Kroupa (2001) IMF. We adopt photon packages per wavelength bin per source, which ensure a good convergence (see Behrens et al., 2018, , in particular App. A). While this is taken as our fiducial model, we note that using different stellar emission models and/or including the nebular continuum can change intrinsic UV broadband properties by a factor up to (Wilkins et al., 2016).
Dust distribution is taken from the simulations by adopting a fiducial value of (Behrens et al., 2018) for the dust-to-metal ratio, i.e. the best-fit simultaneously matching the UV and FIR SED of selected high- galaxies (Laporte et al., 2017a). We also assume a dust composition and grain size distribution reproducing the MW extinction curve (Weingartner & Draine, 2001), and a dust emissivity . The value of and dust composition are uncertain at high- (Wiseman et al., 2017). Note that in the skirt runs, we are adopting a value that is times higher than the one used in the simulations. In the future we reserve the option to change such fiducial setup, e.g. from to as seen in local galaxies (De Looze et al., 2020), or use the MW value (e.g. Hirashita & Ferrara, 2002). We use 100 logarithmically spaced spectral bins to cover the restframe wavelength and an additional finer grid of 40 bins at , i.e. to have a good coverage of the MIR range. Using skirt we compute the scattering and absorption without accounting for dust self-absorption, which can be relevant for column densities of the order of , but gives only a minor contribution to the mid-infrared emission in our typical object (Behrens et al., 2018, in particular see App. A).
Similarly to the emission lines, the continuum data products are spatially resolved spectra.
3 Results
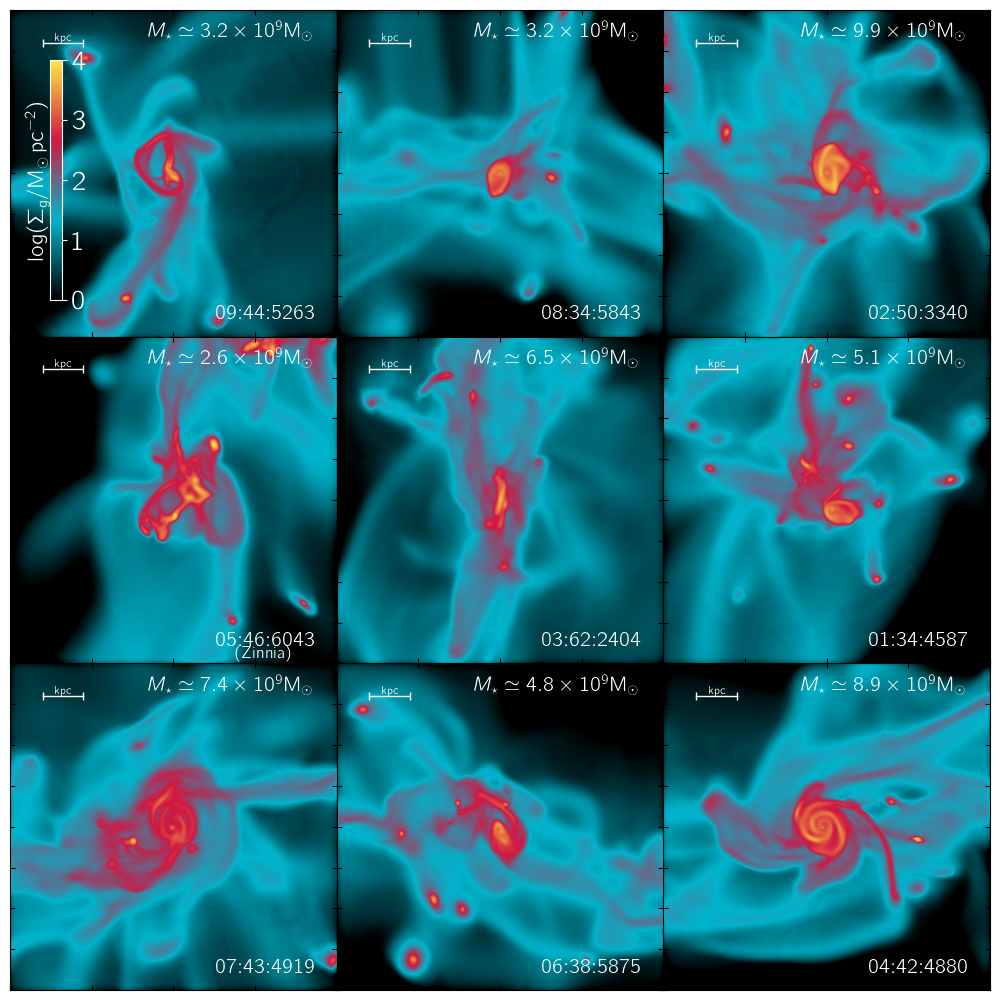
What do serra galaxies look like? To have a visual representation, we select 9 different galaxies in the redshift interval , chosen as a showcase of the different evolutionary stages. In Fig. 1 we plot maps of the gas surface density () of these galaxies, oriented face-on171717We define the face-on orientation by using the total stellar angular momentum. This working definition gives reasonable results even in the case of a close merger..
In a cosmological structure formation scenario, gas starts to condense in overdensities generated by dark matter halos; via filamentary accretion in the IGM/CGM, gas flows to the centre of the potential DM well, where it can cool and reach densities high enough that and thus star formation is possible (upper panels in Fig. 1). Mergers represent landmarks of galaxy evolution, as per the hierarchical build-up scenario, and objects can often be seen in different phases of the merging process (middle panels in Fig. 1). If the galaxy mass is high enough and it is not disturbed by mergers, a spiral structure (Ceverino et al., 2015; Pallottini et al., 2017a) forms within a rotating and pressure supported disk (Inoue et al., 2016b; Leung et al., 2020), while it continues to accreting gas and forming stars (lower panels in Fig. 1).
The morphological evolution is particularly rapid at high-, as the rate of mergers per unit time and fresh gas accretion is an increasing function of redshift (Fakhouri et al., 2010; Correa et al., 2015). Furthermore, the stellar feedback is particularly violent because of the episodic and bursty nature of the star formation history (Pallottini et al., 2017b; Ma et al., 2018). Thus the same galaxy can dramatically change its morphology in a relatively short time lapse, i.e. (e.g. Kohandel et al., 2019, Fig. 5).
3.1 Stellar build-up
We start the quantitative analysis of serra by looking at the formation history of the stellar component of our galaxies.
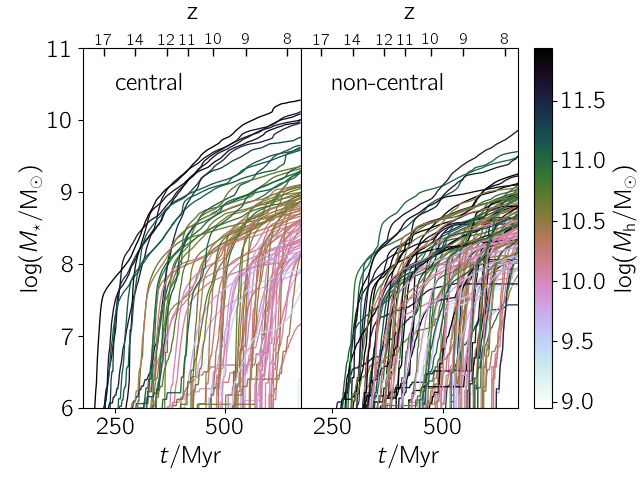
The stellar mass build-up of galaxies in serra is plotted in Fig. 2. The evolution is shown up to for 202 individual galaxies, each one of them being coloured according to the host halo mass181818Halo mass definition can be done either by direct summation of particle groups in the halo finder or using a spherical overdensity criterion. Here as halo mass we adopt “M200c”, i.e. integrating the DM mass contained in a sphere centred around the stellar centre of mass up to the radius where the density is 200 times higher then critical density , i.e. . Selecting a different threshold values for the density (e.g. from the spherical collapse model or 500) or adopting the matter density instead of the critical density can give differences up to a factor 3 in the halo mass.. Note that all the galaxies in Fig. 2 are defined via object identification at , thus mass contribution from mergers is included in the evolutionary track.
Galaxies start to form from , when the Universe is Myr old. In the plotted redshift range the stellar masses span from to and the galaxies have typical metallicity in the range (see also Gelli & al., in prep., 2022).. Since the suite is surveying biased regions of the Universe, relatively rare galaxies () are present since ; in particular, 37 targets have at .
Objects in our sample can be divided into central (left panel of Fig. 2) and non-central (right panel), depending on if they are the most massive galaxy in the hosting DM halos. For central galaxies, the higher the DM halo mass, the higher are the formation redshift of the first stellar populations, as a consequence of the hierarchical structure formation process.
For non-central galaxy, a relation between and is not expected; note that non-central galaxies are not necessarily satellites of the most massive galaxy in the hosting DM halo; however, being at a relatively close distance (), they can be affected by mass exchange, metal enrichment, and radiative feedback from the latter. In the following Sec.s we see that they typically follow similar scaling relations as the central galaxies but with a larger dispersion.
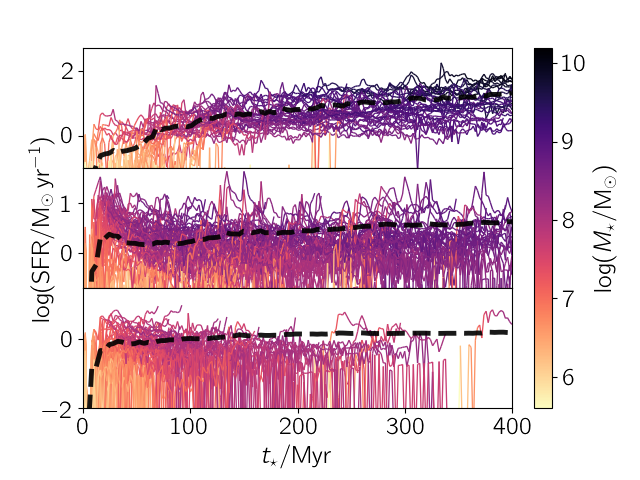
Regardless of the distinction, almost all the galaxies experience a rapid increase of their stellar mass in their first , followed by a less intense growth phase. To have a closer look, we can check their star formation history (Fig. 3). In the left panel, we plot the star formation rate (SFR) as a function of galaxy age191919The galaxy age is defined as the time from the first star formation event; we stress it should be interpreted as time reference more then a galaxy physical property (cfr Tacchella et al., 2018). (). Data for both central and non-central is divided into 3 groups of 69 targets, depending on the maximum SFR reached during the history of the galaxy, and each galaxy track is coloured with the stellar mass at .
During the first , galaxies with typically have , intermediate mass galaxies () wiggle around , while have for long spans of times, and can reach peaks of during short bursts. The majority of bursts during the galaxy history have time scales of the order of : a peak in SFR activity determines a delayed peak of stellar feedback, that temporarily suppresses the star formation (see Pallottini et al., 2017a, for more details regarding the feedback impact). Such suppression typically becomes a temporary quenching in low mass galaxies (Gelli et al., 2020). More details on this effect are given later on. Note that extreme variations – bursts of the order of the time averaged value – are likely induced by merger events and massive inflow of new fresh gas.
3.2 Main sequence
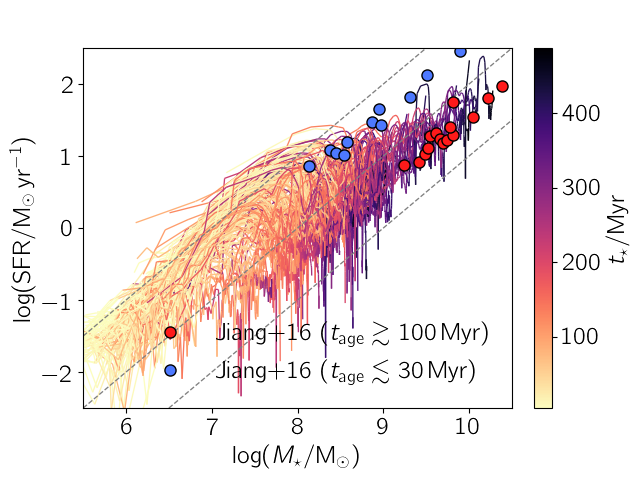
It is interesting to look at the history in the SFR plane, i.e. the “main sequence”, that is shown in the right panel of Fig. 3. Galaxies in serra start their life with a specific star formation rate and gradually move to as they grow older (around , see also Pallottini et al., 2017b). As expected from the sSFR evolution (see Madau & Dickinson, 2014, and reference within), galaxies in the EoR have extreme values with respect to what observed locally (, ) and at low redshift (, ). The values reported for galaxies in serra are in good agreement with those observed at (González et al., 2010; Stark et al., 2013). Moreover, observations by Jiang et al. (2013) show that young (old) galaxies have , i.e. hinting at a decreasing trend of sSFR with galaxy age. Direct comparison with the data from Jiang et al. (2013), reveals that the general trends from the stellar tracks of serra galaxies well reproduce the observations of old galaxies. However we find for young galaxies only during bursty periods. Bi-modality in the -SFR plane has been probed by observations of large samples up to by Rinaldi et al. (2021), however the author show that illustristng50 simulations (Pillepich et al., 2019) struggle to reproduce the starburst cloud at any redshift interval. Further and more refined analysis will be needed in order to quantify if this lack is due to intrinsic limitations in the simulations or to a bias in the comparison (e.g. because of the volume).
3.3 Halo-stellar mass relation
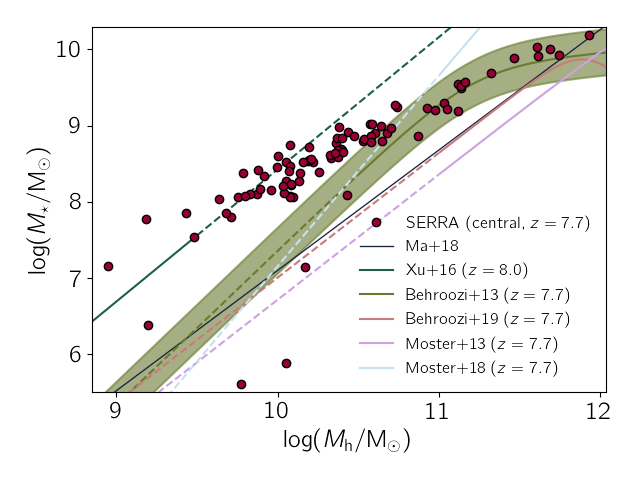
Here we focus our analysis at and we start by looking at the halo mass to stellar mass relation, that is often used as a benchmark for the efficiency of star formation. The relation for central galaxies in serra is presented in Fig. 4. At the halo masses range from about to and the stellar mass of central galaxies from about to . Few objects with mass of are present, as most of them are embedded in halos hosting more massive galaxies, while smaller objects are not identified as galaxies, because of the threshold of 20 stellar particles adopted in the definition (see Sec. 2.4.1).
In the same figure we compare with the results from abundance matching models (Behroozi et al., 2013c, 2019; Moster et al., 2013, 2018) and the from numerical simulations (Xu et al., 2016; Ma et al., 2018).
The central galaxies in serra have an average trend that is in broad agreement with the from Behroozi et al. (2013c). Notably, the redshift-dependent turnover at , corresponding to the turnover at in the luminosity function, is well reproduced. The serra predictions diverge from the Behroozi et al. (2013c) curve at : most of the galaxies show a larger stellar mass, with few blatant outliers that sit well below it. Qualitatively a similar behaviour is found when comparing with Moster et al. (2013), although at there is a disagreement at more than around between Moster et al. (2013) and Behroozi et al. (2013c); such a disagreement is mainly due to the different assumption in the abundance matching models and the different extrapolation methods (see also Behroozi & Silk, 2015; Moster et al., 2018). In particular, for and at Behroozi et al. (2013c) should be taken with care, since results in that range have been extrapolated due to the lack of data. The situation is qualitatively similar also by considering updated versions of the abundance matching models (Moster et al., 2018; Behroozi et al., 2019).
Despite these caveats, in the present work we take the from Behroozi et al. (2013c) as a reference. With this considerations in mind, it seems that feedback at the low mass end in serra is too weak to suppress star formation significantly and/or the lack of resolution to solve the mini-halo progenitors is spoiling the evolution of low mass galaxies.
As Behroozi et al. (2013c) is broadly consistent with the relation from Ma et al. (2018), similar considerations hold for the comparison between serra and fire-2. However, note that the latter reports no redshift evolution for the , while – particularly at high redshift – there is a rapid evolution in the from Behroozi et al. (2013c). In the low-mass end results from serra are closer to what reported by renaissance as analysed in Xu et al. (2016); note that we report the fit from Xu et al. (2016) extrapolating at , so extra care should be taken in looking at the high mass end from renaissance.
To summarise, while at high the serra results are consistent with different models, at low they generally favour larger stellar masses with respect to the extrapolated predictions. How can we understand such a trend?
3.3.1 Low-mass galaxies: interpreting their trend
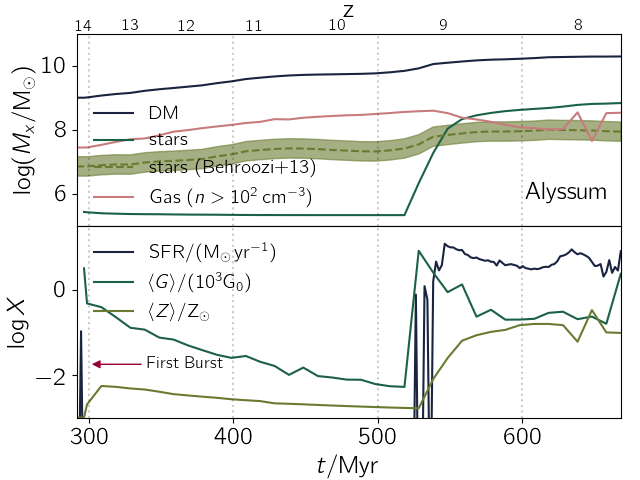
To answer this question, consider the star formation history (Fig. 5) of “Alyssum”, a typical central, low-mass () serra galaxy202020Note that for the analysis of Alyssum we relax the threshold of a minimum 20 particles to define a galaxy: for snapshot prior to the first identification of the galaxy with rockstar, we backtrack each single star particle to the first formation event. at . Alyssum does not experience any major merger down to . Its first star formation event occurs in an almost pristine ISM at , when the galaxy halo mass is or K.
In the first burst, a stellar cluster is formed; the star formation is completely quenched for a time span of 200 Myr thereafter. The metallicity rapidly rises from the initial floor value of to , and subsequently slowly decreases because of the onset of a powerful outflow, and – most prominently – cosmological accretion of fresh gas.
Quenching of star formation is due to radiative feedback. Initially, the mean intensity of the photo-dissociating radiation field212121 roughly corresponds to , where is the radiation intensity in units of . produced by the newly born stars is very high, (see lower panel of Fig. 5). This is well above the critical threshold for formation in a pristine environment, (Johnson et al., 2013). Thus, the galaxy cannot form stars until the ISRF decreases below this threshold, roughly 200 Myr after the burst. In this first phase, is below the (extrapolated) Behroozi et al. (2013c) relation.
When star formation is reignited, the process repeats with increasingly shorter cadence. This is due to the fact that metals and dust produced by the SNe improve the self-shielding ability of the gas, thereby enabling formation even in the presence of a super-critical ISRF intensity. After two additional bursts, the star formation stabilises to , and steadily continues in spite of the very strong, , ISRF. The metallicity has overtaken the level, which we can therefore empirically identify as the minimum metallicity required to sustain a continuous star formation activity. At that point the galaxy shortly overshoots the Behroozi et al. (2013c) curve. This situation is however transient: more massive galaxies later on fall back on the (Fig. 4).
The described trend crucially depends on the assumption that star formation occurs in molecular clouds. We cannot exclude that a different star formation mode, occurring in dense – but not necessarily molecular – gas (e.g. Semenov et al., 2016; Lupi et al., 2018) might be at work in early galaxies. In such case, the quenching phase could be shorter or even completely absent. The quenching details and duration might also depend on mass resolution, although the physical arguments derived from the simulation analysis should hold anyway. We will explore these possibilities in future work.
3.4 Schmidt-Kennicutt relation
The Schmidt-Kennicutt (KS) relation for serra galaxies is plotted in Fig. 6. We find that simulated galaxies are typically located above the local relation (Heiderman et al., 2010)
| (9) |
that is a fit to the Kennicutt (1998) observations.
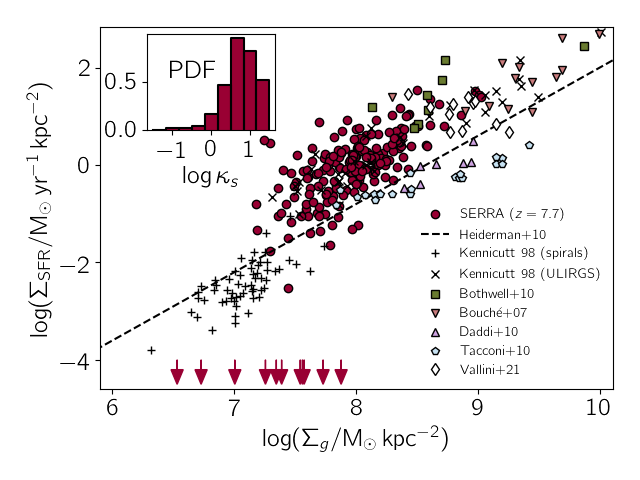
Note that 11 galaxies are temporarily quenched at , as discussed in the previous Section. Observations of both local starbursts (Kennicutt, 1998; Bothwell et al., 2010) and galaxies (Bouché et al., 2007; Tacconi et al., 2010; Daddi et al., 2010) match our results quite well.
The deviation from the KS can be quantified via the “burstiness” parameter (Ferrara et al., 2019; Pallottini et al., 2019)
| (10) |
which also governs the observability of several emission lines (Vallini et al., 2020, 2021). At , galaxies in serra have an average value of .
Unfortunately, CO detections (Pavesi et al., 2019; D’Odorico et al., 2018) in EoR galaxies are rather difficult and rare, making a precise assessment of the gas mass rather uncertain, albeit indirect methods (e.g. Zanella et al., 2018, that propose to use [C ] as a proxy for molecular gas) might overcome such problem. An alternative possibility consists of combining [C ] and C ] lines to determine , the gas density and metallicity (Vallini et al., 2020, see also Ferrara et al. 2019 for details on the physical model). This method has been applied to COS-3018 (), the only normal EoR galaxy so far detected in both [C ] (Smit et al., 2018, see Carniani et al. 2018a for the size determination) and C ] (Laporte et al., 2017b). Vallini et al. (2020) infer for COS-3018, in line with the average value from serra.
Using a similar approach, but based instead on the FIR [C ] and [O ] lines, Vallini et al. (2021) find for 10 galaxies. This value is in line with the values found for serra galaxies with approximately .
3.5 Size-stellar mass relation

The size-stellar mass relation for our sample is reported in Fig. 7. We define the galaxy size, , as the radius that contains of the UV luminosity222222In simulations for which the continuum radiative transfer is not available, it is common to adopt the or stellar mass radius. With respect to , this choice underestimates the size by a factor of a few, since UV scattering, that depends on the dust distribution, is not accounted for.. In our sample, the behaviour is two folded: most of the galaxies have , while about of the objects have larger sizes (). The latter group is composed by galaxies – mostly non central – that have recently experienced or are experiencing a merger (e.g. see later in Fig. 9). While their size-stellar mass relation resembles that of local Ultra Diffuse Galaxies (Brodie et al., 2011; Norris et al., 2014, UDG), this might be a transient feature related to the merging phase. Fitting the relation for the central serra galaxies excluding the mergers, we obtain:
| (11) |
The size-stellar mass relation from serra has a slope consistent with the corresponding one in the local universe encompassing dwarf spheroidals (dSphs), Ultra Diffuse Galaxies (UDG), and elliptical/lenticular (E/S0); however in serra the relation is offsetted by about an order of magnitude, qualitatively as expected from the redshift evolution (Shibuya et al., 2015).
Our data is broadly consistent with that derived by Bouwens et al. (2017) for lensed galaxies and by Vanzella et al. (2018) for for “proto-globular” clusters. However, the median value of the simulated relation is downshifted by a factor of with respect to Bouwens et al. (2017) data. The reasons for this discrepancy are uncertain, but they might be related to the feedback prescriptions adopted in serra. For example, it might be that the energy deposition is insufficient to drive a sufficient amount of gas away from the galactic centre. While the main goal of all feedback models is to primarily prevent excessive star formation, the resulting kinematic behaviour may considerably differ among them (see Rosdahl et al., 2017, for a in depth study).
For example, a feedback based on delayed-cooling, which shares many of the features of the physically-motivated feedback implemented in serra, tends to puff-up the gas distribution. A kinetic feedback, instead, is known to promote powerful outflows. Intriguingly, though, in Lupi et al. (2020) we adopted a kinetic feedback prescription following Hopkins et al. (2018), and same initial conditions to model the galaxy Freesia presented in Pallottini et al. (2019). By comparing the two simulations we find a difference of only a few percent in terms of the galaxy size.
Alternatively, part of the tension might be alleviated by properly considering observational uncertainties. As shown in Zanella et al. (2021), depending on the band and the resolution of the synthetic observation, we can expect that adopting a realistic instrumental noise for the simulated data can give a error on the recovery of . This error estimate for the mass-size relation is likely to be a lower limit, since in Zanella et al. (2021) we consider neither lensing model uncertainties nor stellar mass determination errors. Further study on the size-mass relation and a full morphological analysis are left for future work.
3.6 Emission properties
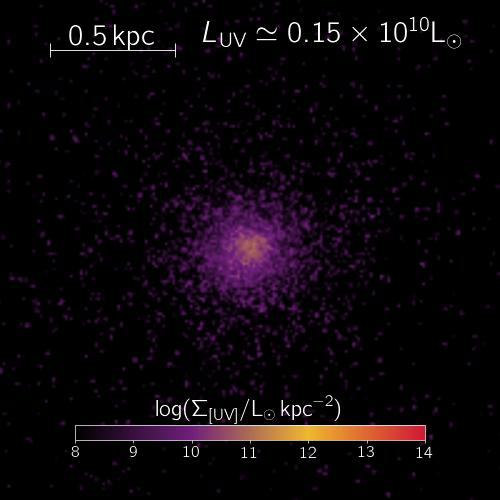
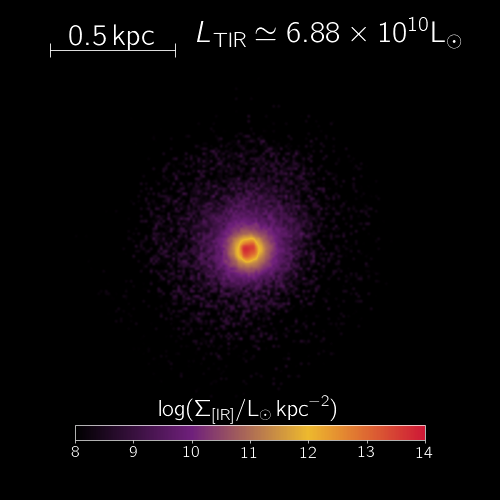
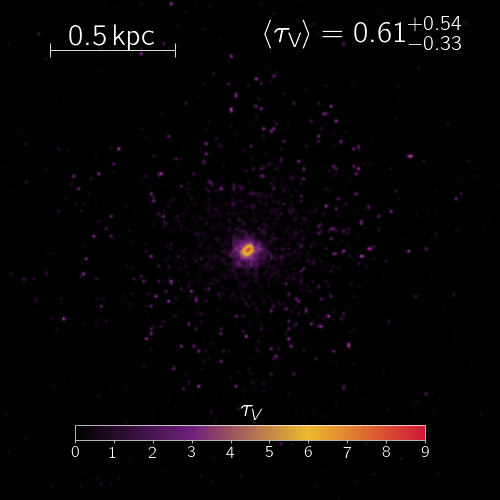
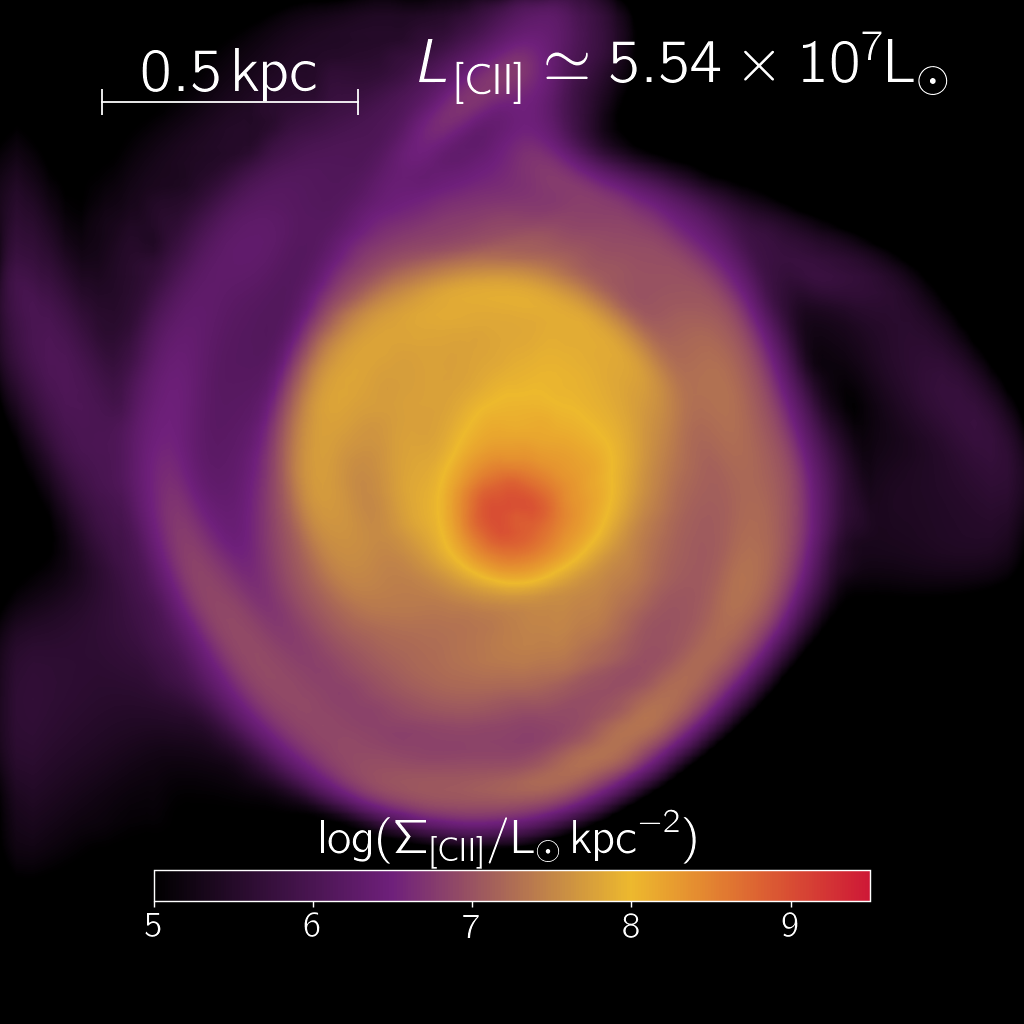
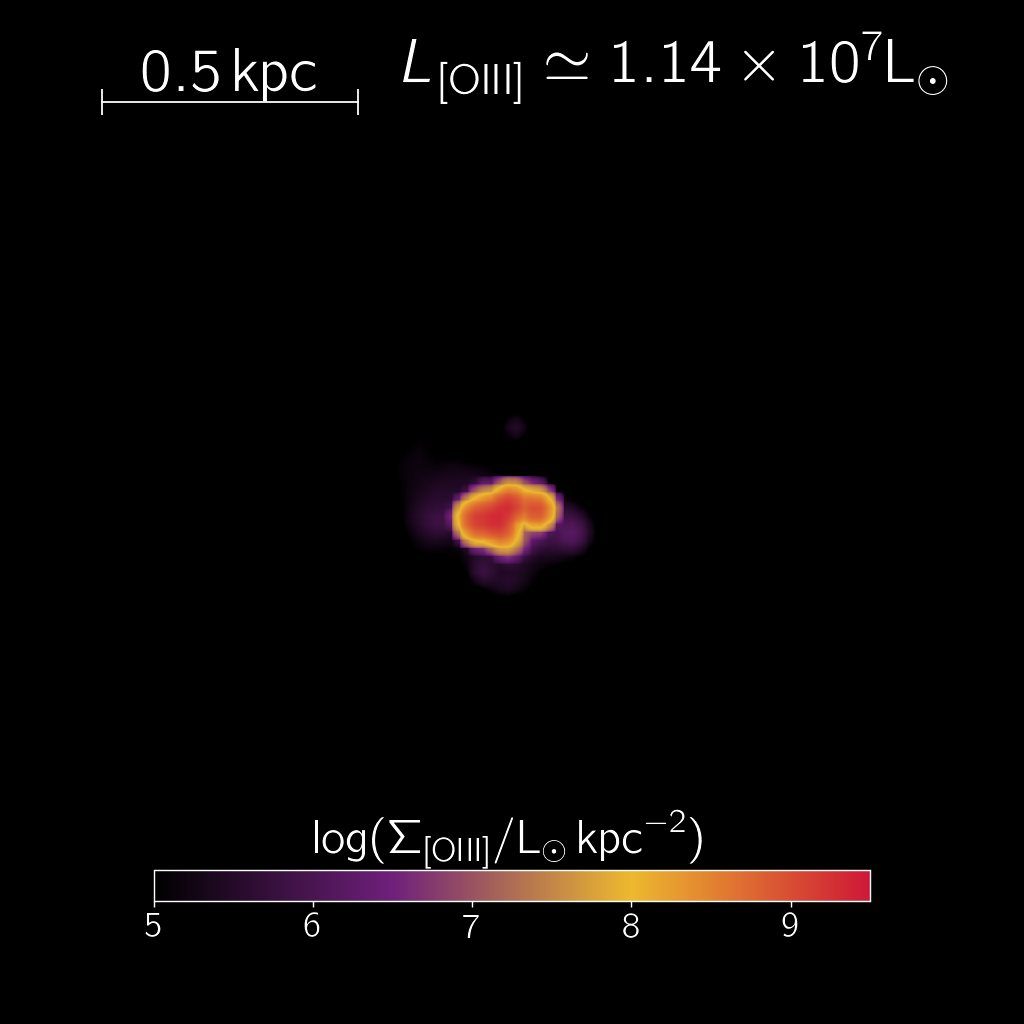
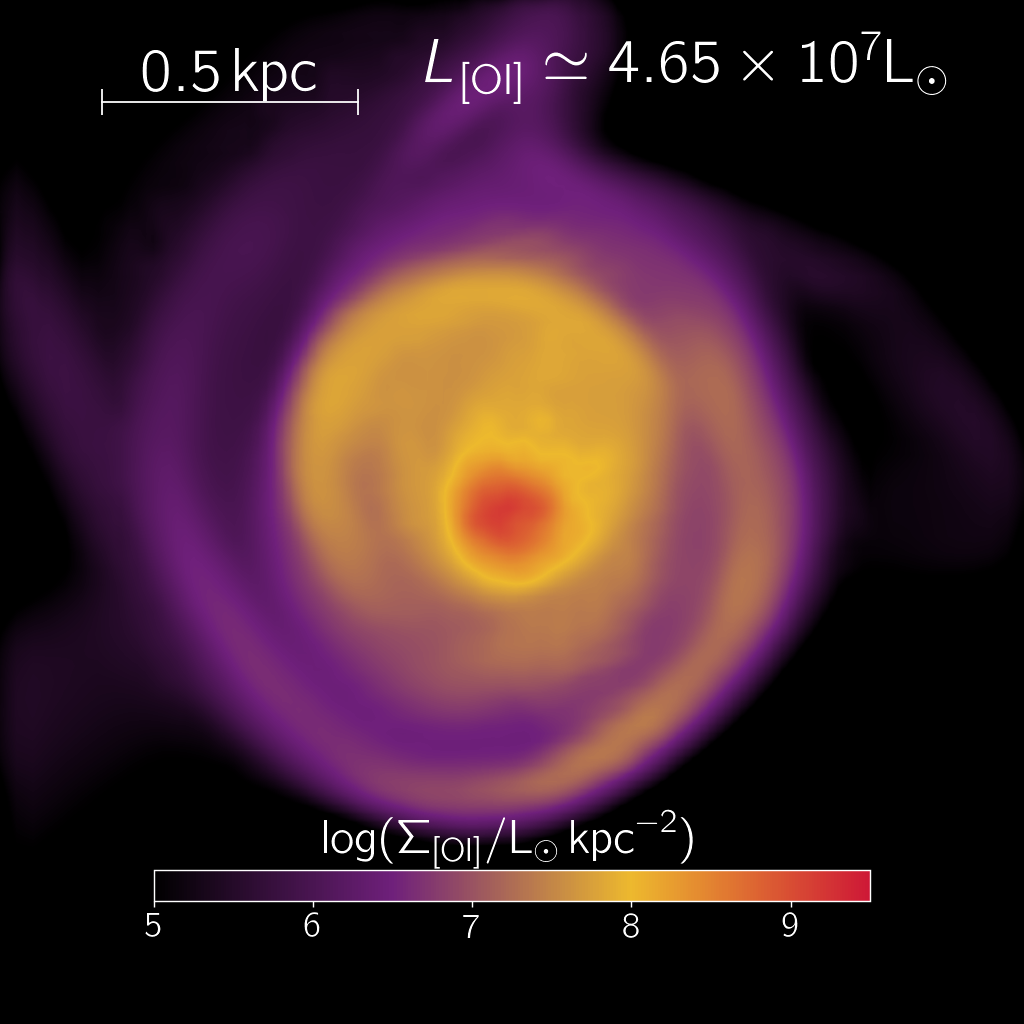
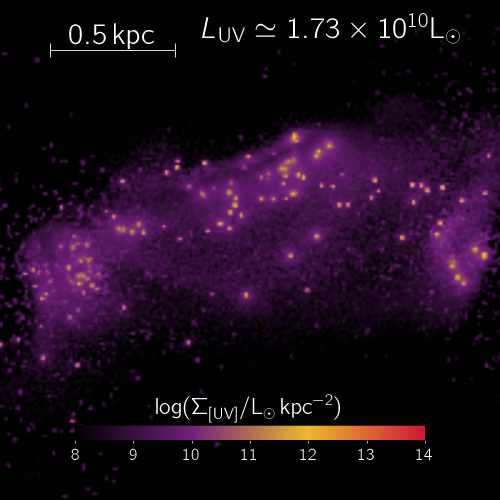
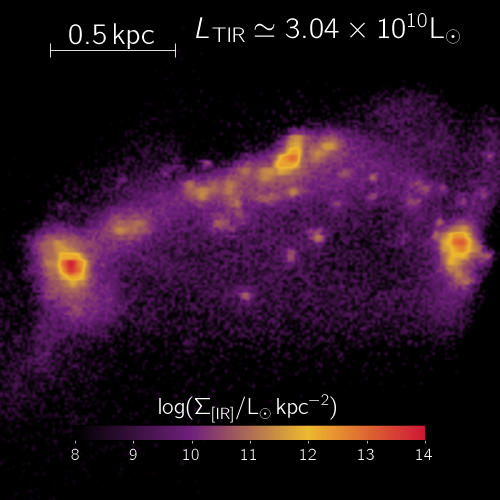
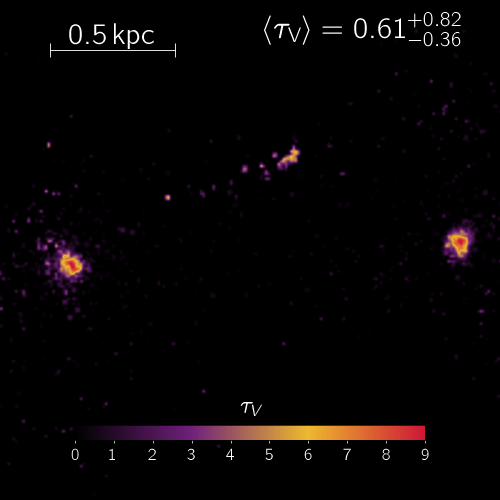
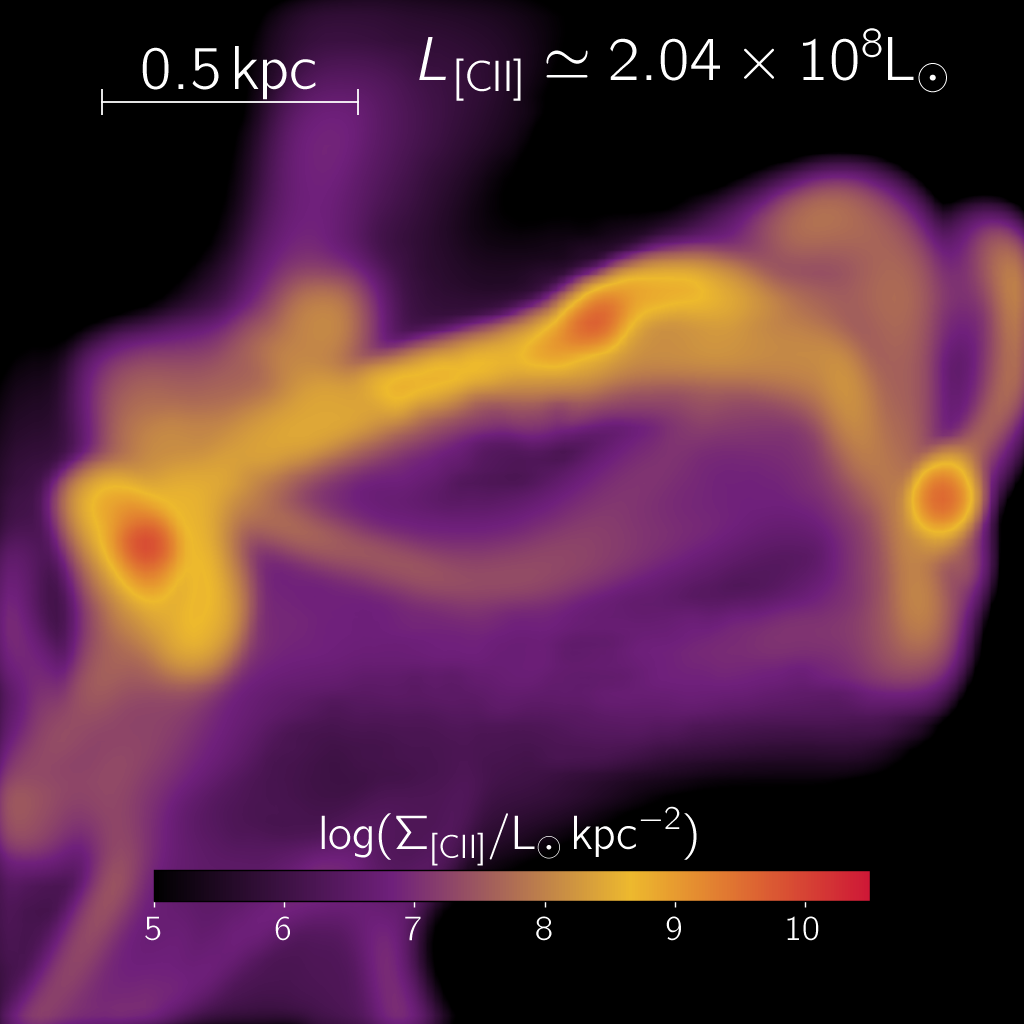
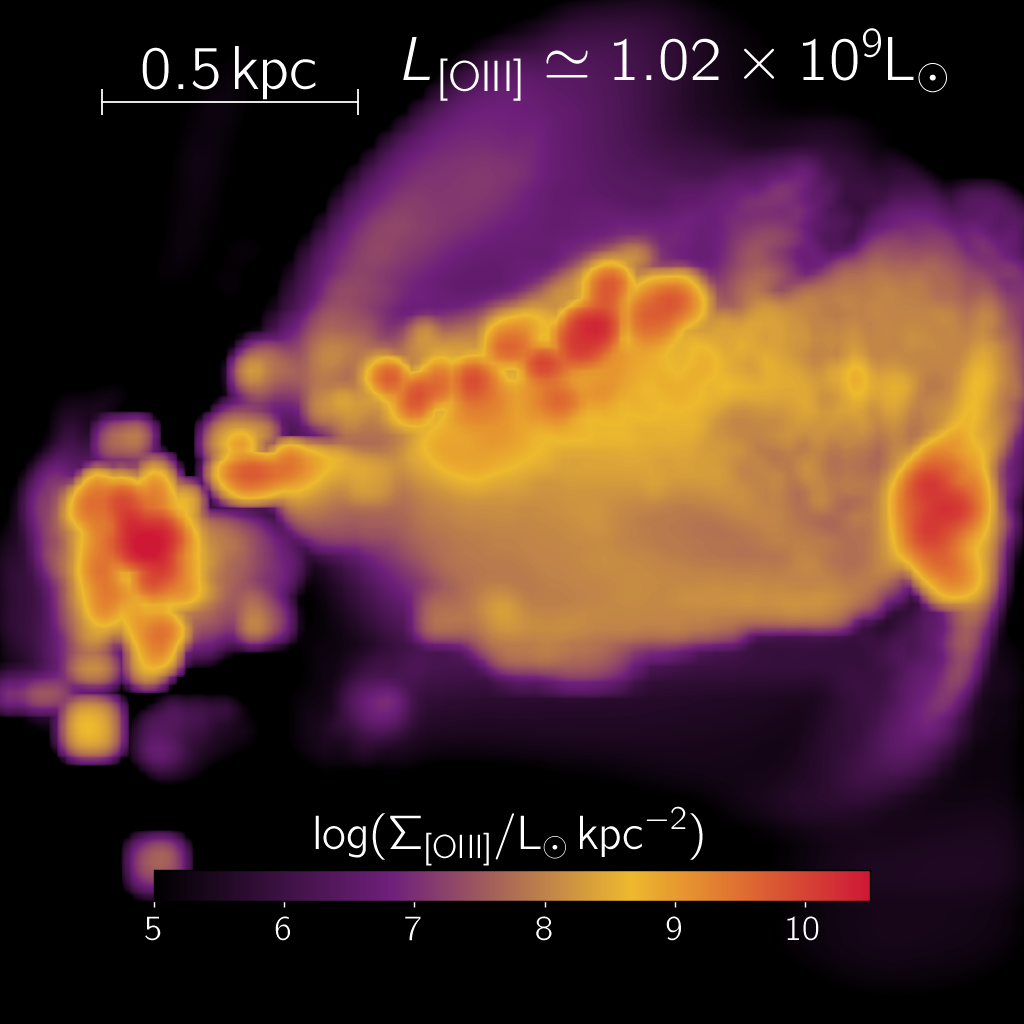
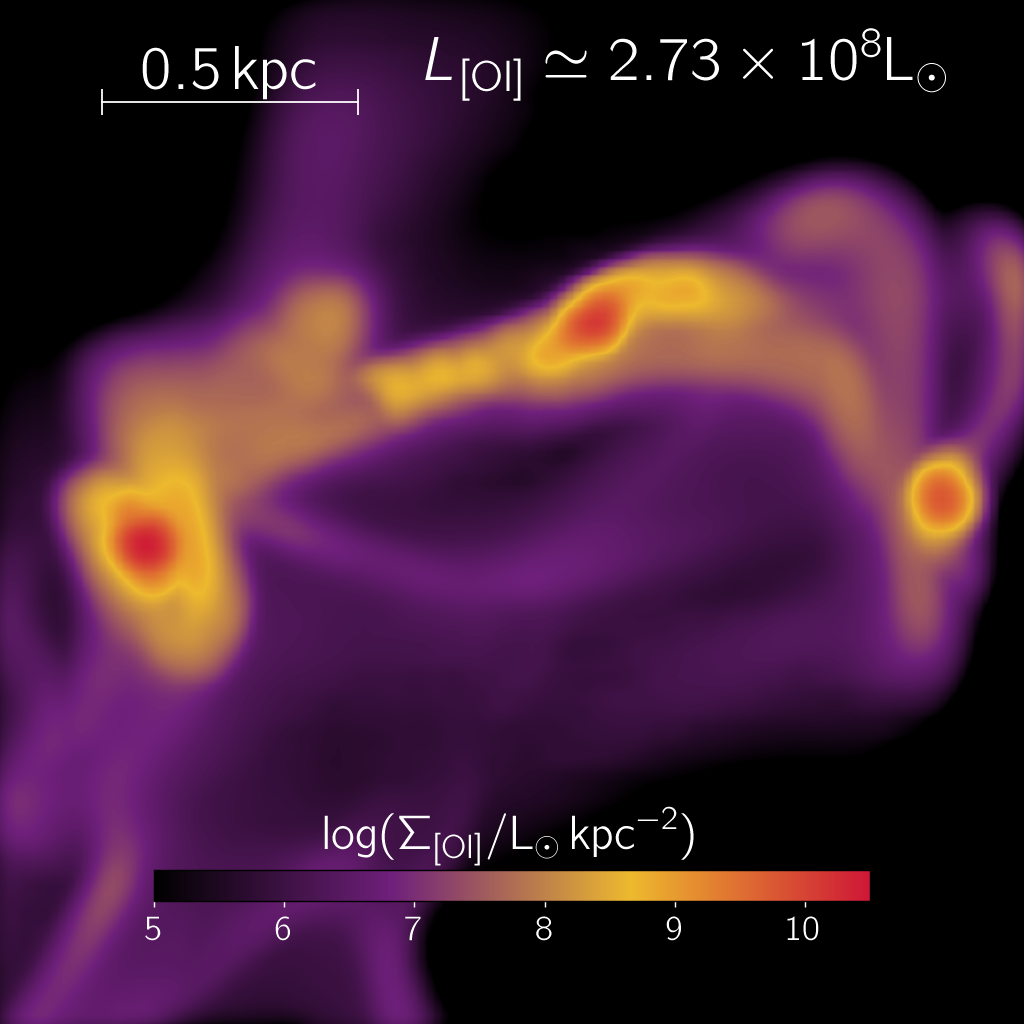
Before presenting statistical results for the entire serra sample at , we want to focus on the specific cases of 02:46:3788 and 05:46:6043, which are also known as “Dianthus” and “Zinnia”, respectively.
Both Dianthus and Zinnia have have similar stellar masses ( and ), star formation rates ( and ) and both are moderately bursty ( and ), i.e. within about the average of the survey.
The main emission properties of Dianthus and Zinnia are shown in Fig.s 8 and 9, respectively232323Here we focus on face-on views of the systems, however, we note that morphology and inclination can be important factors in determining the spectral shape and observed properties of galaxies (Behrens et al., 2018; Katz et al., 2019; Kohandel et al., 2019).. For the two, the morphology is very different: while Dianthus appears as a regular star forming galaxy, Zinnia has just experienced a merger (a very common situation at these high redshifts), and its stars/gas are still in the relaxation process (see Fig. 1).
Dianthus has a single peak for both continuum and line emission. The stellar component has a radius , with the UV being slightly less concentrated than the IR continuum. Instead, both the [C ] and the [O ]– tracing the gas distribution – have typical radii of , i.e. with a Perito ratio () similar to what is observed for high- targets (Carniani et al., 2018a) but not as extreme as for the [C ] halos observed for galaxies with higher masses (Ginolfi et al., 2020; Fujimoto et al., 2020). The [O ], being linked to the ionization parameter, is much more concentrated. The morphology of Zinnia appears elongated, with a maximum extension of about 1.5 kpc; three main components are clearly visible in the IR continuum (), and in various FIR lines (, for [C ], [O ], and [O ]]). The FIR line emission from different ions is mostly co-spatial for Zinnia, with a few noticeable differences. While [C ] and [O ] trace similar gas phases, the [O ] is more concentrated and shows higher surface brightness in the 3 main components (). The [C ] is instead fainter at the peaks () but brighter in the outskirts. The [O ] emission is particularly intense () and extended, making it the most luminous line, i.e. . Note that for both galaxies, the luminosity of [C ], [O ], [O ] is within the observed scatter for local dwarf galaxies with similar SFR (De Looze et al., 2014).
In Dianthus and Zinnia, all these prominent star forming knots are not visible in the UV, because these regions are significantly obscured (). On average, though, both galaxies are basically transparent, with . Interestingly, such a large optical depth is caused by a relatively little amount of dust () distributed in a compact region around the star forming sites. As a result of such geometry, the dust becomes hot.
In particular, the SED-fitted temperature is for Zinnia (Sommovigo et al., 2021). However, the mass-weighted temperature is lower, , is skewed toward the luminosity-weighted temperature of . The latter is boosted by the aforementioned pockets of dust around active star forming regions (already noted in Behrens et al. 2018) which therefore produce a blatant MIR excess over a standard grey-body spectrum. We warn that such large temperatures might be partially an artefact of numerical resolution; we defer the discussion of this issue to Sec. 3.6.2.
The emission properties of Zinnia (such as e.g. luminosity and surface brightness ratios, value for the luminosity of different tracers with SFR) are pretty typical of galaxies in serra. However, the morphological properties (extent of the line emission, multi-component emission) are highly disturbed by the merger episode. For observations of such multi-component galaxies, single-zone assumptions and usual calibrators (e.g. IRX- relation) adopted to infer their properties should be taken with care, as detailed in Ferrara et al. (2022) for the analysis of rebels galaxies (Bouwens et al., 2021).
In the next Sections we turn to the discussion of the entire galaxy sample.
3.6.1 UV production
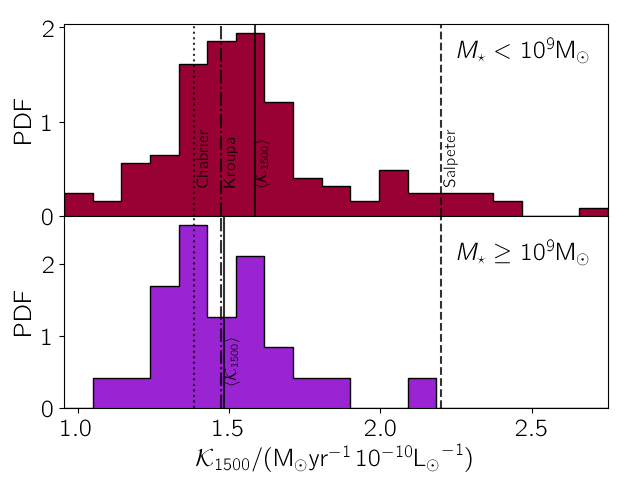
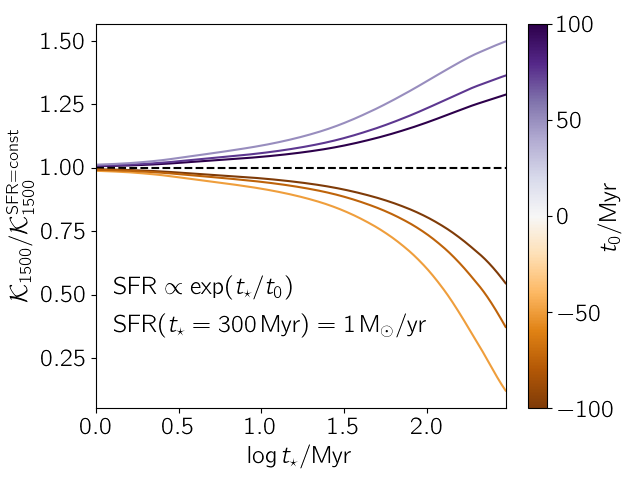
To quantify the production of UV photons by serra galaxies we introduce the commonly adopted (Madau & Dickinson, 2014) conversion factor , defined by
| (12) |
Observationally, is a particularly relevant quantity, since it can be used to infer the SFR from the UV data (e.g. Kennicutt & Evans, 2012; Madau & Dickinson, 2014). In general, depends on the IMF of the stellar population, its metallicity, and SFR history (SFRh). In the left panels of Fig. 10 we show the distribution of for the 202 serra galaxies, by using the intrinsic (i.e. unattenuated) value and computing the SFR in the last . Both distributions for low () and high () stellar masses show a central wide peak, while the tail is skewed at high (low) values for the low (high) masses242424For the PDF we show the distinction between high and low mass galaxies, since calculating the PDF for central and non-central galaxies gives negligible differences..
The average is for the low (high) stellar mass subsample. For the full sample we find instead . The above mean values are very close to the predictions () from a Kroupa (2001) IMF with , stellar age , and constant SFR (Madau & Dickinson, 2014). Although this might appear as a trivial result, given that a Kroupa (2001) IMF is also assumed in serra, the situation requires a deeper inspection.
In the right panel of Fig. 10, we show the dependence of from the SFRh. We calculate for a Kroupa (2001) IMF with and selecting an exponential function as a representative history, i.e. . We allow increasing and decreasing SFRh by changing the timescale : increasing (decreasing) SFRh has a larger (lower) value with respect to a constant SFR, as newly formed stars weight more in the computation. Generally, serra galaxies feature a time-increasing SFRh (Fig. 3); however, the increase seen in the range of is relatively modest (), particularly for galaxies, since their equivalent timescale is (see Fig. 2 in Pallottini et al., 2017b). The frequent bursts experienced by serra galaxies determine the spread of the PDF at higher and lower values around the mean, as a consequence of the sudden increase of the SFR and subsequent quenching due to stellar feedback, respectively. As a note of caution, while the difference between constant and exponentially increasing SFRh is relatively modest because of the expected value for from serra, assuming a decreasing SFRh for a SED fitting of a galaxy with an increasing SFRh can give a factor of variation in the SFR determination (see also Behrens et al., 2018).
3.6.2 Continuum properties
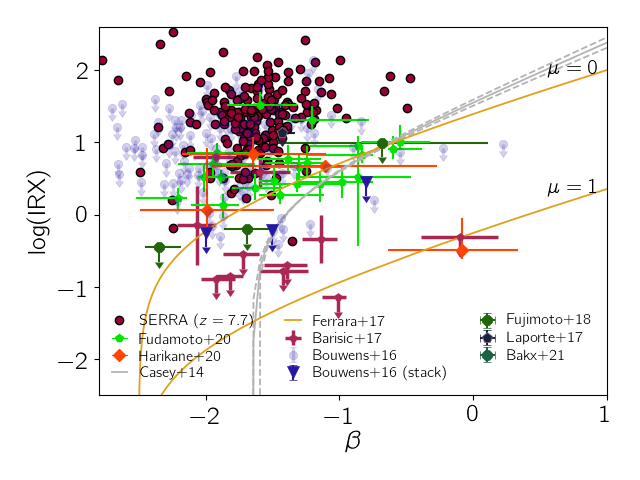
From the spectra of serra galaxies we compute252525In computing the IRX, we use a UV luminosity integrated in the 1000-3000 Å band. The differences with the often adopted monochromatic luminosity at 1600 Å is within few percent. , and the slope of the UV spectrum in the range () Å. The IRX relation is a convenient summary diagnostic that accounts for the relative balance between UV and FIR photons (Calzetti et al., 1994; Meurer et al., 1995). The results are presented in Fig. 11, along with high redshift detections and upper limits.
The bulk of serra galaxies have , as expected from a stellar population dominated by relatively unobscured, young stars. However, their IRX is typically , as expected from evolved and obscured systems. This apparent contradiction is easily understood as follows. To form stars, the gas must be able to self-shield from the photo-dissociating UV radiation field. This requires high densities, and the presence of a sufficient amount of dust (see also Fig. 5). Fig. 9 shows a clear spatial segregation between regions of high and low . The former have a low volume filling factor, high dust temperatures, and dominate the FIR emission. Low regions, previously cleared of dust and gas by stellar feedback, determine the slope, and provide most of the UV contribution. Such two-phase configuration, made of dense, opaque clouds and semi-transparent, diffuse medium, produces the observed spatial separation between UV and FIR emission.
This implies that the IRX- values of our simulated galaxies are located above the relation predicted by models in which molecular clouds are externally illuminated and contain relatively cold dust (Ferrara et al., 2017). Our results are in line with the suggestion by Casey et al. (2014), i.e. that galaxies with are dominated at all epochs by short bursts producing young OB stars that are primarily enshrouded in thick dust cocoons. The IRX- emerging from serra seems broadly consistent with most high- observations (Laporte et al., 2017a; Fudamoto et al., 2020; Harikane et al., 2020). However, we struggle to reproduce the relation when we consider upper limits (Bouwens et al., 2016; Fujimoto et al., 2017), and some of the detections (Barisic et al., 2017). The origin of this tension is two folded.
From the observational side, it is very difficult to determine the TIR luminosity. The information is typically recovered from a SED fitting with a grey body spectrum containing 3 parameters, namely (a) the dust mass (), (b) the emissivity (), and (c) the temperature . Typically only few (1-2) continuum bands are available for most high- targets (but see Bakx et al., 2021), so most determinations are done by assuming a based on low- estimates and templates (e.g. Barisic et al., 2017; Béthermin et al., 2020, see Sommovigo et al. 2021 for alternatives). Since and typically , IRX is extremely sensitive to the estimated or assumed value. Observations (Schreiber et al., 2018; Bakx et al., 2021) and models (Sommovigo et al., 2022) indicate that increases towards high redshifts. Thus, the IRX value of the currently available targets might be underestimated, perhaps indicating that at least some of the galaxies in the EoR are already highly obscured (Fudamoto et al., 2021). More robust dust temperature measurements, only made possible through high-frequency ALMA observations (e.g. BAND8/9) should relieve part of the current tension.
From the modelling side, our simulations might fall short in producing low obscuration systems, perhaps due to an insufficient feedback strength. In fact, the feedback treatment in serra, though accurate, is far from being complete, e.g. it lacks an explicit model for clustered SNe (Gentry et al., 2017; Martizzi, 2020), and cosmic-rays (Semenov et al., 2021; Rodríguez Montero et al., 2022), which at least locally are important contributors to the ISM energy budget. Their inclusion might change the emission properties of our galaxies.
In addition, a resolution of does not allow us to resolve the internal structure of molecular clouds, where most of the simulated FIR is produced. The internal gas/dust distribution in a MC can dramatically affect the dust temperature, as shown by Sommovigo et al. (2020). For example, a uniform distribution might result in dust as hot as ; when a more physical profile accounting for the effects of radiation pressure is adopted, the mean temperature drops to . Modeling the internal structure of MCs is beyond the reach of even the most refined cosmological zoom-in simulations.
Finally, simulations of individual MCs shows that – depending on the metallicity, turbulence and the observed band – 15% to 70% of the photons can escape from the cloud before it is disrupted (Decataldo et al., 2020; Kimm et al., 2022). If true, molecular clouds would contribute significantly to UV emission, at the same time reducing the FIR emission from our galaxies. Further exploration of this aspect is ongoing.
3.6.3 Line emission properties
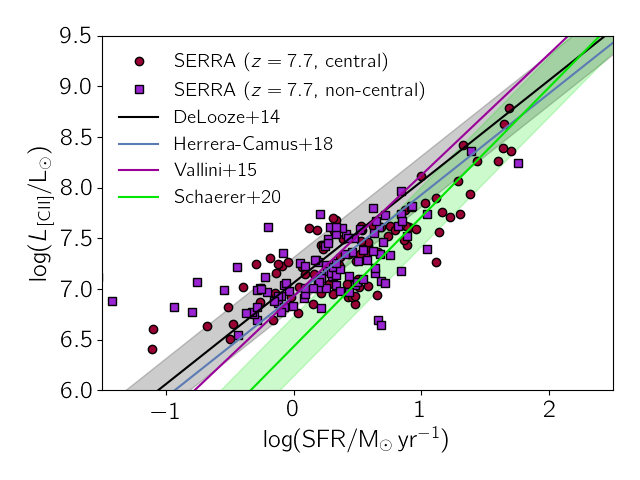
The (integrated) [C ]-SFR relation is presented in Fig. 12. Overall, serra galaxies at are consistent with local data (De Looze et al., 2014; Herrera-Camus et al., 2018), albeit with a larger scatter. This is expected on the basis of the early work by Carniani et al. (2018a) analysing 20 targets, and of the more recent analysis of the alpine sample presented in Schaerer et al. (2020, 118 targets). The scatter in the relation is driven by the larger spread of physical properties (such as , , ) deduced for high- galaxies (Vallini et al., 2015; Ferrara et al., 2019); further, the scatter appears to be larger for non-central objects, as a consequence of the interactions with their nearby more massive galaxy.
Overall, serra galaxies fall onto the alpine relation, but some tension seems present at , where the simulated data seems to flatten and join the local De Looze et al. (2014) relation. To this concern, we note that the detection limit for alpine galaxies is about (Le Fèvre et al., 2020; Schaerer et al., 2020). Deeper ALMA observations would be needed to probe the [C ]-SFR at more feeble star formation levels. Additionally, for serra galaxies at , the [C ] trend at shows an offset: small central galaxies tend to have lower [C ] with respect to non-central ones with the same SFR. This is mostly due to the fact that non-central are contaminated, i.e. they are formed in an environment that is pre-enriched by their more massive companion.
While the median values of integrated [C ]-SFR presents little differences at high and low redshift, recall that serra galaxies are typically located below the resolved - relation, as also found by high- observations (Carniani et al., 2018a). Such [C ]-deficiency has been discussed for a sub-sample of serra galaxies in Pallottini et al. (2019) and Vallini et al. (2021). It has been interpreted as a signature of an ongoing bursty star formation activity in these galaxies (high Ferrara et al., 2019, see Fig. 6).
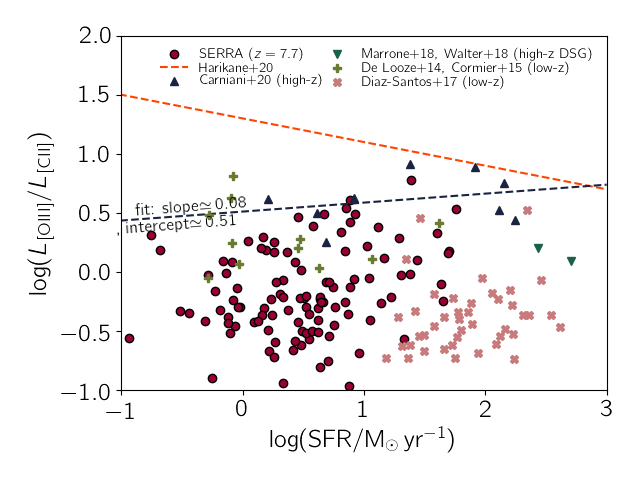
Because of the increasing availability of [O ] m line observations, the [C ]/[O ] ratio has become a viable tool to study the high- ISM. In Fig. 13 we plot the predicted ratio for the serra sample as a function of , along with an updated collection of both high- and local observations. The ratio for serra galaxies is in the range , and shows only a mild correlation with . A non negligible fraction of our systems has a low , as a result of the intermittent star formation activity discussed in Sec. 3.3.1. If the SFR is quenched for more than , the production of ionising photons drops, and the [O ] emission consequently fades away. This effect might be overestimated in serra, since in principle a better mass resolution would yield a finer sampling of the SFR process in those cases where the stellar feedback suppresses the SFR without completely quenching it. However, even simulations with a better mass resolution (e.g. Gutcke et al., 2022, vs adopted here) show a complete quenching of the SFR activity for long periods of time in low mass () systems.
Moreover, the observed values (Harikane et al., 2020) must be down revised when accounting for the concentration bias (Carniani et al., 2020), i.e. since [C ] is more extended then [O ], its low surface brightness emission is easier to miss, and implies that can be underestimated by a factor of , depending on the angular resolution and signal to noise ratio of the observation.
Fitting the data from Carniani et al. (2020) we obtain
| (13) |
i.e. a flatter curve with respect to Harikane et al. (2020), with rations that are about one order of magnitude lower at , where we currently have very few detections. Indeed, some of our galaxies can match the observed rations, however the bulk of serra galaxies have that are lower than the observed ones. It is interesting to note that while Dianthus (Fig. 8) and Zinnia (Fig. 9) have very similar properties (, , , ), is and , respectively; the former galaxy is a disk, the latter is a merger, which hints at the possibility that the dynamical state of the system can play an important role in the ratio determination; we are planning to explore the aspect more systematically in the future (see Rizzo et al., 2022).
While we need more observations to robustly determine a relation at high-, this is an indication that the ratios for high- targets tend to be more in line with those obtained for local galaxies (De Looze et al., 2014; Cormier et al., 2015; Díaz-Santos et al., 2017), and the serra ones (see also Vallini et al., 2021). Thus, we find no need to invoke alternative explanations, such as a top-heavy IMF or differential enrichment patterns for C and O, as explored in Arata et al. (2020) and Katz et al. (2022), which adopt the un-revised values for the ratio. While we can expect that variations of C and O abundances are present in the ISM of high- galaxies – which also have other implications and should be explored – the current data does not seem to call for extreme scenarios strongly. We stress that the above discussion must be taken with a grain of salt, as currently only 11 targets at high- have both [C ] and [O ] detections; in particular, it is still unclear if we are picking the brightest, more concentrated, [O ] emitter or seeing the bulk of the population. Considering that observational evidence and models agree on a very mild evolution of with , the latter option would imply that an evolution of the that is larger than predicted by the simulations, which would entail a revision of part of our modelling: only future observations will be able to test the different scenarios.
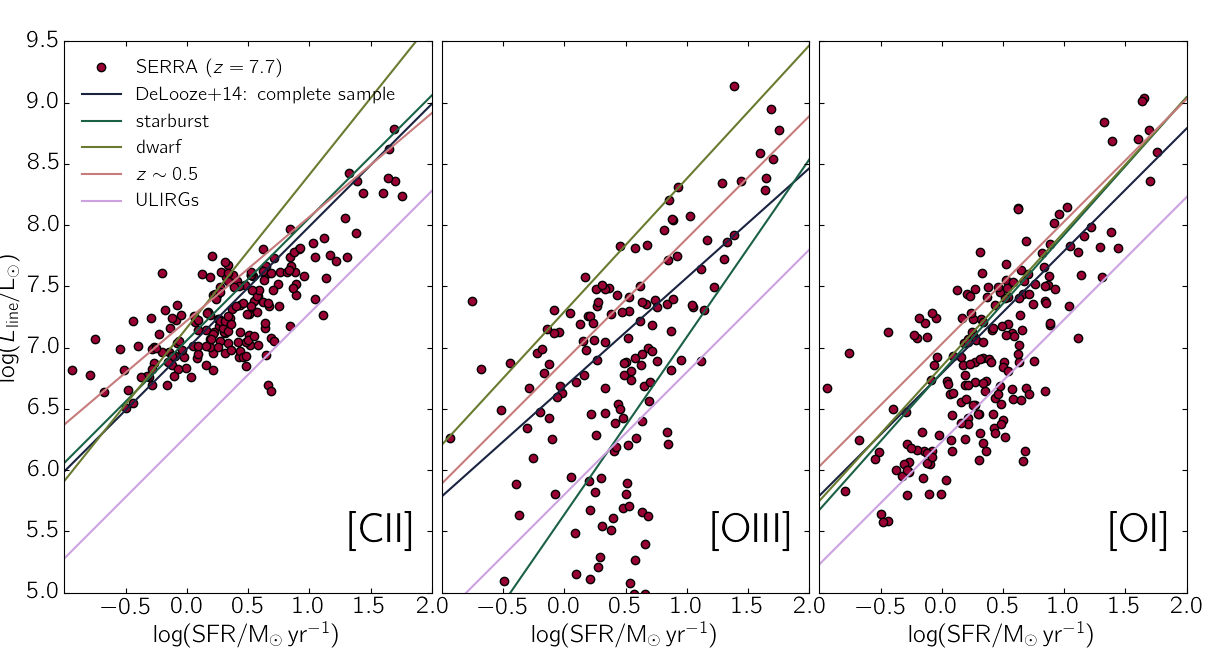
To conclude, we analyse the SFR dependence of different lines ([C ], [O ], and [O ] m) for simulated galaxies and compare it with all the available low-redshift data to assess whether early systems differ substantially from their local counterparts in this respect. In Fig. 14 we show the results using a collection of diverse samples, i.e. starbursts, dwarfs, and ULIRGs (De Looze et al., 2014).
Regarding the [C ], the bulk of serra follows the starbursts and relation; interestingly at the simulated galaxies are intermediate between starbursts and ULIRGs, and far from the slope characterising the dwarf galaxy population. Qualitatively, this is expected considering that serra galaxies have high IRX values for their (Fig. 11), a feature shared by many high- observed targets. Also, some of the rebels galaxies appear as scaled-down versions of dusty star forming galaxies (Fudamoto et al., 2021).
The [O ]-SFR relation is more complex. Most of the simulated high- galaxies follow the same trend of systems. However, a consistent fraction of the sample is found along the starburst locus; the remaining part contains galaxies which have their SFR temporarily quenched, and therefore showing a strongly reduced [O ] luminosity. The presence of single trend for [C ] and two trends for [O ] is the reason why no -SFR relation can be identified (see Fig. 13). The quenching is not fully captured by the value of the sSFR: also the burstiness plays a role, along with mean gas density and metallicity, which can give secondary dependences on the [O ] line (Vallini et al., 2021); the situation is complex, also considering that consistency with local line luminosity-SFR scaling relations (Fig. 14) does not automatically imply consistency of the line ratio vs SFR scaling (Fig. 13); we aim at addressing this point in a following work.
Finally, [O ] is an important tracer of the dense atomic and molecular regions, but so far it has been detected only in a single lensed galaxy with APEX (Rybak et al., 2020). Similarly to [C ], [O ] predictions from serra galaxies follow the trend for starbursts and targets, even tough the scatter appears somewhat larger. Although [O ] m is more luminous than [C ], unfortunately it falls in ALMA BAND9 for a object. Let us focus on a galaxy with a FWHM of (Kohandel et al., 2019); such object has , thus detection (S/N=5) in BAND9 would require of observing time262626This estimate is critically dependent on the galaxy location with respect to the atmospheric absorption lines, that are abundant in BAND9..
Note that [O ] m is shifted in the more favourable ALMA BAND7; the trend with SFR of the luminosity of [O ] m is similar to [O ] m (see also Lupi et al., 2020), however [O ] m is usually times fainter, thus a detection would require of observing time, i.e. similar to the other line.
Albeit challenging, detecting [O ] is feasible and crucial to clarify, for example, whether a differential C/O enrichment is in place at high-. While such an experiment can be attempted by using [C ] and [O ](Arata et al., 2020; Harikane et al., 2020), the latter is strongly dependent on ionising radiation, thus [O ] would represent a independent and cleaner probe. Further, [O ] lines fall both in BAND7 and BAND9; while trying to use the latter is typically regarded as a risky strategy, observations in BAND9 could simultaneously give both the [O ] and crucial information to constraint the dust temperature (Bakx et al., 2020), as it is closer to the continuum peak.
4 Summary
We introduce serra, a suite of zoom-in high-resolution (, at ) cosmological simulations including non-equilibrium chemistry and on-the-fly radiative transfer. The outputs are post-processed to derive galaxy UV+FIR continuum and emission line properties. Results are compared with available multi-wavelength data to constrain the physical properties (e.g., star formation rates, stellar/gas/dust mass, metallicity) of high-redshift galaxies.
In this flagship paper, we have focused our attention on the sample, consisting of 202 targets with a stellar mass range . These objects are resolved with a mass (spatial) resolution of (). The main highlights are the following.
-
•
All serra galaxies show a time-increasing SFR featuring rapid fluctuations, particularly evident at low masses, caused by stellar feedback and merging episodes. The specific SFR ranges from for young (), small galaxies () to for older () more massive ones (), in good agreement with high- data (Jiang et al., 2013; Rinaldi et al., 2021).
-
•
The simulated stellar-to-halo mass relation is consistent with abundance matching works (Behroozi et al., 2013a) for large halo masses, i.e. . In smaller halos (), the intense radiation from the first few formation events easily dissociate , causing relatively extended periods during which star formation is completely quenched, and the galaxy stays well below the Behroozi et al. (2013a) relation. After a series of bursts, a sufficient amount of dust is produced to allow an efficient self-shielding of , and a continuous SF activity which eventually brings the galaxy onto the stellar-to-halo mass relation.
- •
-
•
The size-stellar mass relation from serra is (see eq. 11). The relation has the same slope as the one observed in the local Universe (Brodie et al., 2011; Norris et al., 2014), but it is downshifted by about one order of magnitude because of redshift evolution (cfr Shibuya et al., 2015). The data from serra is consistent with lensed galaxies observed at high- (Bouwens et al., 2017; Vanzella et al., 2018), but our median has a systematic offset of a factor of .
-
•
The bulk of serra galaxies have , as expected from a stellar population dominated by relatively unobscured, young stars. However, their IRX is typically , as expected from evolved and obscured systems. The origin of this apparent contradiction resides in the multi-phase ISM structure in these systems, consisting of IR-emitting molecular clumps embedded in a semi-transparent, UV-emitting diffuse component. This configuration also produces a UV vs. dust continuum spatial offset.
-
•
Regarding line emission, serra is consistent with the observed [C ] observed at high- (Schaerer et al., 2020) and with the bulk of the inferred , when the observational concentration bias is accounted for (Carniani et al., 2020). Further, our results suggest that the dynamical state of the system (merger vs disk) can play an important role in determining the ratio.
-
•
Detection of [O ] is feasible but challenging, i.e. for a galaxy about in ALMA BAND9 (BAND7) are needed for the m (m) line. Its detection will bring crucial information on the metal enrichment patterns of individual elements in early galaxy systems. While risky, observations in BAND9 would be particularly rewarding, as they could simultaneously give both the [O ] and crucial information to constraint the dust temperature, as it is closer to the continuum peak.
Acknowledgements
AP, AF, MK, SC, LV, LS acknowledge support from the ERC Advanced Grant INTERSTELLAR H2020/740120 (PI: Ferrara). SS acknowledges support from the ERC Starting Grant NEFERTITI H2020/804240 (PI: Salvadori). Any dissemination of results must indicate that it reflects only the author’s view and that the Commission is not responsible for any use that may be made of the information it contains. This research was supported by the Munich Institute for Astro- and Particle Physics (MIAPP) of the DFG cluster of excellence “Origin and Structure of the Universe”. Partial support from the Carl Friedrich von Siemens-Forschungspreis der Alexander von Humboldt-Stiftung Research Award is kindly acknowledged. We acknowledge the CINECA award under the ISCRA initiative, for the availability of high performance computing resources and support from the Class B project SERRA HP10BPUZ8F (PI: Pallottini). We gratefully acknowledge computational resources of the Center for High Performance Computing (CHPC) at SNS. We acknowledge usage of the Python programming language (Van Rossum & de Boer, 1991; Van Rossum & Drake, 2009), Astropy (Astropy Collaboration et al., 2013), Cython (Behnel et al., 2011), Matplotlib (Hunter, 2007), NumPy (van der Walt et al., 2011), pynbody (Pontzen et al., 2013), and SciPy (Virtanen et al., 2020).
Data availability
The derived data generated in this research will be shared on reasonable requests to the corresponding author. Part of the data used for this study is available at the website http://cosmology.sns.it/data_access.html.
References
- Agertz & Kravtsov (2015) Agertz O., Kravtsov A. V., 2015, ApJ, 804, 18
- Agertz et al. (2013) Agertz O., Kravtsov A. V., Leitner S. N., Gnedin N. Y., 2013, ApJ, 770, 25
- Arata et al. (2020) Arata S., Yajima H., Nagamine K., Abe M., Khochfar S., 2020, MNRAS, 498, 5541
- Asplund et al. (2009) Asplund M., Grevesse N., Sauval A. J., Scott P., 2009, ARA&A, 47, 481
- Astropy Collaboration et al. (2013) Astropy Collaboration et al., 2013, A&A, 558, A33
- Aubert & Teyssier (2008) Aubert D., Teyssier R., 2008, MNRAS, 387, 295
- Baes & Camps (2015) Baes M., Camps P., 2015, Astronomy and Computing, 12, 33
- Bakx et al. (2020) Bakx T. J. L. C., et al., 2020, MNRAS, 493, 4294
- Bakx et al. (2021) Bakx T. J. L. C., et al., 2021, MNRAS, 508, L58
- Barisic et al. (2017) Barisic I., et al., 2017, ApJ, 845, 41
- Behnel et al. (2011) Behnel S., Bradshaw R., Citro C., Dalcin L., Seljebotn D., Smith K., 2011, Computing in Science Engineering, 13, 31
- Behrens et al. (2018) Behrens C., Pallottini A., Ferrara A., Gallerani S., Vallini L., 2018, MNRAS, 477, 552
- Behrens et al. (2019) Behrens C., Pallottini A., Ferrara A., Gallerani S., Vallini L., 2019, MNRAS, 486, 2197
- Behroozi & Silk (2015) Behroozi P. S., Silk J., 2015, ApJ, 799, 32
- Behroozi et al. (2013a) Behroozi P. S., Wechsler R. H., Wu H.-Y., 2013a, ApJ, 762, 109
- Behroozi et al. (2013b) Behroozi P. S., Wechsler R. H., Wu H.-Y., Busha M. T., Klypin A. A., Primack J. R., 2013b, ApJ, 763, 18
- Behroozi et al. (2013c) Behroozi P. S., Wechsler R. H., Conroy C., 2013c, ApJ, 770, 57
- Behroozi et al. (2019) Behroozi P., Wechsler R. H., Hearin A. P., Conroy C., 2019, MNRAS, 488, 3143
- Bertelli et al. (1994) Bertelli G., Bressan A., Chiosi C., Fagotto F., Nasi E., 1994, A&A Supp., 106, 275
- Béthermin et al. (2020) Béthermin M., et al., 2020, A&A, 643, A2
- Bothwell et al. (2010) Bothwell M. S., et al., 2010, MNRAS, 405, 219
- Bouché et al. (2007) Bouché N., et al., 2007, ApJ, 671, 303
- Bouwens et al. (2015) Bouwens R. J., et al., 2015, ApJ, 803, 34
- Bouwens et al. (2016) Bouwens R. J., et al., 2016, ApJ, 833, 72
- Bouwens et al. (2017) Bouwens R. J., Illingworth G. D., Oesch P. A., Maseda M., Ribeiro B., Stefanon M., Lam D., 2017, arXiv e-prints, p. arXiv:1711.02090
- Bouwens et al. (2021) Bouwens R. J., et al., 2021, arXiv e-prints, p. arXiv:2106.13719
- Bovino et al. (2016) Bovino S., Grassi T., Capelo P. R., Schleicher D. R. G., Banerjee R., 2016, A&A, 590, A15
- Bradac et al. (2017) Bradac M., et al., 2017, ApJL, 836, L2
- Brauher et al. (2008) Brauher J. R., Dale D. A., Helou G., 2008, ApJS, 178, 280
- Brodie et al. (2011) Brodie J. P., Romanowsky A. J., Strader J., Forbes D. A., 2011, AJ, 142, 199
- Bruzual & Charlot (2003) Bruzual G., Charlot S., 2003, MNRAS, 344, 1000
- Calzetti et al. (1994) Calzetti D., Kinney A. L., Storchi-Bergmann T., 1994, ApJ, 429, 582
- Camps & Baes (2015) Camps P., Baes M., 2015, Astronomy and Computing, 9, 20
- Capak et al. (2015) Capak P. L., et al., 2015, Nature, 522, 455
- Capelo et al. (2018) Capelo P. R., Bovino S., Lupi A., Schleicher D. R. G., Grassi T., 2018, MNRAS, 475, 3283
- Carniani et al. (2017) Carniani S., et al., 2017, A&A, 605, A42
- Carniani et al. (2018a) Carniani S., et al., 2018a, MNRAS, 478, 1170
- Carniani et al. (2018b) Carniani S., Maiolino R., Smit R., Amorín R., 2018b, ApJL, 854, L7
- Carniani et al. (2020) Carniani S., et al., 2020, MNRAS, 499, 5136
- Casey et al. (2014) Casey C. M., et al., 2014, ApJ, 796, 95
- Ceverino et al. (2015) Ceverino D., Primack J., Dekel A., 2015, MNRAS, 453, 408
- Ceverino et al. (2017) Ceverino D., Glover S. C. O., Klessen R. S., 2017, MNRAS, 470, 2791
- Chabrier (2003) Chabrier G., 2003, Publ. Astr. Soc. Pac., 115, 763
- Chardin et al. (2018) Chardin J., Kulkarni G., Haehnelt M. G., 2018, MNRAS, 478, 1065
- Cooray et al. (2020) Cooray A., Origins Space Telescope STDT Study Team 2020, in American Astronomical Society Meeting Abstracts #235. p. 311.02
- Cormier et al. (2015) Cormier D., et al., 2015, A&A, 578, A53
- Correa et al. (2015) Correa C. A., Wyithe J. S. B., Schaye J., Duffy A. R., 2015, MNRAS, 450, 1514
- Courant et al. (1928) Courant R., Friedrichs K., Lewy H., 1928, Mathematische Annalen, 100, 32
- Curti et al. (2017) Curti M., Cresci G., Mannucci F., Marconi A., Maiolino R., Esposito S., 2017, MNRAS, 465, 1384
- D’Odorico et al. (2018) D’Odorico V., et al., 2018, ApJL, 863, L29
- Daddi et al. (2010) Daddi E., et al., 2010, ApJ, 713, 686
- Dayal & Ferrara (2018) Dayal P., Ferrara A., 2018, Phys. Rep., 780, 1
- De Looze et al. (2014) De Looze I., et al., 2014, A&A, 568, A62
- De Looze et al. (2020) De Looze I., et al., 2020, MNRAS,
- Decataldo et al. (2019) Decataldo D., Pallottini A., Ferrara A., Vallini L., Gallerani S., 2019, MNRAS, 487, 3377
- Decataldo et al. (2020) Decataldo D., Lupi A., Ferrara A., Pallottini A., Fumagalli M., 2020, MNRAS, 497, 4718
- Deparis et al. (2019) Deparis N., Aubert D., Ocvirk P., Chardin J., Lewis J., 2019, A&A, 622, A142
- Di Mascia et al. (2021) Di Mascia F., et al., 2021, MNRAS, 503, 2349
- Díaz-Santos et al. (2013) Díaz-Santos T., et al., 2013, ApJ, 774, 68
- Díaz-Santos et al. (2017) Díaz-Santos T., et al., 2017, ApJ, 846, 32
- Dubois & Commerçon (2016) Dubois Y., Commerçon B., 2016, A&A, 585, A138
- Dubois & Teyssier (2008) Dubois Y., Teyssier R., 2008, A&A, 477, 79
- Dunlop (2013) Dunlop J. S., 2013, in Wiklind T., Mobasher B., Bromm V., eds, Astrophysics and Space Science Library Vol. 396, The First Galaxies. p. 223 (arXiv:1205.1543), doi:10.1007/978-3-642-32362-1_5
- Egami et al. (2018) Egami E., et al., 2018, Publ. Astr. Soc. Australia, 35
- Eisenstein & Hu (1998) Eisenstein D. J., Hu W., 1998, ApJ, 496, 605
- Emerick et al. (2019) Emerick A., Bryan G. L., Mac Low M.-M., 2019, MNRAS, 482, 1304
- Engels et al. (2019) Engels J. F., Schmidt W., Niemeyer J., 2019, MNRAS, 482, 4654
- Faisst et al. (2020) Faisst A. L., Fudamoto Y., Oesch P. A., Scoville N., Riechers D. A., Pavesi R., Capak P., 2020, MNRAS, 498, 4192
- Fakhouri et al. (2010) Fakhouri O., Ma C.-P., Boylan-Kolchin M., 2010, MNRAS, 406, 2267
- Farcy et al. (2022) Farcy M., Rosdahl J., Dubois Y., Blaizot J., Martin-Alvarez S., 2022, arXiv e-prints, p. arXiv:2202.01245
- Farrah et al. (2013) Farrah D., et al., 2013, ApJ, 776, 38
- Federrath & Klessen (2013) Federrath C., Klessen R. S., 2013, ApJ, 763, 51
- Feng et al. (2016) Feng Y., Di-Matteo T., Croft R. A., Bird S., Battaglia N., Wilkins S., 2016, MNRAS, 455, 2778
- Ferland et al. (2013) Ferland G. J., et al., 2013, Revista Mexicana de Astronomia y Astrofisica, 49, 137
- Ferland et al. (2017) Ferland G. J., et al., 2017, Rev. Mex. Astron. Astrofis., 53, 385
- Ferrara et al. (2017) Ferrara A., Hirashita H., Ouchi M., Fujimoto S., 2017, MNRAS, 471, 5018
- Ferrara et al. (2019) Ferrara A., Vallini L., Pallottini A., Gallerani S., Carniani S., Kohandel M., Decataldo D., Behrens C., 2019, MNRAS, 489, 1
- Ferrara et al. (2022) Ferrara A., et al., 2022, MNRAS,
- Feruglio et al. (2018) Feruglio C., et al., 2018, A&A, 619, A39
- Fiacconi et al. (2015) Fiacconi D., Feldmann R., Mayer L., 2015, MNRAS, 446, 1957
- Fudamoto et al. (2020) Fudamoto Y., et al., 2020, A&A, 643, A4
- Fudamoto et al. (2021) Fudamoto Y., et al., 2021, Nature, 597, 489
- Fujimoto et al. (2017) Fujimoto S., Ouchi M., Shibuya T., Nagai H., 2017, ApJ, 850, 83
- Fujimoto et al. (2019) Fujimoto S., et al., 2019, ApJ, 887, 107
- Fujimoto et al. (2020) Fujimoto S., et al., 2020, ApJ, 900, 1
- Gallerani et al. (2014) Gallerani S., Ferrara A., Neri R., Maiolino R., 2014, MNRAS, 445, 2848
- Gallerani et al. (2018) Gallerani S., Pallottini A., Feruglio C., Ferrara A., Maiolino R., Vallini L., Riechers D. A., Pavesi R., 2018, MNRAS, 473, 1909
- Galli & Palla (1998) Galli D., Palla F., 1998, A&A, 335, 403
- Gelli & al., in prep. (2022) Gelli V., al., in prep. 2022, 0, 0
- Gelli et al. (2020) Gelli V., Salvadori S., Pallottini A., Ferrara A., 2020, MNRAS,
- Gelli et al. (2021) Gelli V., Salvadori S., Ferrara A., Pallottini A., Carniani S., 2021, ApJL, 913, L25
- Gentry et al. (2017) Gentry E. S., Krumholz M. R., Dekel A., Madau P., 2017, MNRAS, 465, 2471
- Ginolfi et al. (2020) Ginolfi M., et al., 2020, A&A, 633, A90
- Gnedin (2010) Gnedin N. Y., 2010, ApJL, 721, L79
- Gnedin (2014) Gnedin N. Y., 2014, ApJ, 793, 29
- Gnedin (2016) Gnedin N. Y., 2016, ApJ, 833, 66
- Gnedin & Abel (2001) Gnedin N. Y., Abel T., 2001, New Astronomy, 6, 437
- Gnedin & Hollon (2012) Gnedin N. Y., Hollon N., 2012, ApJS, 202, 13
- González et al. (2010) González V., Labbé I., Bouwens R. J., Illingworth G., Franx M., Kriek M., Brammer G. B., 2010, ApJ, 713, 115
- Graciá-Carpio et al. (2011) Graciá-Carpio J., et al., 2011, ApJL, 728, L7
- Grassi et al. (2014) Grassi T., Bovino S., Schleicher D. R. G., Prieto J., Seifried D., Simoncini E., Gianturco F. A., 2014, MNRAS, 439, 2386
- Guillet & Teyssier (2011) Guillet T., Teyssier R., 2011, Journal of Computational Physics, 230, 4756
- Gutcke et al. (2022) Gutcke T. A., Pakmor R., Naab T., Springel V., 2022, MNRAS,
- Haardt & Madau (2012) Haardt F., Madau P., 2012, ApJ, 746, 125
- Habing (1968) Habing H. J., 1968, Bull. Astron. Inst. Netherlands, 19, 421
- Hahn & Abel (2011) Hahn O., Abel T., 2011, MNRAS, 415, 2101
- Harikane et al. (2018) Harikane Y., et al., 2018, ApJ, 859, 84
- Harikane et al. (2020) Harikane Y., et al., 2020, ApJ, 896, 93
- Hashimoto et al. (2019) Hashimoto T., et al., 2019, Pub. Astron. Soc. Japan, 71, 71
- Heiderman et al. (2010) Heiderman A., Evans Neal J. I., Allen L. E., Huard T., Heyer M., 2010, ApJ, 723, 1019
- Herrera-Camus et al. (2015) Herrera-Camus R., et al., 2015, ApJ, 800, 1
- Herrera-Camus et al. (2018) Herrera-Camus R., et al., 2018, ApJ, 861, 95
- Hindmarsh (2019) Hindmarsh A. C., 2019, ODEPACK: Ordinary differential equation solver library (ascl:1905.021)
- Hirashita & Ferrara (2002) Hirashita H., Ferrara A., 2002, MNRAS, 337, 921
- Hopkins et al. (2014) Hopkins P. F., Kereš D., Oñorbe J., Faucher-Giguère C.-A., Quataert E., Murray N., Bullock J. S., 2014, MNRAS, 445, 581
- Hopkins et al. (2018) Hopkins P. F., et al., 2018, MNRAS, 480, 800
- Hopkins et al. (2020) Hopkins P. F., Grudić M. Y., Wetzel A., Kereš D., Faucher-Giguère C.-A., Ma X., Murray N., Butcher N., 2020, MNRAS, 491, 3702
- Hunter (2007) Hunter J. D., 2007, Computing in Science Engineering, 9, 90
- Iapichino et al. (2017) Iapichino L., Federrath C., Klessen R. S., 2017, MNRAS, 469, 3641
- Inoue et al. (2016a) Inoue A. K., et al., 2016a, Science, 352, 1559
- Inoue et al. (2016b) Inoue S., Dekel A., Mandelker N., Ceverino D., Bournaud F., Primack J., 2016b, MNRAS, 456, 2052
- Ivlev et al. (2015) Ivlev A. V., Padovani M., Galli D., Caselli P., 2015, ApJ, 812, 135
- Jaacks et al. (2018) Jaacks J., Thompson R., Finkelstein S. L., Bromm V., 2018, MNRAS, 475, 4396
- Jiang et al. (2013) Jiang L., et al., 2013, ApJ, 773, 153
- Johnson et al. (2013) Johnson J. L., Dalla V. C., Khochfar S., 2013, MNRAS, 428, 1857
- Jones et al. (2017) Jones G. C., Willott C. J., Carilli C. L., Ferrara A., Wang R., Wagg J., 2017, ApJ, 845, 175
- Jura (1975) Jura M., 1975, ApJ, 197, 575
- Kanekar et al. (2013) Kanekar N., Wagg J., Ram Chary R., Carilli C. L., 2013, ApJL, 771, L20
- Kannan et al. (2022) Kannan R., Garaldi E., Smith A., Pakmor R., Springel V., Vogelsberger M., Hernquist L., 2022, MNRAS, 511, 4005
- Katz et al. (2017) Katz H., Kimm T., Sijacki D., Haehnelt M. G., 2017, MNRAS, 468, 4831
- Katz et al. (2019) Katz H., Laporte N., Ellis R. S., Devriendt J., Slyz A., 2019, MNRAS, 484, 4054
- Katz et al. (2022) Katz H., et al., 2022, MNRAS, 510, 5603
- Kennicutt (1998) Kennicutt Jr. R. C., 1998, ApJ, 498, 541
- Kennicutt & Evans (2012) Kennicutt R. C., Evans N. J., 2012, ARA&A, 50, 531
- Kewley & Dopita (2002) Kewley L. J., Dopita M. A., 2002, ApJS, 142, 35
- Kimm et al. (2022) Kimm T., Bieri R., Geen S., Rosdahl J., Blaizot J., Michel-Dansac L., Garel T., 2022, ApJS, 259, 21
- Knebe et al. (2013) Knebe A., et al., 2013, MNRAS, 428, 2039
- Knudsen et al. (2016) Knudsen K. K., Richard J., Kneib J.-P., Jauzac M., Clément B., Drouart G., Egami E., Lindroos L., 2016, MNRAS, 462, L6
- Kohandel et al. (2019) Kohandel M., Pallottini A., Ferrara A., Zanella A., Behrens C., Carniani S., Gallerani S., Vallini L., 2019, MNRAS, 487, 3007
- Kohandel et al. (2020) Kohandel M., Pallottini A., Ferrara A., Carniani S., Gallerani S., Vallini L., Zanella A., Behrens C., 2020, MNRAS, 499, 1250
- Kroupa (2001) Kroupa P., 2001, MNRAS, 322, 231
- Krumholz (2015) Krumholz M. R., 2015, preprint, (arXiv:1511.03457)
- Laporte et al. (2017a) Laporte N., et al., 2017a, ApJL, 837, L21
- Laporte et al. (2017b) Laporte N., Nakajima K., Ellis R. S., Zitrin A., Stark D. P., Mainali R., Roberts-Borsani G. W., 2017b, ApJ, 851, 40
- Le Fèvre et al. (2020) Le Fèvre O., et al., 2020, A&A, 643, A1
- Leitherer et al. (1999) Leitherer C., et al., 1999, ApJS, 123, 3
- Leung et al. (2020) Leung T. K. D., Pallottini A., Ferrara A., Mac Low M.-M., 2020, ApJ, 895, 24
- Liang et al. (2019) Liang L., et al., 2019, MNRAS, p. 2072
- Loiacono et al. (2021) Loiacono F., et al., 2021, A&A, 646, A76
- Lovell et al. (2021) Lovell C. C., Vijayan A. P., Thomas P. A., Wilkins S. M., Barnes D. J., Irodotou D., Roper W., 2021, MNRAS, 500, 2127
- Lupi (2019) Lupi A., 2019, MNRAS, 484, 1687
- Lupi et al. (2018) Lupi A., Bovino S., Capelo P. R., Volonteri M., Silk J., 2018, MNRAS, 474, 2884
- Lupi et al. (2020) Lupi A., Pallottini A., Ferrara A., Bovino S., Carniani S., Vallini L., 2020, MNRAS, 496, 5160
- Ma et al. (2018) Ma X., et al., 2018, MNRAS, 478, 1694
- Mac Low (1999) Mac Low M.-M., 1999, ApJ, 524, 169
- Madau & Dickinson (2014) Madau P., Dickinson M., 2014, ARA&A, 52, 415
- Maio & Tescari (2015) Maio U., Tescari E., 2015, MNRAS, 453, 3798
- Maiolino & Mannucci (2019) Maiolino R., Mannucci F., 2019, A&A Rev., 27, 3
- Maiolino et al. (2015) Maiolino R., et al., 2015, MNRAS, 452, 54
- Mancini et al. (2015) Mancini M., Schneider R., Graziani L., Valiante R., Dayal P., Maio U., Ciardi B., Hunt L. K., 2015, MNRAS, 451, L70
- Marrone et al. (2018) Marrone D. P., et al., 2018, Nature, 553, 51
- Martizzi (2020) Martizzi D., 2020, MNRAS, 492, 79
- Matthee et al. (2017) Matthee J., et al., 2017, ApJ, 851, 145
- Meurer et al. (1995) Meurer G. R., Heckman T. M., Leitherer C., Kinney A., Robert C., Garnett D. R., 1995, AJ, 110, 2665
- Moster et al. (2013) Moster B. P., Naab T., White S. D. M., 2013, MNRAS, 428, 3121
- Moster et al. (2018) Moster B. P., Naab T., White S. D. M., 2018, MNRAS, 477, 1822
- Murray (2011) Murray N., 2011, ApJ, 729, 133
- Murray et al. (2013) Murray S. G., Power C., Robotham A. S. G., 2013, Astronomy and Computing, 3, 23
- Norris et al. (2014) Norris M. A., et al., 2014, MNRAS, 443, 1151
- O’Shea et al. (2015a) O’Shea B. W., Wise J. H., Xu H., Norman M. L., 2015a, ApJL, 807, L12
- O’Shea et al. (2015b) O’Shea B. W., Wise J. H., Xu H., Norman M. L., 2015b, ApJL, 807, L12
- Ocvirk et al. (2020) Ocvirk P., et al., 2020, MNRAS, 496, 4087
- Oesch et al. (2018) Oesch P. A., Bouwens R. J., Illingworth G. D., Labbé I., Stefanon M., 2018, ApJ, 855, 105
- Olsen et al. (2015) Olsen K. P., Greve T. R., Narayanan D., Thompson R., Toft S., Brinch C., 2015, ApJ, 814, 76
- Olsen et al. (2017) Olsen K., Greve T. R., Narayanan D., Thompson R., Davé R., Niebla Rios L., Stawinski S., 2017, ApJ, 846, 105
- Olsen et al. (2018) Olsen K., et al., 2018, Galaxies, 6, 100
- Onorbe et al. (2014) Onorbe J., Garrison-Kimmel S., Maller A. H., Bullock J. S., Rocha M., Hahn O., 2014, MNRAS, 437, 1894
- Ostriker & McKee (1988) Ostriker J. P., McKee C. F., 1988, Reviews of Modern Physics, 60, 1
- Ota et al. (2014) Ota K., et al., 2014, ApJ, 792, 34
- Ouchi et al. (2013) Ouchi M., et al., 2013, ApJ, 778, 102
- Padovani et al. (2018) Padovani M., Galli D., Ivlev A. V., Caselli P., Ferrara A., 2018, A&A, 619, A144
- Pallottini et al. (2014) Pallottini A., Ferrara A., Gallerani S., Salvadori S., D’Odorico V., 2014, MNRAS, 440, 2498
- Pallottini et al. (2017a) Pallottini A., Ferrara A., Gallerani S., Vallini L., Maiolino R., Salvadori S., 2017a, MNRAS, 465, 2540
- Pallottini et al. (2017b) Pallottini A., Ferrara A., Bovino S., Vallini L., Gallerani S., Maiolino R., Salvadori S., 2017b, MNRAS, 471, 4128
- Pallottini et al. (2019) Pallottini A., et al., 2019, MNRAS, 487, 1689
- Parkin et al. (2013) Parkin T. J., et al., 2013, ApJ, 776, 65
- Pavesi et al. (2019) Pavesi R., Riechers D. A., Faisst A. L., Stacey G. J., Capak P. L., 2019, ApJ, 882, 168
- Pentericci et al. (2016) Pentericci L., et al., 2016, ApJL, 829, L11
- Pfrommer et al. (2017) Pfrommer C., Pakmor R., Schaal K., Simpson C. M., Springel V., 2017, MNRAS, 465, 4500
- Pillepich et al. (2018) Pillepich A., et al., 2018, MNRAS, 473, 4077
- Pillepich et al. (2019) Pillepich A., et al., 2019, MNRAS, 490, 3196
- Pizzati et al. (2020) Pizzati E., Ferrara A., Pallottini A., Gallerani S., Vallini L., Decataldo D., Fujimoto S., 2020, MNRAS, 495, 160
- Planck Collaboration et al. (2014) Planck Collaboration et al., 2014, A&A, 571, A16
- Pontzen et al. (2013) Pontzen A., Rovskar R., Stinson G. S., Woods R., Reed D. M., Coles J., Quinn T. R., 2013, pynbody: Astrophysics Simulation Analysis for Python
- Popping et al. (2017) Popping G., Somerville R. S., Galametz M., 2017, MNRAS, 471, 3152
- Popping et al. (2019) Popping G., Narayanan D., Somerville R. S., Faisst A. L., Krumholz M. R., 2019, MNRAS, 482, 4906
- Rahmati et al. (2013) Rahmati A., Pawlik A. H., Raicevic M., Schaye J., 2013, MNRAS, 430, 2427
- Rasera & Teyssier (2006) Rasera Y., Teyssier R., 2006, A&A, 445, 1
- Richings et al. (2014) Richings A. J., Schaye J., Oppenheimer B. D., 2014, MNRAS, 442, 2780
- Rinaldi et al. (2021) Rinaldi P., Caputi K. I., van Mierlo S., Ashby M. L. N., Caminha G. B., Iani E., 2021, arXiv e-prints, p. arXiv:2112.03935
- Rizzo et al. (2022) Rizzo F., Kohandel M., Pallottini A., Zanella A., Ferrara A., Vallini L., Toft S., 2022, arXiv e-prints, p. arXiv:2204.05325
- Rodríguez Montero et al. (2022) Rodríguez Montero F., Martin-Alvarez S., Sijacki D., Slyz A., Devriendt J., Dubois Y., 2022, MNRAS, 511, 1247
- Rosdahl & Teyssier (2015) Rosdahl J., Teyssier R., 2015, MNRAS, 449, 4380
- Rosdahl et al. (2013) Rosdahl J., Blaizot J., Aubert D., Stranex T., Teyssier R., 2013, MNRAS, 436, 2188
- Rosdahl et al. (2017) Rosdahl J., Schaye J., Dubois Y., Kimm T., Teyssier R., 2017, MNRAS, 466, 11
- Rosdahl et al. (2018) Rosdahl J., et al., 2018, MNRAS, 479, 994
- Rybak et al. (2020) Rybak M., Zavala J. A., Hodge J. A., Casey C. M., Werf P. v. d., 2020, ApJL, 889, L11
- Salpeter (1955) Salpeter E. E., 1955, ApJ, 121, 161
- Sargsyan et al. (2012) Sargsyan L., et al., 2012, ApJ, 755, 171
- Scannapieco & Brüggen (2010) Scannapieco E., Brüggen M., 2010, MNRAS, 405, 1634
- Schaerer et al. (2015) Schaerer D., Boone F., Zamojski M., Staguhn J., Dessauges-Zavadsky M., Finkelstein S., Combes F., 2015, A&A, 574, A19
- Schaerer et al. (2020) Schaerer D., et al., 2020, A&A, 643, A3
- Schaller et al. (2015) Schaller M., Dalla Vecchia C., Schaye J., Bower R. G., Theuns T., Crain R. A., Furlong M., McCarthy I. G., 2015, MNRAS, 454, 2277
- Schmidt (1959) Schmidt M., 1959, ApJ, 129, 243
- Schreiber et al. (2018) Schreiber C., Elbaz D., Pannella M., Ciesla L., Wang T., Franco M., 2018, A&A, 609, A30
- Semenov et al. (2016) Semenov V. A., Kravtsov A. V., Gnedin N. Y., 2016, ApJ, 826, 200
- Semenov et al. (2018) Semenov V. A., Kravtsov A. V., Gnedin N. Y., 2018, ApJ, 861, 4
- Semenov et al. (2021) Semenov V. A., Kravtsov A. V., Caprioli D., 2021, ApJ, 910, 126
- Sheth & Tormen (1999) Sheth R. K., Tormen G., 1999, MNRAS, 308, 119
- Shibuya et al. (2015) Shibuya T., Ouchi M., Harikane Y., 2015, ApJS, 219, 15
- Smit et al. (2018) Smit R., et al., 2018, Nature, 553, 178
- Smith et al. (2018) Smith B. D., Regan J. A., Downes T. P., Norman M. L., O’Shea B. W., Wise J. H., 2018, MNRAS, 480, 3762
- Sommovigo et al. (2020) Sommovigo L., Ferrara A., Pallottini A., Carniani S., Gallerani S., Decataldo D., 2020, MNRAS,
- Sommovigo et al. (2021) Sommovigo L., Ferrara A., Carniani S., Zanella A., Pallottini A., Gallerani S., Vallini L., 2021, MNRAS, 503, 4878
- Sommovigo et al. (2022) Sommovigo L., et al., 2022, MNRAS,
- Spinoglio et al. (2017) Spinoglio L., et al., 2017, Publ. Astr. Soc. Australia, 34, e057
- Srisawat et al. (2013) Srisawat C., et al., 2013, MNRAS, 436, 150
- Stacey et al. (1991) Stacey G. J., Geis N., Genzel R., Lugten J. B., Poglitsch A., Sternberg A., Townes C. H., 1991, ApJ, 373, 423
- Stark et al. (2013) Stark D. P., Schenker M. A., Ellis R., Robertson B., McLure R., Dunlop J., 2013, ApJ, 763, 129
- Stecher & Williams (1967) Stecher T. P., Williams D. A., 1967, ApJL, 149, L29
- Tacchella et al. (2018) Tacchella S., Bose S., Conroy C., Eisenstein D. J., Johnson B. D., 2018, ApJ, 868, 92
- Tacconi et al. (2010) Tacconi L. J., et al., 2010, Nature, 463, 781
- Tamura et al. (2019) Tamura Y., et al., 2019, ApJ, 874, 27
- Teyssier (2002) Teyssier R., 2002, A&A, 385, 337
- Teyssier et al. (2013) Teyssier R., Pontzen A., Dubois Y., Read J. I., 2013, MNRAS, 429, 3068
- Trebitsch et al. (2017) Trebitsch M., Blaizot J., Rosdahl J., Devriendt J., Slyz A., 2017, MNRAS, 470, 224
- Ucci et al. (2019) Ucci G., et al., 2019, MNRAS, 483, 1295
- Valle et al. (2002) Valle G., Ferrini F., Galli D., Shore S. N., 2002, ApJ, 566, 252
- Vallini et al. (2013) Vallini L., Gallerani S., Ferrara A., Baek S., 2013, MNRAS, 433, 1567
- Vallini et al. (2015) Vallini L., Gallerani S., Ferrara A., Pallottini A., Yue B., 2015, ApJ, 813, 36
- Vallini et al. (2017) Vallini L., Ferrara A., Pallottini A., Gallerani S., 2017, MNRAS, 467, 1300
- Vallini et al. (2018) Vallini L., Pallottini A., Ferrara A., Gallerani S., Sobacchi E., Behrens C., 2018, MNRAS, 473, 271
- Vallini et al. (2019) Vallini L., Tielens A. G. G. M., Pallottini A., Gallerani S., Gruppioni C., Carniani S., Pozzi F., Talia M., 2019, MNRAS, 490, 4502
- Vallini et al. (2020) Vallini L., Ferrara A., Pallottini A., Carniani S., Gallerani S., 2020, MNRAS, 495, L22
- Vallini et al. (2021) Vallini L., Ferrara A., Pallottini A., Carniani S., Gallerani S., 2021, MNRAS, 505, 5543
- Van Rossum & Drake (2009) Van Rossum G., Drake F. L., 2009, Python 3 Reference Manual. CreateSpace, Scotts Valley, CA
- Van Rossum & de Boer (1991) Van Rossum G., de Boer J., 1991, CWI Quarterly, 4, 283
- Vanzella et al. (2017) Vanzella E., et al., 2017, MNRAS, 467, 4304
- Vanzella et al. (2018) Vanzella E., et al., 2018, MNRAS,
- Virtanen et al. (2020) Virtanen P., et al., 2020, Nature Methods, 17, 261
- Walter et al. (2018) Walter F., et al., 2018, ApJL, 869, L22
- Watson et al. (2015) Watson D., Christensen L., Knudsen K. K., Richard J., Gallazzi A., Michałowski M. J., 2015, Nature, 519, 327
- Weaver et al. (1977) Weaver R., McCray R., Castor J., Shapiro P., Moore R., 1977, ApJ, 218, 377
- Webber (1998) Webber W. R., 1998, ApJ, 506, 329
- Weingartner & Draine (2001) Weingartner J. C., Draine B. T., 2001, ApJ, 563, 842
- Wilkins et al. (2016) Wilkins S. M., Feng Y., Di-Matteo T., Croft R., Stanway E. R., Bunker A., Waters D., Lovell C., 2016, MNRAS, 460, 3170
- Willott et al. (2015) Willott C. J., Carilli C. L., Wagg J., Wang R., 2015, ApJ, 807, 180
- Wise et al. (2012) Wise J. H., Abel T., Turk M. J., Norman M. L., Smith B. D., 2012, MNRAS, 427, 311
- Wiseman et al. (2017) Wiseman P., Schady P., Bolmer J., Krühler T., Yates R. M., Greiner J., Fynbo J. P. U., 2017, A&A, 599, A24
- Xu et al. (2016) Xu H., Wise J. H., Norman M. L., Ahn K., O’Shea B. W., 2016, ApJ, 833, 84
- Zanella et al. (2018) Zanella A., et al., 2018, MNRAS, 481, 1976
- Zanella et al. (2021) Zanella A., Pallottini A., Ferrara A., Gallerani S., Carniani S., Kohandel M., Behrens C., 2021, MNRAS, 500, 118
- van der Walt et al. (2011) van der Walt S., Colbert S. C., Varoquaux G., 2011, Computing in Science Engineering, 13, 22