Observation of the Singly Cabibbo-Suppressed Decay
M. Ablikim1, M. N. Achasov10,b, P. Adlarson68, S. Ahmed14, M. Albrecht4, R. Aliberti28, A. Amoroso67a,67c, M. R. An32, Q. An64,50, X. H. Bai58, Y. Bai49, O. Bakina29, R. Baldini Ferroli23a, I. Balossino24a, Y. Ban39,h, K. Begzsuren26, N. Berger28, M. Bertani23a, D. Bettoni24a, F. Bianchi67a,67c, J. Bloms61, A. Bortone67a,67c, I. Boyko29, R. A. Briere5, H. Cai69, X. Cai1,50, A. Calcaterra23a, G. F. Cao1,55, N. Cao1,55, S. A. Cetin54a, J. F. Chang1,50, W. L. Chang1,55, G. Chelkov29,a, D. Y. Chen6, G. Chen1, H. S. Chen1,55, M. L. Chen1,50, S. J. Chen35, X. R. Chen25, Y. B. Chen1,50, Z. J Chen20,i, W. S. Cheng67c, G. Cibinetto24a, F. Cossio67c, X. F. Cui36, H. L. Dai1,50, J. P. Dai71, X. C. Dai1,55, A. Dbeyssi14, R. E. de Boer4, D. Dedovich29, Z. Y. Deng1, A. Denig28, I. Denysenko29, M. Destefanis67a,67c, F. De Mori67a,67c, Y. Ding33, C. Dong36, J. Dong1,50, L. Y. Dong1,55, M. Y. Dong1,50,55, X. Dong69, S. X. Du73, P. Egorov29,a, Y. L. Fan69, J. Fang1,50, S. S. Fang1,55, Y. Fang1, R. Farinelli24a, L. Fava67b,67c, F. Feldbauer4, G. Felici23a, C. Q. Feng64,50, J. H. Feng51, M. Fritsch4, C. D. Fu1, Y. Gao64,50, Y. Gao39,h, Y. G. Gao6, I. Garzia24a,24b, P. T. Ge69, C. Geng51, E. M. Gersabeck59, A Gilman62, K. Goetzen11, L. Gong33, W. X. Gong1,50, W. Gradl28, M. Greco67a,67c, L. M. Gu35, M. H. Gu1,50, C. Y Guan1,55, A. Q. Guo25, A. Q. Guo22, L. B. Guo34, R. P. Guo41, Y. P. Guo9,f, A. Guskov29,a, T. T. Han42, W. Y. Han32, X. Q. Hao15, F. A. Harris57, K. K. He47, K. L. He1,55, F. H. Heinsius4, C. H. Heinz28, Y. K. Heng1,50,55, C. Herold52, M. Himmelreich11,d, T. Holtmann4, G. Y. Hou1,55, Y. R. Hou55, Z. L. Hou1, H. M. Hu1,55, J. F. Hu48,j, T. Hu1,50,55, Y. Hu1, G. S. Huang64,50, L. Q. Huang65, X. T. Huang42, Y. P. Huang1, Z. Huang39,h, T. Hussain66, N Hüsken22,28, W. Ikegami Andersson68, W. Imoehl22, M. Irshad64,50, S. Jaeger4, S. Janchiv26, Q. Ji1, Q. P. Ji15, X. B. Ji1,55, X. L. Ji1,50, Y. Y. Ji42, H. B. Jiang42, X. S. Jiang1,50,55, J. B. Jiao42, Z. Jiao18, S. Jin35, Y. Jin58, M. Q. Jing1,55, T. Johansson68, N. Kalantar-Nayestanaki56, X. S. Kang33, R. Kappert56, M. Kavatsyuk56, B. C. Ke44,1, I. K. Keshk4, A. Khoukaz61, P. Kiese28, R. Kiuchi1, R. Kliemt11, L. Koch30, O. B. Kolcu54a, B. Kopf4, M. Kuemmel4, M. Kuessner4, A. Kupsc37,68, M. G. Kurth1,55, W. Kühn30, J. J. Lane59, J. S. Lange30, P. Larin14, A. Lavania21, L. Lavezzi67a,67c, Z. H. Lei64,50, H. Leithoff28, M. Lellmann28, T. Lenz28, C. Li40, C. H. Li32, Cheng Li64,50, D. M. Li73, F. Li1,50, G. Li1, H. Li64,50, H. Li44, H. B. Li1,55, H. J. Li15, H. N. Li48,j, J. L. Li42, J. Q. Li4, J. S. Li51, Ke Li1, L. K. Li1, Lei Li3, P. R. Li31,k,l, S. Y. Li53, W. D. Li1,55, W. G. Li1, X. H. Li64,50, X. L. Li42, Xiaoyu Li1,55, Z. Y. Li51, H. Liang64,50, H. Liang1,55, H. Liang27, Y. F. Liang46, Y. T. Liang25, G. R. Liao12, L. Z. Liao1,55, J. Libby21, A. Limphirat52, C. X. Lin51, D. X. Lin25, T. Lin1, B. J. Liu1, C. X. Liu1, D. Liu14,64, F. H. Liu45, Fang Liu1, Feng Liu6, G. M. Liu48,j, H. M. Liu1,55, Huanhuan Liu1, Huihui Liu16, J. B. Liu64,50, J. L. Liu65, J. Y. Liu1,55, K. Liu1, K. Y. Liu33, Ke Liu17,m, L. Liu64,50, M. H. Liu9,f, P. L. Liu1, Q. Liu55, Q. Liu69, S. B. Liu64,50, T. Liu1,55, T. Liu9,f, W. M. Liu64,50, X. Liu31,k,l, Y. Liu31,k,l, Y. B. Liu36, Z. A. Liu1,50,55, Z. Q. Liu42, X. C. Lou1,50,55, F. X. Lu51, H. J. Lu18, J. D. Lu1,55, J. G. Lu1,50, X. L. Lu1, Y. Lu1, Y. P. Lu1,50, C. L. Luo34, M. X. Luo72, P. W. Luo51, T. Luo9,f, X. L. Luo1,50, X. R. Lyu55, F. C. Ma33, H. L. Ma1, L. L. Ma42, M. M. Ma1,55, Q. M. Ma1, R. Q. Ma1,55, R. T. Ma55, X. X. Ma1,55, X. Y. Ma1,50, F. E. Maas14, M. Maggiora67a,67c, S. Maldaner4, S. Malde62, Q. A. Malik66, A. Mangoni23b, Y. J. Mao39,h, Z. P. Mao1, S. Marcello67a,67c, Z. X. Meng58, J. G. Messchendorp56, G. Mezzadri24a, T. J. Min35, R. E. Mitchell22, X. H. Mo1,50,55, N. Yu. Muchnoi10,b, H. Muramatsu60, S. Nakhoul11,d, Y. Nefedov29, F. Nerling11,d, I. B. Nikolaev10,b, Z. Ning1,50, S. Nisar8,g, S. L. Olsen55, Q. Ouyang1,50,55, S. Pacetti23b,23c, X. Pan9,f, Y. Pan59, A. Pathak1, A. Pathak27, P. Patteri23a, M. Pelizaeus4, H. P. Peng64,50, K. Peters11,d, J. Pettersson68, J. L. Ping34, R. G. Ping1,55, S. Plura28, S. Pogodin29, R. Poling60, V. Prasad64,50, H. Qi64,50, H. R. Qi53, M. Qi35, T. Y. Qi9, S. Qian1,50, W. B. Qian55, Z. Qian51, C. F. Qiao55, J. J. Qin65, L. Q. Qin12, X. P. Qin9, X. S. Qin42, Z. H. Qin1,50, J. F. Qiu1, S. Q. Qu36, K. H. Rashid66, K. Ravindran21, C. F. Redmer28, A. Rivetti67c, V. Rodin56, M. Rolo67c, G. Rong1,55, Ch. Rosner14, M. Rump61, H. S. Sang64, A. Sarantsev29,c, Y. Schelhaas28, C. Schnier4, K. Schoenning68, M. Scodeggio24a,24b, W. Shan19, X. Y. Shan64,50, J. F. Shangguan47, M. Shao64,50, C. P. Shen9, H. F. Shen1,55, X. Y. Shen1,55, H. C. Shi64,50, R. S. Shi1,55, X. Shi1,50, X. D Shi64,50, J. J. Song15, J. J. Song42, W. M. Song27,1, Y. X. Song39,h, S. Sosio67a,67c, S. Spataro67a,67c, F. Stieler28, K. X. Su69, P. P. Su47, F. F. Sui42, G. X. Sun1, H. K. Sun1, J. F. Sun15, L. Sun69, S. S. Sun1,55, T. Sun1,55, W. Y. Sun27, X Sun20,i, Y. J. Sun64,50, Y. Z. Sun1, Z. T. Sun1, Y. H. Tan69, Y. X. Tan64,50, C. J. Tang46, G. Y. Tang1, J. Tang51, J. X. Teng64,50, V. Thoren68, W. H. Tian44, Y. T. Tian25, I. Uman54b, B. Wang1, C. W. Wang35, D. Y. Wang39,h, H. J. Wang31,k,l, H. P. Wang1,55, K. Wang1,50, L. L. Wang1, M. Wang42, M. Z. Wang39,h, Meng Wang1,55, S. Wang9,f, W. Wang51, W. H. Wang69, W. P. Wang64,50, X. Wang39,h, X. F. Wang31,k,l, X. L. Wang9,f, Y. Wang51, Y. D. Wang38, Y. F. Wang1,50,55, Y. Q. Wang1, Y. Y. Wang31,k,l, Z. Wang1,50, Z. Y. Wang1, Ziyi Wang55, Zongyuan Wang1,55, D. H. Wei12, F. Weidner61, S. P. Wen1, D. J. White59, U. Wiedner4, G. Wilkinson62, M. Wolke68, L. Wollenberg4, J. F. Wu1,55, L. H. Wu1, L. J. Wu1,55, X. Wu9,f, X. H. Wu27, Z. Wu1,50, L. Xia64,50, H. Xiao9,f, S. Y. Xiao1, Z. J. Xiao34, X. H. Xie39,h, Y. G. Xie1,50, Y. H. Xie6, T. Y. Xing1,55, C. J. Xu51, G. F. Xu1, Q. J. Xu13, W. Xu1,55, X. P. Xu47, Y. C. Xu55, F. Yan9,f, L. Yan9,f, W. B. Yan64,50, W. C. Yan73, H. J. Yang43,e, H. X. Yang1, L. Yang44, S. L. Yang55, Y. X. Yang12, Yifan Yang1,55, Zhi Yang25, M. Ye1,50, M. H. Ye7, J. H. Yin1, Z. Y. You51, B. X. Yu1,50,55, C. X. Yu36, G. Yu1,55, J. S. Yu20,i, T. Yu65, C. Z. Yuan1,55, L. Yuan2, Y. Yuan1, Z. Y. Yuan51, C. X. Yue32, A. A. Zafar66, X. Zeng Zeng6, Y. Zeng20,i, A. Q. Zhang1, B. X. Zhang1, Guangyi Zhang15, H. Zhang64, H. H. Zhang51, H. H. Zhang27, H. Y. Zhang1,50, J. L. Zhang70, J. Q. Zhang34, J. W. Zhang1,50,55, J. Y. Zhang1, J. Z. Zhang1,55, Jianyu Zhang1,55, Jiawei Zhang1,55, L. M. Zhang53, L. Q. Zhang51, Lei Zhang35, S. Zhang51, S. F. Zhang35, Shulei Zhang20,i, X. D. Zhang38, X. M. Zhang1, X. Y. Zhang42, Y. Zhang62, Y. T. Zhang73, Y. H. Zhang1,50, Yan Zhang64,50, Yao Zhang1, Z. Y. Zhang69, G. Zhao1, J. Zhao32, J. Y. Zhao1,55, J. Z. Zhao1,50, Lei Zhao64,50, Ling Zhao1, M. G. Zhao36, Q. Zhao1, S. J. Zhao73, Y. B. Zhao1,50, Y. X. Zhao25, Z. G. Zhao64,50, A. Zhemchugov29,a, B. Zheng65, J. P. Zheng1,50, Y. H. Zheng55, B. Zhong34, C. Zhong65, L. P. Zhou1,55, Q. Zhou1,55, X. Zhou69, X. K. Zhou55, X. R. Zhou64,50, X. Y. Zhou32, A. N. Zhu1,55, J. Zhu36, K. Zhu1, K. J. Zhu1,50,55, S. H. Zhu63, T. J. Zhu70, W. J. Zhu36, W. J. Zhu9,f, Y. C. Zhu64,50, Z. A. Zhu1,55, B. S. Zou1, and J. H. Zou1(BESIII Collaboration)1 Institute of High Energy Physics, Beijing 100049, People’s Republic of China
2 Beihang University, Beijing 100191, People’s Republic of China
3 Beijing Institute of Petrochemical Technology, Beijing 102617, People’s Republic of China
4 Bochum Ruhr-University, D-44780 Bochum, Germany
5 Carnegie Mellon University, Pittsburgh, Pennsylvania 15213, USA
6 Central China Normal University, Wuhan 430079, People’s Republic of China
7 China Center of Advanced Science and Technology, Beijing 100190, People’s Republic of China
8 COMSATS University Islamabad, Lahore Campus, Defence Road, Off Raiwind Road, 54000 Lahore, Pakistan
9 Fudan University, Shanghai 200443, People’s Republic of China
10 G.I. Budker Institute of Nuclear Physics SB RAS (BINP), Novosibirsk 630090, Russia
11 GSI Helmholtzcentre for Heavy Ion Research GmbH, D-64291 Darmstadt, Germany
12 Guangxi Normal University, Guilin 541004, People’s Republic of China
13 Hangzhou Normal University, Hangzhou 310036, People’s Republic of China
14 Helmholtz Institute Mainz, Staudinger Weg 18, D-55099 Mainz, Germany
15 Henan Normal University, Xinxiang 453007, People’s Republic of China
16 Henan University of Science and Technology, Luoyang 471003, People’s Republic of China
17 Henan University of Technology, Zhengzhou 450001, People’s Republic of China
18 Huangshan College, Huangshan 245000, People’s Republic of China
19 Hunan Normal University, Changsha 410081, People’s Republic of China
20 Hunan University, Changsha 410082, People’s Republic of China
21 Indian Institute of Technology Madras, Chennai 600036, India
22 Indiana University, Bloomington, Indiana 47405, USA
23 INFN Laboratori Nazionali di Frascati , (A)INFN Laboratori Nazionali di Frascati, I-00044, Frascati, Italy; (B)INFN Sezione di Perugia, I-06100, Perugia, Italy; (C)University of Perugia, I-06100, Perugia, Italy
24 INFN Sezione di Ferrara, (A)INFN Sezione di Ferrara, I-44122, Ferrara, Italy; (B)University of Ferrara, I-44122, Ferrara, Italy
25 Institute of Modern Physics, Lanzhou 730000, People’s Republic of China
26 Institute of Physics and Technology, Peace Ave. 54B, Ulaanbaatar 13330, Mongolia
27 Jilin University, Changchun 130012, People’s Republic of China
28 Johannes Gutenberg University of Mainz, Johann-Joachim-Becher-Weg 45, D-55099 Mainz, Germany
29 Joint Institute for Nuclear Research, 141980 Dubna, Moscow region, Russia
30 Justus-Liebig-Universitaet Giessen, II. Physikalisches Institut, Heinrich-Buff-Ring 16, D-35392 Giessen, Germany
31 Lanzhou University, Lanzhou 730000, People’s Republic of China
32 Liaoning Normal University, Dalian 116029, People’s Republic of China
33 Liaoning University, Shenyang 110036, People’s Republic of China
34 Nanjing Normal University, Nanjing 210023, People’s Republic of China
35 Nanjing University, Nanjing 210093, People’s Republic of China
36 Nankai University, Tianjin 300071, People’s Republic of China
37 National Centre for Nuclear Research, Warsaw 02-093, Poland
38 North China Electric Power University, Beijing 102206, People’s Republic of China
39 Peking University, Beijing 100871, People’s Republic of China
40 Qufu Normal University, Qufu 273165, People’s Republic of China
41 Shandong Normal University, Jinan 250014, People’s Republic of China
42 Shandong University, Jinan 250100, People’s Republic of China
43 Shanghai Jiao Tong University, Shanghai 200240, People’s Republic of China
44 Shanxi Normal University, Linfen 041004, People’s Republic of China
45 Shanxi University, Taiyuan 030006, People’s Republic of China
46 Sichuan University, Chengdu 610064, People’s Republic of China
47 Soochow University, Suzhou 215006, People’s Republic of China
48 South China Normal University, Guangzhou 510006, People’s Republic of China
49 Southeast University, Nanjing 211100, People’s Republic of China
50 State Key Laboratory of Particle Detection and Electronics, Beijing 100049, Hefei 230026, People’s Republic of China
51 Sun Yat-Sen University, Guangzhou 510275, People’s Republic of China
52 Suranaree University of Technology, University Avenue 111, Nakhon Ratchasima 30000, Thailand
53 Tsinghua University, Beijing 100084, People’s Republic of China
54 Turkish Accelerator Center Particle Factory Group, (A)Istinye University, 34010, Istanbul, Turkey; (B)Near East University, Nicosia, North Cyprus, Mersin 10, Turkey
55 University of Chinese Academy of Sciences, Beijing 100049, People’s Republic of China
56 University of Groningen, NL-9747 AA Groningen, The Netherlands
57 University of Hawaii, Honolulu, Hawaii 96822, USA
58 University of Jinan, Jinan 250022, People’s Republic of China
59 University of Manchester, Oxford Road, Manchester, M13 9PL, United Kingdom
60 University of Minnesota, Minneapolis, Minnesota 55455, USA
61 University of Muenster, Wilhelm-Klemm-Str. 9, 48149 Muenster, Germany
62 University of Oxford, Keble Rd, Oxford, UK OX13RH
63 University of Science and Technology Liaoning, Anshan 114051, People’s Republic of China
64 University of Science and Technology of China, Hefei 230026, People’s Republic of China
65 University of South China, Hengyang 421001, People’s Republic of China
66 University of the Punjab, Lahore-54590, Pakistan
67 University of Turin and INFN, (A)University of Turin, I-10125, Turin, Italy; (B)University of Eastern Piedmont, I-15121, Alessandria, Italy; (C)INFN, I-10125, Turin, Italy
68 Uppsala University, Box 516, SE-75120 Uppsala, Sweden
69 Wuhan University, Wuhan 430072, People’s Republic of China
70 Xinyang Normal University, Xinyang 464000, People’s Republic of China
71 Yunnan University, Kunming 650500, People’s Republic of China
72 Zhejiang University, Hangzhou 310027, People’s Republic of China
73 Zhengzhou University, Zhengzhou 450001, People’s Republic of China
a Also at the Moscow Institute of Physics and Technology, Moscow 141700, Russia
b Also at the Novosibirsk State University, Novosibirsk, 630090, Russia
c Also at the NRC ”Kurchatov Institute”, PNPI, 188300, Gatchina, Russia
d Also at Goethe University Frankfurt, 60323 Frankfurt am Main, Germany
e Also at Key Laboratory for Particle Physics, Astrophysics and Cosmology, Ministry of Education; Shanghai Key Laboratory for Particle Physics and Cosmology; Institute of Nuclear and Particle Physics, Shanghai 200240, People’s Republic of China
f Also at Key Laboratory of Nuclear Physics and Ion-beam Application (MOE) and Institute of Modern Physics, Fudan University, Shanghai 200443, People’s Republic of China
g Also at Harvard University, Department of Physics, Cambridge, Massachusetts, 02138, USA
h Also at State Key Laboratory of Nuclear Physics and Technology, Peking University, Beijing 100871, People’s Republic of China
i Also at School of Physics and Electronics, Hunan University, Changsha 410082, China
j Also at Guangdong Provincial Key Laboratory of Nuclear Science, Institute of Quantum Matter, South China Normal University, Guangzhou 510006, China
k Also at Frontiers Science Center for Rare Isotopes, Lanzhou University, Lanzhou 730000, People’s Republic of China
l Also at Lanzhou Center for Theoretical Physics, Lanzhou University, Lanzhou 730000, People’s Republic of China
m Henan University of Technology, Zhengzhou 450001, People’s Republic of China
Abstract
The singly Cabibbo-suppressed decay is observed for the first time with a statistical significance of by using 3.9 of collision data collected at center-of-mass energies between 4.612 and 4.699 GeV with the BESIII detector at BEPCII.
The branching fraction of is measured to be .
By taking the upper limit of branching fractions of from the Belle experiment, the ratio of branching fractions between and is calculated to be larger than 7.2 at the 90% confidence level, which disagrees with the most predictions of available phenomenological models.
In addition, the branching fractions of the Cabibbo-favored decays and are measured to be and , respectively, which are consistent with previous results.
The decay of the ground state charmed baryon plays an essential role in studying the nature of both strong and weak interactions in heavy-to-light baryonic transitions Cheng (2015).
The hadronic decay amplitudes of consist of factorizable and nonfactorizable components, in which the nonfactorizable effects arising from exchange and internal emission play an essential role Chau and Cheng (1986); Yoji (1991). Therefore, studies of nonfactorizable components are critical to understanding the underlining dynamics of charmed baryon decays.
In the last three decades, several different phenomenological models, e.g., current algebra Cheng and Tseng (1993); Sharma and Verma (1999) and SU(3) flavor symmetry Sharma and Verma (1997); Lü et al. (2016); Geng et al. (2018a), have been employed as tools to reveal the dynamics of charmed baryon decays. The nonfactorizable contributions are important in these decays, in contrast to the meson case, and can be constrained by measurements.
Studies of singly Cabibbo-suppressed (SCS) decay modes containing both factorizable and nonfactorizable contributions will provide information about their interference; therefore comprehensive and precise experimental inputs are required for an improved understanding of the validity of the different phenomenological models.
Experimentally, great progress has been made in the study of charmed-baryon decays recently, particularly for Cabibbo-favored (CF) decays Pal et al. (2017); Ablikim et al. (2019, 2021); Li and Lyu (2021); for example,
the branching fraction of the golden mode and the neutron final-state decay have been measured with a precision of better than 10% Zupanc et al. (2014); Ablikim et al. (2016, 2017a).
However, experimental studies of the SCS decays are still quite challenging due to their small branching fractions of or below.
The two-body SCS decay , together with and , are of great interest and have been studied extensively in the context of various phenomenological models Uppal et al. (1994); Sharma and Verma (1997); Chen et al. (2003); Cheng et al. (2018); Lü et al. (2016); Geng et al. (2018b, 2019, 2020); Zou et al. (2020); Zhao et al..
Compared to , the decays and are suppressed due to the destructive interference between the factorizable and nonfactorizable amplitudes Cheng et al. (2018).
Different phenomenological models predict quite different decay rates for and , and distinguishing between these models with experimental results is highly desirable.
The ratio of the branching fractions between and is a particularly sensitive observable in comparing these models, since correlated uncertainties in theoretical calculation can be canceled.
This ratio is predicted to be 2 by the SU(3) flavor symmetry model Sharma and Verma (1997); Lü et al. (2016); Geng et al. (2018b), 4.5 or 8.0 by the constituent quark model Uppal et al. (1994), 3.5 by a dynamical calculation based on pole model and current-algebra Cheng et al. (2018), 4.7 by the SU(3) flavor symmetry including the contributions from Geng et al. (2019), and 9.6 by the topological-diagram approach Zhao et al..
To date, the branching fractions of only a few SCS decay modes have been measured, and all with limited precision Zyla et al. (2020), and those involving a neutron in the final state have never been measured. BESIII and Belle have reported the branching fractions of and the upper limit for Ablikim et al. (2017b); Li et al. (2021), where for some tension exists between measurement and some of the predictions Uppal et al. (1994); Sharma and Verma (1997); Lü et al. (2016); Geng et al. (2018b).
Therefore, an observation of the decay is essential for validating and constraining different dynamical models.
In this Letter, the first observation of the SCS decay is reported using 3.9 collision data collected with the BESIII detector at six center-of-mass (c.m.) energies between 4.612 and 4.699 GeV.
The integrated luminosities of the data samples at 4.612, 4.628, 4.641, 4.661, 4.682, and 4.699 GeV
are 103.5, 519.9, 548.2, 527.6, 1664.3, and 534.4 pb-1Ablikim et al., respectively.
Throughout this Letter, charge-conjugate modes are implicitly included.
A detailed description of the design and performance of the BESIII detector can be found in Ref. Ablikim et al. (2010).
Simulated samples are produced with a GEANT4-based Agostinelli et al. (2003) Monte Carlo (MC) package, which includes the geometric description of the BESIII detector. The signal MC samples of with decaying into ten specific tag modes
(as described below and listed in Table 1) and , , and are generated for each individual c.m. energy by the generator kkmc Jadach et al. (2001)
by incorporating initial-state radiation (ISR) effects and the beam energy spread.
The inclusive MC sample, which consists of events, production, ISR return to lower-mass states, and continuum processes (), is generated to estimate the potential background, in which all the known decay modes of charmed hadrons and charmonia are modeled with evtgen Lange (2001); Ping (2008) using branching fractions taken from the Particle Data Group Zyla et al. (2020), and the remaining unknown decays are modeled with lundcharm Chen et al. (2000).
Final-state radiation from charged final-state particles is incorporated using
photos Richter-Was (1993).
A double-tag (DT) approach Adler et al. (1989) is implemented to search for . A data sample of baryons, referred to as the single-tag (ST) sample, is reconstructed with ten exclusive hadronic decay modes, as listed in Table 1, where the intermediate particles , , , , and are reconstructed with the decays
, , , , and , respectively.
Those events in which the signal decay is reconstructed in the system recoiling against the candidates of the ST sample are denoted as DT candidates.
Charged tracks detected in the helium-based main drift chamber (MDC) are required to be within a polar angle () range of , where is defined with respect to the beam direction.
Except for those from and decays, their distances of the closest approach to the interaction point (IP) are required to be within 10 cm along the beam direction and 1 cm in the plane perpendicular to the beam (referred to as tight track hereafter).
The particle identification (PID) is implemented by combining measurements of the energy deposited in the MDC () and the flight time in the time-of-flight system, and every charged track is assigned a particle type of pion, kaon or proton, according to which assignment has the highest probability.
Photon candidates are identified using showers in the electromagnetic calorimeter (EMC). The deposited energy of each shower must be more than 25 MeV in the barrel region () or more than 50 MeV in the end-cap region (). To suppress electronic noise and showers unrelated to the event, the difference between the EMC time and the event start time is required to be within (0, 700) ns. The candidate is reconstructed with a photon pair within the invariant-mass region (0.115, 0.150) GeV/. To improve the resolution, a kinematic fit is performed by constraining the invariant mass of the photon pair to be the mass and requiring the corresponding of the fit to be less than 200.
The momenta updated by the kinematic fit are used in the further analysis.
Candidates for and mesons are reconstructed in their decays to and , respectively, where the charged tracks must have distances of closest approaches to the IP that are within 20 cm along the beam direction (referred to as loose track hereafter).
To improve the signal purity, PID is applied to the (anti)proton candidate, while the charged pion is not subjected to a PID requirement.
A secondary vertex fit is performed to each or candidate, and the momenta updated by the fit are used in the further analysis. A or candidate is accepted by requiring the of the secondary vertex fit to be less than 100.
Furthermore, the decay vertex is required to be separated from the IP by a distance of at least twice the fitted vertex resolution, and the invariant mass to be within (0.487, 0.511) GeV/ for or (1.111, 1.121) GeV/ for .
The and candidates are reconstructed with the
and final states, requiring the invariant masses to lie within (1.179, 1.203) and (1.176, 1.200) GeV/, respectively.
The ST candidates are identified using the variables of beam-constrained invariant mass and energy difference , where is the beam energy, and are the energy and momentum of the candidate, respectively.
The candidate is required to satisfy tag-mode dependent requirements, the asymmetric intervals of which take into account the effects of ISR and correspond to three times the resolution around the peak, as summarized in Table 1. If there is more than one candidate satisfying the above requirements for a specific tag mode, the one with the smallest is kept.
Table 1: requirement, the ST yield, and the detection efficiency of the ST and DT selections for
each tag mode of the data sample at GeV. The uncertainty on the ST yield is statistical only.
(MeV)
(%)
(%)
145
47.3
37.0
61
48.1
38.8
95
14.5
13.4
52
16.5
14.4
49
17.7
14.8
47
37.8
31.0
71
14.6
12.9
52
12.3
10.3
34
19.3
17.4
63
16.2
16.1
For the ST mode, candidate events with GeV/ and GeV/ are vetoed to avoid double counting with the or ST modes, respectively. For the ST mode, candidate events with GeV/ and GeV/ are rejected to avoid double counting with the or ST modes, respectively.
In the and selections, candidate events with GeV/ and GeV/ are rejected, respectively.
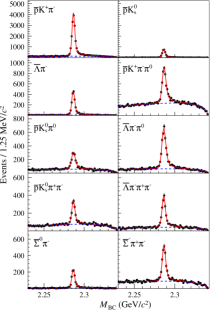
The distributions of surviving candidates for the ten ST modes are illustrated in Fig. 1 for the data sample at , where clear signals are observed in each sample. No peaking backgrounds are found with the investigation of the inclusive MC sample. To obtain the ST yields, unbinned maximum likelihood fits on these distributions are performed, where the signal shapes are modeled with the MC-simulated shape convolved with a Gaussian function representing the resolution difference between data and MC simulation, and the background shapes are described by an ARGUS function Albrecht et al. (1990).
The candidates with GeV/ are retained for further analysis, and the signal yields for the individual ST modes are summarized in Table 1. The same procedure is performed for the other five data samples at different c.m. energies. The ST yields of the other five samples with different c.m. energies are summarized in the Supplemental Material BES . The sum of the ST yields for all the six data samples is , where the uncertainty is statistical.
Figure 1:
The distributions of the ST modes for data sample at
.
The points with error bars represent data. The (red) solid curves indicate the fit results and the (blue) dashed curves describe
the background shapes.
The decay is searched for among the remaining tracks recoiling against the ST candidates.
Only one tight charged track is allowed, which is then assigned to be the from the signal decay.
To suppress contamination from long-lifetime particles in the final state, the candidate events are further required to be without any loose tracks.
It reduces the signal efficiency of by 6% and background level by 50%. Meanwhile, the signal yields for and will decrease significantly as the and decays with charged particles in the final state are highly suppressed, and their decays with neutral ones mostly pass this requirement.
To improve detection efficiency, the neutron is selected through the recoiling mass () against the ST and :
(1)
where and are the energy and momentum of the candidate,
, and is the unit direction opposite to the
ST .
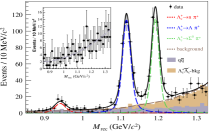
After imposing all selection conditions mentioned above, the distribution of of the accepted DT candidate events from the combined six data samples at different c.m. energies is shown in Fig. 2, where a peak at the neutron mass is observed, representing the signal.
Additionally, there are two prominent structures peaking at the and mass regions,
which represent the CF processes and , respectively.
Figure 2: The distribution of the accepted DT candidate events from the combined six data samples.
The black points with error bars are data. The red, blue, and green dashed lines indicate the curves for the neutron,
, and peaks, respectively.
The brown and gray shaded histograms for the two background components are from the inclusive MC sample, and the dark brown dashed line indicates the curve that describes the two background components from fitting.
The black line is the sum over all the components in the fit. The inset shows the distribution in the ST sideband region, and the gray dashed line indicates the curve that describes the background.
The potential backgrounds can be classified into two categories: those directly originating from continuum hadron production in the annihilation (referred to as background hereafter) and those from events (referred to as background hereafter), excluding contributions from , , and signals.
The distributions and magnitudes of and backgrounds are estimated with the inclusive MC sample, as shown in Fig. 2, where no peaking backgrounds are observed.
The understanding of the background is also validated with candidate events in the sideband region GeV/ of ST candidates in data; here also, no peaking background is observed.
The signal yield is obtained by performing an unbinned maximum-likelihood fit on the
distribution. The neutron, and signals are modeled by the MC-simulated shapes convolved with Gaussian functions that account for the resolution difference between data and MC simulation, and where the three Gaussian functions share the same width parameters.
The background is described by a second-order Chebyshev function with fixed parameters,
which are obtained by fitting the corresponding distribution of events in the ST sideband region.
The shape of the background is taken from the inclusive MC sample.
The fit distributions are depicted in Fig. 2, and correspond to signal yields of , , and for the decays , , and , respectively, where the uncertainties are statistical.
The statistical significance of is , which is calculated from the change of the likelihood values between fits with and without the signal component included, and accounting for the change in the number of degrees of freedom.
The decay branching fractions () are determined as
(2)
where the subscripts and represent the ST modes and the data samples at different c.m. energies, respectively.
The parameters , and are the ST yields, ST efficiencies, and DT efficiencies, respectively.
The detection efficiencies and are estimated from signal MC samples, where the key distributions of the ST modes have been reweighted to agree with those of the data.
The ST and DT efficiencies are summarized in Table 1 for data samples at a c.m. energy of 4.682 GeV.
The detection efficiencies for the other data samples are summarized in the Supplemental Material BES .
The branching fractions are determined to be ,
, and
,
where the first uncertainties are statistical and the second systematic.
The systematic uncertainties for the branching fraction measurements comprise those associated with the ST yields, the tracking and PID efficiencies, the requirement of zero loose tracks, the determination of the DT signal yields, the decay branching fractions of and
(for and only) and the statistical uncertainties from the MC samples.
The DT approach on which the measurement is based means that uncertainties associated with the ST selection efficiency cancel out.
The uncertainty in the ST yields is 0.5%, which arises from the statistical uncertainty and a systematic component coming from the fit to the distribution.
The uncertainties associated with the tracking and PID efficiencies are determined from studies of a control sample decays, as explained in Ref. Ablikim et al. (2017c),
and are assigned to be 1.0% and 2.0%, respectively.
The uncertainty due to the zero loose-track requirement is 1.7%, which is assigned from studies of a control sample of with and the decaying into ten tag decay modes.
The uncertainties from the determination of the DT yields are 5.6%, 2.5% and 2.1% for the decays , , and , respectively, including those from the fit range and
the modeling of and backgrounds, which are estimated from varying the range and alternative polynomial descriptions for the and backgrounds, respectively.
The uncertainties in the DT efficiencies due to the branching fractions of and are 1.4% and 1.4% for the decays and , respectively.
Uncertainties arising from the MC modeling are investigated by reweighting the MC distribution to data, and comparing the results obtained between the original and reweighted samples.
The resultant uncertainties in the MC modeling are 0.8% for and 3.8% for , but negligible for .
The uncertainties associated with the finite size of the signal MC samples are 0.2%. All other uncertainties are negligible.
Assuming that all the sources of bias are uncorrelated, the total uncertainties are then taken to be
the quadratic sum of the individual values, which are 6.3%, 4.0%, and 5.4% for
the decays , , and , respectively.
In summary, the singly Cabibbo-suppressed decay is observed with a statistical significance of by using collision data samples corresponding to a total integrated luminosity of 3.9 collected at c.m. energies between 4.612 and 4.699 GeV with the BESIII detector.
The branching fraction of is measured to be , this is a first-time measurement.
Meanwhile, the branching fractions of the Cabibbo-favored decays and
are measured to be and , respectively, which are consistent with previous BESIII results Ablikim et al. (2016).
The measured branching fraction of is consistent with the prediction in Ref. Geng et al. (2019), but twice as large as that in Ref. Cheng et al. (2018), implying that the nonfactorization contributions are overestimated.
Taking the upper limit of the branching fraction of from the Belle experiment, at the 90% confidence level Li et al. (2021),
the ratio of branching fractions between and is calculated to be larger than 7.2 at the 90% confidence level, which disagrees with the most predictions of phenomenological models Sharma and Verma (1997); Lü et al. (2016); Uppal et al. (1994); Cheng et al. (2018); Geng et al. (2018b, 2019); Zhao et al..
The results from this analysis provide an essential input for the phenomenological studies on the underlying dynamics of charmed baryon decays.
In order to obtain an improved understanding it is desirable to perform improved studies of these decays, in particular concerning the branching fraction in the future Ablikim et al. (2020).
The BESIII Collaboration thanks the staff of BEPCII, the IHEP computing center and the supercomputing center of the
University of Science and Technology of China (USTC) for their strong support.
The authors are grateful to Hai-Yang Cheng, Fanrong Xu and Xianwei Kang for enlightening discussions.
This work is supported in part by National Key R&D Program of China under Contracts No. 2020YFA0406400, No. 2020YFA0406300;
National Natural Science Foundation of China (NSFC) under Contracts No. 11335008, No. 11625523, No. 11635010, No. 11735014, No. 11822506, No. 11835012, No. 11935015, No. 11935016, No. 11935018, No. 11961141012, No. 12022510, No. 12025502, No. 12035009, No. 12035013, No. 12061131003, No. 12005311, No. 11805086, No. 11705192, No. 11950410506;
the Fundamental Research Funds for the Central Universities, University of Science and Technology of China, Sun Yat-sen University, Lanzhou University, University of Chinese Academy of Sciences;
100 Talents Program of Sun Yat-sen University;
the Chinese Academy of Sciences (CAS) Large-Scale Scientific Facility Program; Joint Large-Scale Scientific Facility Funds of the NSFC and CAS under Contracts No. U1732263, No. U1832207, No. U1832103, No. U2032111;
CAS Key Research Program of Frontier Sciences under Contract No. QYZDJ-SSW-SLH040; 100 Talents Program of CAS; China Postdoctoral Science Foundation under Contracts No. 2019M662152, No. 2020T130636;
INPAC and Shanghai Key Laboratory for Particle Physics and Cosmology; ERC under Contract No. 758462;
European Union Horizon 2020 research and innovation programme under Marie Sklodowska-Curie Grant Agreement No. 894790;
German Research Foundation DFG under Contracts No. 443159800, Collaborative Research Center CRC 1044, FOR 2359, FOR 2359, GRK 214;
Istituto Nazionale di Fisica Nucleare, Italy; Ministry of Development of Turkey under Contract No. DPT2006K-120470; National Science and Technology fund;
Olle Engkvist Foundation under Contract No. 200-0605; STFC (U.K.);
The Knut and Alice Wallenberg Foundation (Sweden) under Contract No. 2016.0157; The Royal Society, U.K. under Contracts No. DH140054, No. DH160214;
The Swedish Research Council; U. S. Department of Energy under Contracts No. DE-FG02-05ER41374, No. DE-SC-0012069
(37)See Supplemental Material at
https://journals.aps.org/prl/supplemental/10.1103/ PhysRevLett.128.142001
for additional details on the detection efficiencies for the other data
samples.