Electrical readout microwave-free sensing with diamond
Abstract
While nitrogen-vacancy (NV-) centers have been extensively investigated in the context of spin-based quantum technologies, the spin-state readout is conventionally performed optically, which may limit miniaturization and scalability. Here, we report photoelectric readout of ground-state cross-relaxation features, which serves as a method for measuring electron spin resonance spectra of nanoscale electronic environments and also for microwave-free sensing. As a proof of concept, by systematically tuning NV centers into resonance with the target electronic system, we extracted the spectra for the P1 electronic spin bath in diamond. Such detection may enable probing optically inactive defects and the dynamics of local spin environment. We also demonstrate a magnetometer based on photoelectric detection of the ground-state level anticrossings (GSLAC), which exhibits a favorable detection efficiency as well as magnetic sensitivity. This approach may offer potential solutions for determining spin densities and characterizing local environment.
pacs:
Valid PACS appear hereNitrogen-vacancy (NV) centers in diamond have become a prominent platform for spin-based quantum technology, being utilized to study small-scale quantum information processing concepts and quantum sensing under ambient conditions Barry et al. (2020); Reiserer et al. (2016). Conventionally, the readout of the spin state is based on the optically detected magnetic resonance (ODMR) technique and NV center visualization is performed optically, taking advantage of the high-yield photoluminescence of the NVs. This typically requires setups built on optical tables to achieve the best performance. In that sense, fabrication of miniaturized compact devices and their integration for practical uses is a complex engineering endeavor Siyushev et al. (2019); Doherty et al. (2016). Alternatively, electrical readout is a convenient way to measure the spin state of a qubit, and recently, it has been successfully applied to NV centers via, for example, photoelectric detection of magnetic resonance (PDMR) Bourgeois et al. (2015), as well as photoelectric readout of electron Hrubesch et al. (2017) and nuclear Morishita et al. (2020); Gulka et al. (2017) spins. With this detection method, NV- centers can be addressed with a spatial resolution limited by the nanoscale feature size of electron-beam lithography Siyushev et al. (2019); Bourgeois et al. (2015); Manfrinato et al. (2013); Hrubesch et al. (2017); Gulka et al. (2017), which could enable spin readout in fabricated dense arrays, and therefore, providing fully integrated quantum-diamond solutions. The advantage over optical readout is that photocurrent (PC) detection allows one to overcome the spatial resolution limitation imposed by the diffraction limit. Moreover, electrical readout outperforms optical means in collection efficiency, as the latter are limited by finite-efficiency objective optics and the high index of refraction of diamond, and it is typically on the order of a percent of lower Siyushev et al. (2019). Photoelectric detection can achieve high efficiency since all the carriers can be collected and multiplied due to photoelectric gain Bourgeois et al. (2015). However, an important problem is the microwave (MW) induced noise and cross-talks Gulka et al. (2017) which limit the sensitivity of magnetic field sensing and imaging and also provides engineering and technological hurdles for a high-level integration.
Here, we propose and implement a novel microwave-free PDMR detection for monitoring the local NV electron spin dynamics within the diamond lattice; in this scenario, we study spin transitions at the ground-state level anticrossings (GSLAC), occurring at the fields of 102.4 mT, which lead to narrow resonances and can be employed for sensitive magnetometry. The role of nuclear spins in these transitions and pinpoint differences to microwave-free detection is discussed in Ref. Gulka et al. (2021). The developed methodology also opens perspectives for highly integrated magnetometry with electrical readout.
We begin with the investigation of magnetic resonances that originate from ground-state level anticrossing (GSLAC) and cross relaxation by performing both photoelectric and optical readout. Based on these results, we designed and implemented a magnetometer based on the PC detection of the GSLAC. This magnetometer alleviates the requirement of microwave control Zheng et al. (2020) and PC readout enables better magnetic sensitivity per volume compared to optical detection.
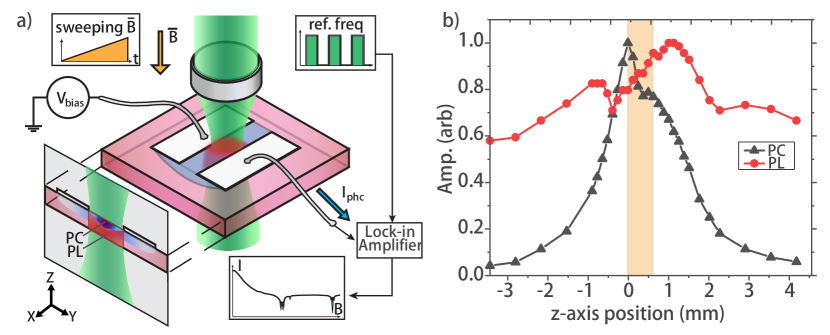
Photoelectric detection of NV- magnetic spectra.– Throughout the experiments a high-pressure high-temperature (HPHT) diamond was used (see Appendix B). To collect charge carriers under bias voltage, coplanar Ti/Al electrodes with a 5 m gap were lithographically patterned on the diamond surface. The photocurrent was pre-amplified and recorded via lock-in amplifier (LIA) with a reference to the laser modulation frequency. A custom-made electromagnet was built to provide the background magnetic field Zheng et al. (2020). A schematic of the experimental apparatus is depicted in Fig.1 (a), in which a cutaway sectional view is projected to the left. The laser beam is focused onto the diamond with a lens which is mounted on a three-axis translation stage, so that the focal spot can be moved. Optical detection of magnetic resonance and PC readout were carried out simultaneously.
We started our measurements by characterizing an effective interrogation area for the two detection methods, by positioning the laser spot in the vicinity of the electrodes. The laser beam is focused with an estimated beam waist of m and Rayleigh range m. We park the spot between the electrodes in the - plane and scan the beam through the sample along the -axis. Figure 1 (b) depicts the recorded signals of PC and PL as the focal point crosses the diamond (note a 50 V electric potential to the electrodes was applied in both cases to achieve comparable detection conditions). The scan in Fig. 1 (b) starts with the focal point outside the diamond (denoted by the amber rectangle), then proceeds to the electrode plane (front diamond surface, roughly at 0 mm where the maximum PC occurs), continues into the diamond sample, towards its back side at 0.65 mm, and finally, out of the diamond. The PC signal soars rapidly from nearly zero to maximum within 3-mm movement of the lens when the laser focal spot approaches the near diamond surface, and reaches a maximum at when it is focused exactly on the surface. Under this condition, the NV centers in the effective photoelectric interrogation volume experience optimal optical excitation. When the laser spot passes through the electrode plane, the PC signal falls quickly due to less intense photoionization which is quadratically dependent on the laser intensity, and a rapidly decaying electric field Bourgeois et al. (2020). The PL signal, however, experiences a different -axial profile: it slightly increases from the level of 0.6 to 0.8 when the focal spot moves from -3 mm to -1 mm and then falls suddenly to a level of 70 % to the maximum. The reasons behind involve blocking effect of the laser beam by the electrodes. Note the NV centers contributed to the PL across over the entire depth of the sample. PL signal gets maximized at 1.1 mm where the focal spot has passed the whole diamond sample. Thereafter, it decreases to 70 % at 2 mm and finally flattens out.
From the discussion above, we conclude that the electrical readout provides a smaller effective interrogation volume compared to that of the fluorescing region due to the sharp electric field profile and the two-photon ionization process. Conversely, with optical detection, one collects photons from the entire illuminated volume. To better understand the system, we quantitatively reproduce the electric and optical signals based on a microscopic mathematical model Bourgeois et al. and estimate the dimension of the effective detection volume for the two detection methods. The model potentially allows us to predict the densities of NV centers as well as optically inactive impurities [such as substitutional nitrogen atoms (P1 centers)].
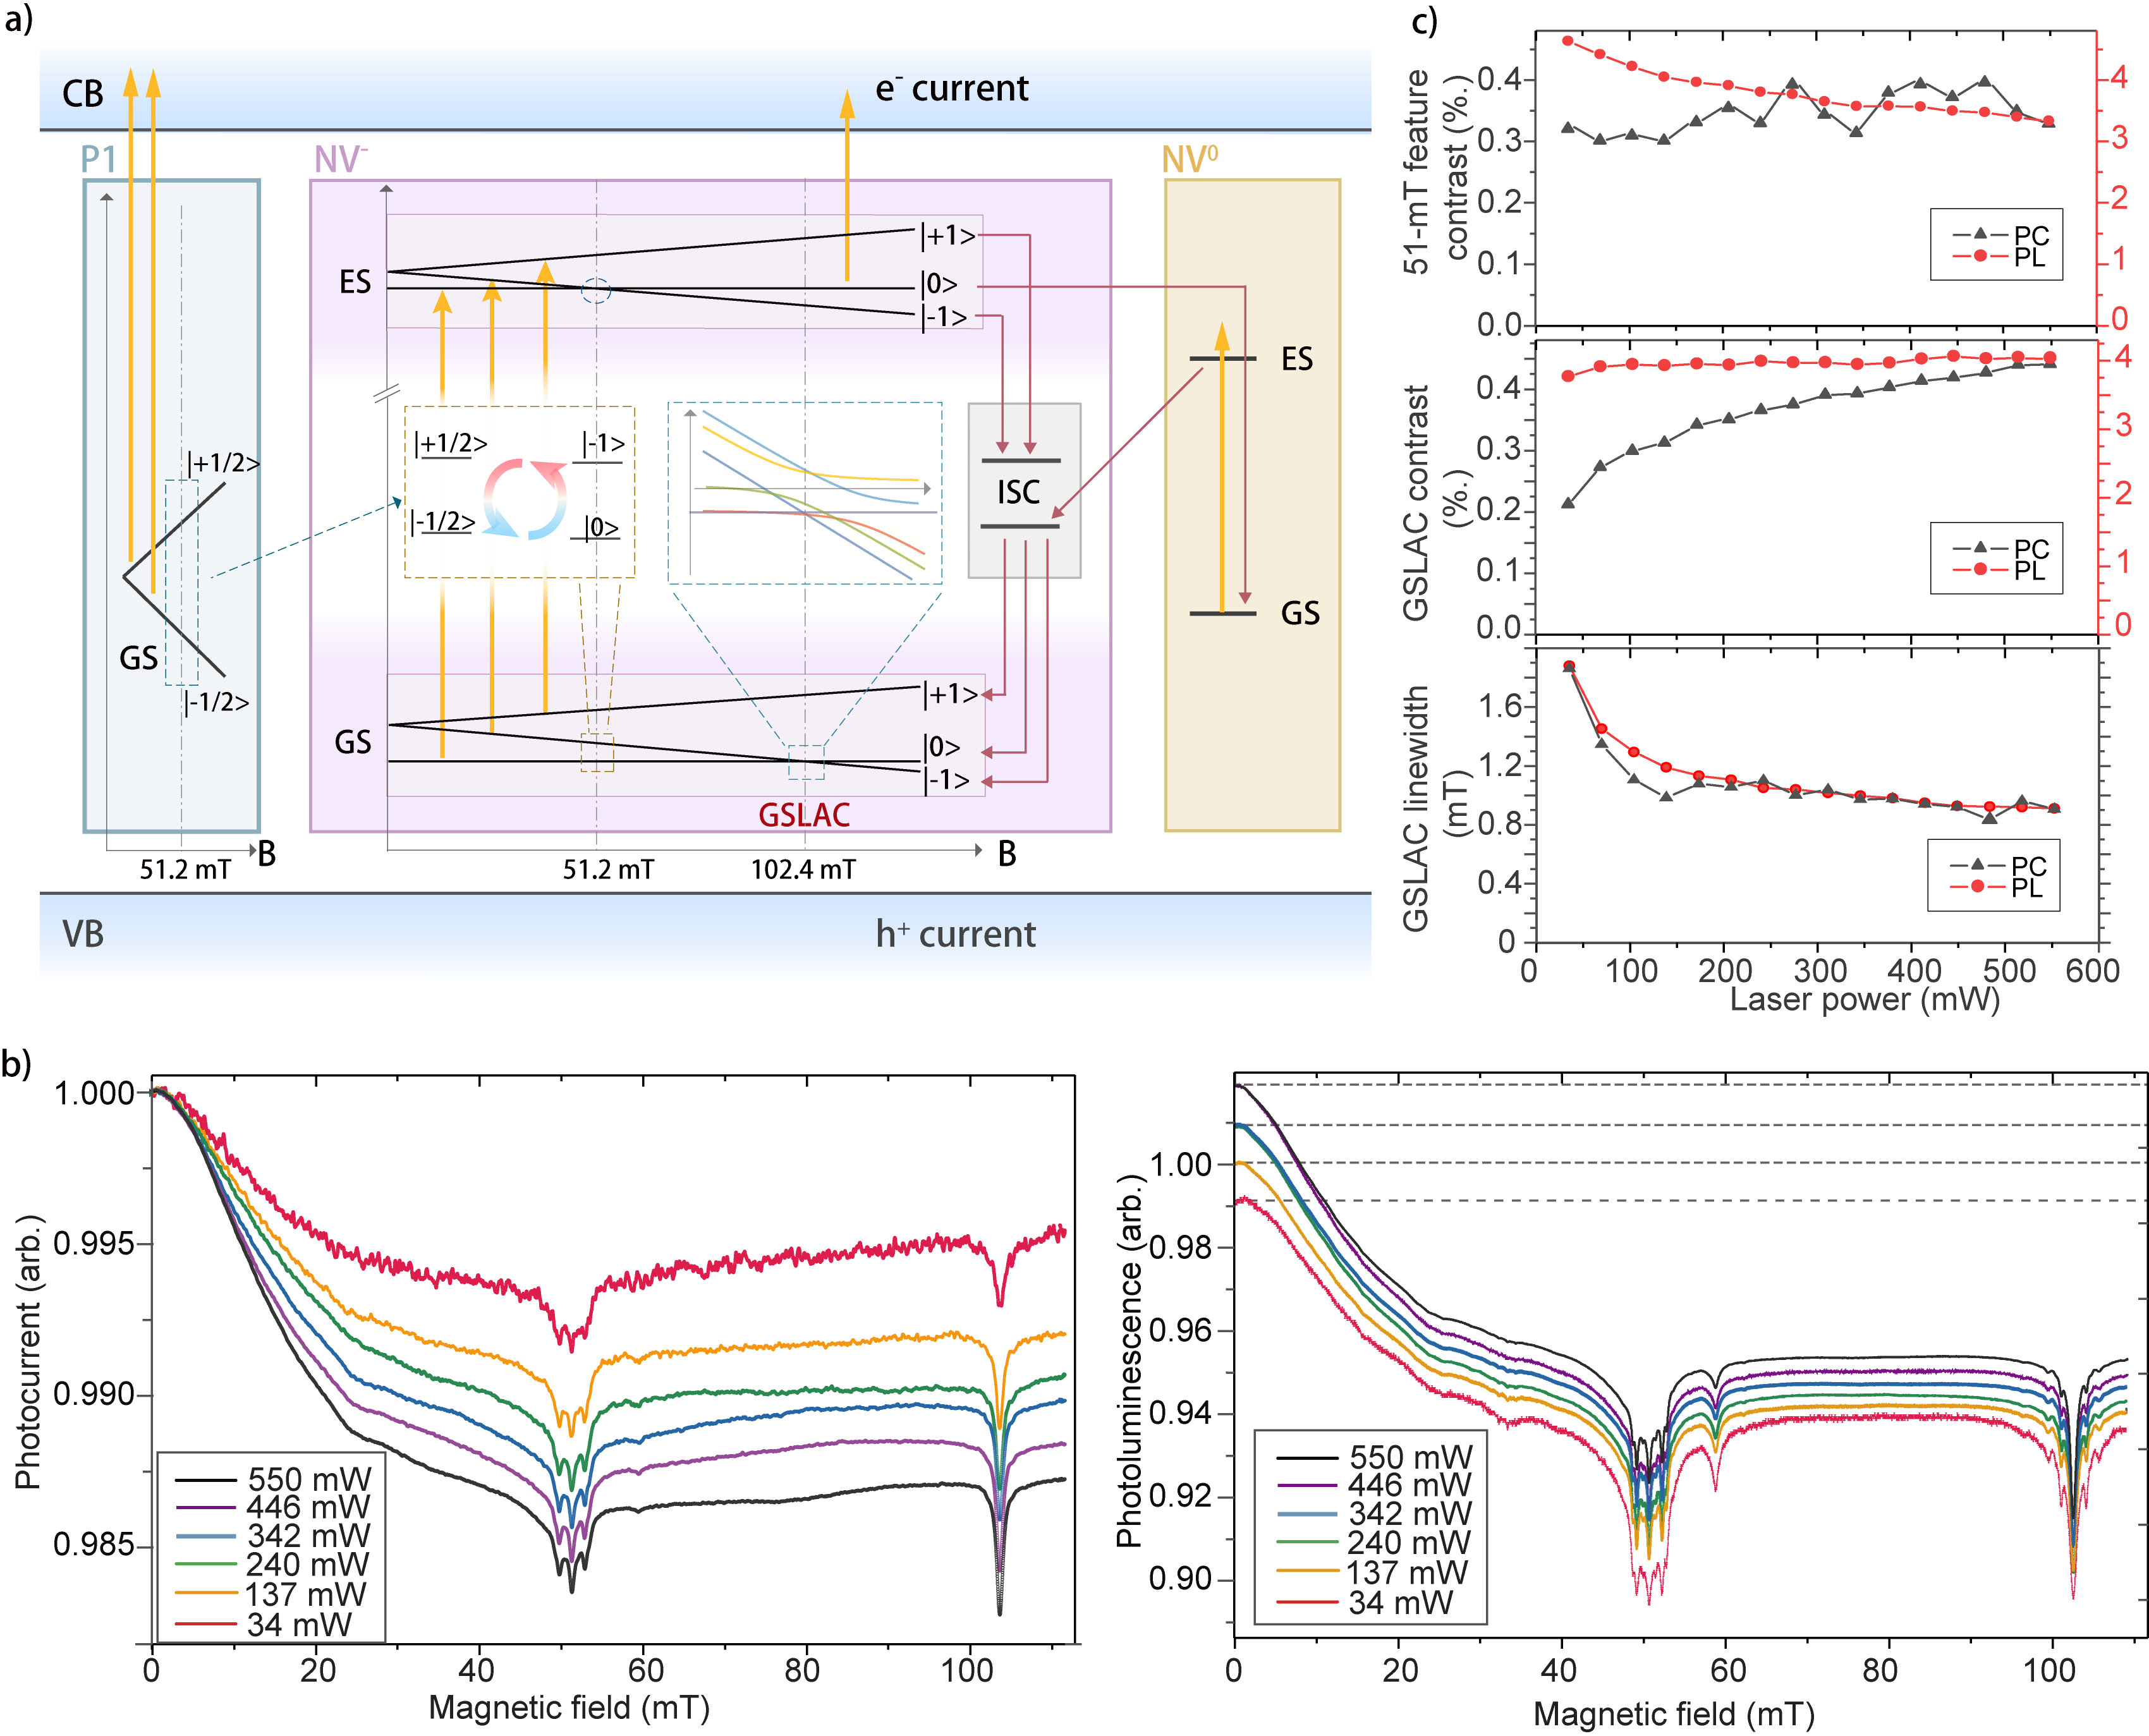
Photoionization within diamond.—Figure 2 summarizes optical and spin transitions at the 51 mT and the GSLAC point. Under sufficient optical illumination, defects inside semiconductor material can be ionized, thereby producing charge carries that move towards electrodes under electric field Aslam et al. (2013); Siyushev et al. (2013). Figure 2 (a) illustrates the photoionization of NV centers and P1 centers. The photoionization cycle of NV centers in diamond is spin-dependent Razinkovas et al. (2021). Incoming photons with the energy of 1.94 eV or higher, can be can lead to photoionization via two photon process of the NV center 111 If the photon energy is higher than 2.6 eV, an electron can be promoted from the ground state () directly to the CB Razinkovas et al. (2021).. In the first ionization step, the electron of the NV promoted to the excited state can decay either radiatively back to the ground state or nonradiatively into the long-lived metastable singlet state (intersystem crossing, ISC). The excited NVs can be further promoted to the conduction band by absorption of a second photon. Under an applied electric field, the electrons can freely travel in the conduction band and can finally be collected. Photoionization changes the NV charge state from NV- to NV0. The recovery of the NV- center by back conversion from NV0 can be induced by two-photon excitation of the NV0 center and capture of an electron from the valence band Siyushev et al. (2019). Recently, it has been suggested that this process can also be accomplished by a single photon Razinkovas et al. (2021); Manson et al. (2018). The dynamical cycling between the two charge states is enabled by optical excitation with wavelengths shorter than the zero-phonon line of NV0 Siyushev et al. (2013), in particular, the energies 2.6 eV are needed for that step. Thus, two charge carriers are produced within one cycle: one electron during ionization and one hole during NV- recovery Siyushev et al. (2019). This dynamic charge circulation enables photoelectric readout of NV centers. Photoionization inside diamond lattice can involve also other defects, e.g. P1 centers. The electrons from P1 centers can be promoted to the CB directly via one-photon ionization [Fig. 2 (a)] Bourgeois et al. (2015, 2020); Siyushev et al. (2013). These generated charge carriers lead to a background photocurrent signal [Fig. 2 (a)].
As discussed above, the photoinduced current in ensemble experiments involves the signal produced by both NV and P1 centers. Identifying individual contributions of the two types of defects, would provide additional information useful for optimization of photoelectric readout. Towards this goal, we explored the sharp features in the magnetic-field dependence of both the PC and PL signals, corresponding to the GSLAC and other B-field regions with enhanced cross-relaxation. These are identified as being due to NV-NV Ivády et al. (2021) and NV interactions with other spins such as those of P1 centers. Some of these features detected optically have already been discussed in Ref. Pezzagna and Meijer (2021). In Fig. 2 (b) we present normalized PL and photocurrent signals as a function of the applied magnetic field under various powers of the green laser light. This figure gives an overview of the changes in the spin contrast and the resonance linewidth, of the cross-relaxation and anticrossing features. Note that the contrast is defined as . A remarkably sharp feature around 102.4 mT, indicates the GSLAC which occurs when the Zeeman shift of the component equals to the zero-field splitting Wickenbrock et al. (2016); Zheng et al. (2020). At around 51.2 mT, the observed features correspond to cross-relaxation between the NV center and P1 centers Wickenbrock et al. (2016); Hall et al. (2016); Wood et al. (2016); Auzinsh et al. (2019); Lazda et al. (2020), where these two defects can exchange energy due to resonant transition frequencies Hall et al. (2016). The feature that appears near 59 mT corresponds to cross-relaxation between on-axis (along ) and off-axis NVs. The sharp GSLAC and relaxation features can be used for detecting electron spin resonance (ESR) with ODMR by tuning the static external magnetic field Wood et al. (2016). In our work, we show the first electric-readout demonstration of ESR that can be used for both spin-system characterization and sensing.
From Fig. 2 it is clear that the observed magnetic features show different dependence on the light power in the two detection methods. As concerns the PC readout, both the initial drop [the slope between 0 and 30 mT, see Fig. 2 (b)] and the GSLAC feature [Fig. 2 (c, middle)] increase in magnitude and also their spectral resolution gradually increases under stronger laser excitation, while they remain nearly constant in PL readout. One reason is the photocurrent background from the non-NV defects photoionization which adds a constant photocurrent background, therefore also reducing the spin contrast. Because the NV-related features come from two-photon processes while the P1 centers responsible for the background are ionized with a single photon, the contrast of the measurement improves at higher light powers. Also, the local spin environment can be altered with the application of green light as discussed in Ref. Manson et al. (2018). Currently, it is not known whether such changes will affect the PL and PC readout in the same way. Furthermore, such effects could also account for the narrowing of the GSLAC features (in both methods) in the presence of light, see Fig. 2 (c, bottom), due to depopulation of interacting spins (P1s) in the vicinity of NV centers, since more and more impurities are photoionized. This might also explain why the shape and the linewidth of the cross-relaxation feature at 51 mT, see Fig. 2 (b), stays nearly the same if observed via PC detection. Interestingly, at the same time, the contrast reduces in the PL signal for feature at 51 mT with increasing the laser power. We note also that the NV-NV cross-relaxation feature at 59.5 mT and the satellite features around GSLAC, which are prominent in PL have a much lower contrast in PC. The contrast in PL detection on the NV-NV feature accounts up to 2 % at low laser power and decreases to 0.7 % at higher laser power. For PC, the contrast is too low (0.1 %) to be quantitatively determined over the entire light-power range. For completeness, we point out the ratio of the PL contrasts of the NV-NV to NV-P1 features changes from 0.4 at low light power to 0.22 at high power. The difference in background signals in the overall measurement with the two methods does not fully account for the specific observation here. Understanding the reasons for these behaviors will be the subject of future work.
To compare with the experiment, we calculate the PC and PL signal in the given experimental conditions and geometric configuration, taking into account the cross section of the Pl emission, photoionization thresholds, optical saturation, etc. Razinkovas et al. (2021). The rate values are taken from the published data calculations that have been verified by comparing the PL and PC traces for different laser powers Bourgeois et al. . Figures 3 (a) and (b) show the predicted and measured laser-power dependence of the total PC and PL. Whilst the PC dependence is predicted to be saturation free, in accord with previous models Bourgeois et al. (2015), PL should saturate due to the limit imposed by the lifetime of NV- excited states and shelving into metastable singlet states. The small deviation from the experiment can be accounted for by the shadowing of the diamond by the electrodes, so effectively the power density is reduced. Figure 3 (c) illustrates the simulated PC and PL signals originating from the NV centers at different depths below the surface where laser spot and electrodes are. The local contributions are indicated with blue and red shaded area (in arbitrary units). It is clear that 90 % PC signal comes from a region within 0-30 m in depth where the NV centers experience sufficient both optical excitation and electric field to drive the charge carriers towards electrodes. While photoluminescence is produced throughout the diamond slab and detected once photons get out of the diamond chip, the photocurrent only from the high E-field region beneath the contact is detected. Based on the simulations, we estimate the ratio of effective interrogation volumes of PC to PL detection to be on the order of 1:20.

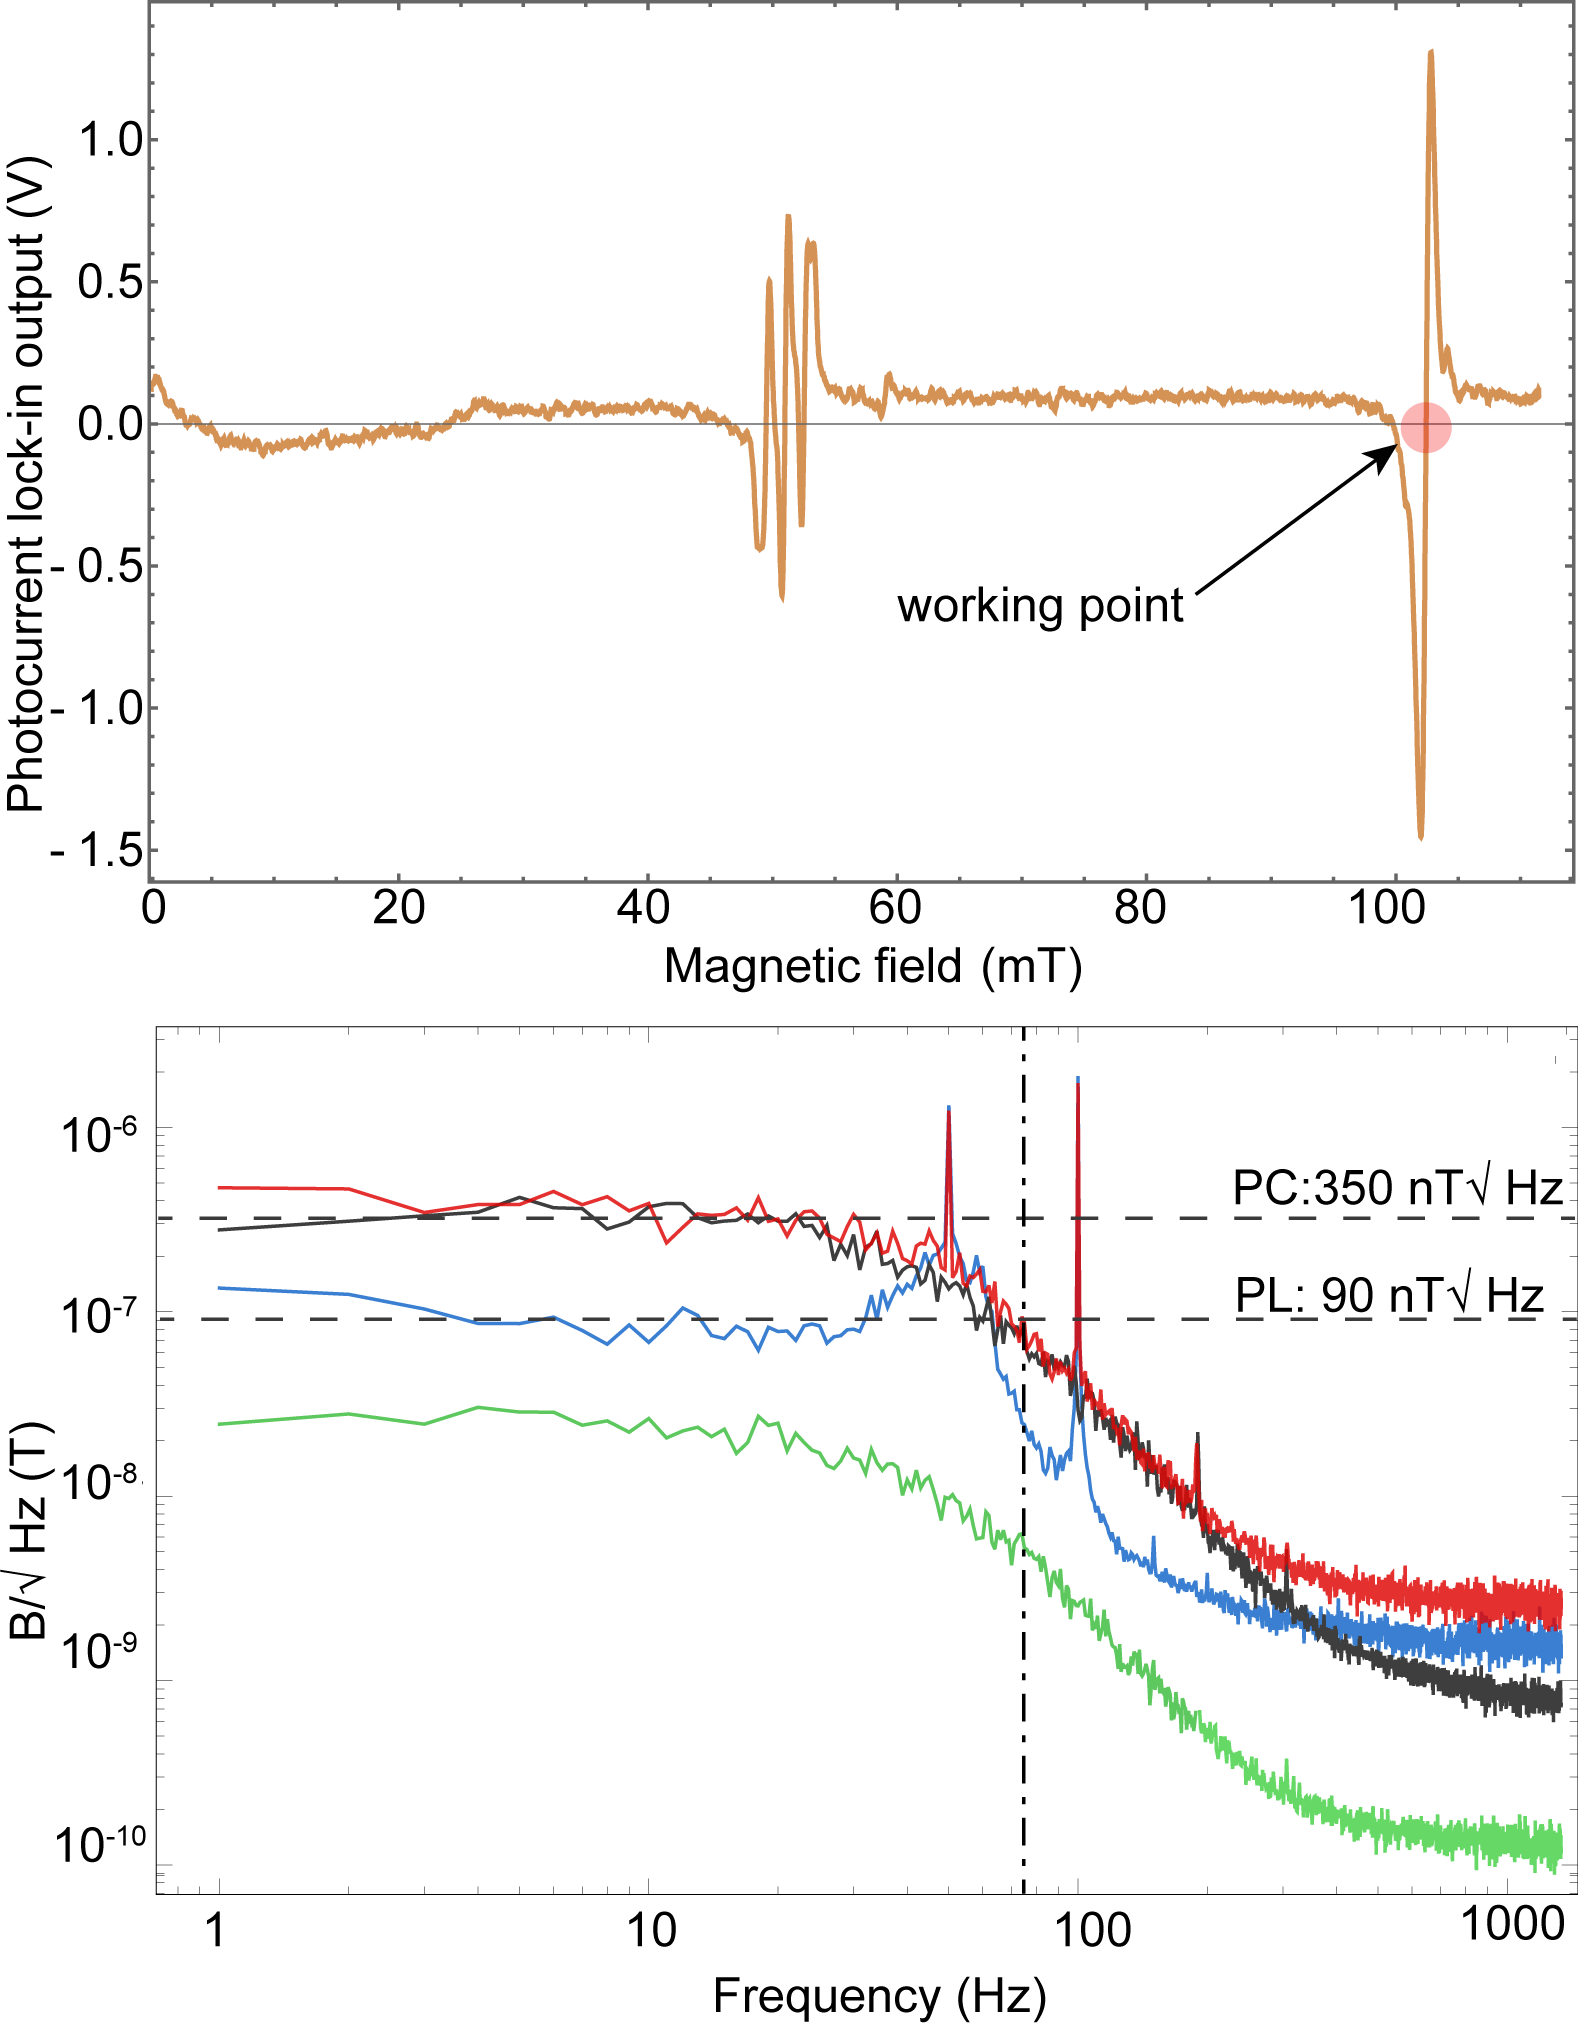
Electrical-readout magnetometer. –The B-field dependent relaxation at GSLAC can be used for a realization of a microwave-free magnetometer. The principle of PL detection at the GSLAC is introduced in Ref. Wickenbrock et al. (2016). Here we extend our approach to photocurrent readout. We apply an alternating magnetic field in addition to the bias field, and the fluorescence signal is demodulated in a properly phased LIA. The derivative signal, corresponding to the changes of the GSLAC slope with respect to the applied alternating B-field is shown in Fig. 4 (a) with a modulation frequency of 3.3 kHz, and a modulation depth of 0.1 mT which we select to be smaller than the FWHM. Around the GSLAC feature, the derivative signal depends approximately linearly on the magnetic field and can therefore be used for precise magnetic field measurements. The alignment and laser power were optimized to maximize the slope and the sensitivity of the magnetometer. The data near the zero-crossing are fit with a straight line to translate the LIA output signal into magnetic field (calibration). Then the background magnetic field is set to the center of the GSLAC feature (102.4 mT) where the magnetometer is maximally sensitive to external magnetic fields. The sensitivity of the magnetometer can be deduced from the noise in the LIA output and the calibration.
For noise measurements, the LIA output is recorded for 1 s. The data are passed through a fast Fourier transform as displayed in Fig. 4 (b), from which we can establish the noise-floor and the sensitivity spectrum. For comparison, similar data are collected for both PC (blue) and PL (red) detection, at a magnetic field of the GSLAC and also around 80 mT (black for PC and green for PL). The on-resonance noise floor is flat at around 350 nT/ and 90 nT/, respectively. At a field that is away from the GSLAC, the setup is insensitive to magnetic field variations and the data can be used to understand the technical noise level of the magnetometer. The off-resonance noise floor is flat at around 350 nT/ and 30 nT/, respectively. In the case of PC detection, the collection rate for electrons is significantly lower than the photon collection rate in the PL detection due to the mismatch of the interrogation volume, which decreases the signal to noise ratio. As mentioned, in the present geometry, the effective interrogation volume for PC detection is smaller than that for PL by a factor of 20, thus the electric-readout magnetometer would outperform a PL-based magnetometer in magnetic sensitivity per detection volume. According to the simulation, most of the incoming light penetrates to the diamond bulk and does not contribute to photocurrent generation, e.g. the large part of the photons (90 %) is not effectively used. This can be improved by optimizing the focusing geometry and the diamond material.
Another factor that negatively affects the PC-magnetometer sensitivity is the background signal produced by other defects, such as P1 centers Bourgeois et al. (2015), which in our case reduces the contrast by a factor of 10 (see Fig. 2). Incorporating a red-laser probe and two-color protocol would reduce this background and improve the magnetic sensitivity Bourgeois et al. . Note that the NV-diamond sample used here had been used previously for the first demonstration of a microwave-free magnetometer Wickenbrock et al. (2016) that achieved 6 nT / noise level. As compared to Wickenbrock et al. (2016) a portion of the laser light is blocked by the electrodes. Improving the efficiently used photons and the spin contrast would increase the sensitivity. The main focus of this work is to demonstrate an electrical-readout NV-based magnetometer and to discuss the underlying physics and potential routes for improvement, the sensitivity will be optimized in future work.
Summary and outlook.– The experimental results presented in this paper demonstrate electrical detection of cross relaxation processes involving NV centers in bulk diamond. We also report calculated results based on a model Bourgeois et al. that quantitatively describe and explain the experimental data. We anticipate this method, with careful and more sophisticated modelling Bourgeois et al. , can be employed for quantitative measurement of photogenerated carriers, which offers a tool to determine of the concentrations of various defects, including optically inactive P1 centers, paving the way for characterizing local environment information inside diamond lattice.
We demonstrate a photoionization-based microwave-free magnetometer based on the GSLAC, which, to the best of our knowledge, is the first demonstration of electric-readout NV magnetometry that provides an alternative to conventional NV-based magnetometers and potentially overcomes some of their limitations. These results open the door to a number of intriguing future directions. First, the electrical readout is compatible with nanoscale electrode structures Gulka et al. (2021), enabling advances towards integrated large-scale diamond quantum devices. It can be utilized to build scalable sensor arrays Bourgeois et al. (2020) and microscopes potentially superior to existing diamond quantum microscopes Glenn et al. (2017); Lenz et al. (2021) in terms of resolution. Second, it can be used to build hybrid gradiometers taking advantage of the sensing volume mismatch of PC readout and PL detection. The small sensing volume of the PC detection allows for high spatial resolution while the large sensing volume of the PL detection provides a background measurement in close proximity. Third, while the present studies are focused on diamond, we anticipate comparable behavior in other wide-bandgap semiconductors of technological importance.
Although we observed the magnetic resonances using red laser light (see the supplementary) that excludes the dominant current signal associated with the ionization of P1 centers, we still find a smaller GSLAC contrast Bourgeois et al. for photocurrent measurements in comparison with optical detection. Further studies are necessary to reveal the sources of the remaining background photocurrent.
Appendix
.1 Experimental setup
Figure 1 shows a schematic of the experimental setup. The apparatus includes a custom-built electromagnet. The electromagnet can be moved with a computer-controlled 3-D translation stage (Thorlabs PT3-Z8) and a rotation stage (Thorlabs NR360S, -axis). The NV-diamond sensor is placed in the center of both the magnetic bore and a pair of integrated Helmholtz coils along the -axis. The diamond can be rotated also around the -axis. This provides all degrees of freedom for placing the diamond in the center of the magnet and aligning the NV axis parallel to the magnetic field.
The light source is a solid-state laser emitting at a wavelength of 532 nm (Laser Quantum Gem 532). The green laser light propagates through an acousto-optic modulator (AOM) and can be modulated by turning first-order diffraction on and off. The PL emitted by the diamond sample is collected with a 50-mm-focal-length lens and detected with a photodetector (Thorlabs APD36A).
.2 Diamond sample
The sensor is constructed with a single-crystal [111]-cut diamond, synthesized using a high-temperature high-pressure (HPHT) method. The initial nitrogen concentration of the sample was specified as 200 ppm. To produce NV centers, the sample was electron-irradiated at 14 MeV (dose: ) and then annealed at 700∘C for three hours. The resulting NV centers are randomly oriented along all four {111} crystallographic axes of the diamond.
The electrodes for the photoelectric readout were fabricated by means of optical lithography. Prior electrode fabrication the diamond sample was cleaned in oxidizing mixture of H2SO4 and KNO3 at 250 ∘C for approximately 30 minutes, after which it was rinsed in deionized water. The electrode structure was placed on the top surface of the diamond. Shape of the electrodes are coplanar interdigitated contacts with a gap of 5 m. The metal stack composition is 20 nm titanium covered by 100 nm aluminum for wire bonding. The electrodes are bonded to the sample holder (carrier PCB) by a 25-m-thick aluminum wire.
Acknowledgements
The authors acknowledge the assistance by M. Omar and J. Shaji Rebeirro at the early stages of the project. This work was supported by the EU FET-OPEN Flagship Project ASTERIQS (action 820394), and the German Federal Ministry of Education and Research (BMBF) within the Quantumtechnologien program (FKZ 13N15064), and the Cluster of Excellence “Precision Physics, Fundamental Interactions, and Structure of Matter” (PRISMA+ EXC 2118/1) funded by the German Research Foundation (DFG) within the German Excellence Strategy (Project ID 39083149). J.H. is a PhD fellow of the Research Foundation - Flanders (FWO). P.S. acknowledges support by Baden-Württemberg Stiftung via Elite Program for Postdocs. M.N. acknowledges the SBO project DIAQUANT from Flemish fonds for Scientific Research No: S004018N. F.J. acknowledges the European Research Council via Synergy Grant HyperQ, the DFG via excellence cluster EXC 2154 POLiS and CRC1279, and the BMBF.
References
- Barry et al. (2020) J. F. Barry, J. M. Schloss, E. Bauch, M. J. Turner, C. A. Hart, L. M. Pham, and R. L. Walsworth, Sensitivity optimization for NV-diamond magnetometry, Rev. Mod. Phys. 92, 015004 (2020).
- Reiserer et al. (2016) A. Reiserer, N. Kalb, M. S. Blok, K. J. van Bemmelen, T. H. Taminiau, R. Hanson, D. J. Twitchen, and M. Markham, Robust quantum-network memory using decoherence-protected subspaces of nuclear spins, Phys. Rev. X 6, 021040 (2016).
- Siyushev et al. (2019) P. Siyushev, M. Nesladek, E. Bourgeois, M. Gulka, J. Hruby, T. Yamamoto, M. Trupke, T. Teraji, J. Isoya, and F. Jelezko, Photoelectrical imaging and coherent spin-state readout of single nitrogen-vacancy centers in diamond, Science 363, 728 (2019).
- Doherty et al. (2016) M. Doherty, C. A. Meriles, A. Alkauskas, H. Fedder, M. J. Sellars, and N. B. Manson, Towards a room-temperature spin quantum bus in diamond via electron photoionization, transport, and capture, Phys. Rev. X 6, 041035 (2016).
- Bourgeois et al. (2015) E. Bourgeois, A. Jarmola, P. Siyushev, M. Gulka, J. Hruby, F. Jelezko, D. Budker, and M. Nesladek, Photoelectric detection of electron spin resonance of nitrogen-vacancy centres in diamond, Nat.commun. 6, 1 (2015).
- Hrubesch et al. (2017) F. M. Hrubesch, G. Braunbeck, M. Stutzmann, F. Reinhard, and M. S. Brandt, Efficient electrical spin readout of NV- centers in diamond, Phys. Rev. Lett. 118, 037601 (2017).
- Morishita et al. (2020) H. Morishita, S. Kobayashi, M. Fujiwara, H. Kato, T. Makino, S. Yamasaki, and N. Mizuochi, Room temperature electrically detected nuclear spin coherence of NV centres in diamond, Sci. Rep. 10, 1 (2020).
- Gulka et al. (2017) M. Gulka, E. Bourgeois, J. Hruby, P. Siyushev, G. Wachter, F. Aumayr, P. R. Hemmer, A. Gali, F. Jelezko, M. Trupke, and M. Nesladek, Pulsed photoelectric coherent manipulation and detection of N-V center spins in diamond, Phys. Rev. Appl. 7, 044032 (2017).
- Manfrinato et al. (2013) V. R. Manfrinato, L. Zhang, D. Su, H. Duan, R. G. Hobbs, E. A. Stach, and K. K. Berggren, Resolution limits of electron-beam lithography toward the atomic scale, Nano letters 13, 1555 (2013).
- Gulka et al. (2021) M. Gulka, D. Wirtitsch, V. Ivády, J. Vodnik, J. Hruby, G. Magchiels, E. Bourgeois, A. Gali, M. Trupke, and M. Nesladek, Room-temperature control and electrical readout of individual nitrogen-vacancy nuclear spins, Nat. Commun. 12, 4421 (2021).
- Zheng et al. (2020) H. Zheng, Z. Sun, G. Chatzidrosos, C. Zhang, K. Nakamura, H. Sumiya, T. Ohshima, J. Isoya, J. Wrachtrup, A. Wickenbrock, and D. Budker, Microwave-free vector magnetometry with nitrogen-vacancy centers along a single axis in diamond, Phys. Rev. Appl. 13, 044023 (2020).
- Bourgeois et al. (2020) E. Bourgeois, M. Gulka, and M. Nesladek, Photoelectric detection and quantum readout of nitrogen-vacancy center spin states in diamond, Adv. Opt. Mater. 8, 1902132 (2020).
- (13) E. Bourgeois, M. Nesladek, et al., work in press .
- Razinkovas et al. (2021) L. Razinkovas, M. Maciaszek, F. Reinhard, M. W. Doherty, and A. Alkauskas, Photoionization of negatively charged nv centers in diamond: Theory and ab initio calculations, Phys. Rev. B 104, 235301 (2021).
- Aslam et al. (2013) N. Aslam, G. Waldherr, P. Neumann, F. Jelezko, and J. Wrachtrup, Photo-induced ionization dynamics of the nitrogen vacancy defect in diamond investigated by single-shot charge state detection, New J. Phys 15, 013064 (2013).
- Siyushev et al. (2013) P. Siyushev, H. Pinto, M. Vörös, A. Gali, F. Jelezko, and J. Wrachtrup, Optically controlled switching of the charge state of a single nitrogen-vacancy center in diamond at cryogenic temperatures, Phys. Rev. Lett. 110, 167402 (2013).
- Manson et al. (2018) N. B. Manson, M. Hedges, M. S. Barson, R. Ahlefeldt, M. W. Doherty, H. Abe, T. Ohshima, and M. J. Sellars, NV—N+ pair centre in 1b diamond, New J. Phys 20, 113037 (2018).
- Ivády et al. (2021) V. Ivády, H. Zheng, A. Wickenbrock, L. Bougas, G. Chatzidrosos, K. Nakamura, H. Sumiya, T. Ohshima, J. Isoya, D. Budker, and A. Gali, Photoluminescence at the ground-state level anticrossing of the nitrogen-vacancy center in diamond: A comprehensive study, Phys. Rev. B 103, 035307 (2021).
- Pezzagna and Meijer (2021) S. Pezzagna and J. Meijer, Quantum computer based on color centers in diamond, Appl. Phys. Rev. 8, 011308 (2021).
- Wickenbrock et al. (2016) A. Wickenbrock, H. Zheng, L. Bougas, N. Leefer, S. Afach, A. Jarmola, V. M. Acosta, and D. Budker, Microwave-free magnetometry with nitrogen-vacancy centers in diamond, App. Phys. Lett. 109, 053505 (2016).
- Hall et al. (2016) L. T. Hall, P. Kehayias, D. A. Simpson, A. Jarmola, A. Stacey, D. Budker, and L. C. L. Hollenberg, Detection of nanoscale electron spin resonance spectra demonstrated using nitrogen-vacancy centre probes in diamond, Nat. Commun. 7 (2016).
- Wood et al. (2016) J. D. A. Wood, D. A. Broadway, L. T. Hall, A. Stacey, D. A. Simpson, J.-P. Tetienne, and L. C. L. Hollenberg, Wide-band nanoscale magnetic resonance spectroscopy using quantum relaxation of a single spin in diamond, Phys. Rev. B 94, 155402 (2016).
- Auzinsh et al. (2019) M. Auzinsh, A. Berzins, D. Budker, L. Busaite, R. Ferber, F. Gahbauer, R. Lazda, A. Wickenbrock, and H. Zheng, Hyperfine level structure in nitrogen-vacancy centers near the ground-state level anticrossing, Phys. Rev. B 100, 075204 (2019).
- Lazda et al. (2020) R. Lazda, L. Busaite, A. Berzins, J. Smits, M. Auzinsh, D. Budker, R. Ferber, and F. Gahbauer, Cross-relaxation studies with optically detected magnetic resonances in nitrogen-vacancy centers in diamond in an external magnetic field, arXiv preprint arXiv:2007.00473 (2020).
- Glenn et al. (2017) D. R. Glenn, R. R. Fu, P. Kehayias, D. Le Sage, E. A. Lima, B. P. Weiss, and R. L. Walsworth, Micrometer-scale magnetic imaging of geological samples using a quantum diamond microscope, Geochemistry, Geophysics, Geosystems 18, 3254 (2017).
- Lenz et al. (2021) T. Lenz, G. Chatzidrosos, Z. Wang, L. Bougas, Y. Dumeige, A. Wickenbrock, N. Kerber, J. Zázvorka, F. Kammerbauer, M. Kläui, Z. Kazi, K.-M. C. Fu, K. M. Itoh, H. Watanabe, and D. Budker, Imaging topological spin structures using light-polarization and magnetic microscopy, Phys. Rev. Appl. 15, 024040 (2021).
Supplementary
The electric field applied between the two electrodes is important for the readout. Here we investigate the dependence of total PC signal as well as the contrast and linewidth of the magnetic resonances on the electric potential. We used two lasers that provide 532 nm and 637 nm photons, which are modulated for detection with a LIA, see Fig. S1 (a). The obtained parameters of the PC readout as a function of applied voltage are summarized in Fig. S1 (b)-(e). The acquired PC signal increases as the applied voltage increases for both excitation [Fig. S1 (b)]. Although the optical profile for the two lasers can not be exactly the same, the value of red-laser signal is less than that of the green-laser signal, which is consistent with the fact that in our sample. This is because the photoionization cross section for the second photoionization step for the red light is lower than for the green light leading to overall lower photocurrent Bourgeois et al. (2020, ). Note that the red-light detection was operated with green light constantly on, for NV0 recovery.

This tendency can also be concluded from the difference in the linewidth of the GSLAC feature, shown in Fig. S1 (c), indicates that the green light strongly alters the local spin environment by photoionization of P1 centers, which is weaker in the case of red light excitation. Similar trends of the 51-mT and GSLAC features, whose contrasts decrease under green-light excitation while they moderately increase with red-light illumination shown in Fig. S1 (d) and (e), evidence different cycling rates of the components contributed by NV center or other impurities.