Observational hints on the torus obscuring gas behaviour through X-rays with NuSTAR data
Abstract
According to theory, the torus of active galactic nuclei (AGN) is sustained from a wind coming off the accretion disk, and for low efficient AGN, it has been proposed that such structure disappears. However, the exact conditions for its disappearance remain unclear. This can be studied throughout the reflection component at X-rays, which is associated with distant and neutral material at the inner walls of the torus in obscured AGN. We select a sample of 81 AGNs observed with NuSTAR with a distance limit of D< 200 Mpc and Eddington rate . We fit the 3-70 keV spectra using a model accounting for a partial-covering absorber plus a reflection component from neutral material. We find that the existence of the reflection component spans in a wide range of black-hole mass and bolometric luminosities, with only 13% of our sample (11 sources) lacking of any reflection signatures. These sources fall in the region in which the torus may be lacking in the L-MBH diagram. For the sources with a detected reflection component, we find that the vast majority of them are highly obscured (), with being Compton-thick. We also find an increase on the number of unobscured sources and a tentative increase on the ratio between emission line and Compton-hump luminosities toward , suggesting that the contribution of the line changes with Eddington ratio.
keywords:
galaxies: active - X-rays: galaxies - galaxies: Seyfert.1 Introduction
It has been widely accepted that most galaxies with bulges host a super massive black-hole (SMBH), sometimes fed by an accretion disk, causing the release of energy in orders of magnitude that can go up to (see Netzer, 2015, for a review). Such objects are known as Active Galactic Nuclei (AGN). The Unified Model (UM) of AGN (Antonucci, 1993; Urry & Padovani, 1995) assumes that all AGN have the same components (accretion disk, broad and narrow line regions, a dusty structure-the torus and, in some cases a jet) and that the difference in the spectrum relies on the angle of sight to the observer. This effect may prevent the observer to see the inner parts of AGN and therefore the existence/absence of broad lines in the optical spectrum, leading to a purely observational classification (see Netzer, 2015; Ramos Almeida and Ricci, 2017, for recent reviews on the topic).
The cornerstone of the UM are both the obscuring structure and the inclination angle, as well as the existence of the jet. However, some observations suggest that there are objects lacking the obscuring structure (the so-called true type 2 AGN, Laor, 2003). This might be explained under the theoretical prediction that the torus should disappear below a certain luminosity, assuming that both the torus and broad line region (BLR) are formed from a wind coming off the accretion disk (Elvis, 2000). In fact, Elitzur and Shlosman (2006) state that both the torus and the BLR should disappear for bolometric luminosities below (), since the radiation pressure cannot longer counteract the gravity for both structures. Indeed, González-Martín et al. (2017) using mid-infrared (mid-IR) spectra, have found hints on the torus disappearance in inefficient AGN (see also González-Martín et al., 2015). Moreover, Elitzur and Ho (2009) find that the torus might still be absent for luminous AGN, depending on the efficiency of the accretion disk at feeding the SMBH. Therefore, not only the luminosity of the AGN gives us hints on the existence of the torus, but also the efficiency and density of the wind. Both mid-IR and X-ray studies suggest that the torus is intrinsically different in type-2 AGN than in type-1 AGN (e.g., Ramos Almeida et al., 2009; Ricci et al., 2011), and that the fraction of type-2 sources increases for AGN with Eddington rates (Ricci et al., 2017). Indeed, Khim and Yi (2017) found a complex behaviour where the number of clouds and covering factor change for high accretion sources (i.e., ), forming a ridge-shaped distribution in the luminosity versus black-hole mass () diagram. However, the behaviour of the torus for low accretion AGN with , where the torus should evolve to its disappearance, remains an open question.
Historically, the obscuring matter has been studied through the column density along the line of sight (LOS) that affects the primary X-ray continuum (e.g. Matt, Guainazzi, and Maiolino, 2003). Additionally, the torus can also be studied at X-rays because the inner parts of it can reflect the X-ray emission from the corona above the disk, placing a reflection component in the X-ray spectrum. This reflection component has two main signatures: the Compton hump and the FeK line. Theoretical works have shown that the resulting reflection spectrum depends on the shape and distribution of the reflector, but also on the line-of-sight to the observer, and all of this might have an impact on the luminosity of this component (e.g. see Furui et al., 2016). However, it has not been until recent years that studies aiming to detect and characterize the torus through the reflection component at X-rays have been developed (e.g. Ricci et al., 2011; Liu and Li, 2014; Ricci et al., 2014; Furui et al., 2016; Kawamuro et al., 2016), but also thanks to the unprecedented sensitivity achieved above 10 keV provided by NuSTAR (e.g., Panagiotou and Walter, 2019, 2020; Esparza-Arredondo et al., 2019, 2021, among others).
The aim of this study is to trace the behaviour of the obscuring material and plausible disappearance of the torus through X-rays for low accretion AGN, compared to what has already been found for more efficient AGN, by using NuSTAR data. This work is divided as follows: in Section 2 we present the sample and the data reduction. In Section 3 we present the model and the spectral analysis, while in Section 4 we present the results obtained, in Section 5 we discuss them and finally we present the summary and conclusions of our work in Section 6. Throughout the analysis, we assume a cosmology of , and , and all distances are redshift-independent taken from the NASA Extragalactic Database (NED111https://ned.ipac.caltech.edu/).
2 Sample and data reduction
2.1 Sample selection
We search for all available galaxies within a 10 arcmin radius (using SIMBAD database222http://simbad.u-strasbg.fr/simbad/) for all archived pointings within the NuSTAR database (until July 2020). We find a total of 1313 galaxies within a distance of 200 Mpc () to sample the nearby Universe. We then retrieve the activity type, keeping only those galaxies classified as AGN in either NED or SIMBAD databases. We obtain a total of 463 AGN. We download all the data from the HEASARC archive333https://heasarc.gsfc.nasa.gov/ and reduce the observations for these 463 AGN (see section 2.2 reduction procedure), keeping only the observations with more than 30 bins after producing grouped spectra, and at least 10 bins above 10 keV. We also remove from the sample those AGN where the NuSTAR resolution cannot fully isolate the nuclear spectra for dual AGN. We obtain a total of 301 sources fulfilling these criteria.
We finally search for . These measurements are needed to obtain an estimate of the Eddington rate. We firstly look for calculated via reverberation mapping (e.g. Laor, 2001, 2003; Woo and Urry, 2002; Vasudevan and Fabian, 2009) and velocity dispersion otherwise (e.g. McKernan, Ford, and Reynolds, 2010; van den Bosch et al., 2015; van den Bosch, 2016), by using the M- relation, ( Ferrarese and Merritt, 2000; Gebhardt et al., 2000). As for the sources for which the is not calculated through the methods reported above, we also search for the in different AGN catalogues where the mass are compiled from literature (e.g. Khorunzhev et al., 2012; Koss et al., 2017; Bär et al., 2019). We obtain measurements for 231 out of the 301 AGN. This sample is now referred to as full sample.
We then fit the spectra of the 231 AGN with an unabsorbed power-law to roughly calculate the bolometric luminosity, , from X-rays following the conversion from Marconi et al. (2004), where is in units of :
| (1) |
| Name | Other name | ra | dec | Redshift | Dist. | AGN | Galaxy | Obs. date | Obs ID | Exp. time | Ext. radius | N. counts | Bins | |
|---|---|---|---|---|---|---|---|---|---|---|---|---|---|---|
| deg | deg | Mpc | type | type | ks | arcmin | ||||||||
| (1) | (2) | (3) | (4) | (5) | (6) | (7) | (8) | (9) | (10) | (11) | (12) | (13) | (14) | (15) |
| NGC1052 | PKS0238-084 | 40.26999 | -8.25576 | 0.0048 | 20.6 | 8.4 | L2 | E4 | 2017-01-17 | 60201056002 | 59.75 | 0.5 | 91.27 | 738 |
| NGC2655 | ARP225 | 133.90721 | 78.22308 | 0.0057 | 24.4 | 8.0 | L2 | Sa-0 | 2016-11-10 | 60160341004 | 15.95 | 2 | 35.30 | 98 |
| UGC5101 | CGCG289-011 | 143.96539 | 61.35292 | 0.0394 | 168.6 | 8.3 | L1 | S? | 2014-03-21 | 60001068002 | 18.29 | 1 | 24.33 | 51 |
| M81 | NGC3031 | 148.88822 | 69.06530 | 0.0009 | 3.7 | 7.8 | L1.8 | SAab | 2015-05-18 | 60101049002 | 209.09 | 0.5 | 255.69 | 1252 |
| NGC3079 | UGC05387 | 150.49085 | 55.67979 | 0.0038 | 16.4 | 7.2 | L2 | SBc | 2013-11-12 | 60061097002 | 21.54 | 0.5 | 29.85 | 128 |
| UGC5881 | CGCG125-008 | 161.67715 | 25.93155 | 0.0206 | 88.2 | 8.2 | L2 | Sa | 2015-05-17 | 60160409002 | 21.41 | 1 | 37.39 | 169 |
| NGC3628 | UGC06350 | 170.07091 | 13.58949 | 0.0023 | 9.8 | 7.2 | L2 | SAb | 2017-12-23 | 60371004002 | 50.35 | 1 | 32.46 | 86 |
| NGC3718 | ARP214 | 173.14522 | 53.06791 | 0.0034 | 14.7 | 8.3 | L1 | SB | 2017-10-27 | 60301031004 | 90.37 | 0.5 | 44.38 | 208 |
| NGC3998 | UGC06946 | 179.48389 | 55.45359 | 0.0047 | 20.1 | 9.0 | L1.9 | Sa-0 | 2016-10-25 | 60201050002 | 103.94 | 0.5 | 111.02 | 714 |
| NGC4102 | UGC07096 | 181.59631 | 52.71095 | 0.0046 | 19.5 | 8.2 | L2 | SAB | 2015-11-19 | 60160472002 | 20.57 | 0.5 | 39.14 | 198 |
| M106 | NGC4258 | 184.74008 | 47.30372 | 0.0017 | 7.3 | 7.5 | L1.9 | SBbc | 2016-01-10 | 60101046004 | 103.62 | 0.5 | 71.20 | 466 |
| M58 | NGC4579 | 189.43165 | 11.81809 | 0.0043 | 18.4 | 7.9 | L1.9 | Sb | 2016-12-06 | 60201051002 | 117.84 | 0.5 | 116.60 | 738 |
| NGC5005 | UGC08256 | 197.73463 | 37.05894 | 0.0047 | 20.1 | 8.1 | L1.9 | SABb | 2014-12-16 | 60001162002 | 49.70 | 1 | 27.82 | 40 |
| NGC6240 | IC4625 | 253.24525 | 2.40099 | 0.0245 | 104.8 | 9.1 | L2 | S0-a | 2014-03-30 | 60002040002 | 30.86 | 0.5 | 55.62 | 444 |
| MCG+08-31-041 | ARP102B | 259.81038 | 48.98040 | 0.0242 | 103.5 | 8.9 | L1 | E0 | 2015-11-24 | 60160662002 | 22.40 | 1 | 45.28 | 248 |
| NGC7130 | IC5135 | 327.08121 | -34.95131 | 0.0162 | 69.2 | 7.5 | L2 | Sa | 2016-12-15 | 60261006002 | 42.12 | 0.5 | 23.86 | 63 |
| NGC7331 | UGC12113 | 339.26709 | 34.41592 | 0.0031 | 13.4 | 7.8 | L2 | Sbc | 2016-05-03 | 40202013002 | 42.97 | 1 | 38.16 | 153 |
| NGC7479 | UGC12343 | 346.23612 | 12.32288 | 0.0066 | 28.3 | 7.3 | L1.9 | SBbc | 2016-05-12 | 60201037002 | 18.45 | 1 | 27.73 | 82 |
We define low accretion sources as those with , where is the Eddington luminosity, defined as the maximum luminosity an object can release without losing the thermal equilibrium. Such defintion is based on the assumption that the transition from the standard disk (Shakura and Sunyaev, 1973) to an Advection Dominated Accretion disk (ADAF, Narayan and Yi, 1995) occurs around this value (see also, Constantin et al., 2009; Gu & Cao, 2009; Younes et al., 2011; Gültekin et al., 2012; Jang et al., 2014; Connolly et al., 2016; Hernández-García et al., 2016). This sample contains a total of 87 sources. This corresponds to of the total nearby available AGN observed with NuSTAR. Four of these sources (NGC 3310, Mrk 18, Arp 299C, and M 83) are excluded from the sample because although they are classified as AGN in SIMBAD/NED, they are also classified as starbursts. Finally, we exclude NGC 4486 due to the strong thermal and jet contribution (de Jong et al., 2015), while we exclude Centaurus A due to strong jet contribution (Hardcastle et al., 2003). Note that we also check for important thermal/jet contribution for the rest of the sample. Although in some cases there are reported thermal contribution at X-rays (see González-Martín et al., 2009), it does not contribute above 3 keV for the rest of the sources. One consequence , although not the only one, would be a very steep photon index ((i.e., Nemmen, Storchi-Bergmann, and Eracleous, 2014) as the one in M 87 ( de Jong et al., 2015), which is not the case in our sample, see section 4). Our final sample comprises a total of 81 sources.
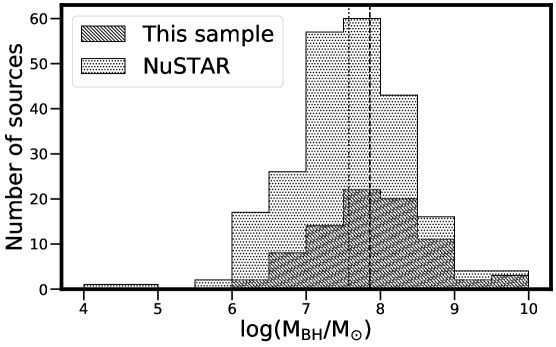
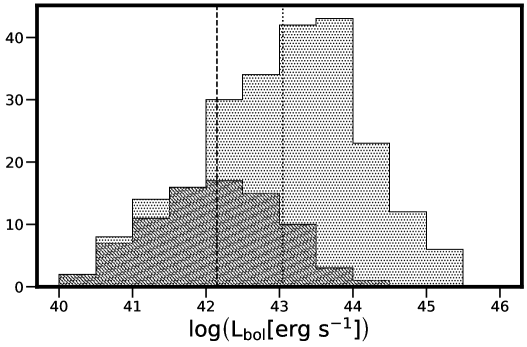
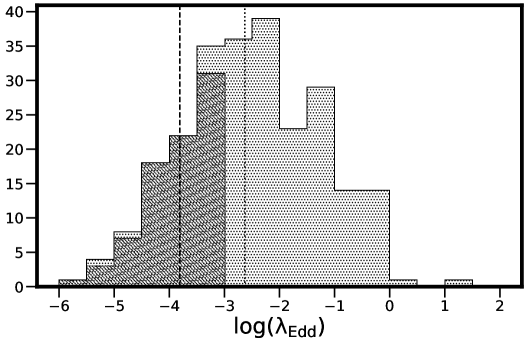
Fig. 1 shows the distribution (in logarithmic scale) of (left), (center) and (right) for our final sample of 81 sources, compared to the full sample of 231 sources with estimates. The mean of the distributions of the final sample for , and are 7.9, 42.1 and -3.8, compared to 7.6, 43.0 and -2.6, for the full sample. Thus, our final sample contains lower luminosity AGN with roughly the same range of values compared to the full sample. Note that this imposes a bias on our sample for Eddington rates above -3. Moreover, once we correct by absorption in the line-of-sight, Eddington rates will be higher (see section 4.1). Thus, we might lack objects with low obscuration and intrinsically high Eddington rate above -2.5. Another source of bias is the fact that our sample relies purely on archival data. For instance, we do not find available NuSTAR data for the candidates of torus disappearance in González-Martín et al. (2017). Thus, we might also be missing the least luminous sources as they might not haven been observed yet. We warn the reader on the fact that our sample is by no means complete, although it does cover a wide range in and Eddington rate.
Several works have studied samples of inefficient AGN in different wavelengths aiming to understand the nature and behaviour of the reflection component and will be used to compare with our new results along the text. Here we report a brief summary on the matching of our sample with theirs. The largest sample using X-rays is reported by González-Martín et al. (2009) where they study a sample of 82 inefficient AGN using Chandra and XMM-Newton data. We have 12 sources in common with available NuSTAR observations. Kawamuro et al. (2016) also studied a sample of 10 inefficient AGN using Suzaku and we have five sources in common with them. On the other hand, González-Martín et al. (2017) analyzed a sub-sample of those presented by González-Martín et al. (2009) together with a complementary Seyfert sample (22 sources). We have a total of 39 sources in common with the works mentioned above, which is around 50% of our final sample.
Tables 1 and 2 report the observational parameters for the optically classified as low ionization nuclear emission-line regions (LINER, 18 sources) and Seyfert (64 sources) samples, respectively.
| Name | Other name | ra | dec | Redshift | Dist. | AGN | Galaxy | Obs. date | Obs ID | Exp. time | Ext. radius | N. counts | Bins | |
| deg | deg | Mpc | type | type | ks | arcmin | ||||||||
| (1) | (2) | (3) | (4) | (5) | (6) | (7) | (8) | (9) | (10) | (11) | (12) | (13) | (14) | (15) |
| NGC253 | ESO474-G029 | 11.88806 | -25.28880 | 0.0008 | 3.2 | 6.9 | S2 | SAB | 2012-09-15 | 50002031004 | 157.65 | 0.5 | 83.01 | 431 |
| NGC424 | ESO296-G004 | 17.86516 | -38.08345 | 0.0118 | 50.7 | 7.5 | S1 | SB0-a | 2013-01-26 | 60061007002 | 15.48 | 1 | 32.14 | 145 |
| IC1657 | ESO352-G024 | 18.52924 | -32.65090 | 0.0107 | 45.9 | 7.3 | S2 | SBbc | 2017-01-15 | 60261007002 | 45.16 | 0.5 | 40.39 | 217 |
| 2MXJ01142491-5523497 | NGC0454NED0 | 18.60388 | -55.39705 | 0.0121 | 51.9 | 8.5 | S2 | II | 2016-02-14 | 60061009002 | 24.23 | 1 | 34.16 | 144 |
| MCG+08-03-018 | 2MXJ01223442+5003180 | 20.64341 | 50.05496 | 0.0204 | 87.4 | 8.4 | S2 | S? | 2014-01-27 | 60061010002 | 31.66 | 1 | 43.88 | 230 |
| NGC612 | ESO353-G015 | 23.49063 | -36.49328 | 0.0298 | 127.5 | 8.5 | S2 | SA0 | 2012-09-14 | 60061014002 | 16.69 | 0.5 | 31.62 | 158 |
| Mrk573 | UGC01214 | 25.99074 | 2.34987 | 0.0172 | 73.6 | 7.4 | S2 | S0 | 2018-01-06 | 60360004002 | 32.00 | 1 | 29.73 | 66 |
| NGC788 | MCG-01-06-025 | 30.27693 | -6.81587 | 0.0136 | 58.3 | 7.7 | S2 | S0-a | 2013-01-28 | 60061018002 | 15.41 | 0.5 | 35.64 | 198 |
| M77 | NGC1068 | 40.66988 | -0.01329 | 0.0025 | 10.6 | 7.2 | S2 | SAb | 2012-12-18 | 60002030002 | 57.85 | 0.5 | 82.88 | 657 |
| NGC1106 | UGC02322 | 42.66873 | 41.67158 | 0.0145 | 62.0 | 7.5 | S2 | SA0 | 2019-02-22 | 60469002002 | 18.74 | 1 | 26.56 | 67 |
| NGC1125 | MCG-03-08-035 | 42.91792 | -16.65111 | 0.0109 | 46.8 | 7.2 | S2 | SAB0 | 2019-06-10 | 60510001002 | 31.74 | 1 | 36.46 | 123 |
| NGC1142 | UGC02389 | 43.80095 | -0.18355 | 0.0288 | 123.5 | 8.9 | S2 | Spec | 2017-10-14 | 60368001002 | 20.71 | 0.5 | 28.40 | 119 |
| Mrk1066 | UGC02456 | 44.99415 | 36.82050 | 0.0121 | 51.7 | 7.0 | S2 | SB0 | 2014-12-06 | 60001154002 | 30.08 | 1 | 30.03 | 64 |
| NGC1194 | UGC02514 | 45.95463 | -1.10375 | 0.0136 | 58.2 | 7.8 | S1.9 | SA0 | 2015-02-28 | 60061035002 | 31.54 | 0.5 | 39.68 | 224 |
| NGC1229 | ESO480-G033 | 47.04513 | -22.96025 | 0.0363 | 155.4 | 8.3 | S2 | SBb | 2013-07-05 | 60061325002 | 24.92 | 1 | 35.29 | 155 |
| NGC1320 | MRK0607 | 51.20288 | -3.04226 | 0.0088 | 37.7 | 6.9 | S2 | Sa | 2013-02-10 | 60061036004 | 28.00 | 1 | 34.45 | 120 |
| NGC1358 | MCG-01-10-003 | 53.41535 | -5.08951 | 0.0134 | 57.5 | 8.1 | S2 | SAB0 | 2017-08-01 | 60301026002 | 50.00 | 0.5 | 39.72 | 206 |
| NGC1386 | ESO358-G035 | 54.19266 | -35.99927 | 0.0038 | 16.1 | 7.0 | S1 | S0-a | 2016-05-11 | 60201024002 | 26.43 | 1 | 22.29 | 45 |
| UGC3157 | CGCG468-001 | 71.62399 | 18.46091 | 0.0154 | 66.0 | 8.0 | S2 | SBbc | 2014-03-18 | 60061051002 | 20.09 | 1 | 35.16 | 163 |
| 2MJ05081968+1721481 | CGCG468-002NED01 | 77.08211 | 17.36336 | 0.0175 | 75.0 | 8.6 | S2 | - | 2012-07-23 | 60006011002 | 15.52 | 0.5 | 51.25 | 368 |
| ESO5-4 | IRAS06220-8636 | 91.42384 | -86.63195 | 0.0060 | 25.9 | 7.6 | S2 | Sb | 2015-11-10 | 60061063002 | 24.70 | 1 | 33.74 | 109 |
| NGC2273 | UGC03546 | 102.53614 | 60.84580 | 0.0068 | 29.0 | 7.0 | S2 | SBa | 2014-03-23 | 60001064002 | 23.23 | 1 | 36.69 | 150 |
| UGC3601 | CGCG204-032 | 103.95638 | 40.00031 | 0.0171 | 73.3 | 8.6 | S1.5 | S? | 2019-01-06 | 60160278002 | 19.67 | 1 | 45.70 | 257 |
| ESO428-14 | MCG-05-18-002 | 109.13003 | -29.32469 | 0.0054 | 23.2 | 7.0 | S2 | SA0 | 2015-01-11 | 60001152002 | 40.25 | 0.5 | 29.46 | 111 |
| 2MXJ07561963-4137420 | WAJ075619.61-413742.1 | 119.08182 | -41.62835 | 0.0210 | 90.1 | 8.0 | S2 | - | 2014-07-29 | 60061076002 | 22.75 | 2 | 38.87 | 62 |
| NGC2788A | ESO060-G024 | 135.66418 | -68.22683 | 0.0144 | 61.6 | 8.7 | S2 | Sb | 2019-06-14 | 60469001002 | 27.58 | 0.5 | 27.18 | 99 |
| IC2560 | ESO375-G004 | 154.07795 | -33.56381 | 0.0078 | 33.4 | 7.2 | S2 | SBbc | 2014-07-16 | 50001039004 | 49.56 | 1 | 35.56 | 99 |
| NGC3147 | UGC05532 | 154.22347 | 73.40065 | 0.0092 | 39.6 | 8.7 | S2 | SAbc | 2015-12-27 | 60101032002 | 49.26 | 0.5 | 48.47 | 293 |
| NGC3393 | ESO501-G100 | 162.09778 | -25.16203 | 0.0125 | 53.6 | 7.5 | S2 | SBab | 2013-01-28 | 60061205002 | 15.66 | 0.5 | 25.00 | 87 |
| 2MXJ11055897+5856456 | CGCG291-028 | 166.49593 | 58.94603 | 0.0271 | 116.0 | 8.4 | S2 | - | 2019-03-26 | 60160420002 | 15.77 | 2 | 38.17 | 134 |
| NGC3621 | ESO377-G037 | 169.56792 | -32.81260 | 0.0016 | 6.7 | 6.8 | S2 | SA | 2017-12-15 | 60371002002 | 30.78 | 2 | 41.09 | 100 |
| NGC3786 | UGC06621 | 174.92714 | 31.90943 | 0.0118 | 50.6 | 7.5 | S1.8 | SAB | 2014-06-09 | 60061349002 | 21.99 | 2 | 36.08 | 103 |
| IC751 | UGC06972 | 179.71915 | 42.57034 | 0.0312 | 133.6 | 8.6 | S2 | Sb | 2013-02-04 | 60061217004 | 52.02 | 0.5 | 25.72 | 63 |
| M88 | NGC4501 | 187.99673 | 14.42041 | 0.0042 | 18.0 | 7.5 | S2 | SAb | 2018-01-26 | 60375002002 | 62.77 | 1 | 27.45 | 55 |
| IC3639 | ESO381-G008 | 190.22015 | -36.75585 | 0.0109 | 46.8 | 6.9 | S2 | SBbc | 2015-01-09 | 60001164002 | 58.73 | 0.5 | 25.34 | 51 |
| NGC4785 | ESO219-G004 | 193.36382 | -48.74915 | 0.0116 | 49.6 | 8.1 | S2 | SAB | 2014-08-20 | 60001143002 | 48.83 | 0.5 | 40.05 | 208 |
| Mrk231 | UGC08058 | 194.05931 | 56.87368 | 0.0422 | 180.6 | 8.4 | S2 | Sc | 2017-10-19 | 80302608002 | 82.06 | 0.5 | 46.30 | 242 |
| NGC4941 | PGC045165 | 196.05461 | -5.55160 | 0.0033 | 14.2 | 6.9 | S2 | SABa | 2016-01-19 | 60061236002 | 20.66 | 1 | 32.48 | 119 |
| NGC4939 | MCG-02-33-104 | 196.05970 | -10.33953 | 0.0085 | 36.4 | 7.9 | S2 | Sbc | 2017-02-17 | 60002036002 | 22.04 | 0.5 | 36.10 | 181 |
| NGC4945 | ESO219-G024 | 196.36366 | -49.46790 | 0.0010 | 4.2 | 6.3 | S2 | SBc | 2013-06-15 | 60002051004 | 54.62 | 0.5 | 129.04 | 1565 |
| MCG-03-34-064 | PGC046710 | 200.60202 | -16.72836 | 0.0200 | 85.6 | 8.1 | S1.8 | SB? | 2016-01-17 | 60101020002 | 78.50 | 0.5 | 80.69 | 727 |
| NGC5135 | ESO444-G032 | 201.43358 | -29.83368 | 0.0015 | 6.3 | 7.6 | S2 | Sab | 2015-01-14 | 60001153002 | 33.36 | 1 | 34.28 | 88 |
| M51 | ARP085 | 202.46957 | 47.19526 | 0.0017 | 7.3 | 6.6 | S2 | - | 2017-03-17 | 60201062003 | 163.06 | 0.5 | 41.19 | 99 |
| NGC5252 | UGC08622 | 204.56613 | 4.54265 | 0.0195 | 83.6 | 8.9 | S1.9 | S0 | 2013-05-11 | 60061245002 | 19.01 | 0.5 | 65.88 | 523 |
| NGC5283 | UGC08672 | 205.27395 | 67.67222 | 0.0106 | 45.3 | 7.7 | S2 | S0 | 2018-11-17 | 60465006002 | 33.02 | 0.5 | 42.87 | 234 |
| NGC5347 | UGC08805 | 208.32416 | 33.49083 | 0.0050 | 21.6 | 6.8 | S2 | Sab | 2015-01-16 | 60001163002 | 47.30 | 1 | 32.04 | 54 |
| NGC5643 | ESO272-G016 | 218.16991 | -44.17461 | 0.0027 | 11.4 | 7.0 | S2 | Sc | 2014-05-24 | 60061362002 | 22.46 | 1 | 36.54 | 146 |
| NGC5695 | UGC09421 | 219.34223 | 36.56783 | 0.0125 | 53.5 | 7.7 | S2 | SBb | 2018-01-16 | 60368004002 | 41.61 | 1 | 27.60 | 43 |
| NGC5728 | MCG-03-37-005 | 220.59970 | -17.25317 | 0.0071 | 30.3 | 7.8 | S2 | SABa | 2013-01-02 | 60061256002 | 24.36 | 0.5 | 52.02 | 402 |
| NGC5899 | UGC09789 | 228.76355 | 42.04985 | 0.0090 | 38.6 | 8.7 | S2 | SABc | 2014-04-08 | 60061348002 | 23.88 | 0.5 | 54.44 | 383 |
| MCG+14-08-004 | CGCG367-009 | 244.83058 | 81.04650 | 0.0239 | 102.4 | 9.8 | S2 | - | 2014-12-21 | 60061270002 | 29.76 | 1 | 38.54 | 165 |
| ESO137-34 | 2MXJ16351411-5804481 | 248.80881 | -58.08003 | 0.0077 | 33.0 | 8.0 | S2 | SAB0 | 2016-06-07 | 60061272002 | 18.55 | 0.5 | 28.69 | 111 |
| 2MXJ16504275+0436180 | NGC6230NED01 | 252.67813 | 4.60508 | 0.0321 | 137.3 | 9.8 | S2 | - | 2017-02-06 | 60061273002 | 21.03 | 0.5 | 56.94 | 409 |
| 2MXIJ1802473-145454 | WAJ180247.38-145454.8 | 270.69708 | -14.91528 | 0.0034 | 14.6 | 7.8 | S1 | - | 2016-05-01 | 60160680002 | 19.96 | 0.5 | 80.72 | 595 |
| 2MXJ18305065+0928414 | LEDA1365707 | 277.71098 | 9.47830 | 0.0194 | 83.2 | 8.4 | S2 | - | 2015-11-15 | 60061285002 | 22.72 | 1 | 39.73 | 183 |
| IC4995 | ESO186-G034 | 304.99574 | -52.62192 | 0.0161 | 68.9 | 7.2 | S2 | SA0 | 2019-06-03 | 60360003002 | 34.00 | 1 | 32.33 | 70 |
| NGC6921 | UGC11570 | 307.12018 | 25.72339 | 0.0145 | 62.0 | 8.4 | S2 | SA0 | 2013-05-18 | 60061300002 | 19.52 | 1 | 33.67 | 117 |
| NGC7213 | ESO288-G043 | 332.31754 | -47.16669 | 0.0051 | 22.0 | 7.7 | S1.5 | Sa | 2014-10-05 | 60001031002 | 101.62 | 0.5 | 160.49 | 965 |
| NGC7319 | UGC12102 | 339.01501 | 33.97588 | 0.0109 | 46.7 | 7.3 | S2 | SBbc | 2017-09-27 | 60261005002 | 41.88 | 0.5 | 30.20 | 88 |
| UGC12282 | CGCG532-004 | 344.73035 | 40.93221 | 0.0169 | 72.4 | 9.8 | S1.9 | Sa | 2019-11-18 | 60160812002 | 28.56 | 1 | 27.50 | 43 |
| NGC7582 | ESO291-G016 | 349.59842 | -42.37057 | 0.0049 | 21.2 | 7.6 | S1.5 | SBab | 2016-04-28 | 60201003002 | 48.49 | 0.5 | 123.14 | 1100 |
| 2MXJ23252420-3826492 | IRAS23226-3843 | 351.35078 | -38.44700 | 0.0359 | 153.8 | 8.2 | S1 | - | 2017-06-11 | 80101001002 | 96.61 | 0.5 | 30.57 | 80 |
| NGC7674 | UGC12608 | 351.98624 | 8.77895 | 0.0174 | 74.5 | 7.6 | S2 | SAbc | 2014-09-30 | 60001151002 | 52.00 | 0.5 | 36.08 | 161 |
2.2 Data reduction
All NuSTAR (Harrison et al., 2013) data were reduced using the data analysis software NuSTARDAS v.1.4.4 distributed by the High Energy Astrophysics Archive Research Center (HEASARC). The calibrated, cleaned and screened event files for both FPMA and FMPB focal plane modules were generated using the nupipeline task (CALDB 20160502). We automatically extracted three circular apertures with radius of 0.5, 1, and 2 arcsec centred at the NED position of the source. For each of them we produced eight backgrounds around the target. These backgrounds are located at a distance of three times the aperture radius of the target (i.e. 1.5, 3, or 6 arcsec) with position angles of 0, 45, 90, 135, 180, 225, 270, and 315 degrees. We produced in this way 24 spectra for each target. The Redistribution Matrix and Auxiliary Response files (RMF and ARF) were produced with the nuproducts package available in NuSTARDAS. We chose the spectrum that maximises the S/N in the 3-70 keV band, avoiding off-nuclear contributors. Tables 1 and 2 provide the best extraction radius for each target. Note the optimal extraction radius is 1 arcmin ( kpc) for the vast majority of the objects, due to the relative faintness of our sources.
We then performed a binning method with a minimum S/N ratio of 3, using the ftgrouppha task within FTOOLS. The grouping using a minimum S/N ratio is particularly relevant for faint sources which are probably background dominated above 25 keV. Note that we also performed the standard grouping method accounting for a minimum of 30 counts per bin (the grppha task) finding similar results in the spectral parameters of the sources. However, the grouping performed with a minimum S/N ratio clearly improves the error bars at high energies for faint sources as expected.
3 Spectral Analysis
3.1 Baseline models
In this section we present four models used in the analysis to fit the spectra, which are fitted using xspec (Arnaud, 1996, version 12.10.0)444 http://cxc.heasarc.gsfc.nasa.gov/docs/xanadu/xspec/. Throughout the analysis, we use the statistics. We begin the analysis by modelling the intrinsic continuum with a power-law affected by a patchy absorber, in what is known as the partial covering scenario. We add two Gaussian profiles centred at 6.7 and 6.97 keV, to account for the Fe xxv and Fe xxvi ionized emission lines as they are the most common ionized lines present at hard X-rays for AGN. In the software terminology, this model has the following form:
| (2) |
where represents the partial-covering scenario, in which the first power-law component is associated with the intrinsic continuum absorbed by the material along the LOS to the observer and the second power-law component is the scattered emission that reaches the observer. The parameters for both power-laws are linked, including the normalization, to simulate the partial-covering scenario. The free parameters for this model are the column density (), the constant associated with the covering factor (as ), the photon index (), and the normalization of the power-law.
The free parameters of the Gaussian components, emulating the emission lines are the center, width and normalization. The widths of the Gaussian components are fixed to be narrow (0.1 keV555The NuSTAR spectral resolution is 400 eV at 6 keV, see
https://heasarc.gsfc.nasa.gov/docs/nustar/nustar_tech_desc.html) and the centers are fixed to 6.7 and 6.97 keV, respectively.
For the second and third models we include an extra reflection component as follows:
| (3) |
| (4) |
For , we choose as reflection component the pexrav model (Magdziarz and Zdziarski, 1995). This model assumes Compton reflection from neutral X-ray photons in an optically thick material with plane-parallel geometry. This model has as free parameters the photon index, high energy cutoff, relative reflection (R), metal and iron abundances, inclination angle, and normalization. We have set the photon index of pexrav () to be the same as that of the power-law, assuming that the reflection occurs in the AGN such that both emissions are correlated. The energy cutoff is fixed to 300 keV assuming this cutoff to happen above the NuSTAR energy range. Note that although several works (e.g. Molina et al., 2019; Younes et al., 2019; Ezhikode et al., 2020) have aimed to find this cutoff in AGN spectra, it has only been possible for very few objects, and in most cases, it happens well above the NuSTAR range (e.g Baloković et al., 2020). Therefore, we do not expect for this parameter to be constrained nor to affect the overall analysis. We have set R to for pexrav to account for the reflection component only, without contribution from the intrinsic power-law continuum. Thus, this reflection model with the relative reflection set to plus the power-law component is equivalent to the pexrav allowing the relative reflection to vary. However, we used with the relative reflection to in order to separate both the intrinsic continuum and the reflection components.
The rest of the parameters are set to their default values except for the normalization. Note that in this model version, the addition of an extra Gaussian profile is necessary to emulate the FeK line, since pexrav assumes reflection from a neutral material, and does not account for this line. In this model, the width of the line at 6.4 keV is also fixed to 0.1 keV.
For , we include the reflection component using pexmon (Nandra et al., 2007). This model is an updated version of pexrav that includes fluorescence lines such as FeK, FeK and NiK. This model also accounts for the Compton shoulder, by assuming a Gaussian line at 6.315 keV with a width of 0.35 keV. Additionally, it assumes a connection between the equivalent width (EW) of the FeK line and that of the Compton shoulder. This reflection model has as free parameters the photon index (), relative reflection, cutoff energy, metal and iron abundances, inclination angle, and normalization. Similar to , the parameter R is set to , the energy cutoff is set to 300 keV and the other parameters, except the normalization, are set to their default values.
The difference between and relies on the fact that pexmon accounts for the abundance of iron in the medium through the inclusion of the FeK, FeK and NiK lines. Indeed, these lines are correlated with the Compton-reflection as they are fixed to a fraction of the Compton-shoulder, and they also depend on the photon index of the intrinsic continuum. pexmon also accounts for the Compton-shoulder, while pexrav is a simpler model not accounting for such features. Thus, pexmon already incorporates the line at 6.4 keV while we add this line using a Gaussian profile in . We use to calculate the EW and luminosity of the 6.4 keV line, with the normalization and error of the line component and the tools equivalent and luminosity within xspec. also allows us to isolate the effect of the line from that of the Compton shoulder. Note that both models are equivalent in the analysis. However, since pexmon self-consistently accounts for both the continuum and line emission due to the reprocessing in neutral, distant material, the rest of the analysis is based on this model. We include to study the detection of the reflection component in our sample through the f-statistic test when comparing models (see below). Note also that regardless of the model, we account for Galactic absorption and redshift by using the nh tool within ftools (retrieved from NED666https://ned.ipac.caltech.edu and fixed to the HI maps of Kalberla et al., 2005).
We also use a fourth model that accounts for reflection dominated sources, i.e., sources for which the intrinsic continuum is completely covered by the reflection component in the available X-ray data. This model has the following form:
| (5) |
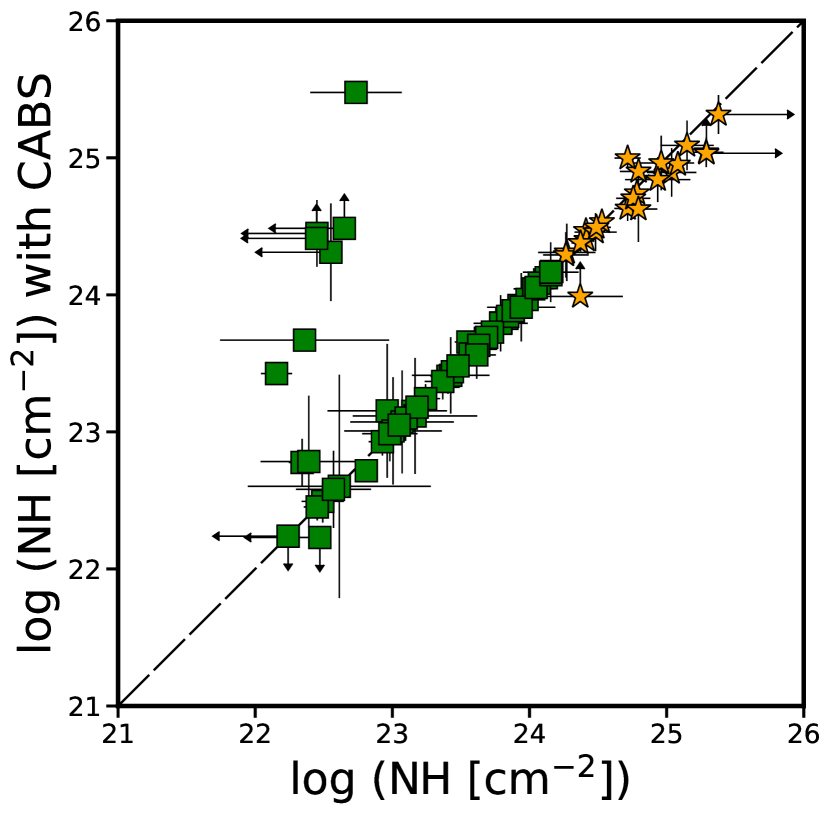
This analysis does not use sophisticated models as borus (Baloković et al., 2018) or mytorus (Murphy and Yaqoob, 2009) for neutral torus reflection because the faintness of the sources in our sample may not allow us to restrict geometrical parameters for the majority of them. Indeed, we also tested the mytorus model, but the S/N of the data were too low for parameters to be restriced in most cases. Instead, we prefer a homogeneous analysis of the strength and general characteristics of the reflection component in our sample. This is sufficient to study the dependence of the existence of the reflection component with the AGN power, which is one of the main purposes of this analysis. Furthermore, it also avoids the use of ionized disk reflection components, such as relxill (Dauser et al., 2014) because disk reflection has been found only for a small fraction of AGN, all of them in the high accretion regime (Esparza-Arredondo et al., 2021). Finally, this spectral analysis lacks the inclusion of the Compton scattering, which contributes specially for Compton-thick777https://ned.ipac.caltech.edu/level5/March04/Comastri/Comastri_contents.html (CT) sources. However, the available models within xspec (e.g., cabs) do not properly account for it as they assume an inadequate cross-section in the modelling (cf., Murphy and Yaqoob, 2009, and mytorus manual888http://mytorus.com.). Indeed, we also try the scenario in which cabs is included but we find the intrinsic luminosity to be unrealistically high in some cases (see Appendix A). Note that the exclusion of such a component leads to a systematic uncertainty, which is translated into an underestimation of the intrinsic luminosities of CT sources. However, our baseline model has been widely used in several works aimed to find general properties of AGN and characterize the reflection component, even in CT objects (e.g., Kawamuro et al., 2016; Panagiotou and Walter, 2019, 2020; Kang, Wang, and Kang, 2020). Thus, the baseline model used in this work will lead to robust results that can be easily compared with previous works (e.g., Kawamuro et al., 2016; Annuar et al., 2015, 2017, 2020).
3.2 Spectral fitting
We start the analysis by fitting the spectra to . We then fit the spectra to , and obtain the EW and the luminosity of the FeK line as explained above. We then fit the spectra to and test if reflection is required by the data using the f-test tool within xspec. If the f-test throws a probability value below , then the reflection component is required by the data. For those objects for which the reflection component is required, we also test the statistical need for a power-law (i.e., we fit the spectra to ). Objects for which such component is not statistically needed will be referred as reflection dominated.
We also estimate the reflection fraction, defined in this work as , where is the luminosity of the reflection component and is the luminosity of the intrinsic continuum, modelled with a power-law, with both luminosities calculated in the 3-70 keV energy range. They are computed using the cluminosity command within xspec. We estimate the 1- errors for the best-fit parameters. Errors in the luminosities of the different components, as well as in the EW of the FeK line are presented as follows: if the 3- errors are well constrained, we present the 1- error; upper/lower limits correspond to the 3- estimates otherwise. This makes the analysis more conservative on the luminosity limit of the reflection component and the FeK line for those sources where the reflection component or the FeK line are not recovered by the data since it gives 99.6% the upper limit of the distribution. As for the reflection fraction, we perform MCMC simulations to recover its value and error as follows: we choose a random number within a normal distribution centered at the actual value whenever the luminosity is well constrained. However, when there is an upper/lower limit of the luminosity, we choose a random number drawn from an uniform distribution with limits zero and the upper/lower limit. We then calculate the ratio and repeat the same procedure 1000 times. Finally, we obtain the median for the central value and the and quartiles as the error range. Whenever the upper limit is above 1 or the lower limit is below 0, we report the value as a lower or upper limit, respectively.
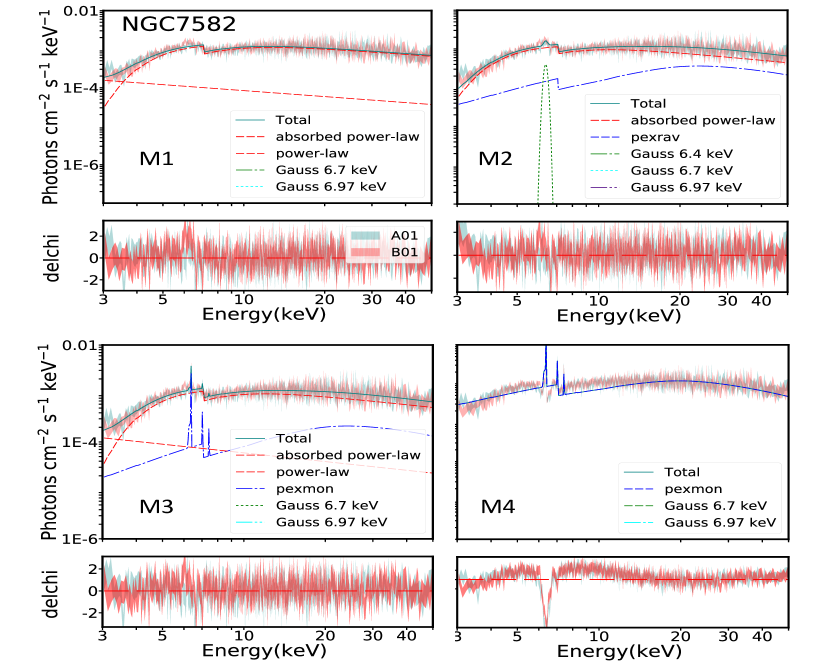
Fig. 2 shows the best fit for (upper left), (upper right), (lower left) and (lower right) for NGC 7582 as an example of the resulting spectral fits. For this particular object, we obtain for a , a for while for we obtain , for which the f-test gives a value of . Indeed, in the upper left panel of the figure, it is possible to see the poor fit and large residuals in particular around the line, indicating the need of an extra component to fit the spectrum. Also note that although upper right and lower left panels show different models, they both fit the data well, by accounting for the reflection component, mostly noticeable through the FeK line. On the other hand, fits the data poorly with a (see lower right panel). Indeed, although required, the line accounts only for of the reflection component, while the latter only accounts for of the 3-70 keV primary continuum luminosity. This is an example where the existence of the emission line, the f-test when comparing with the partial-covering intrinsic continuum model, and the luminosity detection limit, point out to the existence of a reflection component for this source.
4 Results
| Name | ftest | ||||||||||
|---|---|---|---|---|---|---|---|---|---|---|---|
| (1) | (2) | (3) | (4) | (5) | (6) | (7) | (8) | (9) | (10) | (11) | (12) |
| NGC1052 | ✓ | ||||||||||
| NGC2655 | x | ||||||||||
| UGC5101 | x | ||||||||||
| M81 | - | x | |||||||||
| NGC3079CT | ✓ | ||||||||||
| UGC5881 | x | ||||||||||
| NGC3628 | - | x | |||||||||
| NGC3718 | x | ||||||||||
| NGC3998 | - | x | |||||||||
| NGC4102 | x | ||||||||||
| M106 | x | ||||||||||
| M58 | x | ||||||||||
| NGC5005 | x | ||||||||||
| NGC6240 | ✓ | ||||||||||
| MCG+08-31-041 | ✓ | ||||||||||
| NGC7130CT | ✓ | ||||||||||
| NGC7331 | x | ||||||||||
| NGC7479CT | ✓ | ||||||||||
| Name | ftest | ||||||||||
|---|---|---|---|---|---|---|---|---|---|---|---|
| (1) | (2) | (3) | (4) | (5) | (6) | (7) | (8) | (9) | (10) | (11) | (12) |
| NGC253 | x | ||||||||||
| NGC424R | - | - | - | - | ✓ | ||||||
| IC1657 | x | ||||||||||
| 2MXJ0114-5523 | x | ||||||||||
| MCG+08-03-018 | ✓ | ||||||||||
| NGC612 | x | ||||||||||
| Mrk573CT | ✓ | ||||||||||
| NGC788 | ✓ | ||||||||||
| M77CT | ✓ | ||||||||||
| NGC1106CT | ✓ | ||||||||||
| NGC1125CT | ✓ | ||||||||||
| NGC1142 | ✓ | ||||||||||
| Mrk1066 | ✓ | ||||||||||
| NGC1194 | ✓ | ||||||||||
| NGC1229 | ✓ | ||||||||||
| NGC1320CT | ✓ | ||||||||||
| NGC1358 | ✓ | ||||||||||
| NGC1386CT | ✓ | ||||||||||
| UGC3157 | x | ||||||||||
| 2MSJ0508+1721 | ✓ | ||||||||||
| ESO5-4CT | ✓ | ||||||||||
| NGC2273CT | ✓ | ||||||||||
| UGC3601 | - | x | |||||||||
| ESO428-14CT | ✓ | ||||||||||
| 2MXJ0756-4137 | x | ||||||||||
| NGC2788ACT | ✓ | ||||||||||
| IC2560CT | ✓ | ||||||||||
| NGC3147 | x | ||||||||||
| NGC3393CT | ✓ | ||||||||||
| 2MXJ1105+5856 | x | ||||||||||
| NGC3621 | x | ||||||||||
| NGC3786 | x | ||||||||||
| IC751 | x | ||||||||||
| M88CT | x | ||||||||||
| IC3639CT | ✓ | ||||||||||
| NGC4785 | x | ||||||||||
| Mrk231 | x | ||||||||||
| NGC4941 | ✓ | ||||||||||
| NGC4939 | x | ||||||||||
| NGC4945CT | ✓ | ||||||||||
| MCG-03-34-064 | ✓ | ||||||||||
| NGC5135CT | ✓ | ||||||||||
| M51CT | ✓ | ||||||||||
| NGC5252 | x | ||||||||||
| NGC5283 | ✓ | ||||||||||
| NGC5347CT | ✓ | ||||||||||
| NGC5643CT | ✓ | ||||||||||
| NGC5695 | x | ||||||||||
| NGC5728 | ✓ | ||||||||||
| NGC5899 | ✓ | ||||||||||
| MCG+14-08-004 | x | ||||||||||
| ESO137-34CT | ✓ | ||||||||||
| 2MXJ1650+0436 | x | ||||||||||
| 2MXIJ1802-1454 | ✓ | ||||||||||
| 2MXJ1830+0928 | x | ||||||||||
| IC4995CT | ✓ | ||||||||||
| NGC6921 | ✓ | ||||||||||
| NGC7213 | - | x | |||||||||
| NGC7319 | ✓ | ||||||||||
| UGC12282 | ✓ | ||||||||||
| NGC7582 | ✓ | ||||||||||
| 2MXJ2325-3826 | x | ||||||||||
| NGC7674 | ✓ | ||||||||||
Tables 3 and 4 present the best-fit parameters for both the LINER and Seyfert samples when fitted to the model. Note that we present the best-fit values for this model only as the analysis is based on this model version (see above). Note that for the covering factor, , we also test whether is zero or free to vary. In the cases in which it is zero, the source is not covered, corresponding to unobscured/low-obscured sources or, on the contrary, it is reflection dominated, thus the partially-covered continuum is not restricted. We mark the column with a dash line in these cases (six sources). However, although left free to vary, in many cases it is pegged to one (42 sources), indicating full covering of the source. As for the f-test, we conclude that when it is below , the reflection component is statistically significant and is marked with the check mark symbol in this Col.(12). Among the 81 objects, we find that only NGC 424 is reflection dominated, i.e., the data do not require the addition of a power-law and the luminosity of this component is not restricted. This object is marked with an R in the Col. (1) of Table 4. The cannot be calculated for this source. Moreover, we also find 18 other sources for which the f-test comparing models and does not favour the addition of a power-law component, although their are well constrained. These objects have a large contribution of the reflection component in the CT regime, although the power-law continuum is still reachable thanks to the wide spectral range of NuSTAR data. As for intrinsic luminosities, as it was previously mentioned in section 3.2, these may be larger for CT objects as we are inducing a systematic uncertainty by excluding the Compton-scattering effect. Thus, we warn the reader that intrinsic luminosities reported here for CT objects should be treated a lower limits, even if they are well constrained by the spectral fits.
4.1 Luminosity Correction
As mentioned in Section 2 we select sources with Eddington rate to study inefficient AGN with the public data available. However, we use as a proxy of the bolometric luminosity, the observed 2-10 keV X-ray luminosity (i.e. uncorrected from ). Indeed, the intrinsic luminosity and therefore the Eddington rate are expected to increase once we take into account the . Fig. 3 shows the observed versus intrinsic 2-10 keV luminosity, the latter corrected from line-of-sight (LOS) obscuration according to the best fit reported in Tables 3 and 4.
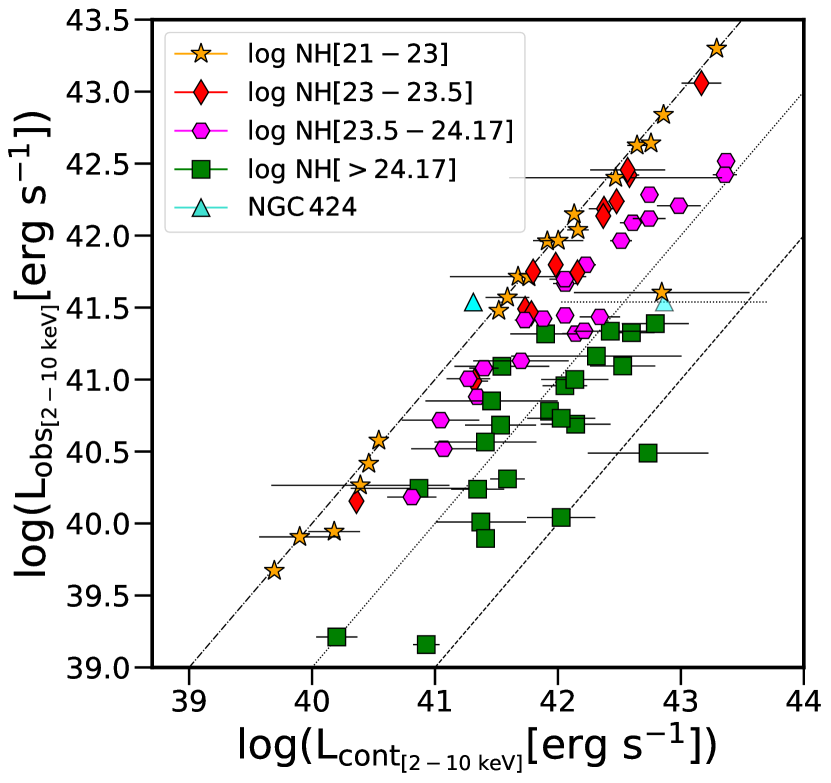
The largest shift from the 1:1 relation is found for CT objects (green squares in Fig. 3), for which the luminosity can change more than a factor of ten. Note that NGC 424, classified as reflection dominated has long been studied at X-rays (e.g., Baloković et al., 2014; Hernández-García et al., 2015; Ricci et al., 2017; Marchesi et al., 2018), finding that this object has a large contribution of the reflection component, with weak signatures of the intrinsic continuum.
However, since we are unable to account for such a component, we calculate the bolometric luminosity through the luminosity of the reflection component as follows: we assume that the correction in the intrinsic luminosity for a certain object is given in the following form: , where can be calculated through those CT objects for which the power-law is still detected in the spectra.
Moreover, by calculating the constant for these objects, we can estimate how much the intrinsic luminosity changes for a certain amount of reflection. In practice, we estimate this factor using the green objects in Fig. 3 (i.e. 25 CT AGN). We find for our sample that . We then use this value to estimate the intrinsic luminosity for NGC 424. This extrapolation can be seen as the semi-transluscent cyan triangle in Fig. 3.
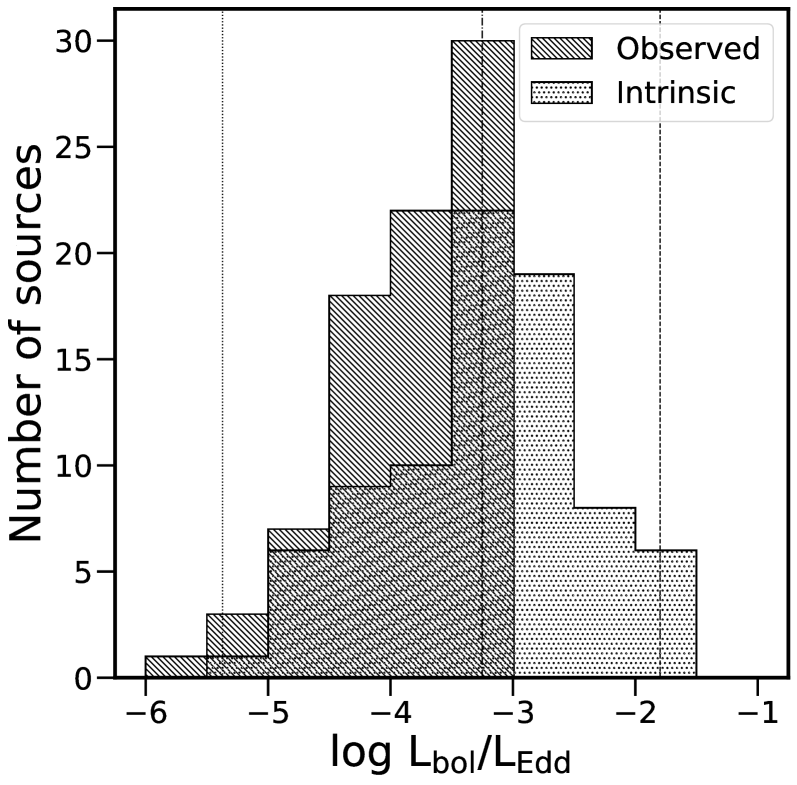
Fig. 4 shows the final distribution for the Eddington rate in our sample when the obscuration is properly taken into account, compared to the initial Eddington rate, estimated through the observed X-ray luminosity. Indeed, a shift towards greater Eddington rates is seen in objects with larger (mostly CT objects) and a decrease in objects with lower Eddington rates. The mean Eddington rate of the sample is (dash-dotted vertical line in Fig. 4) with a 1 range of (see dotted lines in the figure), roughly expanding four orders of magnitude in Eddington rate. Additionally, the lack of Compton-scattering may shift CT objects to even higher Eddington rates (as intrinsic luminosities may be even larger). As it was previously mentioned in section 2.2, we are aware that our selection criteria bias our sample towards a large LOS obscuration for Eddington rate between (14 CT AGN). Thus, we will exclude these sources from the discussion as we are missing an important portion of objects residing in this range of Eddington rates (mostly highly obscured objects with intrinsically higher Eddington rates). Moreover, the discussion will be based on the remaining 67 sources.
4.2 Existence of the reflection component
We base our analysis on the existence of the reflection component in three criteria: (1) the detection of the FeK line; (2) a statistical significance of the reflection component compared to the model without reflection (i.e. f-test when comparing models and ), and (3) the restriction of the reflection luminosity at 3– .
We detect the FeK emission line in 61 out of the 81 sources ( of the sample). On the other hand, the inclusion of a reflection component improves the spectral fit for 46 out of the 81 sources ( of the sample). Additionally, we restrict the luminosity of the reflection component for 67 out of the 81 sources (i.e. ). A total of 45 out of 81 () sources fulfill the three criteria to establish the existence of the reflection component, while 15 () meet two out of the three criteria, and 9 () meet only one of the criteria (namely M 81, NGC 3998, NGC 4102, NGC 253, 2MXJ 0114-5523, UGC 3601, 2MXJ 0756-4137, IC 751, and Mrk 231).
As for the 15 sources fulfilling two criteria, one (Mrk 1066) statistically needs the reflection component and it is well constrained. However, the emission line is not well detected at a limit. Note that the spectrum is a low-quality spectrum (dof50) which may cause a poor restriction of the three lines at 6.4, 6.7 and 6.97 keV. In order to test this possibility, we use the non-grouped spectrum of the source and check which line is present. Indeed, the line present in this object is the emission line. Once we remove both ionized lines from the fit, and calculate the EW and flux for the emission line for this source, we obtain a constrained parameter. Thus, we can safely say that this source fulfills the three criteria.
The remaining 14 objects, with two out of the three criteria, fulfill the detection of the emission line and a constrained luminosity for the reflection component. However, statistically speaking, the reflection component is not needed. Among them, all but NGC 5695 show a relatively low reflection fraction () and/or . Thus, the reflection component is present mainly through the emission line while the Compton hump is suppressed under the intrinsic continuum. Under this scenario, the f-statistic is not suitable to test the presence of the reflection component because it only affects a narrow range of the spectrum where the emission line is located. In the case of NGC 5695, it shows a relatively high . In this case, the quality of the spectrum for this source might be responsible for the statistical significance of the reflection component.
As for the objects fulfilling only one criterion, seven objects (NGC 3998, NGC 4102, 2MXJ 0114-5523, UGC 3601, 2MXJ 0756-4137, IC 751 and Mrk 231) meet the restriction of the luminosity of the reflection component, and the remaining two objects (M 81 and NGC 253) meet the detection of the emission line. The detection of the reflection component without the line can be due to a combination of high absorption which can lead to the detection of a Compton hump and a low S/N spectrum which can lead to the poor restriction of the line. The detection of the line without statistical significance for the reflection component can again be explained due to low and/or low reflection fraction as indicated above. Moreover, the non-detection of the Compton hump may also depend on the shape of the spectrum; for highly obscured sources it may only require data up to 10 keV, while for low obscured sources, the Compton hump requires high S/N up to 30 keV.
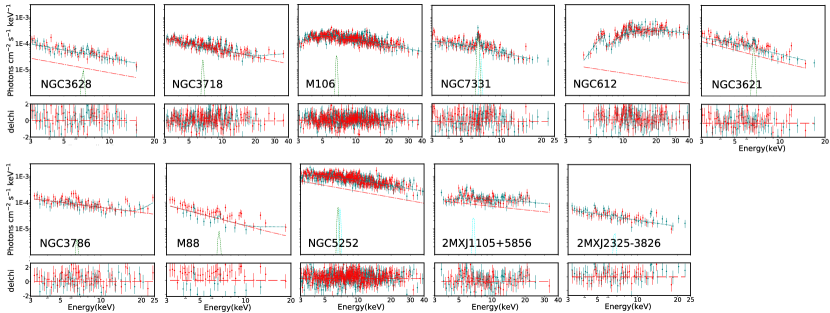
We find that 12 objects do not present any signs of reflection (namely UGC 5101, NGC 3628, NGC 3718, M 106, NGC 7331, NGC 612, 2MXJ 1105+5856, NGC 3621, NGC 3786, M 88, NGC 5252 and 2MXJ 2325-3826). Note that five out these 12 objects are LINERs while the remaining seven are Seyferts. However, several works have found traces for the reflection component in UGC 5101 (e.g., González-Martín et al., 2009; Oda et al., 2017; La Caria et al., 2019). In addition, the fact that the spectrum has a low S/N leads us to exclude it from our final sample of candidates for the disappearance of the torus. Fig. 5 shows the spectral fits for our final sample of 11 candidates to the torus disappearance (). All but NGC 612 can be modelled with a single power-law999Note that all of them present ionized emission lines. with little obscuration, supporting the idea that the reflection component is not present in these objects.
Altogether, we present 11 candidates which lack the reflection component, related to the plausible disappearance of the torus using X-rays observations. Among them, we find that eight sources have studies aiming to find the reflection component or the torus (through X-rays/mid-IR). For all of them we find complete agreement with the idea of the absence of the reflection component associated with the torus in previous works (see Sec. 5).
4.3 Reflection strength
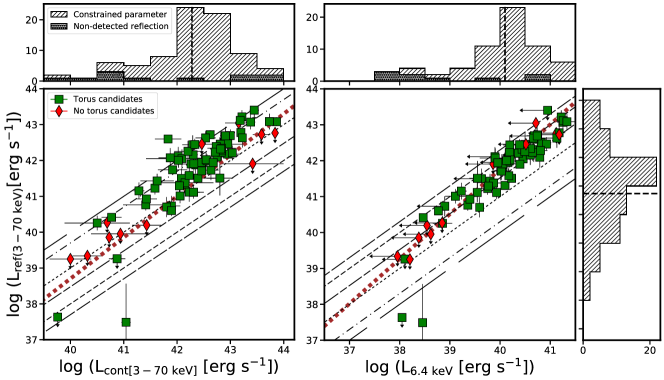
We explore here the degree of the reflection component strength for the objects in our sample. Fig. 6 shows the luminosity distribution for the intrinsic continuum (left histogram), emission line (upper right histogram) and reflection (right histogram). Note that for both the reflection and FeK line distributions, we only show those sources for which the parameter is well constrained.
The line luminosity ranges from , with a mean value of , the reflection luminosity ranges from , with a mean value of , and the intrinsic 3-70 keV luminosity ranges from , with a mean value of (see dashed lines in the histograms). Thus, all these three luminosities span around four orders of magnitude.
The reflection component represents, on average, 40% of the intrinsic continuum luminosity of the source, (i.e. 101010Note that this value is calculated for objects with both luminosities well constrained (i.e., neglecting upper/lower limits.)). In 20 out of the 81 sources the reflection is below 20% of the intrinsic continuum (i.e. ), 28 sources fall in the range , and 5 fall in the range , while the remaining 28 sources have lower limits for . On the other hand, around 50% of the sample (41 sources) is located in the area where FeK luminosity accounts for 1-3% of the reflection component luminosity, 15% (12 sources) is consistent with 3-10%, and 6% (five sources) sources present a weak line luminosity, accounting for less than 1% of the reflection component. As for the remaining 28% (23 sources), either the EW of the FeK line and/or the luminosity of the reflection component are upper limits, therefore the fraction is an upper limit as well. Naturally, the 11 candidates lacking of reflection signatures are included in this group.
In order to study the connection between these luminosities, the large panels in Fig. 6 show the correlation between the reflection luminosity versus the intrinsic continuum (left panel) and the FeK emission line (right panel) luminosities. As expected, the three quantities are well correlated. Moreover, the reflection component and the FeK emission line are slightly better correlated (with a Pearson’s coefficient of 0.93) than the intrinsic continuum and the reflection component (with a Pearson’s coefficient of 0.89).
In order to obtain the best characterization of the relation between those parameters, we use a bootstrap method to account for possible outliers in the correlations, by choosing a random subsample with 80% of the total sample and repeating this process a total of 100 times. For each random subsample, we also perform a MCMC simulation similar to that mentioned in section 3.2: for each luminosity pair, we choose a random number drawn from a normal distribution whenever the value is well constrained, and from an uniform distribution whenever there are upper/lower limits involved. We then perform a binning method in the x axis by dividing it into bins of dex, and obtain the median and standard deviation along both axes. We calculate the correlation through a linear regression method and obtain the slope, intercept, and the r- and p-values. We repeat this process 100 times and then estimate the mean values of all quantities. As for the correlation between and we also perform the linear regression analysis assuming that the luminosity of the reflection component is the independent component and the luminosity of the line is the dependent one. We present the best correlation found after performing a bisection method from both correlations. In this case the fraction of the luminosity of the FeK line over the Compton hump increases from 1% at to 5% at and to 10% at . Both correlations can be represented in the following form (represented as the thick dotted brown lines in Fig. 6):
| (6) |
| (7) |
Note that we also explore if this trend is seen over the intrinsic continuum or the Eddington rate but no correlation is found.
4.4 Obscuration
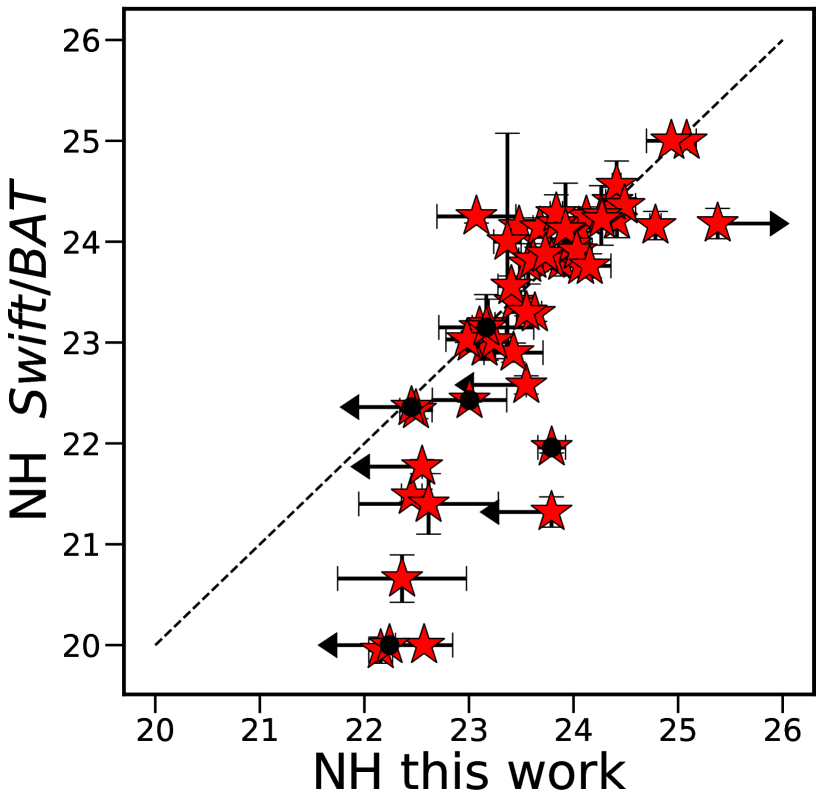
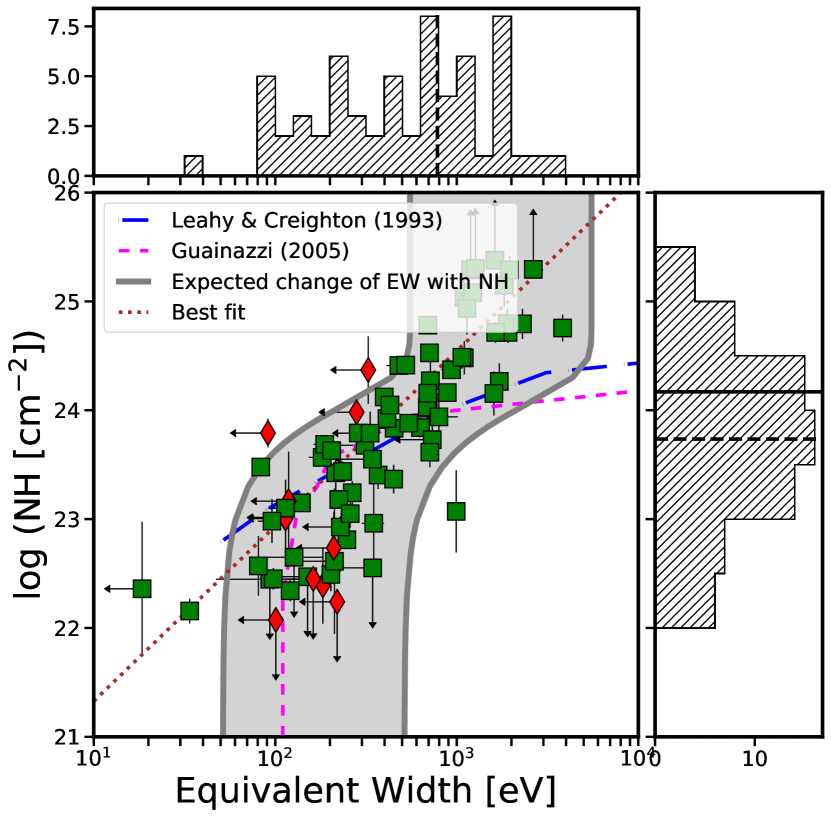
The LOS obscuration and the reflection might occur in the same structure (i.e., the torus), thus both the reflection and the obscuration may be related. Therefore, a proper estimate on the is necessary in order to place solid conclusions on the reflection component. For this purpose, Fig. 7 shows the comparison between the found in this analysis compared to those presented in Ricci et al. (2017). They analyze the X-ray properties of the Swift/BAT sample for which we find 53 sources in common. We find that for most sources, the LOS obscuration found in both works are well in agreement when their column density is . We find discrepancies for seven objects below , which may be expected since NuSTAR does not cover energies below 3 keV, necessary to constrain low values of obscuration. Moreover, Fig. 8 (right histogram) shows the distribution for our sample. We find a mean column density of (see dashed line in the figure). We also find that 24 sources are CT AGN (i.e., ) while 45 out of the 81 are Compton-thin and 12 are unobscured sources. In addition, the majority of sources with no clear indication of reflection appear to be below the CT regime. On the other hand, the EW of the line shows a mean value of (Fig. 8, top histogram), with 20 sources presenting upper limits. Using Suzaku and Swift/BAT data, Kawamuro et al. (2016) also study a sample of 10 inefficient AGN. Among the seven objects in common with our sample, three (NGC 3718, NGC 4941 and NGC 5643) show different values for (discrepancies around 10-20%). We find higher for the three sources, even when accounting for error bars. However, note that although the model is quite similar, they allow the reflection fraction in pexrav and the constant (which they relate to the scattering fraction) free to vary in all cases. The main difference is that we test whether letting the covering fraction free to vary significantly improves the fit. This might explain the differences found in both analyses.
Marchesi et al. (2018) analyze a sample of 26 sources classified as CT, using NuSTAR along with other X-ray facilities. Among those objects, we find 14 sources in common with our work, from which 10 have similar value of compared to ours, while three have small discrepancies on the (i.e. lower than 10%), and one case (NGC 424) for which we have strong differences: they report a reflection dominated source, with , while from our analysis it should be considered as highly obscured (). Indeed, this source is also reflection dominated according to our f-test analysis. Thus, statistically speaking, the obscured power-law associated with the intrinsic continuum is not required by the data. Moreover, their reflection model is different to ours, which might be responsible for the small changes in the spectral parameters.
Panagiotou and Walter (2019) also studied six sources in common with this work (M 106, NGC 1194, NGC 4941, NGC 5643, NGC 5728, and NGC 7582). All but two (NGC 4941 (24.090.15) and NGC 1194 (23.70.1) present consistent values. NGC 4941 and NGC 1194 present higher compared to ours, even when accounting for error bars. Again, they classify these two sources as reflection dominated so this might be affecting the constraint of the LOS absorption due to a weak detection of the instrinsic continuum. In a second paper of the series, Panagiotou and Walter (2020) include NuSTAR data for other six sources in common with our analysis (NGC 1052, NGC 2655, M 106, NGC 5252, NGC 5283 and NGC 7213), also showing consistent . Note that Panagiotou and Walter (2020) exclude in their sample selection 21 sources in common with our sample; four (M 81, NGC 3998, NGC 7130, and NGC 7479) are excluded due to their LINER nature, two (IC 751 and NGC 7582) due to variability, and the remaining 15 are excluded for being reflection dominated (although included in Panagiotou and Walter, 2019).
We plot the expected correlation between the and the emission line in the large panel of Fig. 8. The equivalent width increases when the does so, with a Pearson’s linear relation coefficient of 0.85 (linear fit shown as dotted brown line in the figure). This is well explained by the predicted EW from a uniform shell of material encompassing the continuum source (blue long-dashed line in large panel of Fig. 8, see also Fig. 2 in Leahy and Creighton, 1993) . Moreover, Guainazzi, Matt, and Perola (2005) propose a slight change in this correlation when the reflection occurs in the inner walls of an optically-thick matter, as seen through the unobscured LOS, while the continuum is obscured by material along the LOS (see pink dashed line in Fig. 8 and Fig. 9 in Guainazzi, Matt, and Perola, 2005). Note that the dispersion on this relation is naturally explained through the differences in geometry and composition of the reflector. Therefore, this reinforces the good estimate on the in our analysis. This is also reproduced in more recent models with spherical and torus-like geometries (e.g Ikeda, Awaki, and Terashima, 2009; Tanimoto et al., 2019) Moreover, we explore how the EW is affected by the amount of obscuration and the strength of the line (see shaded area in Fig. 8). We choose NGC 1052 as a test object and vary the normalization of the FeK line (from to ), from left to right, respectively, while changing the in order to see how the relation should change. We find that there is a value of above which this correlation saturates and thus we would only measure reflection (i.e., in the cases of reflection dominated sources). The main reason for the differences between this work and Guainazzi, Matt, and Perola (2005) is the fact that they do not have very obscured sources in their sample and thus their best fit does not cover such range. Thus, we confirm that 69 out of the 81 objects () are obscured at X-rays (i.e. ). This is further discussed in Section 5.
Furthermore, more than half of the sources (42) appear to be completely covered, 27 present a covering factor , while seven show . The remaining five AGN present either upper limits or non-constrained estimates for the covering factor. Among these objects, all of them present either low or upper limits whereas the sources presenting full covering, also present high obscuration (with only 6 sources being mildly obscured).
5 Discussion
The aim of this work is to study the behaviour of the reflection component and obscuration at X-rays (classically associated with the torus) at low accretion rates. In order to trace such a component, we selected a sample of 81 sources with NuSTAR observations among all the nearby AGN observed so far with available measurements. We performed a spectral analysis with a model that accounts for the reflection component from neutral material plus a partially absorbed intrinsic continuum.
Early X-ray observations of local AGN have served as observational proofs of the AGN unified theories, showing that most type-1 AGN are unobscured while type-2 AGN tend to show obscuration exceeding (Awaki et al., 1991; Bassani et al., 1999). However, since then, several authors have shown that the fraction of obscured sources might depend on the evolutionary stage of the sources (see Ramos Almeida and Ricci, 2017, for a review).
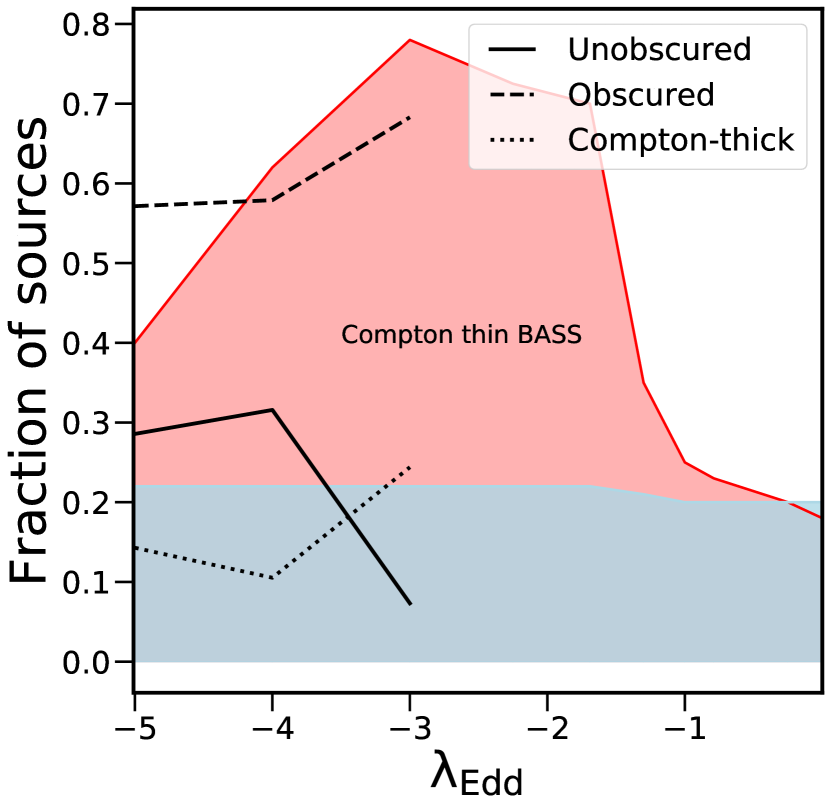
The covering factor of the gas can be estimated studying the absorption properties of large samples of AGN. In Fig. 9 we compare the results found by Ricci et al. (2017) using the BASS sample and those found in this study (numbers are reported in Table 5). Using this technique, recent hard X-ray studies have shown that the fraction of CT sources below is (blue shaded area in Fig. 9). Marchesi et al. (2018) find that the fraction of CT sources decreases when using NuSTAR data thanks to a better covering and sensitivity above 10 keV which allows a better restriction in the LOS obscuration affecting the intrinsic continuum.
Our results indicate that the fraction of CT sources at is (dotted line), while Ricci et al. (2017) find it to be . Thus, our results are statistically in agreement with them. Meanwhile, Ricci et al. (2017) find that the peak of obscured sources happens around , rising from 20% to 80% at Eddington rates and , respectively (see red shaded area in Fig. 9, see also Ricci et al., 2017). Interestingly, our sample agrees well with these numbers at for the percentage of obscured AGN (dashed line in Fig. 9). Note that our results indicate a low population of unobscured sources at . Moreover, a slight decrease on the fraction of Compton-thin obscured sources is found below , reaching 60% at . Correspondingly, the fraction of unobscured sources rises from at to % at . Nonetheless, we are aware that this may be due to a bias in the selection criteria. Indeed, if there were more unobscured sources at these Eddington rates, they should have been included in our sample. However, we select only those sources with archival data and a minimum S/N in the spectrum. This has two main consequences: i) there may be several objects which have not yet been observed, among which there might be unobscured sources. ii) there might be more obscured sources for which the flux is so low that they do not fulfill our S/N criteria. Thus, although our results are in agreement with the complete sample by Ricci et al. (2017), we warn the reader that our sample is incomplete.
The trend found in this analysis might suggest no obscuration for a large fraction of sources at even lower accretion rates. The scenario in which both the BLR and the torus can be seen as different regions from a wind coming off the disk has long been proposed (Elvis, 2000) and it naturally includes the absence of such regions in some objects (e.g., True-type 2 AGN intrinsically miss the BLR Tran, 2001; Laor, 2003; Panessa et al., 2006). If the accretion disk cannot expel material in an efficient way, then the gravitational force from the SMBH will overcome the radiation pressure from the wind, causing the wind, and therefore the BLR and the torus, to collapse (Elitzur and Shlosman, 2006). Therefore, as a first approach, the condition for the torus disappearance can be related to the bolometric luminosity of the source and the accretion rate. According to Elitzur and Shlosman (2006), the BLR should disappear for low-luminosity AGN (i.e., ). Six out of the 11 objects lacking reflection signatures in our sample are below this threshold. However, in a more recent study it has been shown that this structure can disappear even for bright sources (e.g. Elitzur and Netzer, 2016), depending on the properties of the wind, such as the wind efficiency or the number/density of clouds. In fact, it requires a minimal column density, implying a minimal outflow rate and thus a minimal accretion rate. Interestingly, three of our candidates present upper limits on the and other five show . Finally, three are rather obscured (namely M 106, NGC 612 and M 88). In particular, for M 106, Kawamuro et al. (2016) find that the line is variable, proposing it might be originated in the accretion disk, while in the case of NGC 612, Ursini et al. (2018) do not find strong features of a Compton-reflection component, although like us, they find that this source presents high absorption, proposing that it might originate in an extended structure rather than the pc-scale torus. Thus, these works are still in agreement with the lack of reflection originated in the torus. Another particularly interesting object is M 88, being proposed as a True-Type 2 AGN (i.e., intrinsically missing the BLR, Brightman and Nandra, 2008). We would expect for this object to be low-obscured. Although we modelled this source with an obscured component, the quality of the observations111111The spectra of M 88 show calibration issues clearly visible in Fig. 5 and resulting in a calibration factor much larger than for the rest of the sample, with a value of . may prevent us from finding a reliable value in the for this particular source. Thus, almost all our candidates to the torus disappearance are on the lower end of LOS obscuration (Fig. 8).
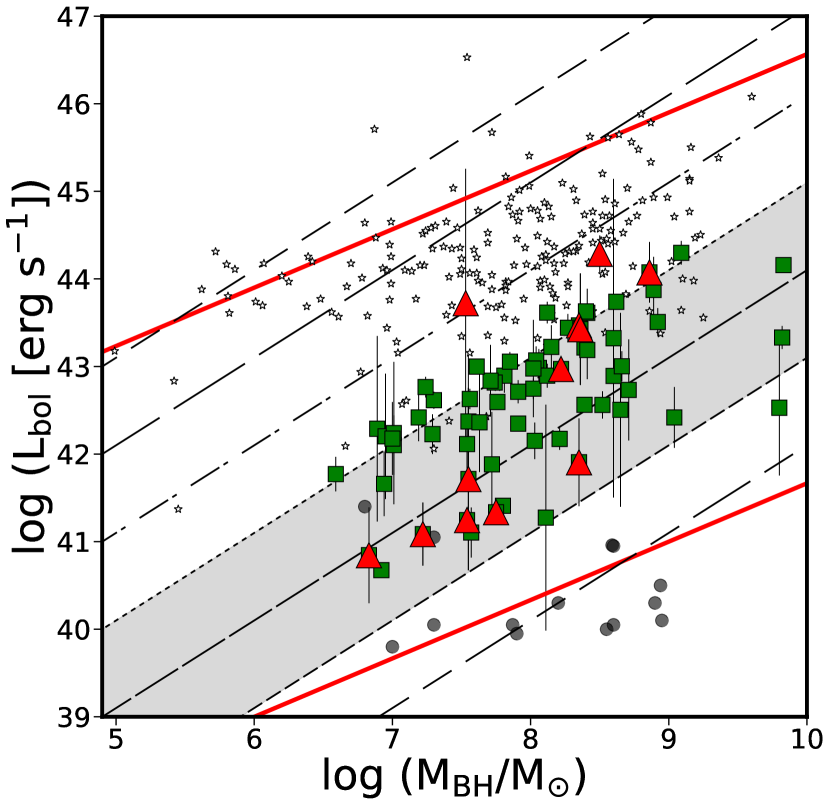
According to Elitzur and Netzer (2016), the BLR/torus may or may not exist in a delimited zone in the luminosity- diagram and both components should disappear under a certain threshold delimited by the wind parameters. Fig. 10 shows the bolometric luminosity versus diagram for our sample (large symbols), excluding the sources for which Note that although these sources are mostly CT at this Eddington rate, it is difficult to asses how many sources we may be missing due to the selection biases we have imposed and to the available data.
As a comparison sample, we also plot data from the Swift/BAT sample (Koss et al., 2017, plotted as the small star symbols). We selected sources from that sample such that they had some estimate on the , with reported values for the intrinsic 2-10 keV luminosity, to obtain the bolometric luminosity and LOS obscuration. We discarded sources without constrained values and we also neglect the sources in common. We obtained a total of 195 sources for the comparison sample. Note that all our sources fall within the region in which the BLR/torus may or may not exist (red lines), according to Elitzur and Netzer (2016). We also plot with red triangles our 11 candidates for the torus disappearance. The location of our candidates is in complete agreement with the idea that the torus disappearance does not rely solely on the bolometric luminosity of the source, yet, it does disappear for inefficient sources. Moreover, González-Martín et al. (2017) study a sample of AGN using mid-IR spectra trying to understand the behaviour of the torus in what is called the gradual resizing. We plot in Fig. 10 (gray circles) their candidates for the disappearance of the torus from a mid-IR point of view. Unlike us, they do have objects lacking the torus below the limit proposed by Elitzur and Netzer (2016), at depending on the . However, they also found several candidates in the range between . Our study complements theirs by the inclusion of these 11 new candidates to the torus disappearance; all together a sample of 25 AGN. Indeed, we may also be missing objects with , either because observations for such low-luminosity objects have not yet been performed, or because the S/N of the observations are so low that they do not fulfill our selection criteria. Moreover, highly obscured objects might be missing because they are more difficult to detect than unobscured objects.
| (total) | Unobs. | Obs | CT | No ref. |
|---|---|---|---|---|
| # (%) | # (%) | # (%) | # (%) | |
| (1) | (2) | (3) (4) | (5) | |
| -5 (7) | 2 (28) | 4 (57) | 1 (14) | 2 (28) |
| -4 (19) | 6 (31) | 11 (58) | 2 (10) | 4 (21) |
| -3 (41) | 3 (7) | 28 (68) | 10 (24) | 3 (7) |
Another interesting result on the obscurer behaviour is the increase on the narrow FeK line luminosity compared to the reflection luminosity when the reflection luminosity decreases (Fig. 6, large right panel). This is present when we compare the reflection luminosity with the intrinsic luminosity, showing a mean contribution of 40% of reflection for the full range of the intrinsic luminosity (Fig. 6, large left panel). However, the FeK line and reflection component changes are not associated with the accretion rate, because no correlation is found between the accretion rate and the luminosity of the reflection component or the FeK line. Although the flux of the narrow FeK line (compared to the intrinsic X-ray flux) is generally weaker in type-2 AGN than in type-1 AGN for the same 10-50 keV continuum luminosity (Ricci et al., 2014), this is not reproduced by the low accretion AGN in our sample. Ricci et al. (2014) suggest that this difference can be explained by means of different average inclination angles with respect to the torus, as predicted by the unified model. However, our sample is mostly constituted by type-2 AGN which might explain why we do not find such behaviour. While the FeK line can be produced by material with column densities as low as , the Compton hump can only be created by the reprocessing of X-ray photons in CT material. Thus, the increase on the fraction of FeK line luminosity compared to the Compton hump luminosity toward low reflection luminosities might be an indication of a higher fraction of the emission produced in Compton-thin material associated with the accretion disk. If the accretion disk contribution is responsible for this behaviour, we might expect differences on the photon index distributions that might contribute to the Compton hump and or the FeK line differently as long as the reflection luminosity decreases. For instance, it is expected for the photon index of standard disks to be larger for higher intrinsic luminosities (softer-when-brighter), while it is expected to decrease with increasing luminosity in radiatively inefficient accretion disks (harder-when-brighter, Narayan and Yi, 1995; Connolly et al., 2016, and references therein).
However, the mean of the distribution of the photon index () is similar to the average photon index found in diverse AGN samples (e.g. Swift/BAT, Koss et al., 2017), and we do not find any particular trend on the accretion disk that might explain this behaviour found in the strength of the line. Another alternative is a smooth transition on the average iron abundances of the X-ray reflector (i.e. torus, Ricci et al., 2014). This might imply a smooth transition on the chemistry of the torus as seen at X-rays as long as the torus luminosity decreases traced by the Compton hump. In favor, González-Martín et al. (2017) also find that a group of objects with a low contribution from the torus, are not well described with the clumpy torus model at mid-IR. They suggest that this might imply that the torus chemistry may be different at low luminosities, consistent with these findings.
6 Summary and conclusions
We have performed an analysis aimed to find the conditions for the change and plausible disappearance of the obscuring gas for low-accretion AGN. For that purpose, we used a sample of 81 sources observed with NuSTAR selected by having Eddington rates . We fitted the data with a model accounting for a patchy absorber and a reflection component from neutral material. We found that of our sample is obscured, with of CT sources, in agreement with several works (e.g. Ricci et al., 2017; Marchesi et al., 2018).
In order to directly compare the lack of reflection component with those sources lacking of the torus at mid-IR wavelengths, fainter X-ray sources, with luminosities are required. However, we found that a small number of sources in our sample (15%) seem to lack the reflection component associated with the torus, while the rest of the sources are found to have reflection features such as the existence of the line and/or the reflection hump. The sources lacking of reflection component features are located in the region where the torus may or may not disappear according to their and bolometric luminosities. When the reflection component was detected, it accounts for of the luminosity of the intrinsic continuum. We also found tentative evidence in favour of an increase of unobscured sources and a change of the reflector chemistry toward . Our findings are in agreement with the scenario in which as the AGN becomes less efficient, the torus is not supported by the radiation field from the wind coming off the accretion disk and fades. As a final remark, we highlight the importance of better S/N data and a broader energy coverage in order to apply more complex models for the reflection component, which includes testing if it may also be produced in the accretion disk (i.e., ionized reflection), but also testing different geometries and matter distributions (i.e, homogeneous, clumpy, etc).
Acknowledgements
We thank the anonymous referee for her/his useful comments which greatly improved this paper. This research has made use of the NASA/IPAC Extragalactic Database (NED), which is operated by the Jet Propulsion Laboratory, California Institute of Technology, under contract with the National Aeronautics and Space Administration. This research has made use of data and/or software provided by the High Energy Astrophysics Science Archive Research Center (HEASARC), which is a service of the Astrophysics Science Division at NASA/GSFC and the High Energy Astrophysics Division of the Smithsonian Astrophysical Observatory. NOC would like to thank CONACyT scholarship No. 897887. CVC acknowledges support from CONACyT. We thank the UNAM PAPIIT project IN105720 (PI OGM). LHG acknowledges funds by ANID – Millennium Science Initiative Program – ICN12009 awarded to the Millennium Institute of Astrophysics (MAS).
Data Availability
The data underlying this article are available in at https://heasarc.gsfc.nasa.gov/. The datasets were derived from sources in the public domain.
References
- Annuar et al. (2015) Annuar, A., Gandhi, P., Alexander, D.M., Lansbury, G.B., Arévalo, P., Ballantyne, D.R., and, …: 2015, The Astrophysical Journal 815, 36.
- Annuar et al. (2017) Annuar, A., Alexander, D.M., Gandhi, P., Lansbury, G.B., Asmus, D., Ballantyne, D.R., and, …: 2017, The Astrophysical Journal 836, 165.
- Annuar et al. (2020) Annuar, A., Alexander, D.M., Gandhi, P., Lansbury, G.B., Asmus, D., Baloković, M., and, …: 2020, Monthly Notices of the Royal Astronomical Society 497, 229. doi:10.1093/mnras/staa1820.
- Antonucci (1993) Antonucci, R.: 1993, Annual Review of Astronomy and Astrophysics 31, 473. doi:10.1146/annurev.aa.31.090193.002353.
- Awaki et al. (1991) Awaki, H., Koyama, K., Inoue, H., and Halpern, J.P.: 1991, Publications of the Astronomical Society of Japan 43, 195.
- Baloković et al. (2014) Baloković, M., Comastri, A., Harrison, F.A., Alexander, D.M., Ballantyne, D.R., Bauer, F.E., and, …: 2014, The Astrophysical Journal 794, 111. doi:10.1088/0004-637X/794/2/111.
- Baloković et al. (2018) Baloković, M., Brightman, M., Harrison, F.A., Comastri, A., Ricci, C., Buchner, J., and, …: 2018, The Astrophysical Journal 854, 42.
- Baloković et al. (2020) Baloković, M., Harrison, F.A., Madejski, G., Comastri, A., Ricci, C., Annuar, A., and, …: 2020, The Astrophysical Journal 905, 41. doi:10.3847/1538-4357/abc342.
- Bär et al. (2019) Bär, R.E., Trakhtenbrot, B., Oh, K., Koss, M.J., Wong, O.I., Ricci, C., and, …: 2019, Monthly Notices of the Royal Astronomical Society 489, 3073.
- Bassani et al. (1999) Bassani, L., Dadina, M., Maiolino, R., Salvati, M., Risaliti, G., Della Ceca, R., and, …: 1999, The Astrophysical Journal Supplement Series 121, 473. doi:10.1086/313202.
- Brightman and Nandra (2008) Brightman, M. and Nandra, K.: 2008, Monthly Notices of the Royal Astronomical Society 390, 1241. doi:10.1111/j.1365-2966.2008.13841.x.
- Brightman et al. (2015) Brightman, M., Baloković, M., Stern, D., Arévalo, P., Ballantyne, D.R., Bauer, F.E., and, …: 2015, The Astrophysical Journal 805, 41. doi:10.1088/0004-637X/805/1/41.
- Connolly et al. (2016) Connolly, S. D., McHardy, I. M., Skipper, C. J., & Emmanoulopoulos, D. 2016, MNRAS, 459, 3963
- Constantin et al. (2009) Constantin, A., Green, P., Aldcroft, T., et al. 2009, ApJ, 705, 1336
- Dauser et al. (2014) Dauser, T., Garcia, J., Parker, M.L., Fabian, A.C., and Wilms, J.: 2014, Monthly Notices of the Royal Astronomical Society 444, L100.
- de Jong et al. (2015) de Jong, S., Beckmann, V., Soldi, S., Tramacere, A., and Gros, A.: 2015, Monthly Notices of the Royal Astronomical Society 450, 4333. doi:10.1093/mnras/stv927.
- Elitzur and Shlosman (2006) Elitzur, M., and Shlosman, I.: 2006, The Astrophysical Journal 648, L101.
- Elitzur and Ho (2009) Elitzur, M., and Ho, L.C.: 2009, The Astrophysical Journal 701, L91.
- Elitzur and Netzer (2016) Elitzur, M. and Netzer, H.: 2016, Monthly Notices of the Royal Astronomical Society 459, 585.
- Elvis (2000) Elvis, M.: 2000, The Astrophysical Journal 545, 63. doi:10.1086/317778.
- Esparza-Arredondo et al. (2019) Esparza-Arredondo, D., González-Martín, O., Dultzin, D., Ramos Almeida, C., Fritz, J., Masegosa, J., and, …: 2019, The Astrophysical Journal 886, 125. doi:10.3847/1538-4357/ab4ced.
- Esparza-Arredondo et al. (2021) Esparza-Arredondo, D., Gonzalez-Martín, O., Dultzin, D., Masegosa, J., Ramos-Almeida, C., García-Bernete, I., and, …: 2021, Astronomy and Astrophysics 651, A91. doi:10.1051/0004-6361/202040043.
- Ezhikode et al. (2020) Ezhikode, S.H., Dewangan, G.C., Misra, R., and Philip, N.S.: 2020, Monthly Notices of the Royal Astronomical Society 495, 3373.
- Gebhardt et al. (2000) Gebhardt, K., Bender, R., Bower, G., Dressler, A., Faber, S.M., Filippenko, A.V., and, …: 2000, The Astrophysical Journal 539, L13.
- Ferrarese and Merritt (2000) Ferrarese, L. and Merritt, D.: 2000, The Astrophysical Journal 539, L9.
- Furui et al. (2016) Furui, S., Fukazawa, Y., Odaka, H., Kawaguchi, T., Ohno, M., and Hayashi, K.: 2016, The Astrophysical Journal 818, 164.
- González-Martín et al. (2009) González-Martín, O., Masegosa, J., Márquez, I., Guainazzi, M., and Jiménez-Bailón, E.: 2009, Astronomy and Astrophysics 506, 1107.
- González-Martín et al. (2015) González-Martín, O., Masegosa, J., Márquez, I., Rodríguez-Espinosa, J.M., Acosta-Pulido, J.A., Ramos Almeida, C., and, …: 2015, Astronomy and Astrophysics 578, A74. doi:10.1051/0004-6361/201425254.
- González-Martín et al. (2017) González-Martín, O., Masegosa, J., Hernán-Caballero, A., Márquez, I., Ramos Almeida, C., Alonso-Herrero, A., Aretxaga, I., Rodríguez-Espinosa, J.M., Acosta-Pulido, J.A., Hernández-García, L., Esparza-Arredondo, D., Martínez-Paredes, M., Bonfini, P., and, …: 2017, The Astrophysical Journal 841, 37.
- Gu & Cao (2009) Gu, M., & Cao, X. 2009, MNRAS, 399, 349
- Guainazzi, Matt, and Perola (2005) Guainazzi, M., Matt, G., and Perola, G.C.: 2005, Astronomy and Astrophysics 444, 119. doi:10.1051/0004-6361:20053643.
- Gültekin et al. (2012) Gültekin, K., Cackett, E. M., Miller, J. M., et al. 2012, ApJ, 749, 129
- Hardcastle et al. (2003) Hardcastle, M.J., Worrall, D.M., Kraft, R.P., Forman, W.R., Jones, C., and Murray, S.S.: 2003, The Astrophysical Journal 593, 169. doi:10.1086/376519.
- Harrison et al. (2013) Harrison, F.A., Craig, W.W., Christensen, F.E., Hailey, C.J., Zhang, W.W., Boggs, S.E., and, …: 2013, The Astrophysical Journal 770, 103. doi:10.1088/0004-637X/770/2/103.
- Hernández-García et al. (2015) Hernández-García, L., Masegosa, J., González-Martín, O., and Márquez, I.: 2015, Astronomy and Astrophysics 579, A90. doi:10.1051/0004-6361/201526127.
- Hernández-García et al. (2016) Hernández-García, L., Masegosa, J., González-Martín, O., Márquez, I., and Perea, J.: 2016, The Astrophysical Journal 824, 7. doi:10.3847/0004-637X/824/1/7.
- Ikeda, Awaki, and Terashima (2009) Ikeda, S., Awaki, H., and Terashima, Y.: 2009, The Astrophysical Journal 692, 608. doi:10.1088/0004-637X/692/1/608.
- Jang et al. (2014) Jang, I., Gliozzi, M., Hughes, C., & Titarchuk, L. 2014, MNRAS, 443, 72
- Kalberla et al. (2005) Kalberla, P.M.W., Burton, W.B., Hartmann, D., Arnal, E.M., Bajaja, E., Morras, R., and Poeppel, W.G.L.: 2005, VizieR Online Data Catalog , VIII/76.
- Kang, Wang, and Kang (2020) Kang, J., Wang, J., and Kang, W.: 2020, The Astrophysical Journal 901, 111. doi:10.3847/1538-4357/abadf5.
- Kawamuro et al. (2016) Kawamuro, T., Ueda, Y., Tazaki, F., Terashima, Y., and Mushotzky, R.: 2016, The Astrophysical Journal 831, 37.
- Arnaud (1996) Arnaud, K.A.: 1996, Astronomical Data Analysis Software and Systems V 101, 17.
- Khim and Yi (2017) Khim, H. and Yi, S.K.: 2017, The Astrophysical Journal 846, 155.
- Khorunzhev et al. (2012) Khorunzhev, G.A., Sazonov, S.Y., Burenin, R.A., and Tkachenko, A.Y.: 2012, Astronomy Letters 38, 475.
- Koss et al. (2017) Koss, M., Trakhtenbrot, B., Ricci, C., Lamperti, I., Oh, K., Berney, S., Schawinski, K., Baloković, M., Baronchelli, L., Crenshaw, D.M., Fischer, T., Gehrels, N., Harrison, F., and, …: 2017, The Astrophysical Journal 850, 74.
- La Caria et al. (2019) La Caria, M.-M., Vignali, C., Lanzuisi, G., Gruppioni, C., and Pozzi, F.: 2019, Monthly Notices of the Royal Astronomical Society 487, 1662. doi:10.1093/mnras/stz1381.
- Laor (2001) Laor, A.: 2001, The Astrophysical Journal 553, 677.
- Laor (2003) Laor, A.: 2003, The Astrophysical Journal 590, 86.
- Leahy and Creighton (1993) Leahy, D.A. and Creighton, J.: 1993, Monthly Notices of the Royal Astronomical Society 263, 314. doi:10.1093/mnras/263.2.314.
- Liu and Li (2014) Liu, Y. and Li, X.: 2014, The Astrophysical Journal 787, 52. doi:10.1088/0004-637X/787/1/52.
- Magdziarz and Zdziarski (1995) Magdziarz, P., and Zdziarski, A.A.: 1995, Monthly Notices of the Royal Astronomical Society 273, 837.
- Marchesi et al. (2018) Marchesi, S., Ajello, M., Marcotulli, L., Comastri, A., Lanzuisi, G., and Vignali, C.: 2018, The Astrophysical Journal 854, 49. doi:10.3847/1538-4357/aaa410.
- Marchesi et al. (2019) Marchesi, S., Ajello, M., Zhao, X., Marcotulli, L., Baloković, M., Brightman, M., and, …: 2019, The Astrophysical Journal 872, 8. doi:10.3847/1538-4357/aafbeb.
- Marconi et al. (2004) Marconi, A., Risaliti, G., Gilli, R., Hunt, L.K., Maiolino, R., and Salvati, M.: 2004, Monthly Notices of the Royal Astronomical Society 351, 169.
- Matt, Guainazzi, and Maiolino (2003) Matt, G., Guainazzi, M., and Maiolino, R.: 2003, Monthly Notices of the Royal Astronomical Society 342, 422.
- McKernan, Ford, and Reynolds (2010) McKernan, B., Ford, K.E.S., and Reynolds, C.S.: 2010, Monthly Notices of the Royal Astronomical Society 407, 2399.
- Merloni et al. (2014) Merloni, A., Bongiorno, A., Brusa, M., Iwasawa, K., Mainieri, V., Magnelli, B., and, …: 2014, Monthly Notices of the Royal Astronomical Society 437, 3550. doi:10.1093/mnras/stt2149.
- Molina et al. (2019) Molina, M., Malizia, A., Bassani, L., Ursini, F., Bazzano, A., and Ubertini, P.: 2019, Monthly Notices of the Royal Astronomical Society 484, 2735.
- Murphy and Yaqoob (2009) Murphy, K.D. and Yaqoob, T.: 2009, Monthly Notices of the Royal Astronomical Society 397, 1549. doi:10.1111/j.1365-2966.2009.15025.x.
- Nandra et al. (2007) Nandra, K., O’Neill, P.M., George, I.M., and Reeves, J.N.: 2007, Monthly Notices of the Royal Astronomical Society 382, 194.
- Narayan and Yi (1995) Narayan, R. and Yi, I.: 1995, The Astrophysical Journal 452, 710. doi:10.1086/176343.
- Nemmen, Storchi-Bergmann, and Eracleous (2014) Nemmen, R.S., Storchi-Bergmann, T., and Eracleous, M.: 2014, Monthly Notices of the Royal Astronomical Society 438, 2804. doi:10.1093/mnras/stt2388.
- Netzer (2015) Netzer, H.: 2015, Annual Review of Astronomy and Astrophysics 53, 365.
- Oda et al. (2017) Oda, S., Tanimoto, A., Ueda, Y., Imanishi, M., Terashima, Y., and Ricci, C.: 2017, The Astrophysical Journal 835, 179. doi:10.3847/1538-4357/835/2/179.
- Panagiotou and Walter (2019) Panagiotou, C. and Walter, R.: 2019, Astronomy and Astrophysics 626, A40.
- Panagiotou and Walter (2020) Panagiotou, C. and Walter, R.: 2020, Astronomy and Astrophysics 640, A31. doi:10.1051/0004-6361/201937390.
- Panessa et al. (2006) Panessa, F., Bassani, L., Cappi, M., Dadina, M., Barcons, X., Carrera, F.J., Ho, L.C., and Iwasawa, K.: 2006, Astronomy and Astrophysics 455, 173.
- Peterson (1997) Peterson, B. M. 1997, An introduction to active galactic nuclei, Publisher: Cambridge, New York Cambridge University Press, 1997 Physical description xvi, 238 p. ISBN 0521473489,
- Ramos Almeida et al. (2009) Ramos Almeida, C., Levenson, N.A., Rodríguez Espinosa, J.M., Alonso-Herrero, A., Asensio Ramos, A., Radomski, J.T., and, …: 2009, The Astrophysical Journal 702, 1127.
- Ramos Almeida and Ricci (2017) Ramos Almeida, C. and Ricci, C.: 2017, Nature Astronomy 1, 679.
- Ricci et al. (2011) Ricci, C., Walter, R., Courvoisier, T.J.-L., and Paltani, S.: 2011, Astronomy and Astrophysics 532, A102.
- Ricci et al. (2014) Ricci, C., Ueda, Y., Paltani, S., Ichikawa, K., Gandhi, P., and Awaki, H.: 2014, Monthly Notices of the Royal Astronomical Society 441, 3622. doi:10.1093/mnras/stu735.
- Ricci et al. (2015) Ricci, C., Ueda, Y., Koss, M.J., Trakhtenbrot, B., Bauer, F.E., and Gandhi, P.: 2015, The Astrophysical Journal 815, L13. doi:10.1088/2041-8205/815/1/L13.
- Ricci et al. (2017) Ricci, C., Trakhtenbrot, B., Koss, M.J., Ueda, Y., Schawinski, K., Oh, K., and, …: 2017, Nature 549, 488. doi:10.1038/nature23906.
- Shakura and Sunyaev (1973) Shakura, N.I. and Sunyaev, R.A.: 1973, Astronomy and Astrophysics 500, 33.
- Tadhunter and Tsvetanov (1989) Tadhunter, C. and Tsvetanov, Z.: 1989, Nature 341, 422. doi:10.1038/341422a0.
- Tanimoto et al. (2018) Tanimoto, A., Ueda, Y., Kawamuro, T., Ricci, C., Awaki, H., and Terashima, Y.: 2018, The Astrophysical Journal 853, 146. doi:10.3847/1538-4357/aaa47c.
- Tanimoto et al. (2019) Tanimoto, A., Ueda, Y., Odaka, H., Kawaguchi, T., Fukazawa, Y., and Kawamuro, T.: 2019, The Astrophysical Journal 877, 95. doi:10.3847/1538-4357/ab1b20.
- Tanimoto et al. (2020) Tanimoto, A., Ueda, Y., Odaka, H., Ogawa, S., Yamada, S., Kawaguchi, T., and, …: 2020, The Astrophysical Journal 897, 2. doi:10.3847/1538-4357/ab96bc.
- Tran (2001) Tran, H.D.: 2001, The Astrophysical Journal 554, L19. doi:10.1086/320926.
- Urry & Padovani (1995) Urry, C. M., & Padovani, P. 1995, PASP, 107, 803
- van den Bosch et al. (2015) van den Bosch, R.C.E., Gebhardt, K., Gültekin, K., Yıldırım, A., and Walsh, J.L.: 2015, The Astrophysical Journal Supplement Series 218, 10.
- Ursini et al. (2018) Ursini, F., Bassani, L., Panessa, F., Bazzano, A., Bird, A.J., Malizia, A., and, …: 2018, Monthly Notices of the Royal Astronomical Society 474, 5684. doi:10.1093/mnras/stx3159.
- van den Bosch (2016) van den Bosch, R.C.E.: 2016, The Astrophysical Journal 831, 134.
- Vasudevan and Fabian (2009) Vasudevan, R.V. and Fabian, A.C.: 2009, Monthly Notices of the Royal Astronomical Society 392, 1124.
- Woo and Urry (2002) Woo, J.-H., and Urry, C.M.: 2002, The Astrophysical Journal 581, L5.
- Younes et al. (2011) Younes, G., Porquet, D., Sabra, B., & Reeves, J. N. 2011, A&A, 530, A149
- Younes et al. (2019) Younes, G., Ptak, A., Ho, L.C., Xie, F.-G., Terasima, Y., Yuan, F., and, …: 2019, The Astrophysical Journal 870, 73.
- Zhao et al. (2019) Zhao, X., Marchesi, S., Ajello, M., Marcotulli, L., Cusumano, G., La Parola, V., and, …: 2019, The Astrophysical Journal 870, 60. doi:10.3847/1538-4357/aaf1a0.
Appendix A Modeling with CABS
We use a model which does not account for the Compton scattering, particularly important for Compton-thick objects (Annuar et al., 2017; Ricci et al., 2017; Zhao et al., 2019; Marchesi et al., 2019). xspec has a model to account for Compton scattering called cabs121212see xspec manual https://heasarc.gsfc.nasa.gov/xanadu/xspec/manual/XspecManual.html . This model component has been reported to present some issues (see e.g. mytorus manual and Tanimoto et al., 2018), and does not emulate properly the X-ray spectra of AGN. However, cabs has been used in several recent works to account for Compton scattering in AGN when using NuSTAR data (see Ricci et al., 2017; Oda et al., 2017; Tanimoto et al., 2020). In practice, we added the cabs component to the model in Eq. (4) as follows:
| (8) |
letting the in the cabs component to be the same as that of the LOS obscuration. The resulting values are mostly consistent with those reported in this work (see below). However, the intrinsic luminosity of the sources obtained for some objects changes by a factor of (see Fig. 11 shows). Indeed, note that a non-negligible amount of sources fall well outside the 1:1 relation even when accounting for error bars (black solid line). Moreover, the error bars are much larger when using cabs than when excluding it. These luminosities result in Eddington rates close to the Eddington limit, which are unrealistic values for LLAGN.
These results imply that there is a systematic uncertainty when adding the Compton-scattering through the cabs component. However, this does not imply that such a component does not physically exist in the X-ray spectra of AGN. In fact, the neglection of this component does add a systematic uncertainty to the general analysis. Indeed, this effect primarily affects the X-ray spectra of CT objects. Thus, although the addition of cabs does not lead to physically realistic results, the exclusion of the Compton-scattering effects in our analysis, imply that all intrinsic luminosities for CT sources reported here should be treated as lower limits.
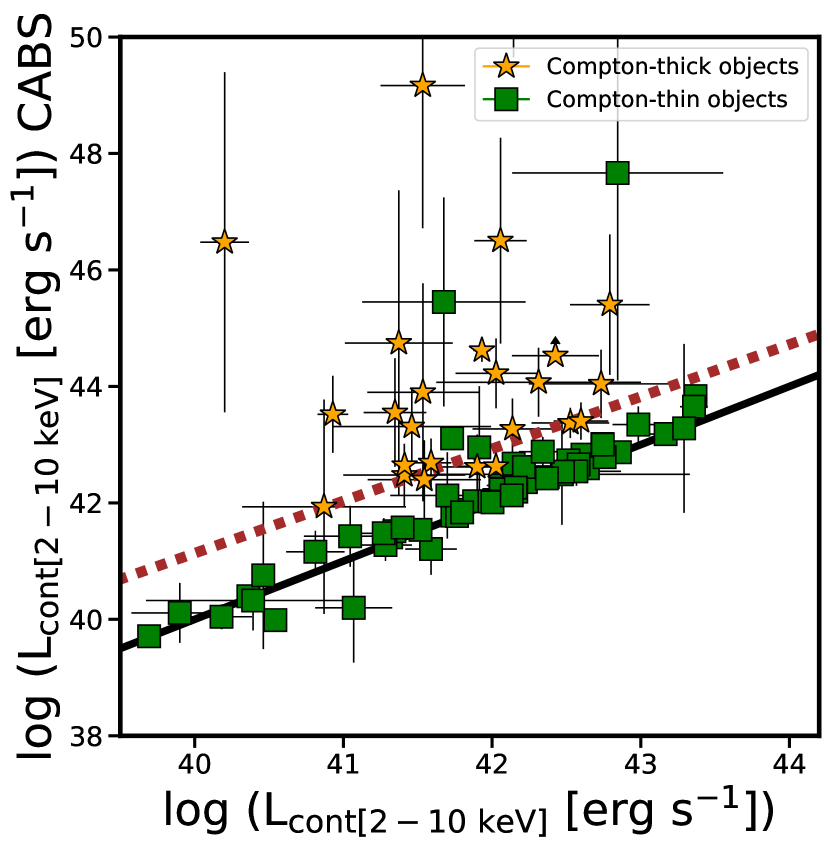
We have also checked how the exclusion of this component affects the measurement. Fig. 12 shows the change in this parameter. The black dashed line shows the 1:1 relation. In this case, most of the sources fall in this line, with only 8 sources falling outside the relation. Note that this is a result similar to the one by Tanimoto et al. (2018, see their Fig. 5a) , where they found larger values for the intrinsic luminosity when using this model. However, the spectral parameters were not very much affected.