Corresponding author: ]yanglt@mail.tsinghua.edu.cn Corresponding author: ]yueq@mail.tsinghua.edu.cn
CDEX Collaboration
Constraints on sub-GeV dark matter boosted by cosmic rays from the
CDEX-10 experiment at the China Jinping Underground Laboratory
Abstract
We present new constraints on light dark matter boosted by cosmic rays (CRDM) using the 205.4 kg day data of the CDEX-10 experiment conducted at the China Jinping Underground Laboratory. The Monte Carlo simulation package was employed to evaluate the Earth shielding effect. Several key factors have been introduced and discussed in our CRDM analysis, including the contributions from heavier CR nuclei than proton and helium, the inhomogeneity of CR distribution, and the impact of the form factor in the Earth attenuation calculation. Our result excludes the dark matter–nucleon elastic scattering cross section region from to for dark matter of 10 keV to 1 GeV.
I Introduction
Compelling cosmological evidence indicates the existence of dark matter (DM, denoted as ) in the Universe Tanabashi et al. (2018); Bertone et al. (2005). Myriad efforts have been pursued, including collider searches, direct detection (DD) experiments, and a wide range of astrophysical and cosmological studies, yet no clear signals have been observed to date.
Collider searches can be used to produce exclusion regions that provide upper bounds on the cross section that weaken at lower DM masses Daci et al. (2015). The current constraints in DM detection channels and experimental sensitivities indicate that a large parameter space remains to be explored. DD experiments, such as XENON Aprile et al. (2018), LUX Akerib et al. (2017), PandaX Cui et al. (2017), DarkSide Agnes et al. (2018), CRESST Abdelhameed et al. (2019), SuperCDMS Agnese et al. (2018), CoGeNT Aalseth et al. (2013), and CDEX Zhao et al. (2013); Liu et al. (2014); Yue et al. (2014); Zhao et al. (2016); Yang et al. (2018); Jiang et al. (2018a, b); Yang et al. (2019); Wang et al. (2021), are based on DM-nucleus (-N) elastic scattering through spin-independent (SI) and spin-dependent interactions. DD experiments rapidly lose sensitivity toward the sub-GeV range, because light DM particles carry insufficient energy to produce nuclear recoil signals with higher energies than the detector threshold. For a DM particle with mass GeV and a traditional DM escape velocity of 540 km/s, the maximal recoil energy translated to a target Ge nucleus via an elastic scattering interaction is of eV, which is considerably lower than the typical detection threshold of a detector searching for DM directly. Cosmological studies have set limits in the sub-GeV range. For example, constraints from the cosmic microwave background (CMB) are approximately Xu et al. (2018) and those from the structure formation are approximately in MeV to GeV mass range Rogers et al. (2022). Stringent constraints can arise from the big bang nucleosynthesis (BBN) if DM particles are relativistic and reach thermal equilibrium in the BBN era. DM with mass below a few MeV can be excluded for some benchmark models Krnjaic and McDermott (2020).
In the standard halo model (SHM), the DM particles follow a Maxwell-Boltzmann distribution with the most probable velocity of km/s and a cutoff at the Galactic escape velocity of km/s Drukier et al. (1986); Jungman et al. (1996). Recently, it has been realized that light DM particles can be boosted to relativistic or near relativistic momenta via the elastic scattering with cosmic rays (CRs) in the Milky Way halo Bringmann and Pospelov (2019); Lei et al. (2022); Xia et al. (2021); Cappiello and Beacom (2019); Ema et al. (2019); Dent et al. (2020); Cui et al. (2022). These secondary DM component particles (referred to as CRDM) will be scattered off in the detectors and transfer sufficient energies to the target nuclei, generating signals that surpass the detection threshold. Considering the CRDM, the lower reach of in DD experiments can be substantially extended to keV range Bringmann and Pospelov (2019); Lei et al. (2022); Xia et al. (2021); Ema et al. (2019); Cappiello and Beacom (2019); Dent et al. (2020); Cui et al. (2022).
CDEX-10 Jiang et al. (2018a, b), the second phase of the CDEX experiment aiming at light DM searches, runs a 10 kg -type point contact germanium (PPCGe) Soma et al. (2016) detector array in the China Jinping Underground Laboratory (CJPL) with about 2400 m of rock overburden Cheng et al. (2017). The detector array consists of three triple-element PPCGe detector strings (C10A, B, and C), which are directly immersed in liquid nitrogen (L) for cooling and shielding Jiang et al. (2018a). The 20 cm thick high-purity oxygen-free copper in the L cryostat serves as a passive shield against ambient radioactivity. The L cryostat operates in the polyethylene room with 1 m thick walls at CJPL-I. The configuration of the detector system was described in detail previously Jiang et al. (2018a, b). Since February 2017, the detector has been under stable data-taking conditions. Limits on -N SI scattering down to were derived at an energy threshold of 160 eVee (electron equivalent energy) with an exposure of 102.8 kg day Jiang et al. (2018a). Recent constraints on the dark photon effective mixing parameter were derived with an exposure of 205.4 kg day She et al. (2020).
In this paper, within the CRDM scenario, we reanalyzed the 205.4 kg day dataset from CDEX-10 experiment She et al. (2020) to set constraints on the -nucleon SI interactions, the cross section of which is denoted by . The Earth shielding effect Emken and Kouvaris (2017); Hooper and McDermott (2018); Emken and Kouvaris (2018); Kavanagh (2018); Emken et al. (2019); Liu et al. (2022), considering the influence of the rock overburden during the dark matter transportation to an underground laboratory, is utilized to set the upper bound of the exclusion region. We discuss the CR inputs and parameter choices in CRDM studies and examine the related uncertainties.
II CRDM flux in space
In this section, we introduce the CR data used in this work and calculate the CRDM flux in space. Furthermore, a discussion on the effective distance is provided.
II.1 Cosmic rays in the Galaxy
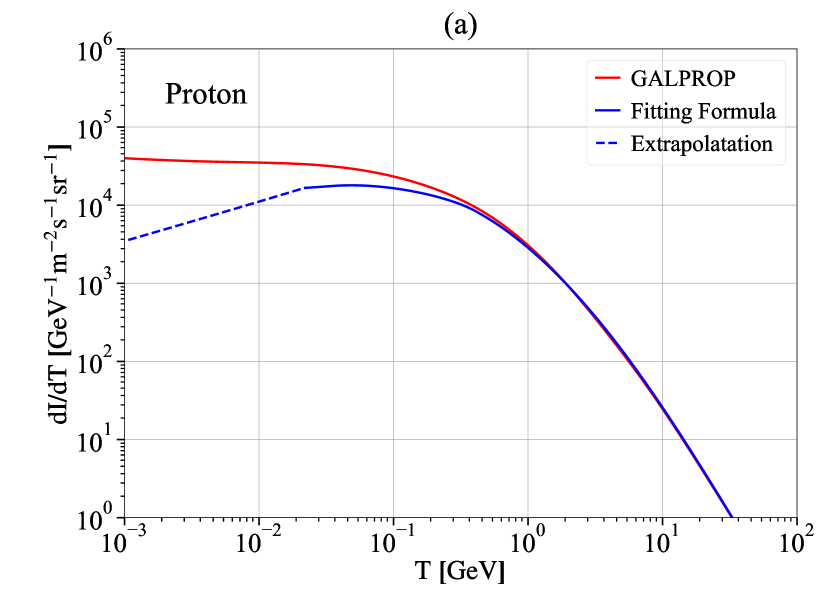
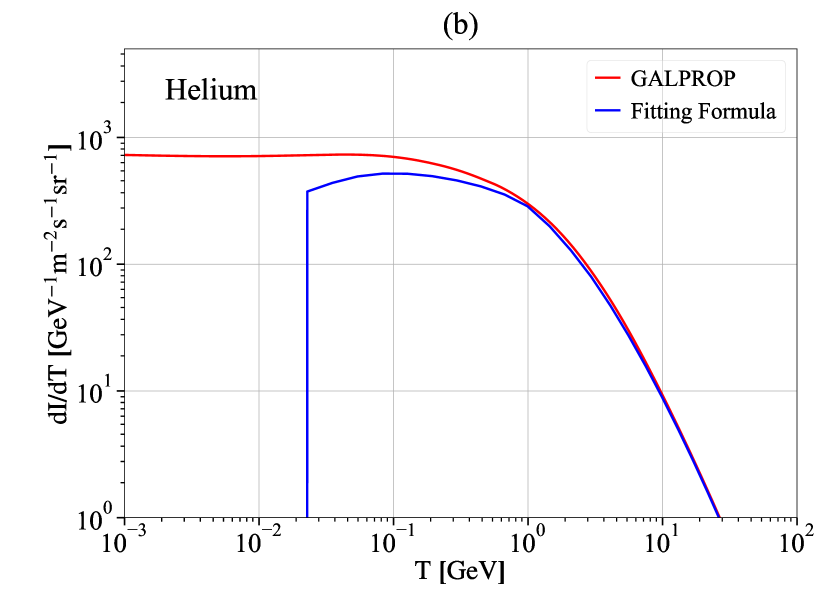
Cosmic rays are high-energy particles including protons, electrons, and a range of heavier nuclei, which may originate from and be accelerated by supernova remnants Cesarsky (1980); Bykov et al. (2018). The Galactic magnetic fields trap the electrically charged CR components in the Milky Way halo and make the CR distribution highly isotropic. Current space-based experiments, such as AMS Aguilar et al. (2015a, b), CREAM Yoon et al. (2017), DAMPE An et al. (2019), CALET Adriani et al. (2019), and PAMELA Adriani et al. (2011), provide directly measured CR flux data in the MeV–TeV range. The observed CR spectra near Earth peak at 1 GeV due to solar modulation. Voyager 1 has detected the local interstellar spectra of various CR components away from the heliosphere down to a few MeV, providing results many magnitudes greater than those measured at Earth Cummings et al. (2016). The CR fluxes of proton and helium near Earth, which is affected by solar modulation, can be parametrized and described using a fitting formula. The local differential intensity of proton and helium as a function of rigidity can be expressed by
| (1) |
where and are the numerical coefficients summarized in Table 1 Boschini et al. (2017, 2018). The differential flux as a function of kinetic energy can be obtained by . The relativistic relation should be used to derive . We note for comparison that, in previous CRDM studies such as Ref. Bringmann and Pospelov (2019), the fluxes of proton and helium were calculated using Eq. 1. Extrapolation of the fitting formula below for proton and a cutoff with rigidity below for helium were made.
| p | 94.1 | 831 | 0 | 16700 | 10200 | 0 | 10800 | 8590 | 4230000 | 3190 | 274000 | 17.4 | 39400 | 0.464 | 0 |
| He | 1.14 | 0 | 118 | 578 | 0 | 87 | 3120 | 5530 | 3370 | 1.29 | 134000 | 88.5 | 1170000 | 861 | 0.03 |
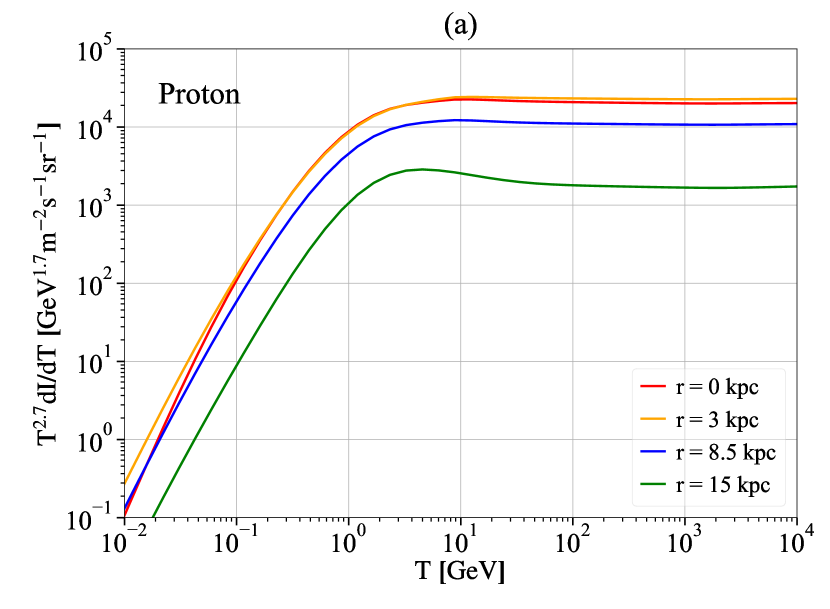
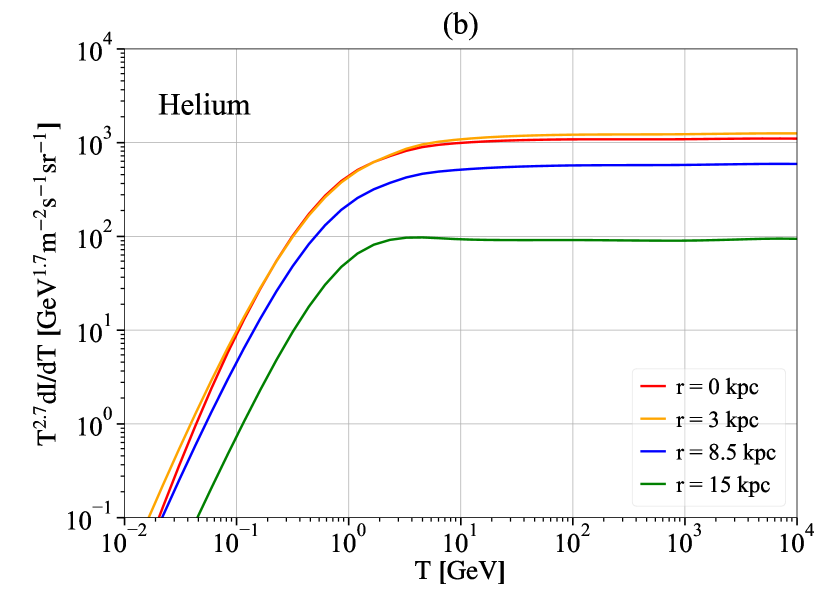
However, in the CRDM scenario, the DM particles are boosted by CRs not only near the Solar System but in the entire Milky Way, on which scale the solar modulation effect is negligible. The unmodulated CR flux data should be used when computing the CRDM flux. Boschini et al. (2017, 2018) is a simulation package that uses real Milky Way information including the gas distribution and magnetic field distribution to model the CR diffusion and propagation in the Galaxy. In , the solar modulation is not considered, making it more appropriate for the CRDM analysis. In this analysis, the package is used to generate the required CR data, including the spatial distribution and the flux of CR species from hydrogen to nickel in the Galaxy. The local differential intensities of proton and helium generated by are shown in Fig. 1. For comparison, the calculation results obtained using the fitting formula are also superimposed, which are slightly lower than those generated by in the low-energy range.
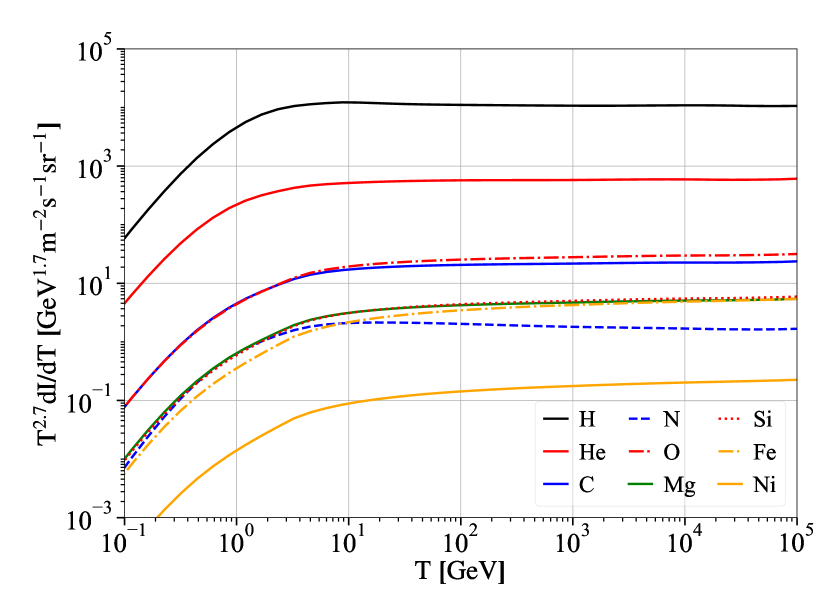
During the calculation of CRDM flux, the nuclei of H, He, C, N, O, Mg, Si, Fe, and Ni in the cosmic rays are included. Figure 2 shows the local differential intensities of these CR species. Electrons are not considered here, as our main focus is -N scattering.
II.2 CRDM calculation
The calculation algorithm of the CRDM flux follows the steps presented in previous studies Bringmann and Pospelov (2019); Ema et al. (2019); Cappiello and Beacom (2019); Lei et al. (2022); Xia et al. (2021). Compared with the relativistic CR particles, DM particles with velocities of can be effectively treated at rest. The kinetic energy transferred to a DM particle by an incident CR particle ( = H, He,…) with mass and kinetic energy is given by
| (2) | ||||
Here, represents the scattering angle in the center-of-mass system. Inverting Eq. 2 indicates the minimal incident energy required to produce ,
| (3) |
where corresponds to the case ().
The CR nucleus-DM scattering differential cross section is given by
| (4) |
where represents the zero-momentum transferred DM-nucleon cross section, denotes the mass number of CR species , represents the DM-nucleus reduced mass, denotes the DM-nucleon reduced mass, represents the form factor, which is related to the momentum transfer, and . For proton and helium, we adopt the dipole form factor Perdrisat et al. (2007), where the and MeV Angeli (2004). For other heavier nuclei, we adopt the conventional Helm form factor Lewin and Smith (1996).
The CR-induced DM flux is obtained by integrating over all CR nucleus species and energies along the line of sight (LOS),
| (5) |
where represents the solid angle and denotes the minimal CR energy required to produce a DM recoil energy , which can be calculated by Eq. 3. For the DM density distribution , we adopt the Navarro-Frenk-White (NFW) profile Navarro et al. (1997). The spatial distribution of the flux of CR species , , is related to the distance to the Galactic Center .
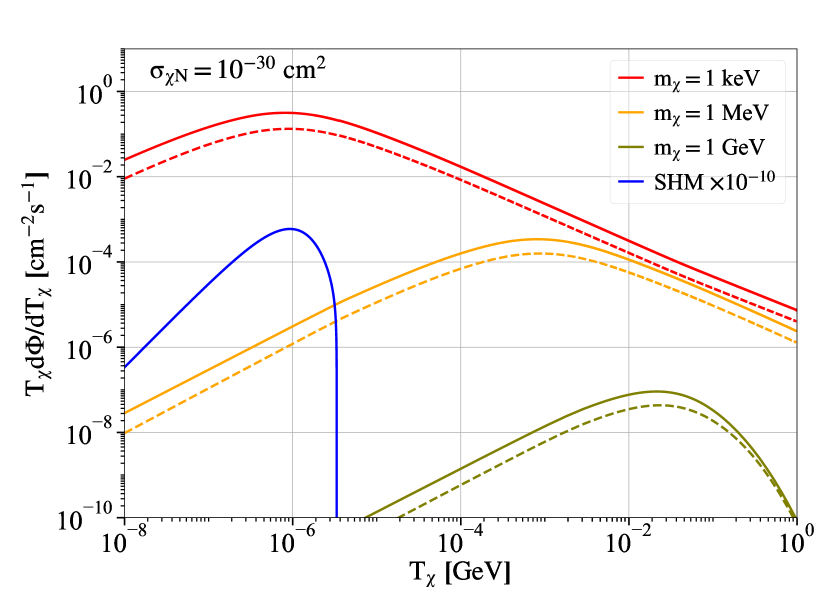
Using Eq. 5 and the CR data generated by , the CRDM fluxes for various DM masses are obtained and shown in Fig. 3. The dominant contributions are from proton and helium, while the total contribution from other heavier CR species accounts for approximately half of the total CRDM flux. The flux of DM with 1 GeV mass derived from the SHM and rescaled by a factor is also shown for comparison. It can be inferred that a very tiny amount of DM particles are accelerated to extremely high energy. This work only considers CRDM particles with kinetic energies below 1 GeV to avoid possible inelastic processes Bringmann and Pospelov (2019).
II.3 Discussion on the effective distance
For simplicity, an effective distance is introduced to represent the space integral in Eq. 5,
| (6) |
where the local DM density Navarro et al. (1997) and is the Local Interstellar Spectrum (LIS) of CR flux. The expression of can be obtained by comparing Eqs. 5 and 6; their comparison provides the rigorous definition of the spatial coefficient ,
| (7) |
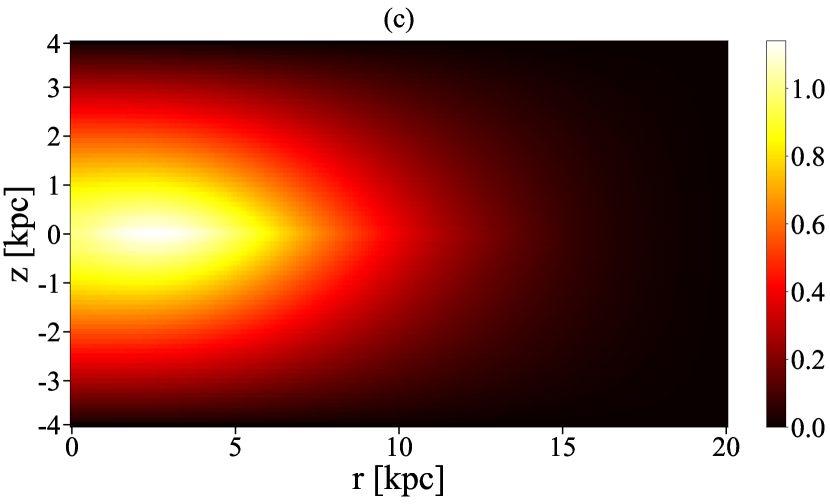
Depending on the DM kinetic energy and the DM mass , the calculation of requires the CR spatial flux and the range of the spatial integral as inputs. Regarding the spatial distribution of the flux of CR species , , simulation results from show that the overall CR flux in the Galactic Center is several times higher than the flux near the Solar System, while their spectral shapes remain similar. Figure 4 demonstrates the inhomogeneity of the proton and helium intensities in the Galaxy. The proton flux at the Galactic Center is 2–3 times larger than the LIS ( = 8.5 kpc, the location of the Solar System) and one magnitude larger than the flux at = 15 kpc.
Conventionally, the CR distribution was treated as homogeneous, under which assumption the factor related to in Eq. 7 will be canceled out, leading to . The NFW profile Navarro et al. (1997) is used to set DM density and . The value of is determined by the integral range selected in this case.
Different CR spatial distribution models have been used in previous studies. A spherical CR distribution assumption and a full line-of-sight integration to radius = 1 kpc (10 kpc) resulting in = 0.997 kpc ( = 8.02 kpc) were adopted for XENON-1T data Bringmann and Pospelov (2019), where the values of 1 and 10 kpc were used as benchmark values. Similarly, a cylindrical distribution with a radius of 10 kpc and half-height of 1 kpc was used for KamLAND data Cappiello and Beacom (2019), providing = 3.7 kpc. We note that taking a larger halo (such as a cylinder with a half-height of 4–10 kpc) could be more realistic according to astronomical studies Strong et al. (2000).
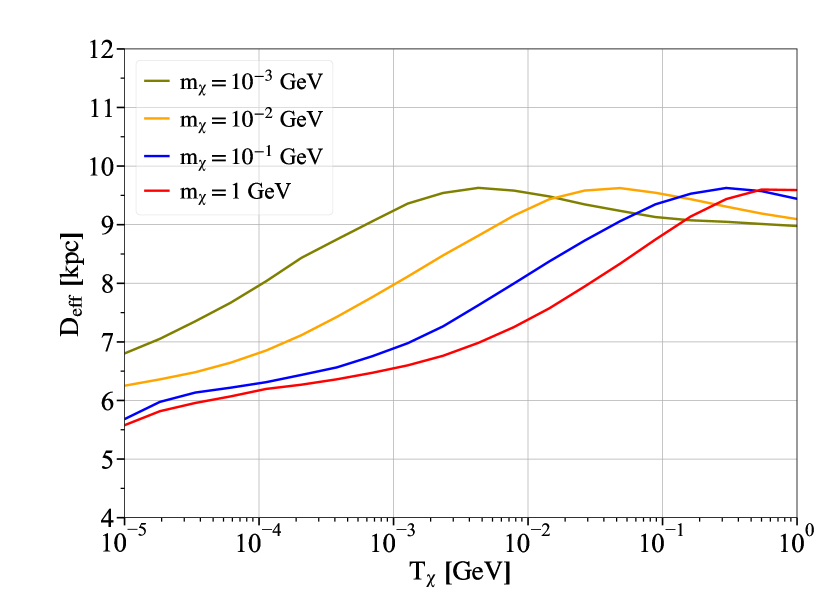
In this analysis, the CR spatial distribution data are generated using . Further, a cylindrical distribution of CR with radius kpc and half-height kpc is adopted. The values as a function of DM kinetic energy of different DM masses are calculated using Eq. 7 and shown in Fig. 5. The values start from about 6 kpc at low energies, reach peaks at about 10 kpc, and then decrease slightly. As the values used in previous studies, the 1 Bringmann and Pospelov (2019) and 3.7 kpc Cappiello and Beacom (2019) are too conservative, while 10 kpc Bringmann and Pospelov (2019) is a slightly overestimated value. The value of is a major source of uncertainty in the CRDM analyses. To avoid the uncertainty related to , we do not adopt a fixed value in this analysis. The CRDM fluxes are calculated using Eq. 5, which is more accurate.
III Earth attenuation and recoil spectrum
The DM particles must travel through a few kilometers of rock before reaching the underground laboratory. The DM flux will be changed from to , where represents the depth of rock through which incident DM particles pass.
A Monte Carlo simulation package Liu et al. (2022) was developed to simulate the Earth shielding effect of CJPL, encompassing a detailed geometric model and the rock compositions of Jinping Mountain. In the simulation framework, the initial DM particles of different masses are generated on a sphere concentric with Earth with a radius of , where Earth’s radius is 6400 km and = 3 km. The kinetic energies of the initial DM particles are sampled according to the CRDM flux. Both the energy loss and the direction variation of a DM particle after each -N scattering in Earth’s crust are considered until it arrives at the underground laboratory after multiple scatterings. The number and energies of the DM particles arriving at the underground laboratory are counted to reconstruct the attenuated CRDM flux .
For relativistic CRDM particles with considerable kinetic energy, the momentum transfers in the -N scattering process can be large; thus, the impact of the nuclear form factor of nuclei in Earth’s crust cannot be neglected while it was treated as unity for simplicity in some previous analysis Bringmann and Pospelov (2019); Lei et al. (2022); Xia et al. (2021). The form factor suppression of the cross section results in a larger mean free path and lower collision rates. Furthermore, the energy losses of DM particles are reduced because the cross sections become smaller for large momentum transfer scenarios. The attenuated CRDM flux can extend to a considerably higher energy than that in the case without considering the form factor, which significantly improves the sensitivity of the DD experiments to larger cross sections Xia et al. (2022). We consider the effect of the form factor here in the simulation package Liu et al. (2022). The free-propagation length between two scatterings is sampled using the mean free path calculated via the total cross section obtained by integrating Eq. 4. The momentum transfer of each scattering is sampled according to the differential cross section corrected by the form factor . The Helm form factor is used here for elements in Earth’s crust Lewin and Smith (1996).
The differential event rate of the -N elastic scattering in the detectors is calculated using the following equation:
| (8) |
where is the nuclear recoil energy, is the number of target nuclei per unit detector mass, is the mass number of Ge nucleus, and is the DM-Ge nucleus reduced mass. The value of is obtained using Eq. 2 by replacing and . Inverting the expression of affords . is the nuclear form factor, for which the Helm form factor Lewin and Smith (1996) is used.
In a germanium semiconductor detector, the observed total deposit energy is different from the real nuclear recoil energy and should be corrected by the quenching factor, . The quenching factor in Ge is calculated using the Lindhard formula Lindhard et al. (1963) (, a typical value reported in the literature and well matches recent measurements at low-energy range Bonhomme et al. (2022)) with a 10% systematic error adopted in this analysis.
IV Exclusion results
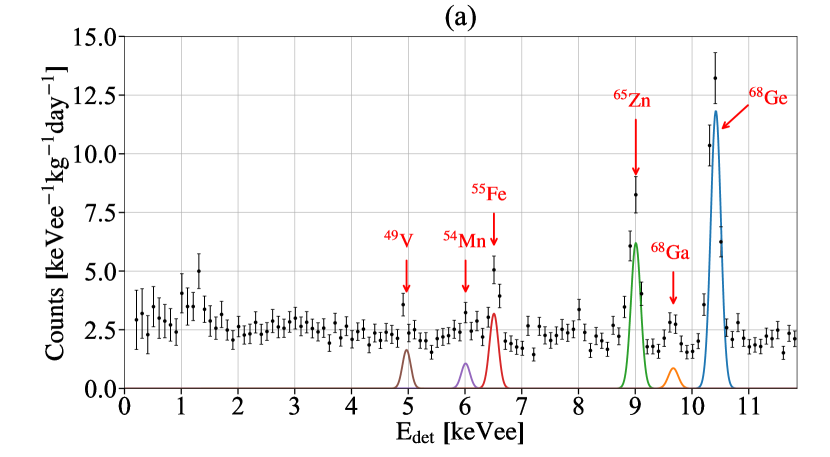
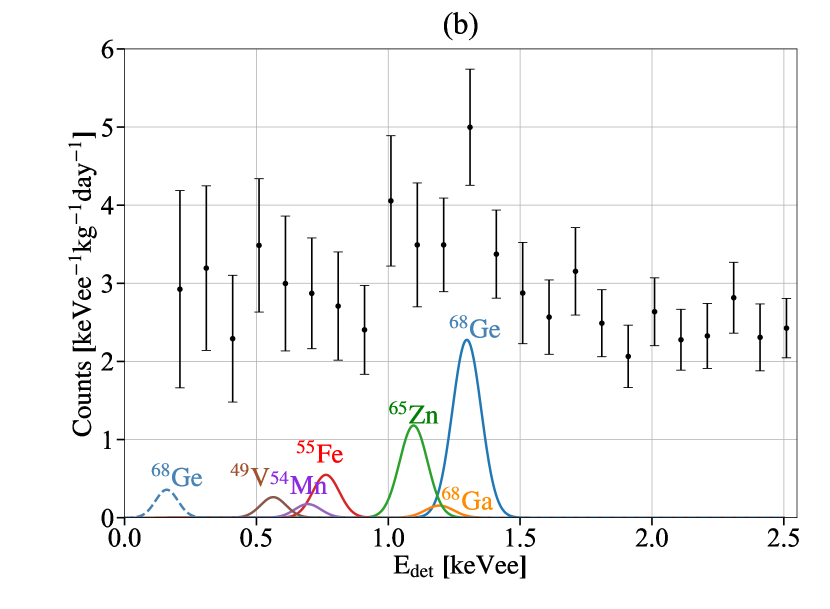
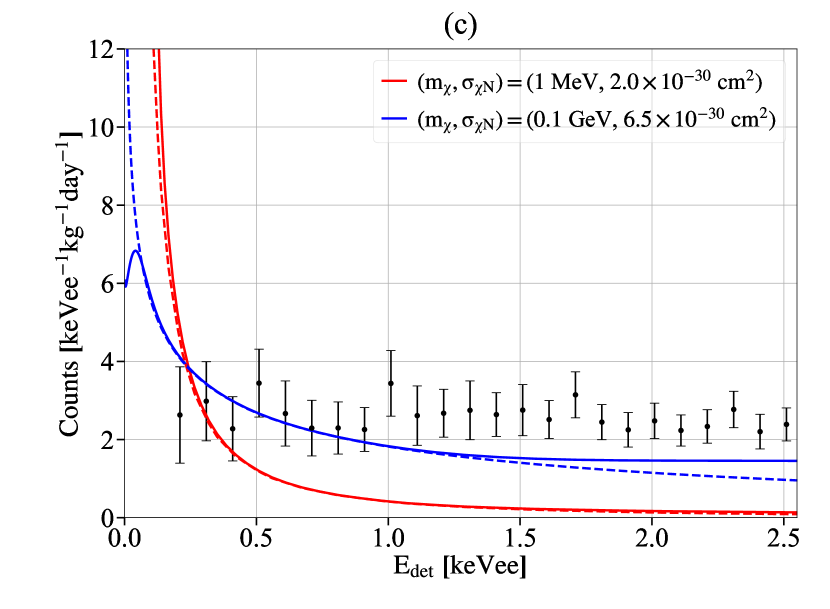
Data used in this CRDM analysis are from the CDEX-10 data taken from February 2017 to August 2018, with a total exposure of 205.4 kg day She et al. (2020), after considering the dead time corrections and the fiducial mass. The data analysis follows the procedures described in our earlier works, including energy calibration, physics event selection, bulk-surface event discrimination, and various efficiency corrections Yang et al. (2018); Jiang et al. (2018b, a); Yang et al. (2019); She et al. (2020). The spectrum obtained after a series of physics event selections and efficiency corrections is shown in Fig. 6(a). The physics analysis threshold is 160 eVee, where the combined efficiency is 4.5% Jiang et al. (2018b). The characteristic K-shell x-ray peaks from internal cosmogenic radionuclides like , , , , , and can be identified. Their intensities are derived from the best fit of the spectrum Jiang et al. (2018a). The contributions of L- and M-shell x-ray peaks, which are not fitted, but are derived from the corresponding K-shell line intensities Bahcall (1963), are as demonstrated in Fig. 6(b). The residual spectrum with the L- and M-shell x-ray contributions subtracted in the region of 0.16–2.56 keVee is shown in Fig. 6(c). The expected CRDM spectra of DM mass 1 MeV, cross section and 0.1 GeV, cross section are also shown for comparison. As shown in Fig. 6(c), light DM particles in the sub-GeV mass range can generate considerable signals above the detection threshold after the CR acceleration.
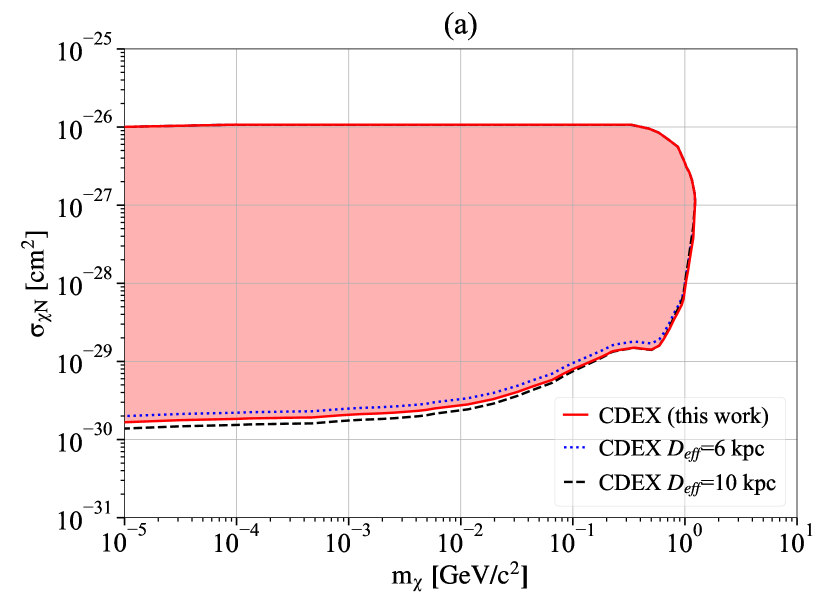
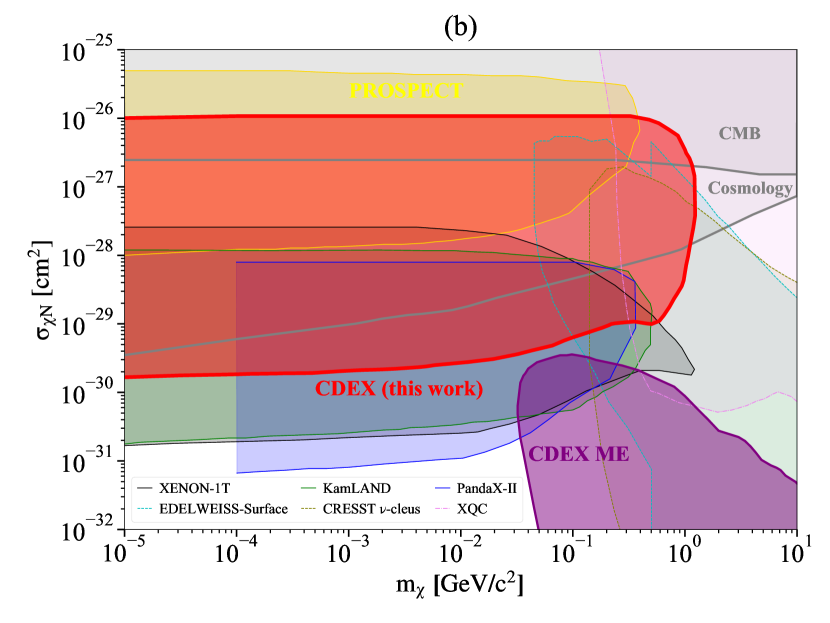
As shown in Fig. 7, the exclusion region of CRDM with a confidence level is derived using the binned Poisson method Savage et al. (2009). The Earth attenuation effect has been considered with the Monte Carlo simulation package to derive the upper bound. Previous CRDM research carried out by PROSPECT and PandaX-II, and phenomenological interpretations using XENON-1T and KamLAND data are superimposed Andriamirado et al. (2021); Cui et al. (2022); Cappiello and Beacom (2019); Bringmann and Pospelov (2019). Constraints from the CRESST -cleus 2017 surface run Davis (2017); Emken and Kouvaris (2018); Angloher et al. (2017), EDELWEISS-Surface Armengaud et al. (2019), and X-ray Quantum Calorimeter experiment (XQC) Mahdawi and Farrar (2017) are also shown in the figure. Limits from cosmological studies based on the CMB Xu et al. (2018) and the large scale structure Rogers et al. (2022) are shown in gray contour. The constraints obtained from BBN presented in Ref. Krnjaic and McDermott (2020) are not included in the figure as the values obtained in Ref. Krnjaic and McDermott (2020) are model specific. With the form factor considered in the Earth attenuation calculations, this work excludes a large region from to in the dark matter–nucleon elastic scattering cross section. This result corresponds to better sensitivities than the cosmological limits Rogers et al. (2022) in the mass range from 10 keV to 1 GeV.
V Conclusions and discussions.
Light DM particles boosted by CRs are energetic and detectable in the sub-GeV mass region. Constraints on the -nucleon scattering cross section are derived in this study based on the 205.4 kg day dataset using the CR boosting mechanism. More stringent limits are placed on the existing cosmological exclusion region for DM at a mass range from 10 keV to 1 GeV.
During the CRDM calculation process, heavier CR nuclear components apart from the proton and helium are also taken into account, resulting in a doubling of the CRDM flux. Further, the unmodulated CR data with spatial distribution across the Galaxy generated by the package are used. Previous CRDM studies used the modulated CR fluxes presented in Refs. Boschini et al. (2017, 2018), leading to conservative conclusions. Considering the inhomogeneity of the CR distribution, we use the simulation package to calculate the value of in this work and obtain a continuous function of the kinetic energy for different DM masses , which is a more accurate approach compared with using a constant value Cappiello and Beacom (2019); Bringmann and Pospelov (2019).
During the Earth attenuation calculation, some studies Bringmann and Pospelov (2019); Lei et al. (2022); Xia et al. (2021) adopted a ballistic-trajectory assumption to model the propagation of DM in Earth’s crust, which neglects the changing DM travel direction during the scattering process, leading to an extremely conservative conclusion. To improve the accuracy of the exclusion bound, we develop a Monte Carlo simulation package Liu et al. (2022), in which the detailed topography of the Jinping Mountain is modeled, and the direction deviations of DM particles during their transportation are considered. The conventional Helm form factor is also adopted in the Earth attenuation simulation to evaluate the impact of the form factor, which depends on the energy scale of the momentum transfer during the scattering, whereas several works omitted it [] Andriamirado et al. (2021); Emken and Kouvaris (2017); McCammon et al. (2002); Cappiello and Beacom (2019). The upper bound is elevated to due to these improvements.
These results are obtained within the context of the -N SI elastic scattering interaction. The constraints can be further improved after considering the CR-DM inelastic scattering process Guo et al. (2020); Bell et al. (2021); Feng et al. (2022). The approach proposed in this work can be extended to new DM models, such as the gravitationally interacting DM Wang et al. (2020) and the highly interactie particle relics DM Elor et al. (2021). Advances in DM-electron scattering calculation in crystal targets Griffin et al. (2021) allow new constraints on sub-GeV DM-electron scattering to be obtained in future work Zhang et al. (2022). Furthermore, up-scattering of DM by the supernova shock waves Hu et al. (2017); Singh et al. (2019) can also be probed.
Acknowledgements.
We thank T. Bringmann and C. V. Cappiello for helpful discussions. This work was supported by the National Key Research and Development Program of China (Grant No. 2017YFA0402200) and the National Natural Science Foundation of China (Grants No. 12175112, No. 12005111, and No. 11725522). We acknowledge the Center of High Performance Computing, Tsinghua University, for providing the facility support.References
- Tanabashi et al. (2018) M. Tanabashi et al. (Particle Data Group), Phys. Rev. D 98, 030001 (2018).
- Bertone et al. (2005) G. Bertone, D. Hooper, and J. Silk, Phys. Rep. 405, 279 (2005).
- Daci et al. (2015) N. Daci et al., J. High Energy Phys. 11, 108 (2015).
- Aprile et al. (2018) E. Aprile et al. (XENON Collaboration), Phys. Rev. Lett. 121, 111302 (2018).
- Akerib et al. (2017) D. S. Akerib et al. (LUX Collaboration), Phys. Rev. Lett. 118, 021303 (2017).
- Cui et al. (2017) X. Cui et al. (PandaX-II Collaboration), Phys. Rev. Lett. 119, 181302 (2017).
- Agnes et al. (2018) P. Agnes et al. (DarkSide Collaboration), Phys. Rev. Lett. 121, 081307 (2018).
- Abdelhameed et al. (2019) A. H. Abdelhameed et al. (CRESST Collaboration), Phys. Rev. D 100, 102002 (2019).
- Agnese et al. (2018) R. Agnese et al. (SuperCDMS Collaboration), Phys. Rev. D 97, 022002 (2018).
- Aalseth et al. (2013) C. E. Aalseth et al. (CoGeNT Collaboration), Phys. Rev. D 88, 012002 (2013).
- Zhao et al. (2013) W. Zhao et al. (CDEX Collaboration), Phys. Rev. D 88, 052004 (2013).
- Liu et al. (2014) S. K. Liu et al. (CDEX Collaboration), Phys. Rev. D 90, 032003 (2014).
- Yue et al. (2014) Q. Yue et al. (CDEX Collaboration), Phys. Rev. D 90, 091701 (2014).
- Zhao et al. (2016) W. Zhao et al. (CDEX Collaboration), Phys. Rev. D 93, 092003 (2016).
- Yang et al. (2018) L. T. Yang et al. (CDEX Collaboration), Chin. Phys. C 42, 023002 (2018).
- Jiang et al. (2018a) H. Jiang et al. (CDEX Collaboration), Phys. Rev. Lett. 120, 241301 (2018a).
- Jiang et al. (2018b) H. Jiang et al. (CDEX Collaboration), Sci. China-Phys. Mech. Astron. 62, 031012 (2018b).
- Yang et al. (2019) L. T. Yang et al. (CDEX Collaboration), Phys. Rev. Lett. 123, 221301 (2019).
- Wang et al. (2021) Y. Wang et al. (CDEX Collaboration), Sci. China-Phys. Mech. Astron. 64, 281011 (2021).
- Xu et al. (2018) W. L. Xu, C. Dvorkin, and A. Chael, Phys. Rev. D 97, 103530 (2018).
- Rogers et al. (2022) K. K. Rogers, C. Dvorkin, and H. V. Peiris, Phys. Rev. Lett. 128, 171301 (2022).
- Krnjaic and McDermott (2020) G. Krnjaic and S. D. McDermott, Phys. Rev. D 101, 123022 (2020).
- Drukier et al. (1986) A. K. Drukier, K. Freese, and D. N. Spergel, Phys. Rev. D 33, 3495 (1986).
- Jungman et al. (1996) G. Jungman, M. Kamionkowski, and K. Griest, Phys. Rep. 267, 195 (1996).
- Bringmann and Pospelov (2019) T. Bringmann and M. Pospelov, Phys. Rev. Lett. 122, 171801 (2019).
- Lei et al. (2022) Z. H. Lei, J. Tang, and B. L. Zhang, Chin. Phys. C 46, 085103 (2022).
- Xia et al. (2021) C. Xia, Y. H. Xu, and Y. F. Zhou, Nucl. Phys. B 969, 115470 (2021).
- Cappiello and Beacom (2019) C. V. Cappiello and J. F. Beacom, Phys. Rev. D 100, 103011 (2019).
- Ema et al. (2019) Y. Ema, F. Sala, and R. Sato, Phys. Rev. Lett. 122, 181802 (2019).
- Dent et al. (2020) J. B. Dent et al., Phys. Rev. D 101, 116007 (2020).
- Cui et al. (2022) X. Cui et al. (PandaX-II Collaboration), Phys. Rev. Lett. 128, 171801 (2022).
- Soma et al. (2016) A. Soma et al., Nucl. Instrum. Methods Phys. Res., Sect. A 836, 67 (2016).
- Cheng et al. (2017) J. P. Cheng et al., Annu. Rev. Nucl. Part. Sci. 67, 231 (2017).
- She et al. (2020) Z. She et al. (CDEX Collaboration), Phys. Rev. Lett. 124, 111301 (2020).
- Emken and Kouvaris (2017) T. Emken and C. Kouvaris, J. Cosmol. Astropart. Phys. 10, 031 (2017).
- Hooper and McDermott (2018) D. Hooper and S. D. McDermott, Phys. Rev. D 97, 115006 (2018).
- Emken and Kouvaris (2018) T. Emken and C. Kouvaris, Phys. Rev. D 97, 115047 (2018).
- Kavanagh (2018) B. J. Kavanagh, Phys. Rev. D 97, 123013 (2018).
- Emken et al. (2019) T. Emken et al., J. Cosmol. Astropart. Phys. 09, 070 (2019).
- Liu et al. (2022) Z. Z. Liu et al. (CDEX Collaboration), Phys. Rev. D 105, 052005 (2022).
- Cesarsky (1980) C. J. Cesarsky, Annu. Rev. Astron. Astrophys. 18, 289 (1980).
- Bykov et al. (2018) A. M. Bykov et al., Space Sci. Rev. 214, 41 (2018).
- Aguilar et al. (2015a) M. Aguilar et al. (AMS Collaboration), Phys. Rev. Lett. 114, 171103 (2015a).
- Aguilar et al. (2015b) M. Aguilar et al. (AMS Collaboration), Phys. Rev. Lett. 115, 211101 (2015b).
- Yoon et al. (2017) Y. S. Yoon et al., Astrophys. J. 839, 5 (2017).
- An et al. (2019) Q. An et al., Sci. Adv. 5, eaax3793 (2019).
- Adriani et al. (2019) O. Adriani et al. (CALET Collaboration), Phys. Rev. Lett. 122, 181102 (2019).
- Adriani et al. (2011) O. Adriani et al., Science 332, 69 (2011).
- Cummings et al. (2016) A. C. Cummings et al., Astrophys. J. 831, 18 (2016).
- Boschini et al. (2017) M. J. Boschini et al., Astrophys. J. 840, 115 (2017).
- Boschini et al. (2018) M. J. Boschini et al., Astrophys. J. 858, 61 (2018).
- Perdrisat et al. (2007) C. F. Perdrisat, V. Punjabi, and M. Vanderhaeghen, Prog. Part. Nucl. Phys. 59, 694 (2007).
- Angeli (2004) I. Angeli, At. Data Nucl. Data Tables 87, 185 (2004).
- Lewin and Smith (1996) J. Lewin and P. Smith, Astropart. Phys. 6, 87 (1996).
- Navarro et al. (1997) J. F. Navarro, C. S. Frenk, and S. D. M. White, Astrophys. J. 490, 493 (1997).
- Strong et al. (2000) A. W. Strong, I. V. Moskalenko, and O. Reimer, Astrophys. J. 537, 763 (2000).
- Xia et al. (2022) C. Xia, Y. H. Xu, and Y. F. Zhou, J. Cosmol. Astropart. Phys. 02, 028 (2022).
- Lindhard et al. (1963) J. Lindhard et al., Mat. Fys. Medd. Dan. Vid. Selsk. 33, 10 (1963).
- Bonhomme et al. (2022) A. Bonhomme et al., (2022), arXiv:2202.03754 [physics.ins-det] .
- Bahcall (1963) J. N. Bahcall, Phys. Rev. 132, 362 (1963).
- Savage et al. (2009) C. Savage et al., J. Cosmol. Astropart. Phys. 04, 010 (2009).
- Andriamirado et al. (2021) M. Andriamirado et al. (PROSPECT Collaboration), Phys. Rev. D 104, 012009 (2021).
- Davis (2017) J. H. Davis, Phys. Rev. Lett. 119, 211302 (2017).
- Angloher et al. (2017) G. Angloher et al. (CRESST Collaboration), Eur. Phys. J. C 77, 637 (2017).
- Armengaud et al. (2019) E. Armengaud et al. (EDELWEISS Collaboration), Phys. Rev. D 99, 082003 (2019).
- Mahdawi and Farrar (2017) M. S. Mahdawi and G. R. Farrar, J. Cosmol. Astropart. Phys. 12, 004 (2017).
- McCammon et al. (2002) D. McCammon et al., Astrophys. J. 576, 188 (2002).
- Abe et al. (2011) S. Abe et al. (KamLAND Collaboration), Phys. Rev. C 84, 035804 (2011).
- Guo et al. (2020) G. Guo et al., Phys. Rev. D 102, 103004 (2020).
- Bell et al. (2021) N. F. Bell et al., Phys. Rev. D 104, 076020 (2021).
- Feng et al. (2022) J. C. Feng et al., J. High Energy Phys. 4, 080 (2022).
- Wang et al. (2020) W. Wang et al., J. High Energy Phys. 12, 072 (2020), [Erratum: J. High Energy Phys. 02, 052 (2021)].
- Elor et al. (2021) G. Elor, R. McGehee, and A. Pierce, (2021), arXiv:2112.03920 [hep-ph] .
- Griffin et al. (2021) S. M. Griffin et al., Phys. Rev. D 104, 095015 (2021).
- Zhang et al. (2022) Z. Y. Zhang et al. (CDEX Collaboration), (2022), arXiv:2206.04128 [hep-ex] .
- Hu et al. (2017) P. K. Hu, A. Kusenko, and V. Takhistov, Phys. Lett. B 768, 18 (2017).
- Singh et al. (2019) L. Singh et al. (TEXONO Collaboration), Phys. Rev. D 99, 032009 (2019).