Measurement of alpha induced reaction cross-sections on natMo with detailed covariance analysis
Abstract
In the present study we have measured the excitation functions for the nuclear reactions 100Mo(,n)103Ru, natMo(,x)97Ru, natMo(,x)95Ru, natMo(,x)96gTc, natMo(,x)95gTc and natMo(,x)94gTc in the energy range 11-32 MeV. We have used the stacked foil activation technique followed by off-line gamma ray spectroscopy technique to measure the excitation functions. In this study we have also documented detailed uncertainty analysis for these nuclear reactions and their corresponding covariance matrix are also presented. The excitation functions are compared with the available experimental data from EXFOR data library and the theoretical prediction from TALYS nuclear reaction code. The present measurements are found to be consistent with the available experimental data.
I Introduction
The cross-sections measurement for the charged particle-induced reactions with various target materials are of great interest in many fields such as astrophysics, production of medical radioisotopes, nuclear reaction studies, investigations and improvement of physical properties 01 ; 02 . Nowadays, there are various radioactive materials with unique properties, playing an important role in nuclear medicine diagnosis 03 ; 04 . Out of such radioisotopes, 97Ru =2.79 days) is the one that emits low energy (Eγ = 215.70 keV) -ray with a branching ratio (Iγ) that makes it suitable for use in single photon emission computed tomography (SPECT) imaging 05 .
The SPECT is a nuclear medicine tomographic imaging technique using -rays that is capable of providing true 3-D image.
An another important radioisotope is 103mRh with short half-life of 56.11 min, which is useful for augur electron therapy due to it’s very low photon/electron ratio 06 . The radioisotope 103Ru has a half-life of 39.26 days which decays via decay into 103mRh with a branching ratio (Iγ) of . Since 103mRh has a short half-life of 56.11 min, 103Ru as a parent to 103mRh provides a good option due to its relatively longer half-life of 39.26 days.
Alpha-induced reactions with molybdenum target are important for the production of the above-mentioned radioisotopes and these nuclear reactions also play an important role in astrophysics for the study of p-process and r-process nucleosynthesis. 07 . The nuclear reaction 100Mo(,n)103Ru is used to study the weak r-process nucleosynthesis 08 . In the present study, we have used alpha particles as the projectile and molybdenum as the target material. The main goal of this investigation was to extend the activation cross-section data for nuclear reactions natMo(,x)97Ru, 100Mo(,n)103Ru with respect to the production of medicines related to 97Ru, 103Ru.
Since, with the increasing demand for alpha-induced reactions in nuclear research, astrophysics, nuclear medicine diagnostics, industry, it is an important component to accurately estimate the amount of uncertainty propogation from the evaluated nuclear reaction cross section data of these reactions. Although experimental data for these reactions exist in the EXFOR data library, yet a detailed covariance analysis is not available with any of the data. Therefore, it is important to discuss covariance analysis in detail.
Covariance analysis is a method used to estimate the uncertainty in the measured quantity with considering cross-correlations, the quantities measured in this study are nuclear reaction cross-sections 09 ; 10 ; 11 ; 12 . In the present work, we provide covariance analysis of nuclear reactions 100Mo(,n)103Ru, natMo(,x)97Ru, natMo(,x)95Ru, natMo(,x)96gTc, natMo(,x)95gTc and natMo(,x)94gTc, considering micro-correlations between measurements such as -ray abundance, -ray count, incident flux, detector efficiency etc.
For the first time covariance analysis has been performed for the present nuclear reaction reactions. We measured the reaction cross-sections for the above mentioned reactions in the incident energy range 11–32 MeV, for this we have used the stacked foil activation technique. In the stacked foil activation technique, a stack of several thin foils is irradiated by an integrated-particle beam along with the monitor foil. After irradiation, the irradiated foils are placed in front of the detector for measurement of the decay gamma from the radionuclide.
The excitation functions are compared with existing experimental data available in the EXFOR data library and with theoretical calculations performed using the TALYS nuclear reaction code 13 ; 14 ; 15 ; 16 . The TALYS nuclear reaction code is a computer code system for nuclear reaction calculations based on the Hauser–Fesbach statistical model. This code has separate options for level density and optical model parameters 17 ; 18 .
The present study is organized into the following six sections. The details about experimental technique and experimental setup in section II, the details about efficiency calibration of the detector in section III, the details about covariance analysis, estimation of nuclear reaction cross-section and theoretical calculation in section IV, results and discussion in section V, the conclusion in section VI are presented.
II Experimental technique and Details
The experiment was performed at the K-130 cyclotron, Variable Energy Cyclotron Center (VECC), Kolkata, India. The alpha particles was generated from ionized helium. In this experiment, alpha particles were accelerated up to 32 0.20 MeV and the average beam current was 170 nA.
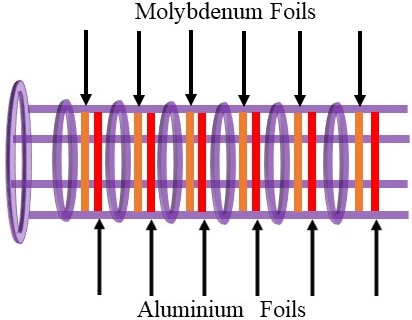
The stacked foil activation 19 ; 20 ; 21 ; 22 technique has been used to measure the reaction cross-section of alpha-induced reactions on molybdenum in the energy range from the threshold energy of contributing reaction up to 32 MeV. In this method, a series of thin target foils are placed to form the target as shown in Fig. 1 and each target foil (natMo in the present work) is followed by another material (natAl in the present work) to catch the recoils nuclides from the target foil (natMo). This catcher foil must be such that is does not produce any radioactive product in the incident particle energy range and it has also as low Z-material as possible to decrease the gamma attenuation during the measurements. Therefore a pair of Mo an Al foils will contain the total produced radioactive isotopes from the target Mo foil after irradiation. A detailed structure of the stacked foil arrangement is shown in Fig. 1. The main advantage of the stacked foil activation method is that we can find the complete excitation function curve and each target foils are irradiated with the from a single beam. The Mo and Al foils were measured simultaneously to capture the recoil products and to calculate the nuclear reaction cross sections of the products formed in the Mo foils. The energy drop in the stacked foils were calculated using the Stopping and Range of Ions in Matter (SRIM) code 23 ; 24 . The SRIM is a code that provides us details about the energy drop of incident ions and the range in the matter. Three thin metallic foils of natMo, natAl and natTi of thickness 12.85 , 13.5 and 1.80 respectively were used. We made a set of stacks by placing molybdenum foils followed by aluminum foils as the Mo-Al (10 x 10 ), and have been used 6 such sets to make a stacked target. In this experiment, the Ti foil (10 x 10 ) was used as the monitor foil to confirm the incident beam intensity and energy. The stacked target was irradiated for 2 hours by a 32 MeV alpha beam. Two collimators of 7 mm diameter were used in this experiment, one placed in front of the beam and the other placed in front of the stacked target. At the end of the experiment setup, a Faraday cup was attached for current measurement. A schematic diagram of the irradiation setup is shown in Fig. 2.
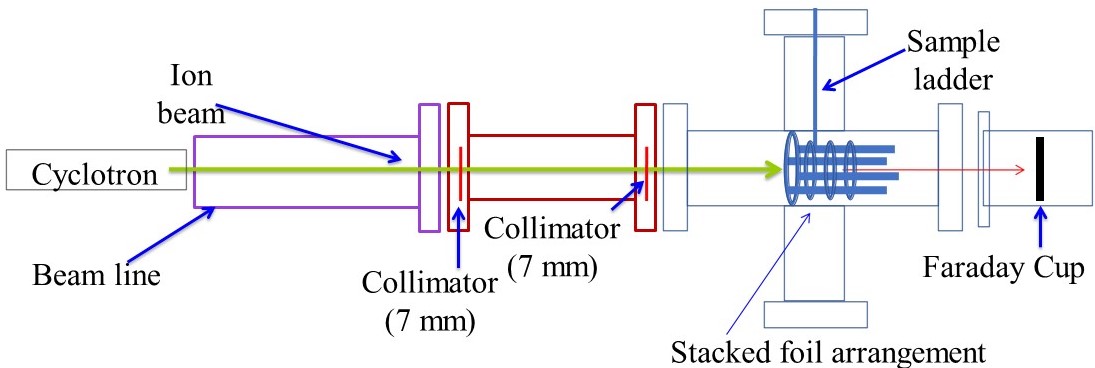
TABLE I. The value of the fitting parameter of efficiency () curve and their uncertainty
| Parameters | Value | Uncertainty |
|---|---|---|
| 0.00137 | 6.2907 | |
| 0.00912 | 4.2340 | |
| E0 (keV) | 330.9628 | 20.4224 |
TABLE II. Coincidence summing effect, correction factor, and efficiency of HPGe detectors at different gamma-ray energies with their intensities for both sample () and point source () geometries.
| (keV) | Counts(C) | Kc | |||
|---|---|---|---|---|---|
| 121.78 | 0.2853 0.0016 | 509811 764.71 | 1.032 | 0.027099 | 0.007785 0.0000605 |
| 244.69 | 0.0755 0.0004 | 93725 337.41 | 1.041 | 0.018990 | 0.005726 0.0000471 |
| 344.27 | 0.2659 0.0020 | 265271 530.54 | 1.022 | 0.014982 | 0.004589 0.0000429 |
| 411.11 | 0.02238 0.00013 | 17985 160.06 | 1.050 | 0.012399 | 0.003820 0.0000451 |
| 688.70 | 0.0085 0.0008 | 4415 94.48 | 1.007 | 0.007686 | 0.002401 0.0002321 |
| 867.38 | 0.0423 0.0003 | 18156 152.51 | 1.045 | 0.006591 | 0.002070 0.0000252 |
| 964.05 | 0.1451 0.0007 | 62252 261.45 | 1.017 | 0.006411 | 0.002019 0.0000166 |
| 1085.83 | 0.1011 0.0005 | 36755 205.82 | 0.986 | 0.005267 | 0.001663 0.0000151 |
| 1112.94 | 0.1367 0.0008 | 49937 236.20 | 1.007 | 0.005405 | 0.001708 0.0000156 |
| 1299.1 | 0.0163 0.00011 | 5351 80.26 | 1.030 | 0.004968 | 0.001575 0.0000272 |
| 1408.01 | 0.2087 0.0009 | 64230 256.92 | 1.012 | 0.004576 | 0.001453 0.0000114 |
III Gamma-ray spectrometry
The activity of the samples were measured using high purity germanium detector (HPGe) having 40 relative efficiency. In the present work, the standard point source has been used to calculate the efficiency of the HPGe detector for various gamma-ray energies. The half-life of the standard point source is T1/2 = 13.517 0.009 years and the known activity was reported on 17 May 1982 which is A Bq.

The absolute efficiency calibration of the point source for the source-detector distance 50 mm was estimated using the following equation 25 :
| (1) |
in above equation, A0 is the known activity of standard point source, the total number of count C was taken in 10000 second for -ray energy with absolute intensity () and t is the time interval from the date of a manufacturing point source to the start of measurement. Here, the summing correction factor is . When the distance between the source and absorber of the detector was 50 mm, shows a coincidence summing effect, so it should be corrected for efficiency calibration of the detector. The standard sample was a point source and our samples have a finite area, so the efficiency of the point source geometry () has to be changed for the efficiency of the sample geometry (). We have used the Monte Carlo simulation code EFFTRAN 26 ; 27 to calculate the correction factor () of coincidence summing effect and convert the efficiency of the point source () geometry to the efficiency of the sample () geometry.
The calculated efficiency value for sample source geometry () and point source geometry () placed at 50 mm from the detector absorber are given in Table II with the correction factor (KC) of coincidence summing effect.
To calculate the efficiency of a particular -ray of the product radionuclide, we have used equation 2 which is a fitting function of interpolating the point-wise efficiencies () of the -ray energy of the standard source 25 ; 28 .
| (2) |
In the above equation , , and are the fitting parameters of the measured detection efficiencies () of standard point . The value of the curve fitting parameters mentioned in equation 2 are given in Table I.
IV DATA ANALYSIS
A. Estimation of the reaction cross section
In this work, the nuclear reaction cross-sections were calculated using the following standard activation formula;
| (3) |
In the above formula 29 , the peak area counts is of a particular -ray with it’s abundance (), is the detector efficiency with dead time , is the decay constant (), (()) is the particle density in the target material, is the incident particle flux per unit time(). In equation 3, the cooling time of the irradiated target is (s) with the irradiation time (s) and the measurement time (s) of the sample source. In the present study, the uncertainty in the factors contributing to the cross-section such as the efficiency of the detector , gamma-ray intensity (), number density of atoms (), gamma-ray peak counts () etc. is also taken into account to calculate the uncertainty of the obtained cross-section.
B. Covariance Analysis
A covariance analysis is a mathematical tool that can help to describe the detailed uncertainty with the cross-correlation between different measured quantities. The principle of covariance emphasizes the formulation of physical laws using only measurements of physical quantities that can be correlated. The covariance matrix of cross-sections Iσ can be written as 30 ; 31 ;
| (4) |
Where Iσ is the covariance matrix of measured reaction cross-sections with order m m, is the covariance matrix with order n n of different attributes in activation formula (equation 2) like as -ray intensity (), detector efficiency , incident flux (), counts of the peak area (), decay constant () etc. In equation (4), is the sensitivity matrix with element;
| (5) |
Here m has value equal to total number of measured cross-sections for a particular nuclear reaction and has value equal to total number of attributes in the activation formula. Let us consider (j = 1,2,3….n), various variable parameters (which are mentioned above) required in the calculation of the cross-sections, then the covariance matrix (cx) of these variables can be obtained from the following equation 32 ;
| (6) |
Where is the correlation coefficient between two variable , and it has value . = 1, when j = k i.e., these two variable , are fully correlated.
C. Theoretical Calculations
The theoretical results for the reactions 100Mo(,n)103Ru, natMo(,x)97Ru, natMo(,x)95Ru, natMo(,x)96gTc, natMo(,x)95gTc and natMo(,x)94gTc has been done using the statistical nuclear model code TALYS. The TALYS code is a Fortran based theoretical nuclear reaction model code and used for calculating various physical observable related to nuclear reactions. In the TALYS nuclear code, we can simulate the nuclear reactions that involve neutrons, photons, protons, deuterons, tritons, 3He- and alpha-particles as a projectile, in the 1 keV - 200 MeV energy range and for target nuclides of mass 12 and heavier. The main purpose of TALYS nuclear code is to provide a complete set of answers for the nuclear reactions, all open channels and associated cross sections, spectra and angular distributions. In the TALYS nuclear code, there are 6 level densities models in which three options for the phenomenological level density model and three options for the microscopic level density 33 ; 34 . Of these six level density models, ldmodel-1 is the constant temperature and Fermi gas model, ldmodel-2 is the back-shifted Fermi gas model, ldmodel-3 is the generalized superfluid model, ldmodel-4 is the microscopic level density (Skyrme Force) from the Gorley table, ldmodel-5 is the microscopic level density (Skyrem force) from Hilaire’s combinatorial tables and ldmodel-6 is the microscale density (temperature-dependent HFB, Gogni force) from Hilaire’s combinatorial tables 35 ; 36 ; 37 ; 38 ; 39 ; 40 . The theoretical calculations for present nuclear reaction cross sections, we have used all these six level density models and also presented a comparison of the result of theoretical calculations using these different level density models with experimental data.
V RESULTS AND DISCUSSION
In this section, we have presented measured reaction cross-sections with their uncertainties and covariance matrix of natMo(,x) reactions in the energy range from the respective threshold for each contributing reaction to about 32 MeV. The obtained reaction cross-section in the present work are plotted in Fig. 4-9 along with the available experimental data from the EXFOR and theoretical results from the TALYS-1.9 code.The details of the reactions and decay data of the measured radioisotopes are shown in Table III and the value of the measured cross-sections for the present reactions along with their covariance matrix are presented in Tables IV-IX. Whichever level density model gives the best theoretical result along with the experimental data, the theoretical result is shown in a solid line, and other theoretical results are shown in a dash-dash line with different colors in the graph. The experimental data are shown in dark black circles and available experimental data in EXFOR are shown in different shapes with their error bar along the y-axis.
TABLE III. Reactios and the decay data of the measured radioisotopes.
| Radionuclide | Half-life | Reaction | Q-value | ||
|---|---|---|---|---|---|
| () | (keV) | (%) | (MeV) | ||
| 95Ru | 1.643 h | 336.40 | 69.90 | 92Mo(,n) | -9.002 |
| 1096.00 | 20.90 | 94Mo(,3n) | -26.748 | ||
| 626.83 | 17.80 | ||||
| 1178.70 | 05.10 | ||||
| 806.28 | 4.04 | ||||
| 97Ru | 2.791 d | 215.70 | 85.62 | 94Mo(,n) | -7.940 |
| 324.49 | 10.79 | 95Mo(,2n) | -15.309 | ||
| 96Mo(,3n) | -24.463 | ||||
| 97Mo(,4n) | -31.284 | ||||
| 103Ru | 39.26 d | 497.20 | 91.00 | 100Mo(,n) | -4.572 |
| 610.33 | 5.76 | 103Tc decay (100 %) | |||
| 94gTc | 293 min | 702.7 | 99.6 | 92Mo(,p+n) | -15.586 |
| 849.7 | 95.7 | 94Mo(,3n) | -33.334 | ||
| 871.1 | 99.9 | 94mTc decay () | |||
| 916.1 | 7.6 | ||||
| 95gTc | 20.0 h | 765.78 | 93.80 | 92Mo(,p) | -5.652 |
| 1073.71 | 3.74 | 94Mo(,t) | -14.918 | ||
| 947.67 | 1.95 | 94Mo(,2n+p) | -23.399 | ||
| 95Mo(,3n+p) | -30.769 | ||||
| 95mTc decay (3.88 %) | |||||
| 95Ru decay (97 %) | |||||
| 96gTc | 4.28 d | 778.2 | 99.76 | 94Mo(,p+n) | -15.528 |
| 812.5 | 82 | 95Mo(,p+2n) | -22.897 | ||
| 849.9 | 98 | 96Mo(,p+3n) | -32.051 | ||
| 1126.85 | 15.2 | 96mTc decay (98%) |
V.1 103Ru (T1/2 = 39.26 d)
The measured excitation function as a function of the incident alpha energy for the nuclear reaction 100Mo(,n)103Ru with available experimental data from the EXFOR and the TALYS nuclear code theoretical calculation is shown in Fig. 4. The radionuclide 103Ru is produced through the nuclear reaction 100Mo(,n)103Ru and by the decay of 103Tc which has short half life of 54.2 sec. The reaction cross-sections for the nuclear reaction 100Mo(,n)103Ru were obtained from a -ray of 497.08 keV energy and intensity Iγ = 91 , which decay from 103Ru radionuclide. The counting of this -ray was done after cooling time of about 2 days. It is clear from Fig. 5 that present experimental data for this reaction are found to be in good agreement with the reaction data reported by R. A. Esterlund+ et al.(1965), 41 , but our results slightly lower than available experimental data reported by H. P. Graf+ et al.(1974), 42 . The theoretical results (shown in the magenta colour by solid line) made using ldmodel-3 are best in line with the present experimental data and follow the trend of experimental results of this reaction. The measured reaction cross sections along with their uncertainties and covariance metrics for the reaction 100Mo(,n)103Ru are presented in Table IV.
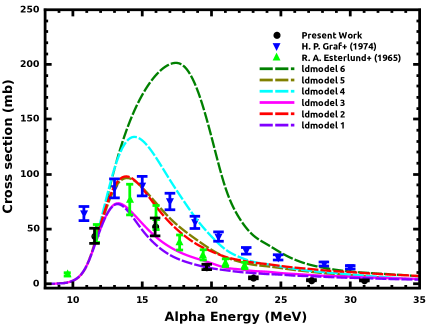

TABLE IV. The measured reaction cross sections of the reaction 100Mo(,n)103Ru with their uncertainties and covariance matrix.
| Eα (MeV) | Cross section (mb) | covariance matrix | |||||
|---|---|---|---|---|---|---|---|
| ( ) | |||||||
| 11.56 | 43.704 6.941 | 48.188 | |||||
| 15.93 | 51.831 8.207 | 56.765 | 67.364 | ||||
| 19.65 | 15.297 2.448 | 16.751 | 19.869 | 5.992 | |||
| 23.01 | 5.353 0.871 | 5.861 | 6.952 | 2.051 | 0.759 | ||
| 27.22 | 3.171 0.509 | 3.473 | 4.119 | 1.215 | 0.425 | 0.259 | |
| 31.01 | 3.043 0.492 | 3.333 | 3.953 | 1.166 | 0.408 | 0.241 | 0.242 |
TABLE V. The measured reaction cross sections of the reaction natMo(,x)97Ru with their uncertainties and covariance matrix.
| Eα (MeV) | Cross section (mb) | covariance matrix | |||||
|---|---|---|---|---|---|---|---|
| ( ) | |||||||
| 11.56 | 25.422 3.640 | 13.256 | |||||
| 15.93 | 86.794 12.430 | 45.253 | 154.511 | ||||
| 19.65 | 134.539 19.269 | 70.147 | 239.490 | 371.317 | |||
| 23.01 | 176.741 25.314 | 92.151 | 314.615 | 487.683 | 640.808 | ||
| 27.22 | 203.241 29.108 | 105.968 | 361.787 | 560.804 | 736.719 | 847.294 | |
| 31.01 | 209.541 30.010 | 109.252 | 373.000 | 578.186 | 759.553 | 873.438 | 900.654 |
V.2 97Ru(T1/2 = 2.83 d)
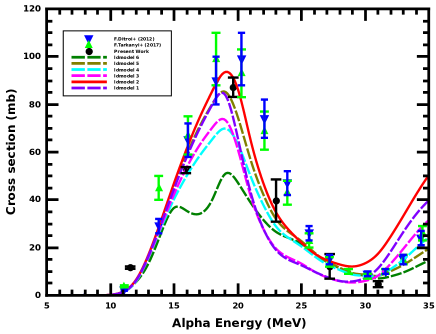
The measured excitation function as a function of the incident alpha energy for the nuclear reaction natMo(,x)97Ru with available experimental data from the EXFOR and the TALYS nuclear code theoretical calculation is shown in Fig. 6. The reaction cross-sections for the nuclear reaction natMo(,x)97Ru were obtained from a -ray of 215.70 keV energy and intensity Iγ = 85.62 , which decay from 97Ru radionuclide. The counting of this -ray was done after cooling time of about 2 days. From Fig. 6 it is clear that present experimental data for this reaction are found to be in good agreement with the reaction data reported by F.Tarkanyi+ et al (2017), and F.Ditroi+ et al (2012) 43 ; 44 . The theoretical results (shown in the red solid line) made using ldmodel-2 are best in line with the present experimental data and follow the trend of experimental results of this reaction but theortical results are lower than experimental data in the energy range 21-24 MeV. The measured reaction cross sections along with their uncertainties and covariance metrics for the reaction natMo(,x)97Ru are presented in Table V.
TABLE VI. The measured reaction cross sections of the reaction natMo(,x)95Ru with their uncertainties and covariance matrix.
| Eα (MeV) | Cross section (mb) | covariance matrix | |||||
|---|---|---|---|---|---|---|---|
| ( ) | |||||||
| 11.56 | 11.609 1.264 | 1.599 | |||||
| 15.93 | 52.467 5.158 | 5.869 | 26.609 | ||||
| 19.65 | 87.196 8.855 | 9.753 | 44.083 | 78.411 | |||
| 23.01 | 39.708 4.056 | 4.441 | 20.074 | 33.362 | 16.451 | ||
| 27.22 | 12.160 1.276 | 1.360 | 6.147 | 10.216 | 4.652 | 1.628 | |
| 31.01 | 4.669 0.521 | 0.522 | 2.360 | 3.923 | 1.786 | 0.547 | 0.272 |
TABLE VII. The measured reaction cross sections of the reaction natMo(,x)96gTc with their uncertainties and covariance matrix.
| Eα (MeV) | Cross section (mb) | covariance matrix | |||
|---|---|---|---|---|---|
| ( ) | |||||
| 19.65 | 0.256 0.071 | 0.005 | |||
| 23.01 | 1.345 0.132 | 0.008 | 0.017 | ||
| 27.22 | 21.119 1.975 | 0.131 | 0.261 | 3.903 | |
| 31.01 | 36.412 3.391 | 0.226 | 0.450 | 6.660 | 11.504 |
V.3 95Ru(T1/2 = 1.643 h)
In this work, Fig. 7 shows the measured excitation function as a function of the incident alpha energy in the energy range 11– 32 MeV of the nuclear reaction natMo(,x)95Ru with available experimental data from the EXFOR and the TALYS nuclear code theoretical calculation.
The reaction cross-sections for the nuclear reaction natMo(,x)95Ru were obtained from a -ray of 336.40 keV energy and intensity Iγ = 69.9 , which decay from 95Ru radionuclide. The counting of this -ray was done after a short cooling time. It is clear from Fig. 7 that for natMo(,x)95Ru reaction the maximum value of cross-sections at incident alpha energy is found at about 18 MeV. The present experimental data for this reaction follow the trend of the experimental data reported by F.Tarkanyi+ et al.(2017), and F.Ditroi+ et al(2012) 43 ; 44 , but our results are slightly less than the available experimental data in the incident energy range 17–25 MeV. The theoretical results (shown in the red solid line) made using ldmodel-2 are best in line with the present experimental data and follow the trend of experimental results of this reaction. The measured reaction cross sections along with their uncertainties and covariance metrics for the reaction natMo(,x)95Ru are presented in Table VI.
TABLE VIII. The measured reaction cross sections of the reaction natMo(,x)95gTc with their uncertainties and covariance matrix.
| Eα (MeV) | Cross section (mb) | covariance matrix | |||||
|---|---|---|---|---|---|---|---|
| ( ) | |||||||
| 11.56 | 6.476 0.790 | 0.624 | |||||
| 15.93 | 55.844 6.675 | 5.145 | 44.559 | ||||
| 19.65 | 100.185 12.010 | 9.241 | 79.821 | 144.246 | |||
| 23.01 | 72.122 8.660 | 6.662 | 57.547 | 103.398 | 74.995 | ||
| 27.22 | 25.325 3.043 | 2.342 | 20.237 | 36.365 | 26.225 | 9.260 | |
| 31.01 | 11.026 1.380 | 1.021 | 8.823 | 15.856 | 11.436 | 4.023 | 1.905 |
V.4 96gTc, (T1/2 = 4.28 d )
The measured excitation function as a function of the incident alpha energy for the nuclear reaction natMo(,x)96gTc with available experimental data from the EXFOR and the TALYS nuclear code theoretical calculation is shown in Fig. 7. The radionuclide 96gTc is produced through the nuclear reactions natMo(,x) and by the internal decay of 96mTc which has half life of 52 min. The reaction cross-sections for the nuclear reaction natMo(,x)96gTc were obtained from a -ray of 313.23 keV energy and intensity Iγ = 2.43 .
The counting of this -ray was done after cooling time of about 2 days, leading to complete decay of the parent. There is no experimental data available in the EXFOR data library for the nuclear reaction natMo(,x)96gTc. It is clear from Fig. 7 that the present experimental data of this nuclear reaction are found in good agreement with the theoretical results made using ldmodel-2. The measured reaction cross sections along with their uncertainties and covariance metrics for the nuclear reaction natMo(,x)96gTc are presented in Table VII.
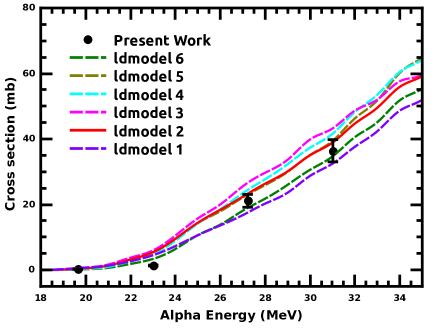
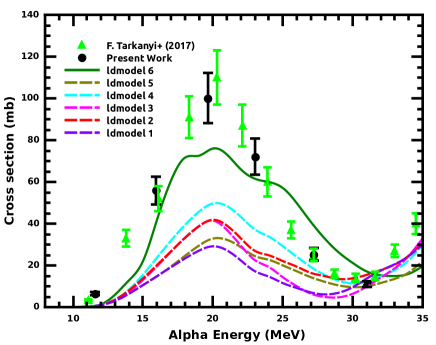
TABLE IX. The measured reaction cross sections of the reaction natMo(,x)94gTc with their uncertainties and covariance matrix.
| Eα (MeV) | Cross section (mb) | covariance matrix | |||
|---|---|---|---|---|---|
| ( ) | |||||
| 19.65 | 1.096 0.254 | 0.064 | |||
| 23.01 | 43.347 9.550 | 2.298 | 91.210 | ||
| 27.22 | 76.425 16.810 | 4.051 | 160.168 | 282.606 | |
| 31.01 | 97.846 21.518 | 5.186 | 205.043 | 361.490 | 463.061 |
V.5 95gTc(cum), (T1/2 = 20 h)
The measured excitation function as a function of the incident alpha energy in the energy range 11– 32 MeV of the reaction natMo(,x)95gTc with available experimental data from the EXFOR and the TALYS nuclear code theoretical calculation is shown in Fig. 8. The reaction cross-sections for the nuclear reaction natMo(,x)95gTc were obtained from a -ray of 1073.71 keV energy and intensity Iγ = 3.74 . There is small contribution of 3.83 % isomeric transition (95mTc, T1/2 = 61 d). To minimize the contribution of this isomeric transition we have used short cooling time. During the measurement, special attention was also paid to ensure that the contribution of the short-lived parent 95Ru (T1/2 = 1.65 h) should be minimum. From Fig. 8, it is clear that present experimental data for this reaction are found to be in good agreement with the reaction data reported by F. Tarkanyi et al 43 . The present experimental data follows the trend of the theoretical results made using ldmodel-6, but the theoretical results are slightly lower than the experimental data in the energy range of about 11–23 MeV and slightly higher in the energy range of about 24–32 MeV. The measured reaction cross sections along with their uncertainties and covariance metrics for the nuclear reaction natMo(,x)95gTc are presented in Table VIII.
V.6 94gTc, (T1/2 = 293 min)
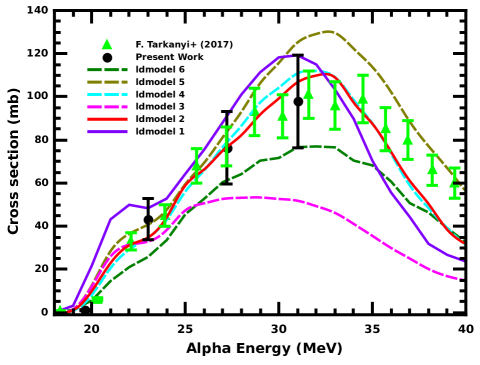
The measured excitation function as a function of the incident alpha energy for the nuclear reaction natMo(,x)94gTc with available experimental data from the EXFOR and the TALYS nuclear code theoretical calculation is shown in Fig. 9. The radionuclide 94gTc is produced through the nuclear reactions natMo(,x) and by the decay of 94Ru which has half life of 51.8 min.The short-lived isomeric state (94mTc) has a very small contribution (less than 0.1%) that can be neglected. The reaction cross-sections for the nuclear reaction natMo(,x)94gTc were obtained from a -ray of 916.1 keV energy (Iγ = 7.6 ) and The activity was measured of this -ray after the complete decay of the parent. From Fig. 9, it is clear that present experimental data for this reaction are found to be in good agreement with the reaction data reported by F. Tarkanyi et al 43 . The present experimental data are in good agreement with the theoretical results made using ldmodel-2 and ldmodel-4. The measured reaction cross sections along with their uncertainties and covariance metrics for the reaction natMo(,x)94gTc are presented in Table IX.
VI Conclusion
In the present work, the reaction cross-sections of natMo(,n)103Ru, natMo(,x)97Ru, natMo(,x)95Ru, natMo(,x)96gTc, natMo(,x)95gTc and natMo(,x)94gTc nuclear reactions in the energy range about 11-32 MeV are determined using stack foil activation technique along with covariance analysis. The documentation of detailed uncertainty analysis for these nuclear reactions and their corresponding covariance matrix are presented for the first time. The reaction cross-sections obtained for the above nuclear reactions are found to be consistent with experimental data available in the EXFOR data library and theoretical prediction from the TALYS nuclear code. The ldmodel-2 gives the best theoretical results for the nuclear reactions natMo(,x)97Ru, natMo(,x)95Ru, natMo(,x)96gTc, natMo(,x)94gTc, the ldmodel-3 gives the best theortical results for the nuclear reaction 100Mo(,n)103Ru and the ldmodel-6 gives the best theoretical results for the nuclear reactions natMo(,x)95gTc. The present data analysis of the measured reaction cross sections took into account the necessary improvements as a result of the coincidence summing factor and the geometric factor in efficiency. The present experimental results with detailed covariance analysis are important in astrophysics, nuclear medicine, and improving the nuclear reaction codes.
Acknowledgements.
The author (Mahesh Choudhary) gratefully thanks to the Council of Scientific and Industrial Research (CSIR), Government of India, for financial support in the form of Senior Research Fellowships. (File No 09/013(882)/2019-EMR-1). Also, one of the authors (A. Kumar) would like to thank the SERB, DST, Government of India [Grant No. CRG/2019/000360], and Institutions of Eminence (IoE) BHU [Grant No. 6031].We acknowledge the kind support provided by Prof. A. K. Tyagi, Director, Chemistry Group, BARC, Mumbai and Prof. Chandana Bhattacharya, Head, Experimental Nuclear Physics Division, VECC, Kolkata towards the successful execution of the experiment. We would also like to thank the Cyclotron (K-130) staff, VECC, Kolkata for providing us high quality of the beam during the experiment.
References
- (1) Qaim, Syed M., Ingo Spahn, Bernhard Scholten, and Bernd Neumaier. Radiochimica acta, 104(9), 601-624 (2016).
- (2) M. S. Uddin, A. Hermanne, S. Sudar, M. N. Aslam, B. Scholten, H. H. Coenen, S. M. Qaim, Applied radiation and isotopes, 69, 699 (2011).
- (3) B. Mukhopadhyay , and K Mukhopadhyay . J. Nucl. Med. Radiat. Ther. 2(2):1000115, (2011).
- (4) A. A. Alharbi, et al., In Radioisotopes-Applications in Bio-Medical Science. IntechOpen, (2011).
- (5) M. Sitarz, E. Nigron, A, Guertin, F. Haddad, and T. Matulewicz, Instruments, 3(1), 7 (2019).
- (6) B. Bartos, E. Kowalska, A. Bilewicz, and G. Skarnemark, Journal of radioanalytical and nuclear chemistry, 279(2), 655-657 (2009).
- (7) W. Rapp, et al., Physical Review C, 78(2), 025804 (2008).
- (8) T. N. Szegedi, et al., A. Physical Review C, 104(3), 035804 (2021).
- (9) A. Gandhi, et al., Physical Review C. 102, 014603 (2020).
- (10) A. Gandhi, et al., European Physical Journal A. 57, 1 (2021).
- (11) A. Gandhi, et al., Chinese Physics C 46 1 014002-014002-8 (2022)
- (12) A. Gandhi, A. Sharma, R. Pachuau, N. Singh, P. N. Patil, M. Mehta, and A. Kumar, The European Physical Journal Plus, 136(8), 1-17 (2021).
- (13) N. Otuka et al., Nucl. Data Sheets 120, 272 (2014).
- (14) IAEA-EXFOR Experimental nuclear reaction database, https://www-nds.iaea.org/exfor (Data retrieved on December 2021).
- (15) A. J. Koning and D. Rochman, Nucl. Data Sheets 113, 2841 (2012).
- (16) A.J. Koning, S. Hilaire and M.C. Duijvestijn, TALYS-1.0”, Proceedings of the International Conference on Nuclear Data for Science and Technology, April 22-27, 2007, Nice, France, editors O. Bersillon, F. Gunsing, E. Bauge, R. Jacqmin, and S. Leray, EDP Sciences, 211 (2008).
- (17) Mert Sekerci, Radiochimica Acta, 108(6), 459-467 (2020).
- (18) Mahesh Choudhary, Aman Sharma, A. Gandhi, Namrata Singh, and A. Kumar, IJPAP 58(05) (2020).
- (19) M. S. Uddin, K. S. Kim, M. Nadeem, S. Sudar, and G. N. Kim, The European Physical Journal A, 53(5), 1-10 (2017).
- (20) S. Takacs, M. P. Takacs, A. Hermanne, F. Tarkanyi, and R. A. Rebeles, Nuclear Instruments and Methods in Physics Research Section B: Beam Interactions with Materials and Atoms, 297, 44-57 (2013)
- (21) S. Takacs, M. P. Takacs, A. Hermanne, F. Tarkanyi, and R. A. Rebeles, Nuclear Instruments and Methods in Physics Research Section B: Beam Interactions with Materials and Atoms,278, 93-105 (2012).
- (22) T. Siiskonen, J. Huikari, T. Haavisto, J. Bergman, S. J. Heselius, J. O. Lill, T. Lonnroth and K. Perajarvi, Applied Radiation and Isotopes,67(11), 2037-2039 (2009).
- (23) J. F. Ziegler, M. D. Ziegler, and J. P. Biersack, Nuclear Instruments and Methods in Physics Research Section B: Beam Interactions with Materials and Atoms, 268(11-12), 1818-1823 (2010).
- (24) Peter Sigmund, and Schinner Andreas, Nuclear Instruments and Methods in Physics Research Section B: Beam Interactions with Materials and Atoms 410 78-87 (2017).
- (25) L. R. M. Punte et al., Phys. Rev. C 95, 024619 (2017).
- (26) T. Vidmar, Nucl. Instrum. Methods Phys. Res. A 550, 603 (2005).
- (27) T. Vidmar, G. Kanisch, and G. Vidmar, App. Radiat. Isot. 908, 69 (2011).
- (28) R. Pachuau et al., Nucl. Phys. A 992, 121613 (2019).
- (29) M. Aikawa, M. Saito, S. Ebata, Y. Komori, and H. Haba, Nuclear Instruments and Methods in Physics Research Section B: Beam Interactions with Materials and Atoms,427, 91-94 (2018).
- (30) D. L. Smith, and N. Otuka, Nuclear Data Sheets, 113(12), 3006-3053 (2012).
- (31) B. Lawriniang Journal of Radioanalytical and Nuclear Chemistry, 319(3), 695-701 (2019).
- (32) N. Otuka, Radiation Physics and Chemistry, 140, 502-510 (2017).
- (33) A. Gandhi, et al., Indian Journal of Physics 93.10, 1345-1351 (2019).
- (34) A. Gandhi, et al., Journal of Radioanalytical and Nuclear Chemistry 322.1, 89-97 (2019).
- (35) A. Gilbert and A.G.W. Cameron, Can. J. Phys. 43, 1446 (1965).
- (36) W. Dilg, W. Schantl, H. Vonach, and M. Uhl, Nucl. Phys. A 217, 269 (1973).
- (37) A.V. Ignatyuk, J.L. Weil, S. Raman, and S. Kahane, Phys. Rev. C 47, 1504 (1993).
- (38) S. Goriely, F. Tondeur, and J. M. Pearson, A Hartree-Fock nuclear mass table, At. Data Nucl. Data Tables 77, 311 (2001).
- (39) S. Goriely, S. Hilaire and A.J. Koning, Phys. Rev. C 78, 064307 (2008).
- (40) S. Hilaire, M. Girod, S. Goriely, and A. J. Koning, Phys. Rev. C 86, 064317 (2012).
- (41) R. A. Esterlund, and B. D. Pate, Nuclear Physics, 69(2), 401-422 (1965).
- (42) H. P. Graf, and H. Muenzel, Journal of Inorganic and Nuclear Chemistry, 36(12), 3647-3657 (1974).
- (43) F. Tarkanyi, A. Hermanne, F. Ditroi, S. Takacs, and A. Ignatyuk, Nuclear Instruments and Methods in Physics Research Section B: Beam Interactions with Materials and Atoms, 399, 83-100 (2017).
- (44) F. Ditroi, A. Hermanne, F. Tarkanyi, S. Takacs, and A. V. Ignatyuk, Nuclear Instruments and Methods in Physics Research Section B: Beam Interactions with Materials and Atoms, 285, 125-141 (2012).