Magnetic structures of geometrically frustrated SrGd2O4 derived from powder and single-crystal neutron diffraction
Abstract
We present the low-temperature magnetic structures of combining neutron diffraction methods on polycrystalline and single-crystal samples containing the 160Gd isotope. In contrast to other members of the SrO4 family ( = lanthanide) this system reveals two long-range ordered magnetic phases, which our diffraction data unambiguously identify. Below = 2.73 K, a = (0 0 0) magnetic structure is stabilized where ferromagnetic chains along the axis (space group ) are coupled antiferromagnetically with neighboring chains. On cooling below = 0.48 K, an additional incommensurate component modulated by = (0 0 0.42) evolves and aligned along either of the perpendicular axes for the two different Gd sites, resulting in a fan-like magnetic structure. The identification of the particular Gd sites with the magnetic order observed with neutron diffraction is facilitated by a detailed analysis of the crystal fields acting on the sites. The observed ordering phenomena underline the complex multiaxial anisotropy in this system.
I Introduction
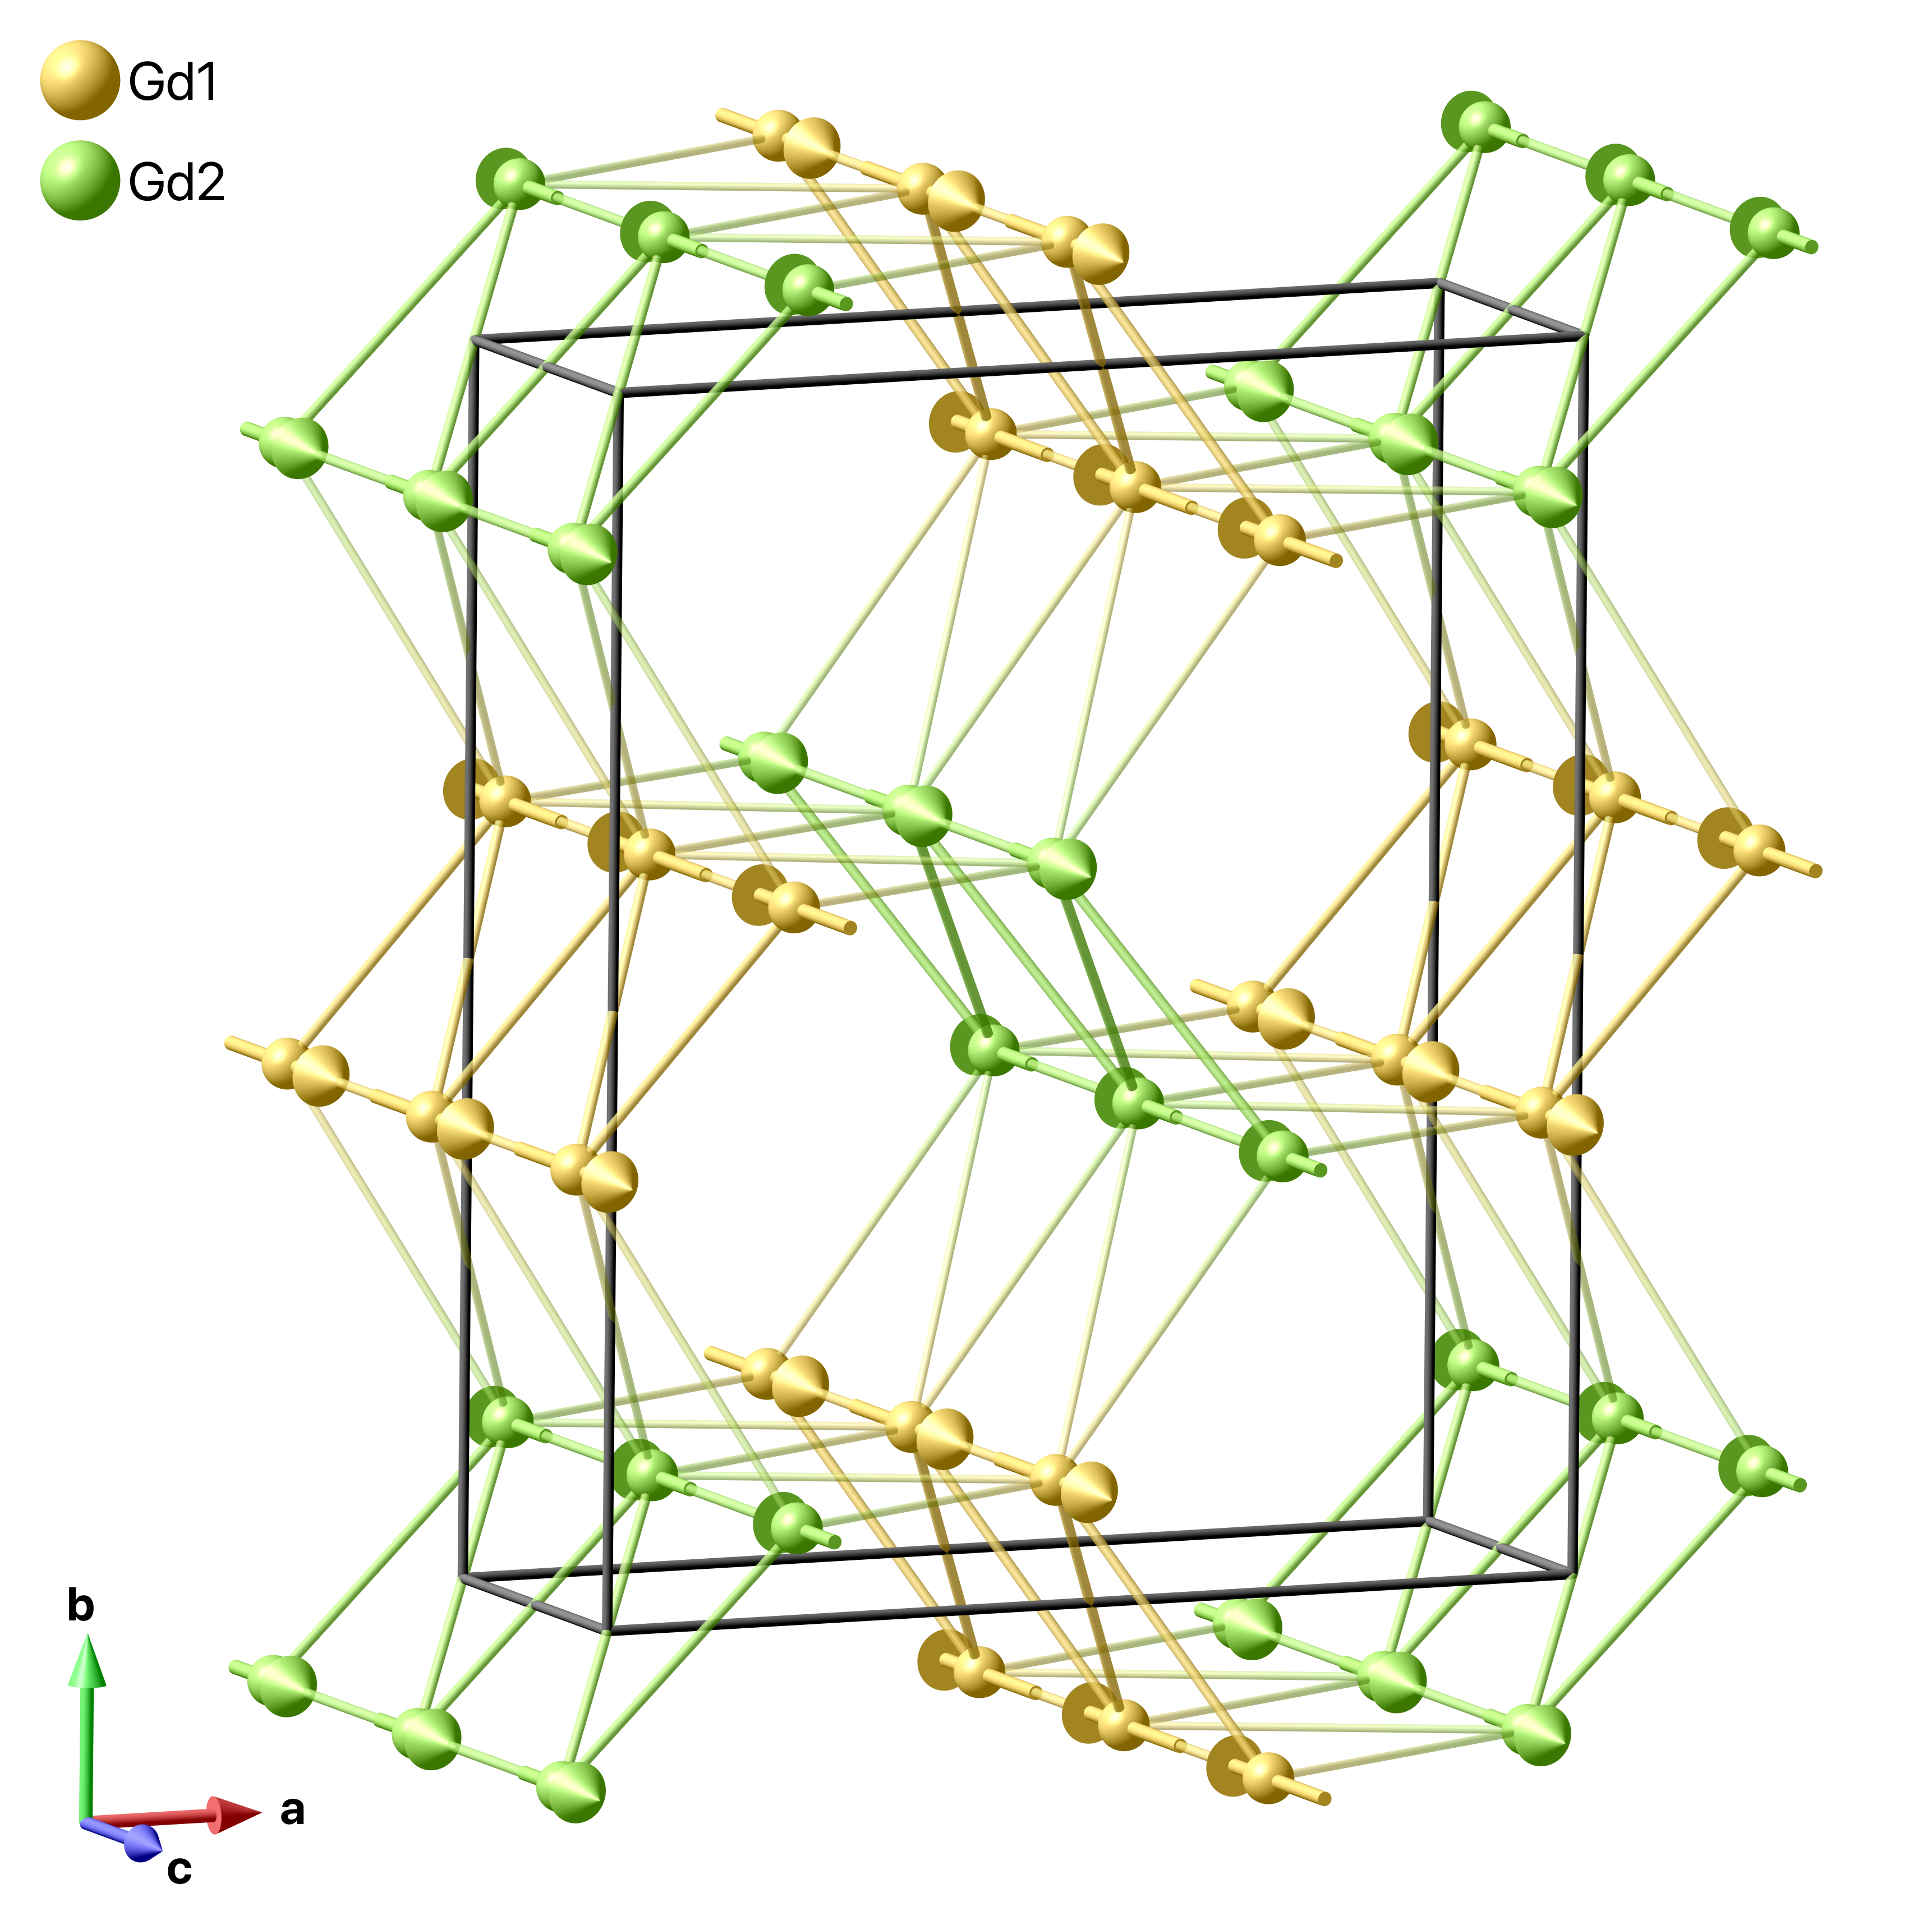
The family of rare-earth oxides with general formula , where = Ba, Sr and is a lanthanide, Karunadasa et al. (2005) has been of significant interest within the magnetism community due to its low magnetic ordering temperatures or (partial) absence of magnetic order. In its particular crystal structure (space group ) – isostructural to calcium ferrite Decker and Kasper (1957) – all atoms occupy Wyckoff position . The magnetic ions that occupy two distinct sites in the compounds form distorted hexagons in the plane which are connected along the short axis resulting in zig-zag ladders of edge-sharing triangles in a honeycomb-like arrangement (the crystal structure of this family of compounds is shown in Fig. 1 for the case of ).
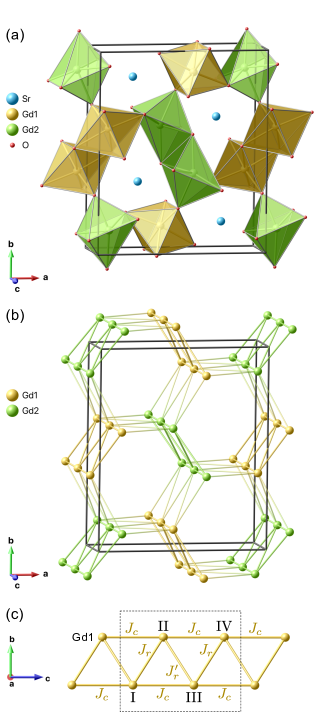
Within such zig-zag ladders built exclusively from the ions occupying either 1 or 2 sites, the nearest neighbor (NN) interactions are along the legs of the ladder, while the slightly longer bonds of the next-nearest neighbors (NNN) build the rungs of the ladder. Further neighbor interactions link the ladders between the different sites. This particular geometry, in combination with the antiferromagnetic exchange interactions, results in a strong geometrical frustration which is manifested in the suppression of magnetic ordering down to very low temperatures, complex ground states, as well as rich behavior under the application of a magnetic field like e.g. the appearance of magnetization plateaux. In fact, the members of the SrO4 family are reported to order at temperatures well below their corresponding Weiss temperatures e.g. Young et al. (2014), Karunadasa et al. (2005); Petrenko et al. (2008) and Quintero-Castro et al. (2012), or to remain (at least partially) disordered down to the lowest temperatures e.g. Petrenko et al. (2017); Gauthier et al. (2017a, b) and Ghosh et al. (2011); Young et al. (2013). The different degrees of structural distortion within the oxygen octahedra surrounding the two sites result in strongly different crystal field energies which therefore dictate the single-ion anisotropy of the system and add to the compounds’ complexity. Many compounds from the SrO4 family demonstrate highly anisotropic magnetic properties at low-temperature. It is also common for the magnetic moments on the 1 and 2 sites to behave almost independently, as the intrinsic coupling between the sites is rather limited. In some cases, a short-range order on one site coexists with a long-range order on the other Hayes et al. (2011); Young et al. (2013).
The Gd variant plays a special role among the family due to the spin-only nature of the magnetic moment (). This intrinsic property should in principle lead to a rather isotropic behavior. In addition, the spin-only nature of Gd3+ minimizes the crystal-field effects that are strong in other SrO4 materials. The large magnetic moments borne by the Gd3+ ions are likely to induce significant dipolar interactions. As a matter of fact, differs from the rest of the variants by the presence of two magnetic phase transitions at = 2.73 K and at = 0.48 K as observed by specific heat measurements Young et al. (2014).
We report in this paper on the low-temperature magnetic structures of . Investigating Gd compounds by means of neutron scattering is particularly difficult due to its extremely high absorption cross section. In this study, we use powder and single-crystal samples prepared using isotopically enriched Gd with 98% of the low-absorbing 160Gd isotope. Our investigations reveal a multi-axial anisotropy of the low-temperature magnetic phase in which – as in other SrO4 compounds – the two magnetic sites exhibit very different behavior. This behavior is unexpected for the free Gd3+ ions, but there is a natural explanation when the crystal fields acting on the Gd3+ ions within the lattice are considered.
II Experimental details
Polycrystalline samples of were prepared by the solid state method, as described in Refs. Karunadasa et al. (2005); Young et al. (2014). Stoichiometric quantities of high purity SrCO3 and isotopically enriched powders were mixed, ground and heated to 1350 ∘C in air for 48 hours. The resulting material was then isostatically pressed into rods (approximately 5 mm diameter and 30 mm long) and sintered at 1100 ∘C in air for 24 hours. The isotopically enriched was obtained from Trace Sciences International with the isotopic composition shown in Table 1. Based on the supplied chemical analysis we have calculated the average scattering length and absorption cross section to be = (0.91 - 0.02i) cm and barns, respectively. These values were used to calculate the linear absorption coefficients for the absorption corrections and for the refinements of all the diffraction data.
crystals were grown by the floating zone technique Balakrishnan et al. (2009) using a two-mirror halogen furnace (NEC SC1MDH-11020, Canon Machinery Incorporated). The growth was carried out in an argon atmosphere at a pressure of 2 bars, using a growth speed of 3 mm/h. The two rods (feed and seed) were counter-rotated at a rate of 15 rpm. From a crack-free translucent crystal boule with a length of approximately 1 cm, seven single crystal fragments were extracted. A sample of 0.0127 g that showed the best crystalline quality was chosen for the neutron diffraction experiments.
The phase purity of powder as well as quality of single-crystal samples were confirmed by means of powder X-ray and X-ray Laue diffraction, respectively. Rietveld analysis revealed traces of monoclinic Gd2O3 resulting in a powder sample purity of 98.2%. The sequence of magnetic transitions was confirmed through magnetization and specific heat experiments.
| Isotope | ( cm) | (barns) | Enrichment (%) |
|---|---|---|---|
| 152Gd | 1.0(3) | 735(20) | 0.06 |
| 154Gd | 1.0(3) | 85(12) | 0.03 |
| 155Gd | 0.6-1.7i | 61100(400) | 0.2 |
| 156Gd | 0.63 | 1.5(1.2) | 0.32 |
| 157Gd | -0.114-7.19i | 259000(700) | 0.26 |
| 158Gd | 0.9(2) | 2.2 | 0.79 |
| 160Gd | 0.915 | 0.77 | 98.4(1) |
Powder neutron diffraction (PND) experiments were carried out on the high-resolution diffractometer D2B and on the high-flux diffractometer D20 (both ILL, Grenoble) using a wavelength of Å and Å, respectively. The high-resolution experiment was performed at room temperature, whereas the high-flux data collection was done in a standard orange cryostat for measurements down to 1.45 K as well as in a dilution fridge with a base temperature of 70 mK. Due to the still non-negligible absorption of the isotopically enriched Gd the powder was packed into sachets of Cu foil in order to make use of the total height of the sample container made out of Cu and V for the dilution and standard cryostat experiments, respectively. The thickness of the powder within the sample holder is estimated to be less than 1 mm.
Single-crystal neutron diffraction experiments were performed on the D10 diffractometer (ILL, Grenoble) with a wavelength of Å supplied by the (002) reflection of a pyrolytic graphite monochromator. The instrument was equipped with a unique 4-circle dilution cryostat allowing a minimum temperature of 100 mK without being confined to a single scattering plane. An appropriate absorption correction was carried out using Mag2Pol Qureshi (2019) by drawing a convex-hull model of the sample in order to calculate the mean beam path for every single Bragg reflection measured. Irreducible representations were calculated and all single-crystal data were analyzed using Mag2Pol Qureshi (2019).
III Results and analysis
III.1 Powder neutron diffraction
| D2B = 300 K | D20 = 4 K | |||
| Atoms | ||||
| Sr | 0.7500(2) | 0.6492(2) | 0.7504(4) | 0.6489(4) |
| Gd1 | 0.4263(2) | 0.1131(1) | 0.4263(4) | 0.1135(3) |
| Gd2 | 0.4171(2) | 0.6112(1) | 0.4187(4) | 0.6116(2) |
| O1 | 0.7157(3) | 0.3187(2) | 0.7185(4) | 0.3201(4) |
| O2 | 0.6312(3) | 0.0177(2) | 0.6300(4) | 0.0167(4) |
| O3 | 0.5077(2) | 0.7845(2) | 0.5099(5) | 0.7855(3) |
| O4 | 0.9266(3) | 0.0795(2) | 0.9285(6) | 0.0778(3) |
| (Å) | 10.1312(3) | 10.1000(3) | ||
| (Å) | 12.0599(3) | 12.0395(4) | ||
| (Å) | 3.47519(9) | 3.4682(1) | ||
| 2.83 | 6.68 | |||
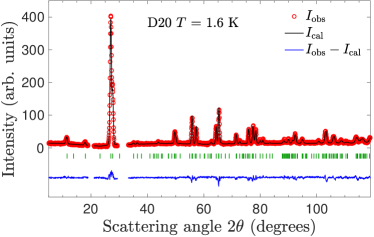
The isotopically enriched sample was measured on the high-resolution diffractometer D2B at room temperature, the results are shown in Fig. 2(a). According to the description in Sec. II a linear absorption coefficient of mm-1 was used with the employed wavelength of Å. By varying the overall scale factor, the lattice parameters, the atomic positions and an isotropic temperature factor , the best agreement factor together with a reasonable = 0.37(2) Å2 was achieved for a sample thickness of 0.77 mm which agrees very well with the prepared powder in the Cu sachets. A diffraction pattern within the paramagnetic phase was recorded at K on the high-flux diffractometer D20 [Fig. 2(b)]. In this case, the linear absorption coefficients amounts to = 2.07 mm-1 and the sample thickness was kept constant. Due to the limited range in comparison to the D2B pattern, an overall isotropic temperature factor was used which was refined to 0.25(6) Å2. The refined structural parameters from the experiments on both instruments are compared in Table 2.
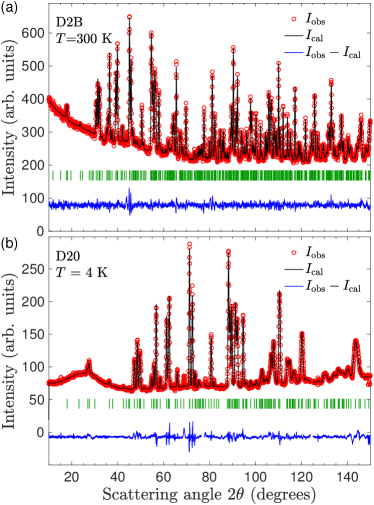
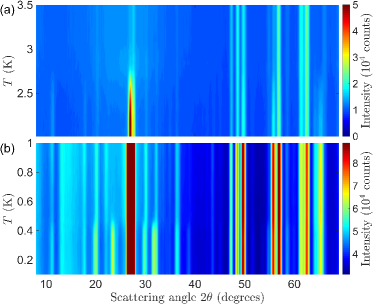
Figure 3 shows two thermodiffractograms recorded using a standard cryostat (upper panel) and a dilution insert (lower panel) tracking the magnetic phase transitions at and , respectively. For the former, diffraction patterns have been recorded for 30 minutes with a temperature interval of roughly 0.15 K, while for the latter, a counting time of 1 hour was used with steps of 25 mK around and 100 mK between 0.6 and 1 K.
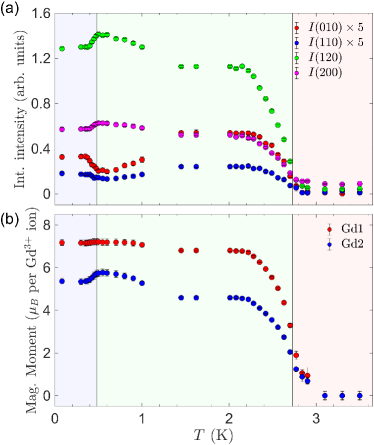
In Fig. 3(a), the appearance of a very intense magnetic peak at 2 accompanied by numerous weaker peaks (e.g. at or in ) at around K marks the onset of the magnetically ordered state, which is in a very good agreement with the previously reported = 2.73 K Young et al. (2014). In Fig. 3(b), magnetic satellites can be observed below K (e.g. at scattering angles , , or ) at positions which do not coincide with a commensurate structure. This second transition temperature also coincides with = 0.48 K reported from the specific heat measurements Young et al. (2014). While the onset of the respective magnetic phases is clearly visible in the color intensity map, Fig. 3 falls short in showing the details of the temperature dependence. Therefore, the Bragg reflections (010), (110), (120) and (200) with strong magnetic contribution at scattering angles 11.5∘, 18.0∘, 27.1∘ and 27.6∘, respectively, were integrated using a Gaussian profile on a sloping background for all temperatures. The integrated intensities (normalized to a strong nuclear peak with negligible magnetic contribution at the scattering angle of 62∘) are shown in Fig. 4(a). The diffraction patterns recorded at K in the standard orange cryostat and at K in the dilution fridge were used to bring the integrated intensities of the different instrument configurations to the same scale. The 4 selected reflections reveal a monotonic increase in intensity when entering the magnetically ordered phase below , until a saturation value is reached around 2 K. Below = 1.45 K a more intricate evolution occurs, in which the (010) and (110) reflections decrease in intensity when approaching , while the intensity of (120) and (200) reflections increase. When entering the low-temperature phase the first pair of reflections reveal a sharp increase of intensity, while the second pair behaves in the opposite way. This behaviour suggests the presence of more than one spin component, e.g. a spin canting, when approaching the second transition, as discussed below.
At this point, we were unable to derive the propagation vector of the low-temperature magnetic structure from the powder data only, which is due to the fact that not all observed magnetic satellites (inspected in the difference patterns by subtracting a higher-temperature background) originated from the low-temperature magnetic phase of (both the monoclinic and cubic modifications of Gd2O3 exhibit a magnetic phase transition between and Stewart et al. (1979); Child et al. (1967); Moon and Koehler (1975)). We therefore relied on further single-crystal experiments which are presented in Sec. III.2.
In order to derive the magnetic structure between and we have extracted the purely magnetic scattering by analyzing the difference between the patterns at 1.6 and at 4 K (nuclear background), which is shown in Fig. 5. Representation analysis was employed using the Mag2Pol program in order to derive magnetic structure models whose symmetry is compatible with the underlying crystal structure and the propagation vector = (0 0 0). 8 one-dimensional irreducible representations (irreps) are obtained for the space group (shown in Table 3) which were individually tested on the data. The best agreement was achieved with yielding a magnetic of 10.55 by keeping all previously refined parameters, e.g. the scale factor, atomic positions, etc., fixed. The only refined magnetic parameters were the components of for each of the Gd sites, which amount to 6.80(3) and 4.59(3) . Note that it is not possible to distinguish the two Gd sites in a diffraction experiment as the two possibilities yield the same results within the error bars with similar agreement factors. But the analysis of crystal fields acting on the Gd3+ ions at the Gd1 and Gd2 sites (see section III.3) indicates that the larger moment should be attributed to the Gd1 site. Given that in and the magnetic order is dominated by a single site, we have verified that this is indeed not the case in . A further clear argument for magnetic order on both Gd sites in is the absence of diffuse scattering below (not shown), while a strong diffuse signal was visible at the lowest temperatures in both Petrenko et al. (2008) and Young et al. (2012). The magnetic scattering of at K is shown together with the calculated pattern and the difference curve in Fig. 5.
| Atom | Position | ||||||||
|---|---|---|---|---|---|---|---|---|---|
| 1 | |||||||||
| 2 | |||||||||
| 3 | |||||||||
| 4 |
The resulting magnetic structure consists of chains of parallel spins along the axis, i.e. the legs of the zig-zag ladders. Such a leg is antiferromagnetically coupled not only to the second leg of the same Gd site forming the zig-zag ladder (at a distance of 3.62 Å), but also to the 2 neighboring ladders of the respectively other Gd site (at distances of 3.80 Å and 4.13 Å). The magnetic structure is depicted in Fig. 6.
Having established the magnetic structure at K we now return to the peculiar temperature dependence of the magnetic intensities below K shown in Fig. 4(a). Although the variation of intensity for different Bragg reflections - and therefore different projections of the magnetic moments - might indicate the evolution of a secondary spin component besides the main component along the axis, it can be shown that the magnetic structure (as pictured in Fig. 6) does not qualitatively change. For that purpose, all diffraction patterns below 3.3 K (excluding the satellite reflections for patterns below ) were analyzed using the same model, i.e. a single component within symmetry, showing no necessity to include a further spin component. The resulting temperature dependence of the magnetic moments of the Gd1 and Gd2 sites is shown in Fig. 4(b). While both sites show a steady increase when cooling through , it is the Gd2 site which shows a stronger increase when approaching and a more pronounced drop when entering the low-temperature phase. The relation to the intensities shown in Fig. 4(a) becomes clear when looking at the magnetic structure factors. While the magnetic structure factors of (120) and (200) reflections are proportional to the sum of the Gd1 and Gd2 moments, those of the (010) and (110) reflections are actually proportional to the difference. Hence, the fact that (Gd2) approaches and then departs from the relatively stable value of (Gd1) on cooling towards and cooling through , respectively, is entirely responsible for the peculiar temperature dependence of the magnetic intensities.
III.2 Single-crystal neutron diffraction
A nuclear data set consisting of 155 unique reflections was recorded at 10 K in order to fix the nuclear structure parameters and the scale factor for the subsequent magnetic structure analysis. The refined parameters were the atomic positions, the isotropic temperature factors (constrained to be the same for the same elements), the scale factor and the the extinction coefficients according to an empirical Shelx-like model Sheldrick (2008). A linear absorption coefficient of mm-1 was introduced for the wavelength of Å. We note that the data collection range was rather limited, it only extends to = 0.36 Å-1 which results in relatively high values for the refined isotropic temperature factors and its standard deviation [of the order of Å2]. The relatively large value is related to the imperfect absorption correction. Nevertheless, the atomic positions (shown in Table 5) are the same to within error when compared with the powder results and agreement with the observed data is excellent as evidenced by . We also want to emphasize the importance of an appropriate absorption correction as the refinement on an uncorrected data set yields .
| Atom | Position | ||||
|---|---|---|---|---|---|
| 1 | |||||
| 2 | |||||
| 3 | |||||
| 4 |
| Atoms | ||
|---|---|---|
| Sr | 0.748(3) | 0.648(2) |
| Gd1 | 0.425(4) | 0.113(2) |
| Gd2 | 0.416(4) | 0.612(2) |
| O1 | 0.716(3) | 0.315(3) |
| O2 | 0.632(4) | 0.015(3) |
| O3 | 0.507(3) | 0.787(3) |
| O4 | 0.926(3) | 0.078(3) |
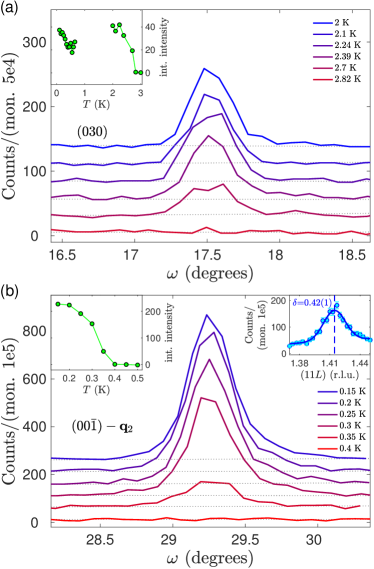
On cooling below we observe a significant increase in the intensity of the (030) reflection due to the onset of long-range magnetic order [Fig. 7(a)]. The inset in Fig. 7(a) shows the integrated intensities as a function of temperature revealing a transition temperature of slightly below 2.8 K, in a good agreement with the published value of = 2.73 K. Although for clarity the raw data below 1 K are not shown in the main panel, the integrated intensities are added to the inset showing qualitatively the same temperature dependence as derived for the (010) reflection from the powder data (see Fig. 4).
The principal magnetic structure was investigated at = 700 mK, i.e. just above , and at the lowest attainable temperature = 100 mK using a dataset of 271 unique reflections. The refinement clearly confirmed the solution derived from the powder measurements: we find the magnetic moments of the Gd1 and Gd2 sites to be 6.4(2) and 4.9(2) at mK () and 6.8(2) and 4.3(2) () at mK, which is in good agreement with the D20 data, although the values resulting from the powder refinement tend to be a bit higher (cf. Fig. 4). However, it has to be stressed that even with a 98.4(1)% 160Gd enrichment the absorption effects are still quite high and that modeling these effects is rather difficult, especially for a single-crystal sample. The relatively small discrepancies are therefore a natural consequence of the crystal shape approximation and the thickness estimation of the powder sample, which both directly affect the resulting magnetic moment values.
To derive the low-temperature magnetic structure we performed scans along the high-symmetry directions in reciprocal space at mK in order to detect any magnetic scattering not present above 500 mK. We found such satellites at the positions modulated by the propagation vector = (0 0 0.42) which is shown for the (111) + reflection in the top right inset of Fig. 7(b). The main panel of Fig. 7(b) shows the rocking curves of the (00) - reflection between 0.4 and 0.15 K confirming the transition temperature . From the top left inset of Fig. 7(b) - showing the integrated intensities of the (00) - reflection as a function of temperature - the onset of the low-temperature magnetic phase seems to be located at a slightly lower temperature, which can be explained by a temperature gradient between the sample and the Cernox temperature sensor.
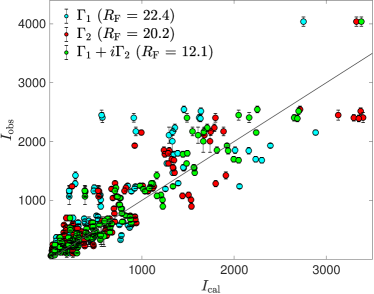
As for the high-temperature magnetic phase, representation analysis was employed in order to derive the magnetic structure models. The calculation for space group and a propagation vector = (0 0 0.42) reveals 4 one-dimensional irreducible representations which are listed in Table 4. The 4 models were tested individually on a data set containing 170 unique reflections. Fair agreement was observed for the models and , both having values of slightly over 20, which is far from a convincing refinement. For , a strong magnetic moment along the axis is found for one of the two Gd sites, whereas the symmetry favors the moment to be lying along the axis. With both models not being sufficiently well adapted to describe the experimental data, we decided to mix the basis vectors and (only the and components) in phase quadrature, effectively reducing the magnetic symmetry of the system. This approach resulted in a reasonably good refinement with an . Figure 8 compares the observed and calculated intensities for the models , and .
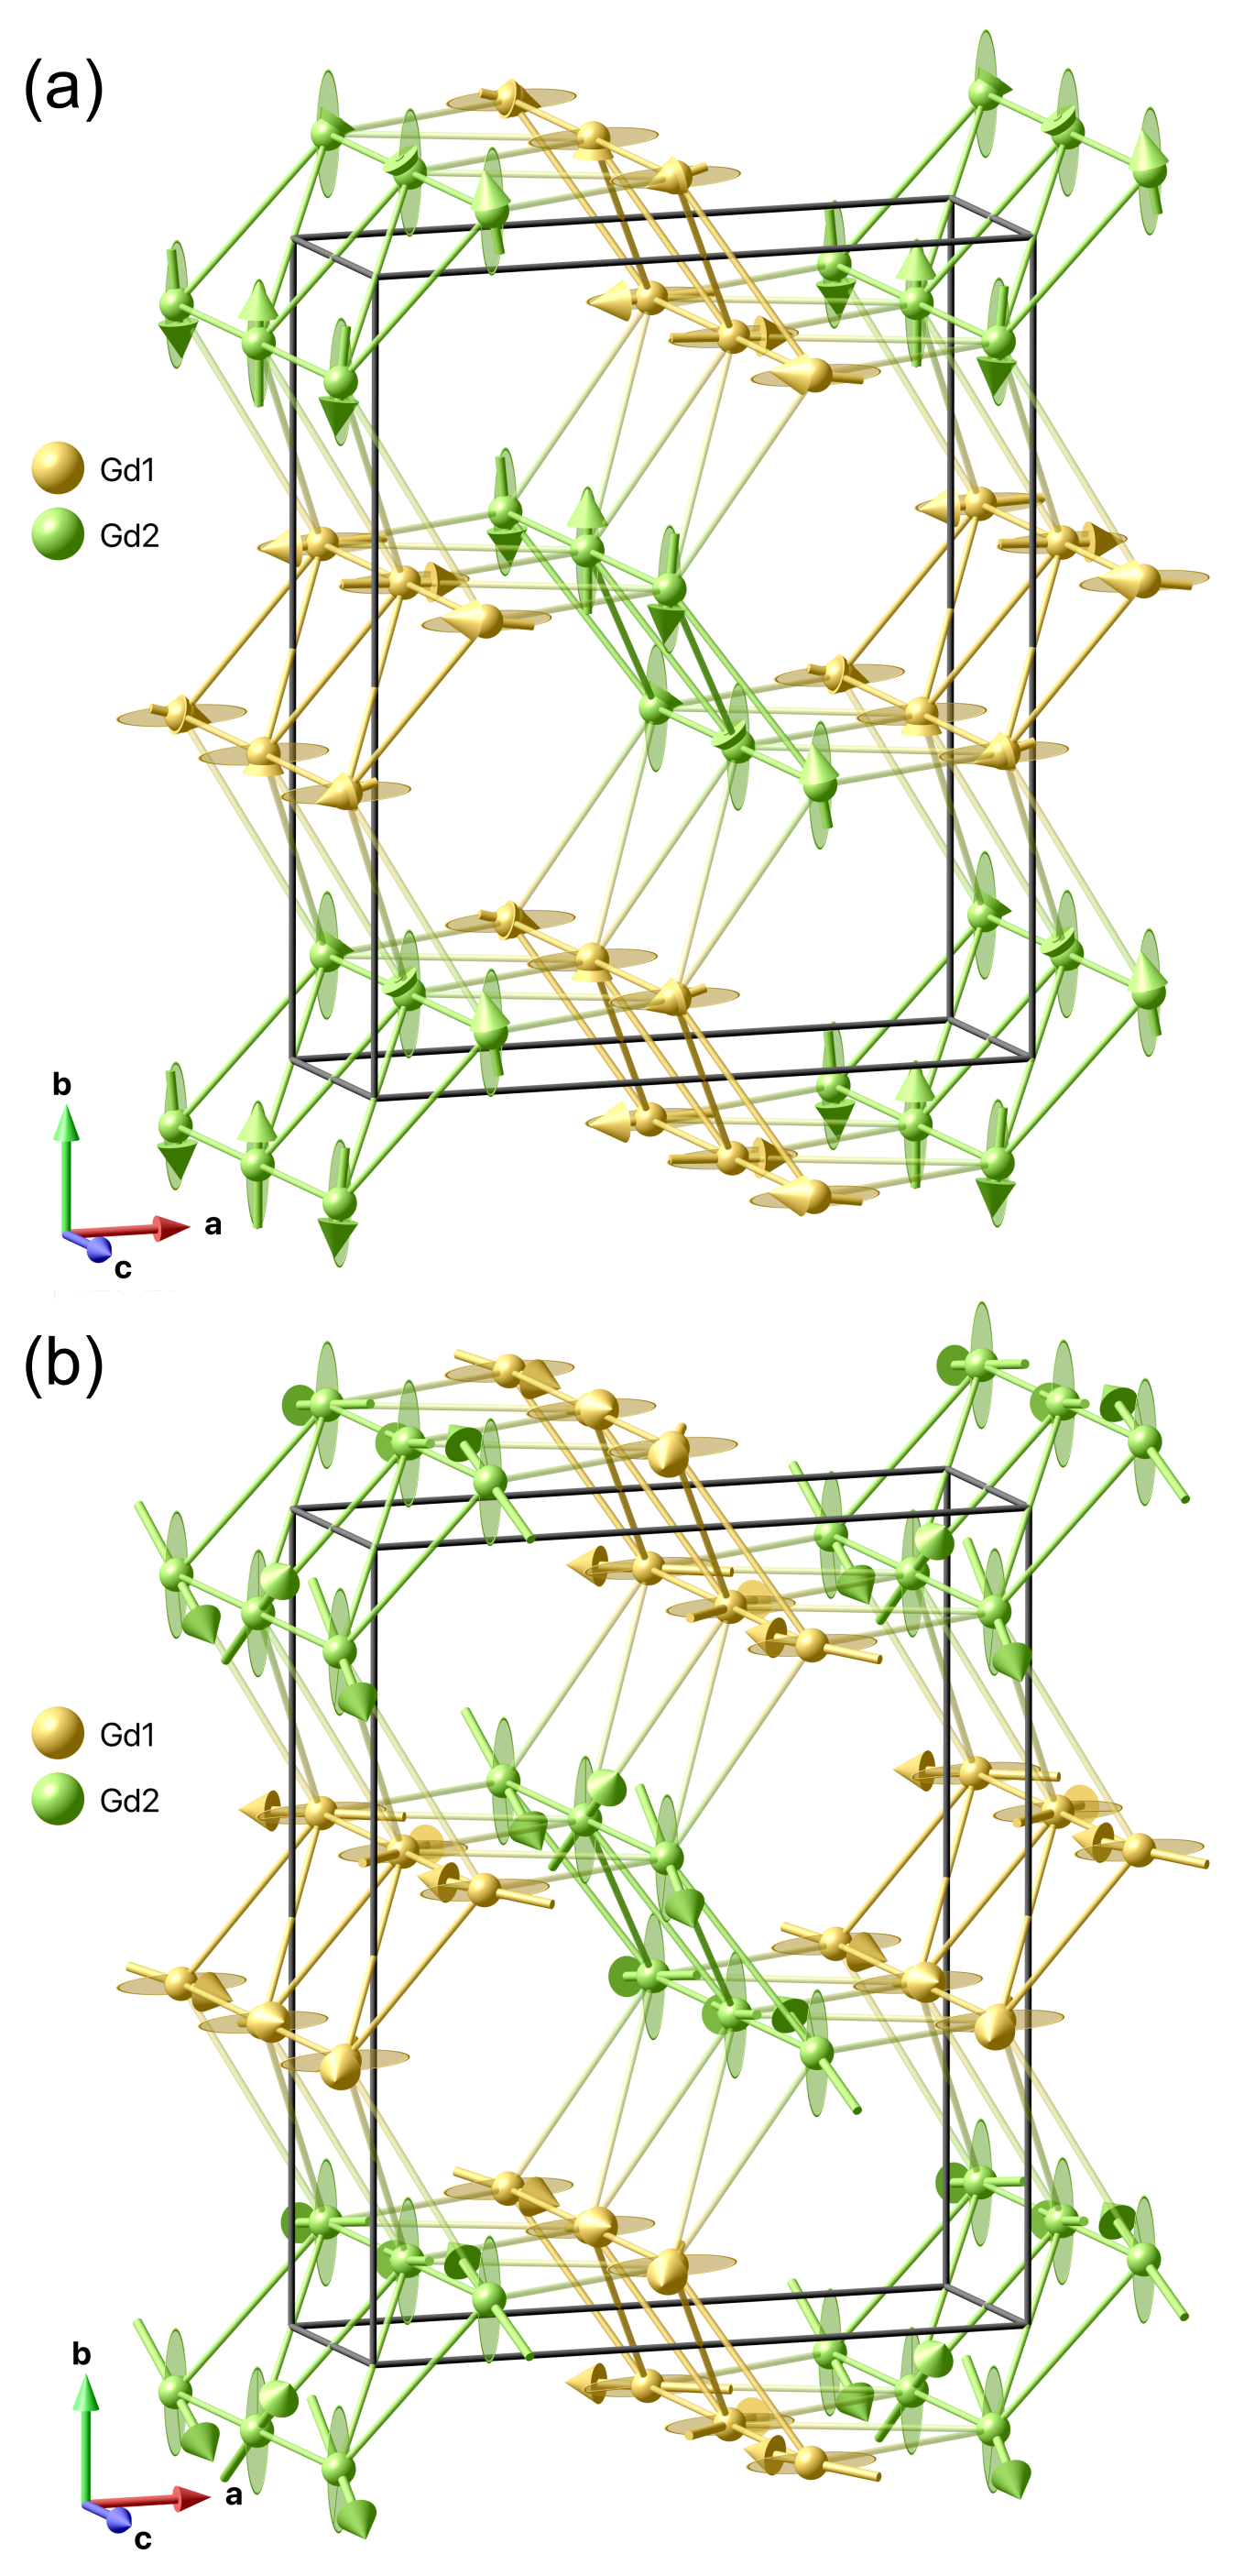
Interestingly, the moment on the Gd1 site is primarily aligned along the axis, while the moment on the Gd2 site is mostly parallel to the axis. At this point it has to be stressed again that our diffraction data are not capable of distinguishing between the two Gd sites, i.e. a similar agreement can be achieved by swapping the sites. A significant non-zero component perpendicular to the main component within the symmetry results in a helical modulation where the spin-rotation traces an elongated ellipse. The refined complex Fourier coefficients are given by and . The magnetic structure only containing the component is shown in Fig. 9(a). By combining the component which is aligned along the axis with the helical component of within the plane one obtains a conical structure, which, due to its elongated envelopes, is better described as a fan-like structure. The ellipses at the atomic positions represent the elongated spin-rotation plane and therefore the local site anisotropy in the plane. The superposition of the two components yields a maximum moment amplitude of 8.2(2) and 6.5(2) for the Gd1 and Gd2 site, respectively.
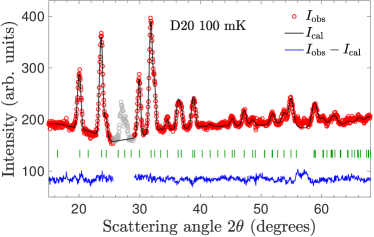
We have tested the magnetic structure model on our D20 powder data at dilution fridge temperatures. For that purpose, a difference pattern was calculated by subtracting a 1-K background from the scattering at 100 mK which yields the isolated magnetic satellites. Note that the difference on commensurate positions (cf. Fig. 4) could be safely excluded from the refinement for the very strong (120) and (200) reflections (the absolute (120) intensity being approximately 20 times stronger than the strongest satellite reflection) and that the amount on other positions is marginal in comparison to the strong satellite intensities. The agreement between the model derived from the single-crystal data with the powder data is excellent as underlined by a magnetic . By refining the coefficients of the basis vectors of both Gd sites we obtain and . In comparison, the refined magnetic moments are slightly more than different than the single-crystal values, which, however, amounts to less than 5% for the main axes of the elliptical envelopes. The superposition of the magnetic moments modulated by and amount to a maximum moment amplitude of 8.12(4) and 6.55(5) for Gd1 and Gd2, respectively, in excellent agreement with the single-crystal results. At this point we would like to reiterate that the refined moment size is strongly affected by the applied absorption correction, for which magnetic moments higher than the theoretical value is neither an unusual nor a contradicting result. We recall that the calculation of the absorption cross section is based on the chemical analysis of the Gd2O3 starting material. Any uncertainty - especially for the highly absorbing Gd isotopes - can have a big impact on the linear absorption coefficient. The refined value of the incommensurability is = 0.410(1). Figure 10 shows the observed pattern, the calculated pattern and the difference curve.
III.3 Modeling of the magnetic properties of
| Gd1 | |||||||
| 0 | (0) | 0 | (0.09) | 0 | (0.09) | 13.98 | (13.54) |
| 0.28 | (0.31) | 0.44 | (2.70) | 0.46 | (2.33) | 10.01 | (8.60) |
| 0.49 | (0.53) | 1.76 | (5.58) | 0.94 | (7.40) | 5.89 | (3.31) |
| 0.62 | (0.80) | 7.40 | (6.00) | 8.60 | (12.45) | 1.91 | (0.27) |
| Gd2 | |||||||
| 0 | (0) | 2.78 | (1.52) | 13.58 | (13.5) | 0 | (0.56) |
| 0.92 | (0.55) | 1.43 | (3.41) | 9.70 | (7.94) | 0.54 | (4.19) |
| 1.51 | (1.01) | 5.0 4 | (8.67) | 4.97 | (2.51) | 5.21 | (2.92) |
| 1.94 | (1.64) | 12.44 | (13.70) | 2.3 1 | (1.25) | 2.32 | (0.31) |
In order to assign the values of the magnetic moments of the Gd3+ ions measured in the magnetically ordered phases to a particular crystallographic site and also to extract information about the magnetic interactions in we first consider the spectral and magnetic properties of the non-interacting Gd3+ ions positioned at the Gd1 and Gd2 sites as well as the crystal fields (CF) affecting them. A single-ion Hamiltonian, , contains only two terms, a free ion () and the CF interaction (). The free ion Hamiltonian operating in the total space of 3432 states of the electronic 4 configuration is written in the standard form Carnall et al. (1989). For the initial simulations, we used the set of CF parameters determined previously for the Er3+ ions (ground state configuration 4) at the Er1 and Er2 sites in in Ref. Malkin et al. (2015). Such a choice is permissible given a typically monotonic variation of the CF parameters along the lanthanide series in the isostructural compounds. We obtained the energies of the CF sublevels (Kramers doublets) and the corresponding wavefunctions for all electronic multiplets of the Gd3+ ions at Gd1 and Gd2 sites by numerical diagonalization of the single-ion Hamiltonian.
On the other hand, the electron paramagnetic resonance spectra of an isolated Gd3+ impurity in the isostructural diluted paramagnet SrY2O4:Gd (0.5 at.%) were successfully described by the effective spin-Hamiltonian, , operating in the truncated basis of states of the 8S7/2 multiplet Gabbasov et al. (2019). The sets of parameters in the spin-Hamiltonians for Gd3+ ions substituting for Y3+ ions in two pairs of magnetically nonequivalent Y1 or Y2 sites in the unit cell were found from the analysis of the angular dependencies of the resonant magnetic fields Gabbasov et al. (2019). The two approaches, based on the CF Hamiltonians assigned to specific positions of the rare earth ions in the crystal lattice and the spin-Hamiltonians introduced in Ref. Gabbasov et al. (2019), bring about qualitatively similar energies of the four CF sublevels of the ground state multiplet 8S7/2 (see Table 6) and the corresponding -factors. Thus, it is possible to identify different spin-Hamiltonians with particular Gd1 and Gd2 sites in agreement with the notation used previously in Ref. Gabbasov et al. (2019). A relatively large total splitting of about 2 K of the ground multiplet correlates well with a larger deformation of an oxygen octahedron at the Gd2 sites. A strong anisotropy of the -factors presented in Table 6 begins to play a role at low temperatures only when the energies of the thermal excitations become comparable to the zero-field splitting of the ground state multiplet.
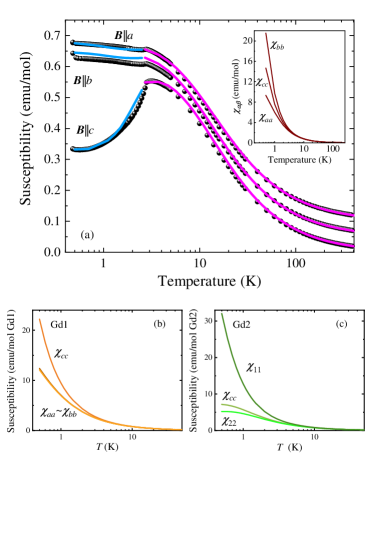
The components of the single-ion magnetic dc susceptibility tensors of the Gd3+ ions at the Gd1 and Gd2 sites for temperatures in the range from 0.5 to 250 K were calculated by making use of the corresponding spin-Hamiltonians, the results averaged over the two equally populated Gd1 and Gd2 sites are presented in Fig. 11(a) (inset) and the temperature dependencies of the main values of the susceptibility tensors (, , and ) at the Gd1 and Gd2 sites are shown in Figs. 11(b) and 11(c). One of the main axes of the susceptibility tensors coincides with the crystallographic axis. In the plane, the susceptibility tensor at the Gd1 sites is practically isotropic, but there is a remarkable anisotropy at the Gd2 sites at low temperatures where the main axis corresponding to the largest value of the susceptibility, , is tilted from the axis by approximately at magnetically non-equivalent sites. Thus, the single-ion magneto-crystalline anisotropy points to a possible easy-axis type of ordering of the magnetic moments at the Gd1 sites along the axis and a more complex, in particular, canted type of ordering of the magnetic moments at the Gd2 sites in the -plane.
Next, we determined the values of exchange integrals in isotropic exchange interactions between the Gd3+ ions from modeling the dc-susceptibilities of the concentrated magnet measured in Ref. Young et al. (2014). Simulations were performed in the framework of the self-consistent four-particle cluster model that was derived in the study of the isostructural erbium oxide Malkin et al. (2015). The Hamiltonian of a cluster in a zig-zag chain [see Fig. 1(c)] operating in the space of states belonging to ground multiplets of four Gd3+ ions contains a sum of spin-Hamiltonians corresponding to the Gd1 and Gd2 sites, magnetic dipole and exchange interactions between the first and second neighbors in the zig-zag chain (along rungs and legs, respectively, of a ladder formed by a chain propagating along the axis), Zeeman interactions of all four ions with the external magnetic field and of the outer ions in a cluster (labeled in Fig. 1(c) with I and IV) with the auxiliary magnetic field determined from a condition of equal susceptibilities of all ions in a selected cluster. Interactions between the selected cluster and other clusters in all the zig-zag chains were taken into account by making use of the mean-field approximation.
| (1) | ||||
Here, ( Gabbasov et al. (2019), ) and are the magnetic and spin moments, respectively, of the corresponding Gd3+ ion, and are the local magnetic fields affecting the outer and inner ions in a cluster, respectively, the three-dimensional matrices , , and determine magnetic interactions between the Gd3+ ions and involve contributions from dipole-dipole and isotropic exchange interactions. The explicit expressions for the local magnetic fields were presented in Ref. Malkin et al. (2015). Note, the magnetic dipole interactions were considered exactly using the Ewald method in computations of the corresponding lattice sums. The results of the fitting of susceptibilities of in the paramagnetic phase are shown in Fig. 11(a). Table 7 contains parameters of the exchange interactions used in the final computations which are compared with literature data Hasan and Southern (2017) and parameters of the dipolar interactions calculated by making use of the structural parameters from Table 5.
| Bond | Length | ||||||||
|---|---|---|---|---|---|---|---|---|---|
| (Å) | Hasan and Southern (2017) | ||||||||
| Gd1-Gd1111The corresponding parameters refer to the matrices . | 3.458 | 19.4 | 51.8 | 15.0 | 15.0 | -30.0 | 0 | 0 | 0 |
| Gd2-Gd2111The corresponding parameters refer to the matrices . | 3.458 | 65.9 | 51.8 | 15.0 | 15.0 | -30.0 | 0 | 0 | 0 |
| Gd1-Gd1222Parameters of these bonds refer to the matrices (upper signs) and (lower signs). | 3.547 | 58.2 | 131 | 6.3 | -10.4 | 4.0 | 13.5 | 8.6 | 15.5 |
| Gd2-Gd2222Parameters of these bonds refer to the matrices (upper signs) and (lower signs). | 3.610 | 42.6 | 137 | 4.6 | -8.6 | 4.2 | 13.8 | 8.9 | 14.1 |
| Gd1-Gd2 | 3.839 | -19.4 | 62.0 | ||||||
| Gd1-Gd2 | 4.047 | 35.0 | 62.0 | ||||||
It is seen in Fig. 11 that the responses of to an external magnetic field are strongly suppressed at low temperatures (by more than an order of magnitude) as compared to those for a system of noninteracting Gd3+ ions in the same crystal fields. As a consequence of strong antiferromagnetic interactions within the gadolinium triangles in the zig-zag chains, is a strongly frustrated magnet. However, as follows from magnetometry Young et al. (2014) and neutron diffraction data presented above, with decreasing temperature the geometrical frustration is overcome by long-range ferromagnetic dipolar interactions along the legs of the ladders, and undergoes a phase transition accompanied by lining up of magnetic moments along the legs but with different directions in the neighbor legs because of strong exchange and dipolar antiferromagnetic interactions along the rungs of the ladders.
The transition temperature was estimated from a condition of a singular response of on the staggered magnetic field having opposite directions along the neighbor legs. The corresponding “antiferromagnetic” susceptibility was calculated by making use of exchange integrals from Table 7 and the cluster model. The equation has a solution at K. This value is overestimated because of neglecting thermal fluctuations in the framework of the mean-field approximation, but it is close to the experimental value of 2.73 K.
Further, we calculate the self-consistent spontaneous magnetic moments of the Gd3+ ions at the Gd1 and Gd2 sites considering four-particle clusters in the zig-zag chains embedded into the crystal magnetically ordered in accordance with the magnetic structure described above. In particular, at = 0.7 K, we obtained absolute values of 6.5 and 4.3 for magnetic moments along the axis at the Gd1 and Gd2 sites, respectively, which agree qualitatively with the neutron diffraction data. The calculated temperature dependencies of the spontaneous moments for K can be approximated by the fractional power function .
Finally, we calculate the temperature dependencies of the dc susceptibilities in the magnetically ordered phase for temperatures using the cluster Hamiltonian supplemented by the energies of the exchange and dipolar interactions between the ions in a cluster and surrounding ions with temperature dependent spontaneous magnetic moments. The results of the calculations presented in Fig. 11 agree satisfactorily with the experimental data Young et al. (2014). Thus, we believe that the obtained set of parameters of the constructed microscopic model presented in Table 7 is physically meaningful.
IV Discussion
The results presented above testify to the highly complex magnetic arrangements in . Understanding of the mechanisms which govern the long-range magnetic ordering and the selection of a particular direction for the magnetic moments as well as the anisotropy of their correlation functions in the multi-sublattice gadolinium compounds remains challenging.
In the case of the isotropic exchange interactions, the magnetic anisotropy is induced by the CF interaction (single-ion anisotropy) and the long-range dipolar interactions. However, the dipolar interactions also depend on the single-ion physics through the -factors of the CF sublevels. In , the lowest Kramers doublets in the ground state multiplet 8S7/2 have a nearly Ising-type magnetic anisotropy with approximately the same values of the -factors but along orthogonal directions (along and normal to the zig-zag chains) at the Gd1 and Gd2 sites, as can be seen in Table 6. Despite a rather large magnetic susceptibility of the Gd2 site along the axis compared to the susceptibility along the axis of the Gd1 site (note, the susceptibilities involve contributions from all CF sublevels mixed in the external magnetic field), the spontaneous magnetic moments on both sites are parallel to the axis in the phase between and . The observed magnetic structure of a simple Neel type in the zig-zag chains with the propagation vector = (0 0 0) appears likely due to the dominant role of the strong dipolar interaction which forces parallel alignment of the moments in the chains. This conjecture agrees well with the results of the Monte-Carlo simulations in Ref. Hasan and Southern (2017). The model used in the simulations consisted of the classical Heisenberg spins coupled by the exchange and the dipolar interactions whereas the spin-orbit interactions (and crystal-field effects) were presumed to be small. It was found that for a system to demonstrate a double phase transition in zero field, both the exchange and dipolar terms need to be included, otherwise the second, lower-temperature transition was absent.
A more puzzling question concerns the origin of the incommensurate state at the lowest temperature and the complex temperature evolution of the ground state of in general. One could suppose that the additional components of the magnetic moments stabilized along the axis at the Gd2 sites appear due to the increasing population of the ground state doublet with deceasing temperature. The origin of the components of the magnetic moments along the axis at the Gd1 sites has only a rather qualitative explanation. As was mentioned above, the susceptibility tensor is practically isotropic in the -plane at the Gd1 sites [see Fig. 11(b)], but a weak anisotropy arises at temperatures below 1 K. In particular, the calculated magnetic moments at K in the magnetic field T along the and axis equal 5.27 and 5.23 , respectively. A marginally larger value for the axis hints at a more preferable orientation along this direction, but a detailed simulation of the local magnetic fields in the incommensurate phase goes way beyond the scope of this work.
It has to be noted that the previous bulk properties measurements Young et al. (2014) were mostly focused on the intermediate temperature phase, , while a detailed study of the low-temperature phase, , was limited by the experimental capabilities. Given the incommensurate nature of the low-temperature phase established in this study, an extension of the bulk properties measurements to temperatures well below might offer new insight into an intriguing magnetic state.
V Conclusions
We have presented an extensive neutron diffraction study using both powder and single-crystal samples of containing isotopically enriched 160Gd in order to decrease absorption effects and render the investigation of the low-temperature magnetic structures possible. Apart from being the only member of the SrO4 family which reveals two magnetic phase transitions we observe further properties which give the Gd compound a unique role within these geometrically frustrated systems. In fact, all three orthorhombic directions are present in the local anisotropy of the Gd1 and Gd2 sites. Incontestably, the easy direction of the system is the one along the chains parallel to the axis as evidenced by the collinear magnetic structure which is stabilized below . Nevertheless, at the unique second phase transition the fundamentally different behavior between the two sites - emerging from different crystal-field surroundings as a consequence of different Gd-O octahedra distortions - is manifested in the magnetic structure. Each site develops an additional helically modulated component perpendicular to the collinear component. The envelope which the spin traces upon translation along is strongly elongated along the or the axis for Gd1 and Gd2, respectively, resulting in a superposed spin configuration which can be described as fan-like.
An interesting aspect of this study is that the reported results might not be of importance from solely fundamental research viewpoint, as there are potentially two avenues for exploiting in pure and lightly doped forms in applications, the luminescence Singh et al. (2015); Singh and Manam (2016); Singh et al. (2017); Sun et al. (2018) and the low-temperature magnetocalorics Jiang et al. (2018); Palacios et al. (2022).
ACKNOWLEDGMENTS
We would also like to acknowledge the expertise and dedication of the low-temperature group at the Institut Laue-Langevin. We are grateful to M.R. Lees for careful reading the manuscript and helpful suggestions. The work at the University of Warwick was supported by EPSRC through grants EP/M028771/1 and EP/T005963/1. B.Z.M. acknowledges the support by the Russian Science Foundation, Project No. 19-12-00244.
References
- Karunadasa et al. (2005) H. Karunadasa, Q. Huang, B. G. Ueland, J. W. Lynn, P. Schiffer, K. A. Regan, and R. J. Cava, Phys. Rev. B 71, 144414 (2005).
- Decker and Kasper (1957) B. F. Decker and J. S. Kasper, Acta Cryst. 10, 332 (1957).
- Young et al. (2014) O. Young, G. Balakrishnan, M. R. Lees, and O. A. Petrenko, Phys. Rev. B 90, 094421 (2014).
- Petrenko et al. (2008) O. A. Petrenko, G. Balakrishnan, N. R. Wilson, S. de Brion, E. Suard, and L. C. Chapon, Phys. Rev. B 78, 184410 (2008).
- Quintero-Castro et al. (2012) D. L. Quintero-Castro, B. Lake, M. Reehuis, A. Niazi, H. Ryll, A. T. M. N. Islam, T. Fennell, S. A. J. Kimber, B. Klemke, J. Ollivier, V. G. Sakai, P. P. Deen, and H. Mutka, Phys. Rev. B 86, 064203 (2012).
- Petrenko et al. (2017) O. A. Petrenko, O. Young, D. Brunt, G. Balakrishnan, P. Manuel, D. D. Khalyavin, and C. Ritter, Phys. Rev. B 95, 104442 (2017).
- Gauthier et al. (2017a) N. Gauthier, B. Prevost, A. Amato, C. Baines, V. Pomjakushin, A. D. Bianchi, R. J. Cava, and M. Kenzelmann, J. Phys. Conf. Ser. 828, 012014 (2017a).
- Gauthier et al. (2017b) N. Gauthier, A. Fennell, B. Prévost, A.-C. Uldry, B. Delley, R. Sibille, A. Désilets-Benoit, H. A. Dabkowska, G. J. Nilsen, L.-P. Regnault, J. S. White, C. Niedermayer, V. Pomjakushin, A. D. Bianchi, and M. Kenzelmann, Phys. Rev. B 95, 134430 (2017b).
- Ghosh et al. (2011) S. Ghosh, H. D. Zhou, L. Balicas, S. Hill, J. S. Gardner, Y. Qiu, and C. R. Wiebe, J. Phys.: Condens. Matter 23, 164203 (2011).
- Young et al. (2013) O. Young, A. R. Wildes, P. Manuel, B. Ouladdiaf, D. D. Khalyavin, G. Balakrishnan, and O. A. Petrenko, Phys. Rev. B 88, 024411 (2013).
- Hayes et al. (2011) T. J. Hayes, G. Balakrishnan, P. P. Deen, P. Manuel, L. C. Chapon, and O. A. Petrenko, Phys. Rev. B 84, 174435 (2011).
- Balakrishnan et al. (2009) G. Balakrishnan, T. J. Hayes, O. A. Petrenko, and D. Paul, J. Phys.: Condens. Matter 21, 012202 (2009).
- Sears (1992) V. F. Sears, Neutron News 3, 26 (1992).
- Qureshi (2019) N. Qureshi, J. Appl. Cryst. 52, 175 (2019).
- Stewart et al. (1979) G. R. Stewart, J. A. Barclay, and W. A. Steyert, Solid State Commun. 29, 17 (1979).
- Child et al. (1967) H. R. Child, R. M. Moon, L. J. Raubenheimer, and W. C. Koehler, J. Appl. Phys. 38, 1381 (1967).
- Moon and Koehler (1975) R. M. Moon and W. C. Koehler, Phys. Rev. B 11, 1609 (1975).
- Young et al. (2012) O. Young, L. C. Chapon, and O. A. Petrenko, J. Phys. Conf. Ser. 391, 012081 (2012).
- Sheldrick (2008) G. M. Sheldrick, Acta Cryst., Sect. A: Found. Crystallogr. 64, 112 (2008).
- Carnall et al. (1989) W. T. Carnall, G. L. Goodman, K. Rajnak, and R. S. Rana, J. Chem. Phys. 90, 3443 (1989).
- Malkin et al. (2015) B. Z. Malkin, S. I. Nikitin, I. E. Mumdzhi, D. G. Zverev, R. V. Yusupov, I. F. Gilmutdinov, R. Batulin, B. F. Gabbasov, A. G. Kiiamov, D. T. Adroja, O. Young, and O. A. Petrenko, Phys. Rev. B 92, 094415 (2015).
- Gabbasov et al. (2019) B. Gabbasov, D. Zverev, I. Gilmutdinov, R. Batulin, A. Kiiamov, S. Nikitin, and R. Yusupov, J. Magn. Magn. Mater. 469, 638 (2019).
- Hasan and Southern (2017) E. Hasan and B. W. Southern, Phys. Rev. B 96, 094407 (2017).
- Singh et al. (2015) J. Singh, P. K. Baitha, and J. Manam, J. Rare Earth 33, 1040 (2015).
- Singh and Manam (2016) J. Singh and J. Manam, Ceram. Int. 42, 18536 (2016).
- Singh et al. (2017) J. Singh, J. Manam, and F. Singh, Mater. Res. Bull. 94, 113 (2017).
- Sun et al. (2018) X.-Y. Sun, T.-T. Han, D.-L. Wu, F. Xiao, S.-L. Zhou, Q.-M. Yang, and J.-P. Zhong, J. Lumin. 204, 89 (2018).
- Jiang et al. (2018) X. Jiang, Z. W. Ouyang, Z. X. Wang, Z. C. Xia, and G. H. Rao, J. Phys. D Appl. Phys. 51 (2018).
- Palacios et al. (2022) E. Palacios, R. Sáez-Puche, J. Romero, Y. Doi, Y. Hinatsu, and M. Evangelisti, J. Alloy. Compd. 890, 161847 (2022).