55email: schanlaridis@physics.uoc.gr
Thermonuclear and electron-capture supernovae from stripped-envelope stars
Abstract
Context. When stripped from their hydrogen-rich envelopes, stars with initial masses between 7 and 11 may develop massive degenerate cores and collapse. Depending on the final structure and composition, the outcome can range from a thermonuclear explosion, to the formation of a neutron star in an electron-capture supernova (ECSN). It has recently been demonstrated that stars in this mass range may be more prone to disruption than previously thought: they may initiate explosive oxygen burning when their central densities are still below . At the same time, their envelopes expand significantly, leading to the complete depletion of helium. This combination makes them interesting candidates for type Ia supernovae—which we call (C)ONe SNe Ia—and this might have broader implications for the formation of neutron stars via ECSNe.
Aims. To constrain the observational counterparts of (C)ONe SNe Ia and the key properties that enable them, it is crucial to constrain the evolution, composition, and precollapse structure of their progenitors, as well as the evolution of these quantities with cosmic time. In turn, this requires a detailed investigation of the final evolutionary stages preceding the collapse, and their sensitivity to input physics.
Methods. Here, we modeled the evolution of 252 single, nonrotating helium stars covering the initial mass range , with metallicities between and , and overshoot efficiency factors from to across all convective boundaries. We used these models to constrain several properties of these stars, including their central densities, compositions, envelope masses, and radii at the onset explosive oxygen ignition, as well as the final outcome as a function of initial helium star mass. We further investigate the sensitivity of these properties to mass loss rate assumptions using an additional grid of 110 models with varying wind efficiencies.
Results. We find that helium star models with masses between 1.8 and 2.7 are able to evolve onto (C)ONe cores that initiate explosive burning at central densities between and 9.6. We constrained the amount of residual carbon retained after core carbon burning as a function of initial conditions, and conclude that it plays a critical role in determining the final outcome: Chandrasekhar-mass degenerate cores that retain more than approximately of carbon result in (C)ONe SNe Ia, while those with lower carbon mass become ECSNe. We find that (C)ONe SNe Ia are more likely to occur at high metallicities, whereas at low metallicities ECSNe dominate. However, both SN Ia and ECSN progenitors expand significantly during the final evolutionary stages, so that for the most extended models, a further binary interaction may occur. We constrain the relative ratio between (C)ONe SNe Ia and SNe Ib/c to be 0.17–0.30 at , and 0.03–0.13 at .
Conclusions. We conclude with a discussion on potential observational properties of (C)ONe SNe Ia and their progenitors. In the few thousand years leading to the explosion, at least some progenitors should be identifiable as luminous metal-rich super-giants, embedded in hydrogen-free circumstellar nebulae.
Key Words.:
stars: evolution — binaries: general — supernovae: general — nuclear reactions, nucleosynthesis, abundances1 Introduction
The relation between a star’s initial properties and the type of remnant it produces remains equivocal. In isolation, stars with zero-age main sequence (ZAMS) masses above 11 are thought to produce neutron stars (NSs) or black holes (BHs), while those with masses below 7 leave behind white dwarfs (WDs). The fate of stars with intermediate masses is less certain, as predictions for their final size and composition remain challenging (Siess 2007; Poelarends et al. 2008; Doherty et al. 2015; Farmer et al. 2015, and references therein).
It is believed that most stars in this intermediate-mass regime evolve through a super-asymptotic giant branch (SAGB) phase, during which they burn carbon nonexplosively (e.g., Ritossa et al. 1999; Siess 2006; Poelarends et al. 2008; Doherty et al. 2015; Farmer et al. 2015; Poelarends et al. 2017, and references therein). Prior to carbon ignition, the mass of the helium core can be substantially reduced due to the second dredge-up (2DU), in which processed helium-rich matter is mixed throughout the stellar envelope. Subsequent shell burning is highly unstable and proceeds in a series of thermal pulses (Iben et al. 1997; Vassiliadis & Wood 1993; Poelarends et al. 2008). If the envelope is lost before the degenerate core reaches the Chandrasekhar-mass limit (, for the compositions investigated in this paper), then the final outcome is a WD. Conversely, if the core mass exceeds , the star produces a supernova (SN), the properties of which depend on the stellar structure and ignition conditions111Here, ignition refers to the time that the energy liberation rate per unit mass exceeds the local neutrino cooling rate, at the onset of the thermonuclear runaway (Rose 1969; Wheeler 1978). Most hydrogen-rich SAGBs are believed to lose their envelope before their core becomes sufficiently massive to collapse. Hence, an explosive ending is likely rare for noninteracting stars in this mass range (Iben & Renzini 1983; Poelarends et al. 2008). However, if the hydrogen-rich envelope is lost before core helium ignition, both unstable shell burning and the 2DU are avoided, leading to more efficient core growth. This significantly broadens the mass range in which near- SAGB cores may form (e.g., Podsiadlowski et al. 2004; Poelarends et al. 2008; Woosley 2019, and references therein). The most important formation path for naked helium stars in this mass range is thought to be envelope stripping in binaries either through stable mass transfer, or in a common-envelope event (Tauris et al. 2015, 2017; Siess & Lebreuilly 2018; Laplace et al. 2020).
At the high densities expected inside near- SAGB cores, the ashes of carbon fusion participate in weak interactions, for instance Urca cycles and electron captures (henceforth -captures), that can drastically influence the final evolutionary stages. Owing to the large abundance of , the most important of these is the -capture sequence , which—especially at densities above —rapidly consumes free electrons, leading to an -capture supernova (ECSN). The result of the collapse is determined by the competition between deleptonization and nuclear energy release, and can be either a NS formed in a low-energy core-collapse ECSN (ccECSN), or a thermonuclear explosion (tECSN), in which at least part of the star is disrupted (Miyaji et al. 1980; Nomoto 1984; Canal et al. 1992; Kitaura et al. 2006; Gutierrez et al. 1996; Jones et al. 2014). Whether one outcome prevails over the other depends on several uncertain factors, such as the ignition location and density (Leung et al. 2020), the structure and chemical makeup of the star, the speed and size of the nuclear flame (Timmes & Woosley 1992; Schwab et al. 2020), the reaction rates of the various -capture interactions (Kirsebom et al. 2019b), and the efficiency of convective energy transport (Schwab & Rocha 2019).
Multidimensional hydrodynamic simulations exploring some of these parameters (e.g., Jones et al. 2016, 2019; Leung et al. 2020) generally favor tECSNe for ignition densities around or smaller, even if the thermonuclear flame never transitions into a supersonic shock (e.g., Jones et al. 2019). These models suggest that tECSNe may eject more than 1 of material, leaving behind only small bound remnants. Because of the small electron-to-baryon ratio () of the material processed in nuclear statistical equilibrium, tECSNe have been proposed as candidate sources for neutron-rich elements such as and that are typically underproduced in normal type Ia SNe (SNe Ia; Jones et al. 2019). Intriguingly, the chemical composition of some presolar meteoric grains compares well with the predicted nucleosynthetic signature of these events (Jones et al. 2019). Some compact objects also seem consistent with the expectations for tECSN remnants (Raddi et al. 2019; Tauris & Janka 2019).
Recent advances in our understanding of SAGB stars suggest that they might be even more prone to disruption than previously thought. Firstly, the second forbidden 2+ 0+ ground state transition in the -decay of has now been measured (Kirsebom et al. 2019a), and found to be several orders of magnitude stronger than previously predicted. This makes -captures on a key energy source even at densities below (Kirsebom et al. 2019b, a; Leung et al. 2020). Secondly, state-of-the-art simulations consistently show that some carbon is retained after the carbon burning phase (Iben & Renzini 1983; García-Berro et al. 1997; Siess 2006; Denissenkov et al. 2013; Farmer et al. 2015; Doherty et al. 2015; Lecoanet et al. 2016; Jones et al. 2019, see also Sect. 3). Due to its lower ignition temperature compared to oxygen, residual carbon can significantly influence the explosion conditions. In some cases, during the main carbon burning episode, the flame, which ignites off-center, may never reach the core, thereby creating a hybrid structure in which a CO-dominated core is surrounded by an ONe-dominated envelope (Denissenkov et al. 2013; Farmer et al. 2015, and references therein).
In a previous paper (Antoniadis et al. 2020, henceforth ACGL20), we examin the evolution of two stripped helium star models with masses of 1.8 and 2.5. We show that these stars initiate explosive oxygen burning at central densities , thereby completely avoiding -captures on . At the same time, their envelopes expand significantly, leading to intense mass loss and the complete depletion of helium. The combination of low ignition densities, and helium-free composition, make these stars atypical progenitor candidates for thermonuclear SNe Ia (henceforth (C)ONe SNe Ia; see also Waldman & Barkat 2006; Waldman et al. 2008). In addition, this behavior may also reduce significantly the mass range for which thermonuclear and core-collapse ECSNe may occur. To gauge which flavor of SN Ia this channel may be relevant to, as well as the broader consequences for ECSNe, it is important to constrain the range of masses for which this outcome is possible, the stellar structure and composition at the onset of collapse, as well as the sensitivity of these properties to underlying physical uncertainties.
In this work we present detailed one-dimensional stellar evolution models that cover a broad range of initial helium star masses, compositions, and physical assumptions. The text is organized as follows: in Sect. 2 we describe our methodology and input physics. In Sect. 3 we present the results of our calculations and in Sect. 4 we discuss various physical uncertainties in the input physics. Finally, in Sect. 5 we conclude with a concise summary and a discussion on the ramifications of our models for ECSNe and SNe Ia.
2 Simulations and physical assumptions
We perform our numerical simulations using the implicit one-dimensional code Modules for Experiments in Stellar Astrophysics (mesa v10398; Paxton et al. 2011, 2013, 2015, 2018). Our main grid (henceforth Series I) consists of 252 helium star models (), covering the mass range with a resolution of 0.1, at three metallicities (, and 0.02). Other physical assumptions in our models are identical to those described in ACGL20 and are only briefly summarized here for completeness222Our mesa configuration files (inlists) are publicly available at https://zenodo.org/record/3580243. To set the initial composition, we considered the abundances of Grevesse & Sauval (1998) as a reference for the solar isotopic composition. Models of different metallicities have abundances that are scaled from the aforementioned reference for the solar composition. To better account for an enhanced carbon-oxygen mixture as a result of helium burning, we used the type-2 OPAL Rosseland mean opacity tables (Iglesias & Rogers 1996). We considered ion and electron screening corrections as described in Potekhin et al. (2009) and Itoh et al. (2002), respectively. We used the HELM (Timmes & Swesty 2000) and PC (Potekhin & Chabrier 2010) equations-of-state. For their blending, we followed the options suggested by Schwab et al. (2017) so that the core is always treated using the PC equation-of-state.
Convection was treated according to the modified mixing-length theory (MLT) prescription of Henyey et al. (1965) with a mixing-length parameter of . Contrary to the default MLT option in mesa, this treatment allows for the convective efficiency to vary with the opaqueness of the convective element (Paxton et al. 2011). Stability against convection was evaluated using the Ledoux criterion. Convective energy transport was computed using the MLT++ variation of standard MLT (Paxton et al. 2015). This artificially reduces large superadiabatic temperature gradients to improve numerical stability (for a discussion on the consequences of this choice we refer to Sect. 4.4). We also adopted an efficiency parameter of for semiconvection (Langer 1991), and a diffusion coefficient of for thermohaline mixing (Brown et al. 2013). Both semiconvection and thermohaline mixing are treated by mesa as diffusive processes (Kippenhahn et al. 1980; Langer et al. 1983). We did not employ the predictive mixing implementation described in Paxton et al. (2018). Lastly, we considered the effect of overshooting across convective boundaries. Even though overshooting is likely not particularly strong in this mass range, especially between the CO-core and envelope interface (Lecoanet et al. 2016), it might have a significant influence on the propagation of the carbon burning flame (Farmer et al. 2015). Motivated by this, we computed models with small variations in overshooting efficiency. More specifically, following Jones et al. (2013), we considered three scaling factors of = 0.0, 0.014 and 0.016, where is defined as a fraction of the local pressure scale height, , and relates to the diffusion coefficient, via,
| (1) |
where is the geometric distance from the edge of the convective zone (Herwig 2000).
Our nuclear network consisted of 43 isotopes and considered all relevant weak reactions, using the weak rates from Suzuki et al. (2016). We ensured that all these isotopes were included in the PC equation-of-state calculation (see Schwab et al. 2017, for details). Mass loss rates due to stellar winds were implemented using the Dutch wind scheme (Glebbeek et al. 2009), and assuming no further binary interactions take place following the formation of the helium star. In our case, this implied two different rates, depending on the effective temperature of the star: for K and a surface abundance of hydrogen of by mass fraction (which is always satisfied in our models), we applied the prescription of Nugis & Lamers (2000) with a scaling factor of (default value). For K the mass loss rate followed the prescription of de Jager et al. (1988).
To probe the influence of stellar wind on core growth, we evolved additional stellar models with varying wind scaling factors within the Dutch scheme. This secondary grid (henceforth Series II) consists of 110 models with , covering the mass range with a step size of 0.1.
We did not employ any physical condition as a termination criterion in our calculations. Instead, we let our models evolve until no further numerical solution could be found. In practice, this meant that calculations stopped either because the timestep became too small ( s), the number of mesa “backups” exceeded 50, or due to the core reaching an extremely high temperature ( K), outside the validity regime of our equation-of-state. As we discuss in the next section, in terms of evolutionary stages, the majority of ONe-core models stopped shortly after the carbon burning phase, when their central density was g cm-3, and the mass of the degenerate core was . However, a handful of models managed to reach the Chandrasekhar-mass limit () and stopped only after the onset of explosive oxygen burning and shortly before achieving the conditions for nuclear statistical equilibrium. A summary of the parameters discussed above is given in Table 1.
| Parameter | Value(s) |
|---|---|
| Convection () | |
| Semiconvection () | |
| Thermohaline () | |
| Wind scaling factor () | , , , , , |
| Overshooting () | , , |
| Metallicity () | , , |
3 Results
Figure 1 shows the duration of the core helium burning phase as a function of initial mass, while Fig. 2 illustrates the Hertzsprung-Russell diagram for five representative models from Series I (see below). Figure 3 shows the core temperature and density evolution for the same stars.
All models undergo a period of stable core helium burning that lasts between 1.5 and 32.5 Myr. The duration of the core helium burning phase (henceforth helium main sequence; He-MS) in our models can be approximated by a power-law of the form,
| (2) |
where is the initial mass of the model. In agreement with Yan et al. (2016), we find that models in which overshooting is included result in larger convective core masses and longer lifetimes. The difference in lifetimes between models with and is more pronounced at lower initial masses. This is due to an increase in the amount of fuel added to the core which does not result in a strong luminosity increase. The helium burning lifetime of helium star models in the metallicity range covered by our grids is largely insensitive to variations of this parameter333We note that metallicity variations would affect the mass of -rich regions (and thus their burning lifetime) if we were to start our calculations with a normal -rich star. This however does not affect the results presented here.. This is in contrast to what has been found for larger-mass helium stars () which are subject to stronger mass loss rates during core helium burning (Aguilera-Dena et al. 2022). The influence of overshooting and initial composition is further discussed in Sect. 4.

In mesa, the outer boundary of the CO and ONe cores is by default defined based on the abundance of and other relevant isotopes such as and . We find this to be problematic because some of our models lose their entire envelope. For this reason, we choose to define the core boundary as the location where the ratio of the ideal gas pressure to degenerate pressure is of order unity (). Following core helium burning, the newly formed CO cores lie within the mass range . At this stage, the main source of energy moves into a stable radiative helium burning shell, while the core contracts and cools as a result of neutrino emission. The subsequent evolution varies strongly with initial mass, allowing us to distinguish several distinct evolutionary paths. In what follows, we explore in detail the subsequent evolution of our Series I stellar models, grouping them according to their core composition and final fate.
3.1 CO & hybrid CONe white dwarfs
For ( for ; see Figs. 4 and 5 for exact mass boundaries as a function of and ), CO cores do not become massive enough to initiate carbon burning. Instead, stable shell helium burning gradually increases the mass of the core, while the envelope is expelled over a timescale of a few Myr, if no mass transfer takes place. These stars ultimately become CO WDs. The difference in the mass threshold most likely stem from the metallicity-depended wind although other effects, such as a different mean molecular weight, can contribute to the cause.
The evolution of a star representative of this class is illustrated in Figs. 2 and 3 with brown color. This particular model experiences a late thermal pulse while it descends from the post-AGB track toward its terminal WD cooling track. This flash lasts , resulting in a peak -burning luminosity of , and does not lead to significant mass loss. The final outcome is a CO WD with a mean abundance of , and 444Unless otherwise stated, this notation refers to a mass averaged mass fraction of an isotope for the rest of the paper.
At the end of the simulation, our CO WDs have masses between 0.7 and 1.16 and possess a -rich envelope of . For the lowest-mass model, the shell burning and envelope ejection phase lasts . During this time, the envelope expands to R⊙ and reaches an effective temperature of . For the highest-mass model, the envelope expands substantially more, to R⊙, reaching a surface temperature of , and is expelled in Myr.


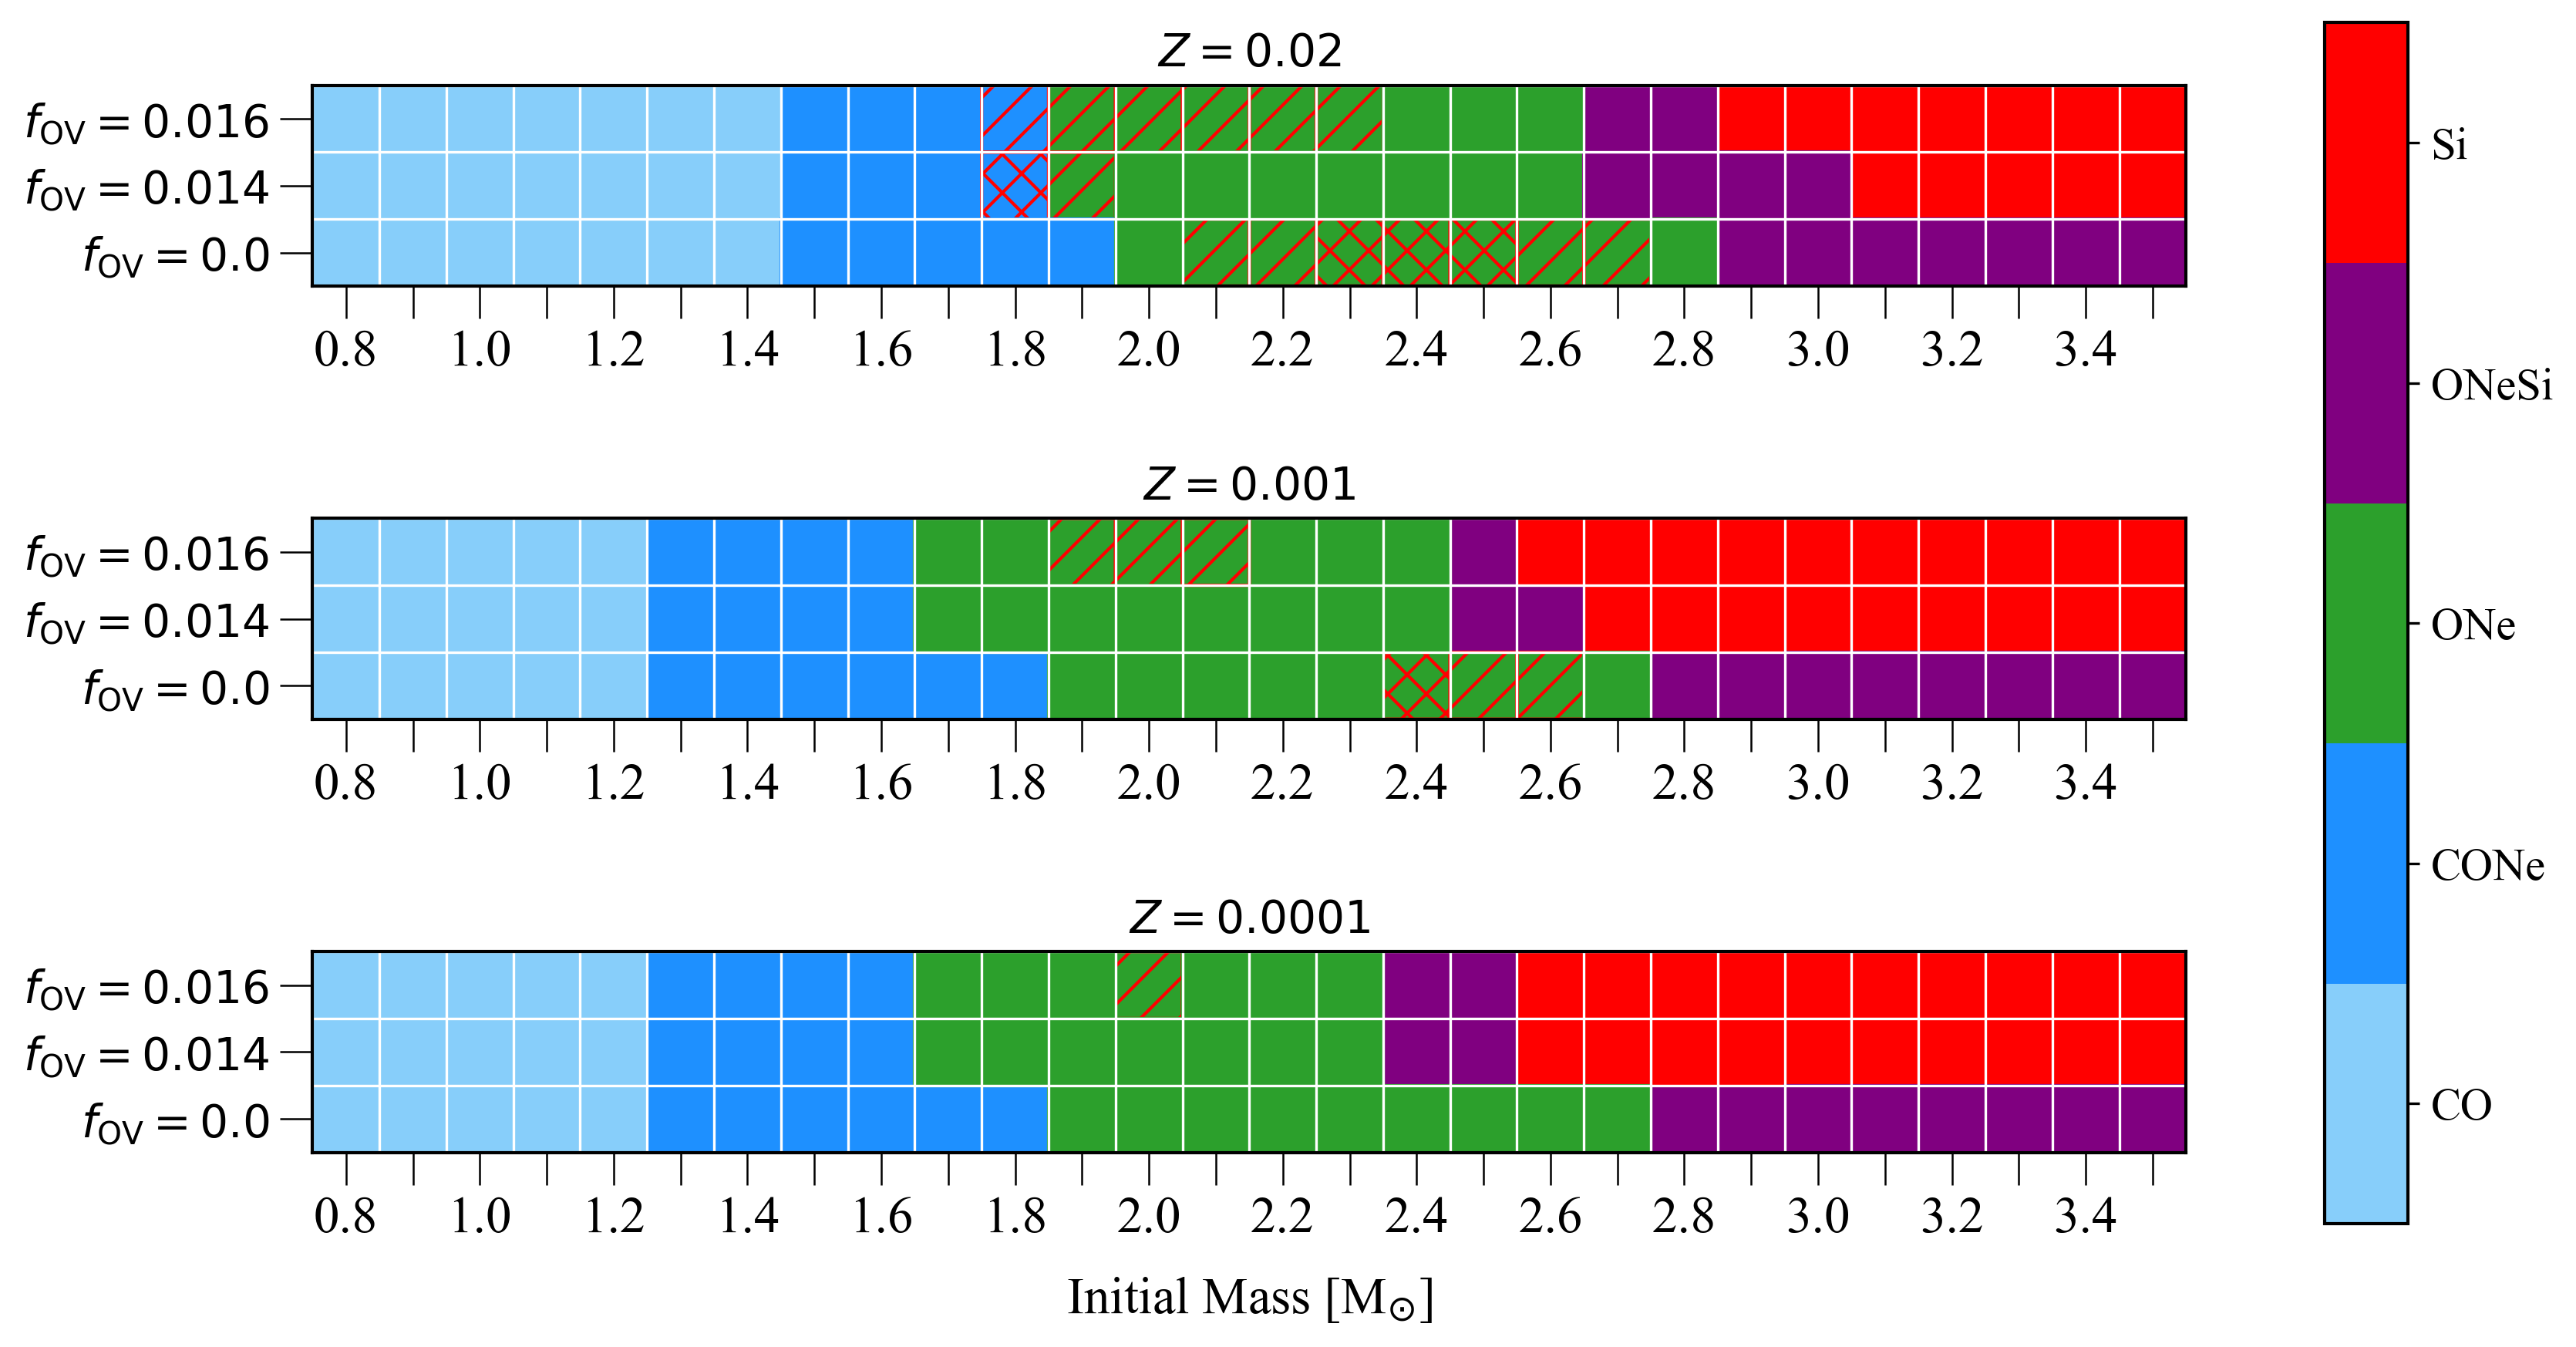

As we move to higher initial masses (), our models experience off-center carbon ignition, due to thermal neutrino losses leading to a temperature inversion in the inner core. The mass of the core during the off-center ignition is on average , consistent with typical values found in literature (e.g., Doherty et al. 2015). Similarly to what has been found for -rich SAGB stars (e.g., García-Berro et al. 1997; Gil-Pons et al. 2003; Siess 2006; Poelarends et al. 2008; Doherty et al. 2010; Farmer et al. 2015), the ignition location varies with initial mass, with increasing -ZAMS masses resulting in ignition locations closer to the center. As long as the temperature at the base of the carbon burning region remains higher than the carbon ignition threshold, the burning front advances inward. For stars that exhibit this behavior and have relatively low masses, the flame quenches before reaching the center. In this case, the core exhibits a hybrid-like structure, where the inner layers are primarily composed of carbon and oxygen, while the outer layers have an oxygen-neon composition (for a detailed discussion on the flame quenching mechanisms we refer to the work of Siess 2009; Denissenkov et al. 2013; Chen et al. 2014; Farmer et al. 2015). In our Series I models, the lowest-mass helium star that ignites carbon off-center is a model with . The ignition happens at a mass coordinate of and the flame stops at a mass coordinate of . The highest-mass model that forms such a hybrid structure is a helium star with , that ignites carbon at a mass coordinate of . The flame quenching occurs at .
The evolution of a representative model from this category is illustrated with green in Figs. 2 and 3. An overview of mass boundaries for hybrid WDs, and their dependence on metallicity and overshooting can be seen in Figs. 4 and 5. In the latter, we map helium core masses to ZAMS masses based on Fig. 4 of Farmer et al. (2015). This does not take into account the role of metallicity in setting the relation between initial mass and helium core mass, but we expect the difference to be small. In the absence of further binary interactions after the hydrogen envelope removal, the final hybrid CONe WDs in our models have masses between 1.2 and 1.33. This means that they only need to accrete very small amounts of matter to reach the Chandrasekhar-mass limit (see Sect. 5 for a discussion).
3.2 ONe cores
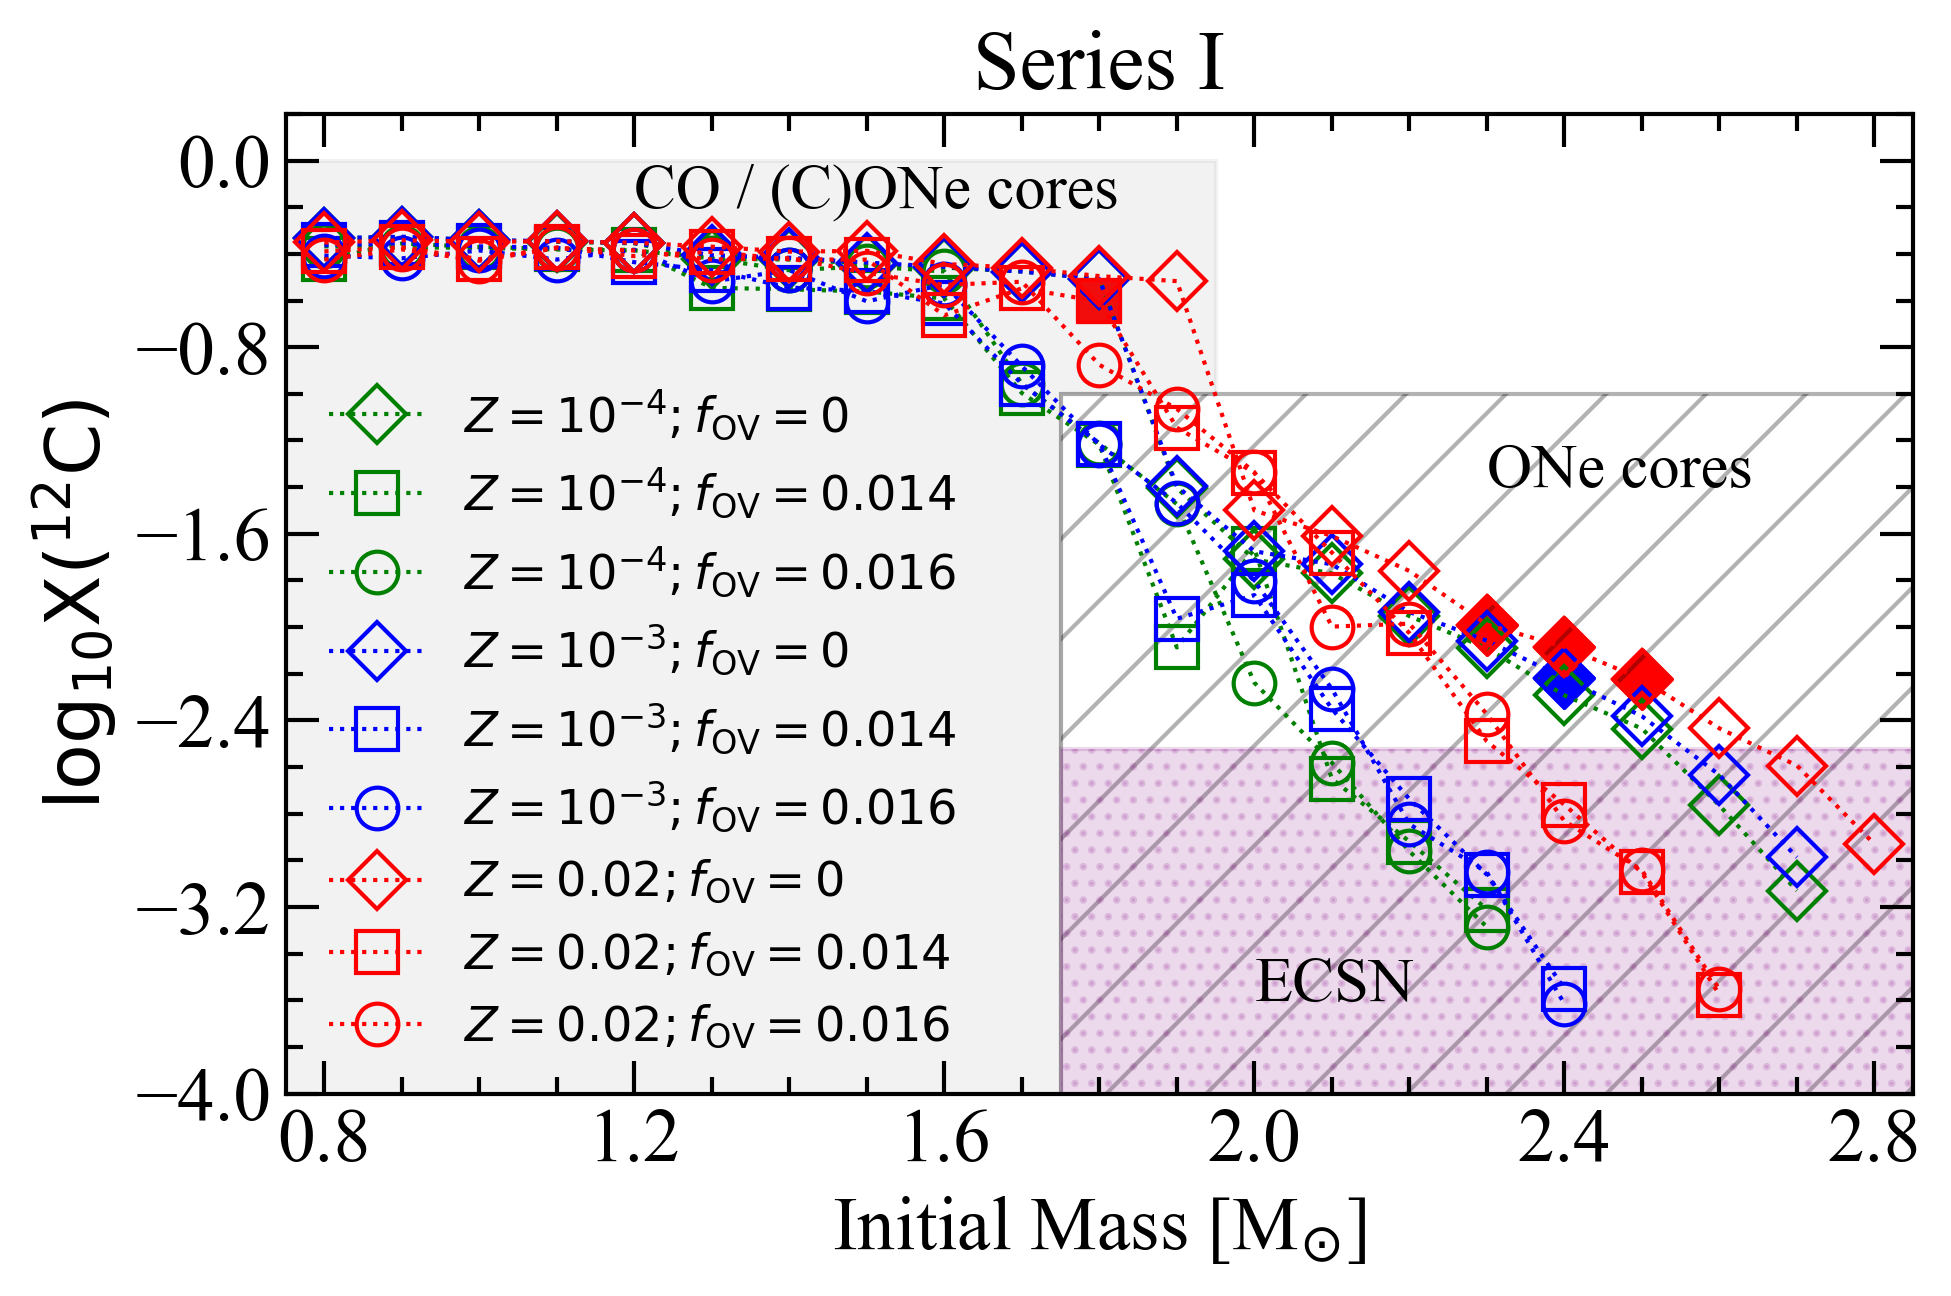
Stars with initial masses between and (see Figs. 4 and 5), stand out due to their ability to develop highly degenerate ONe cores. As discussed in ACGL20, one key property that plays a critical role in determining the final fate of these stars is the amount of residual carbon distributed throughout the core after the main carbon burning phase. With the exception of a few models with (see Sect. 3.3), for most stars in this mass range, carbon still ignites in a shell but the carbon flame is able to propagate all the way to the center, thereby forming an ONe-dominated core. However, our simulations show that in all cases, some residual carbon remains distributed throughout the degenerate core, with average mass fractions of (see Appendix A for representative carbon abundance profiles). Figure 6 shows variations in the average residual carbon abundance of the degenerate core as a function of initial mass. These abundances were calculated using the mesa profile nearest to , that is after the main carbon burning phase and before the onset of Urca reactions. As can be seen, the amount of residual carbon varies strongly both with initial mass and metallicity, especially for . The residual-carbon profile remains practically unchanged until the onset of exothermic weak reactions at (see Fig. 3).
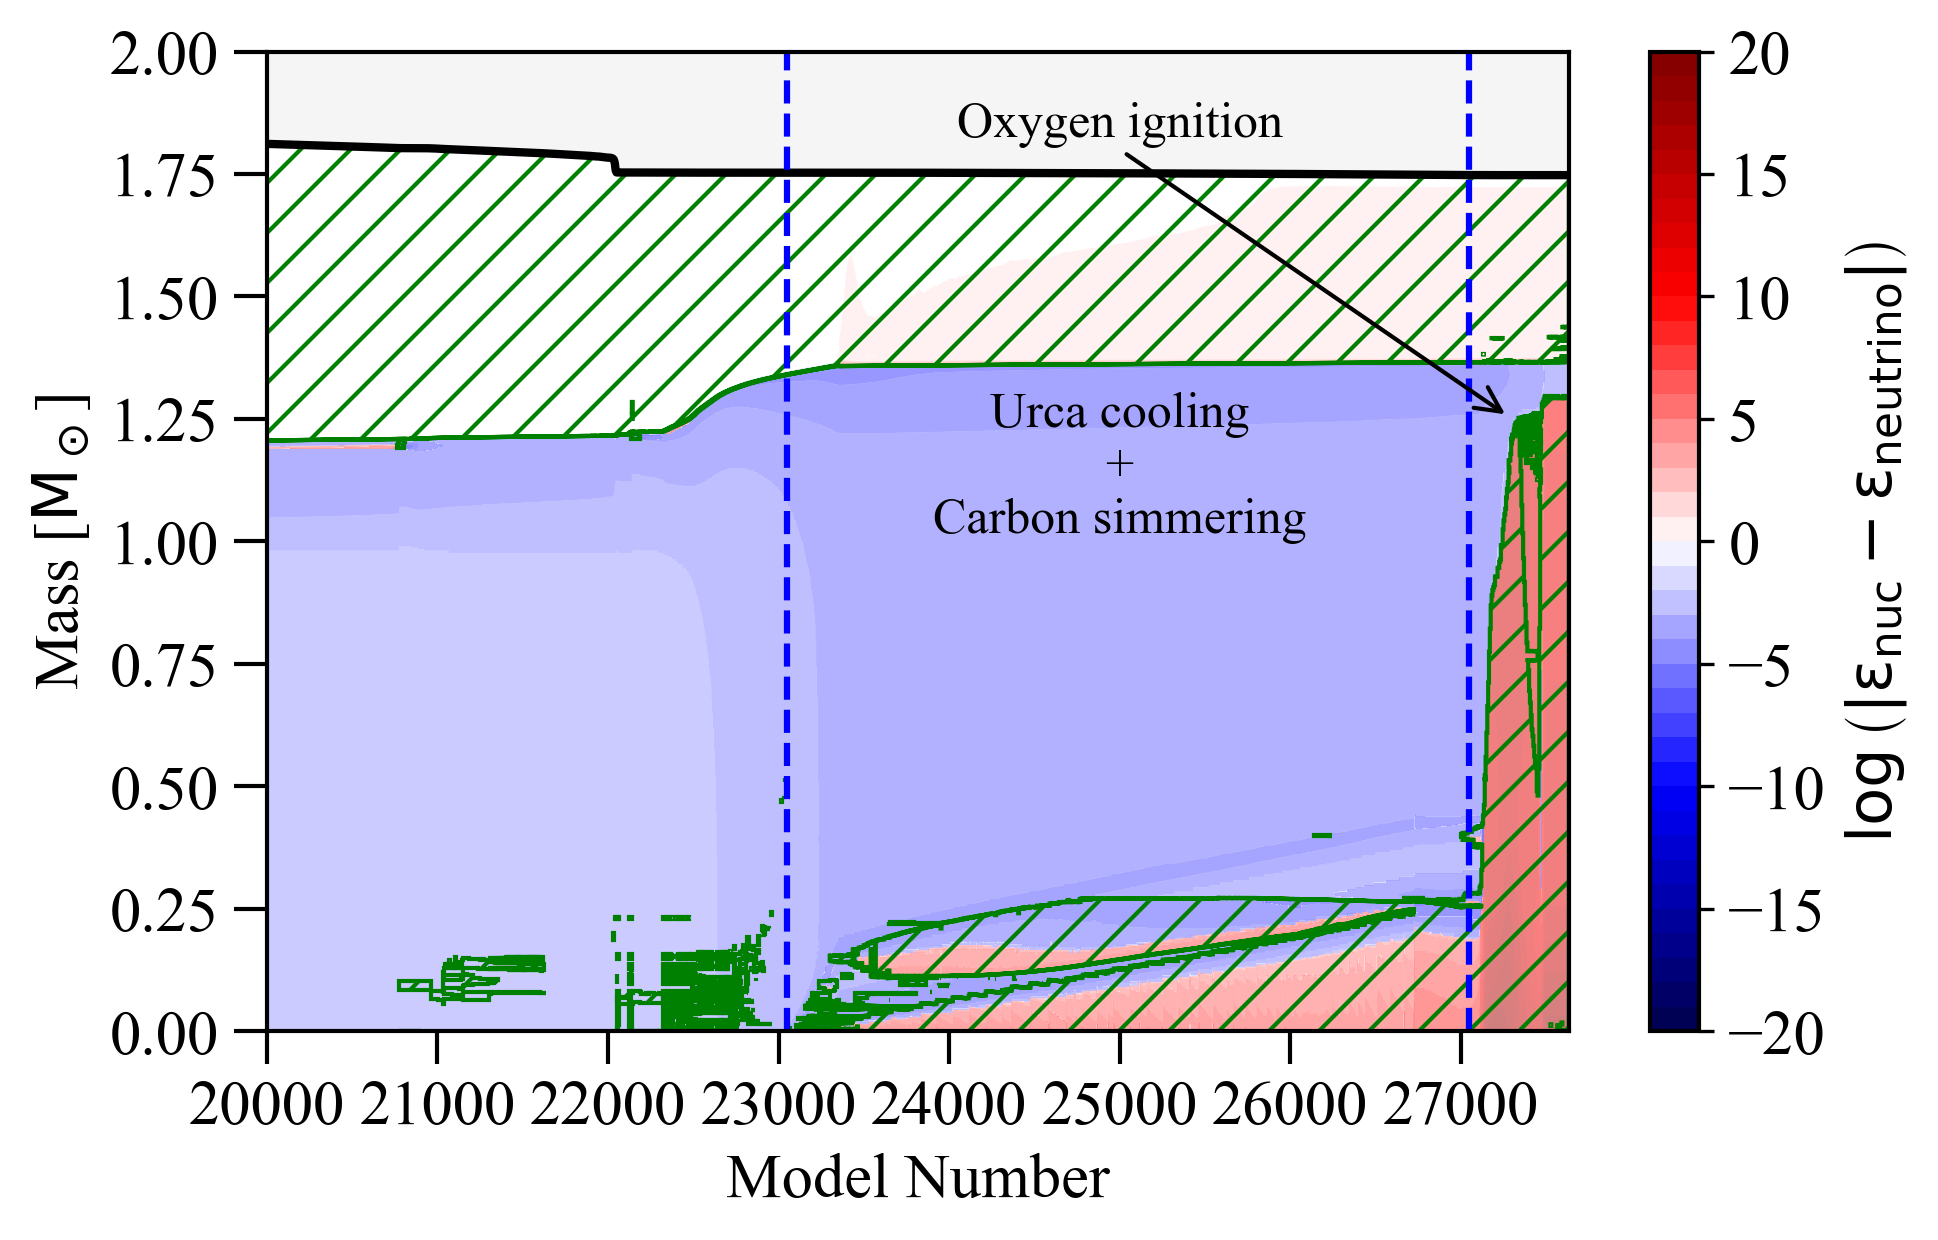
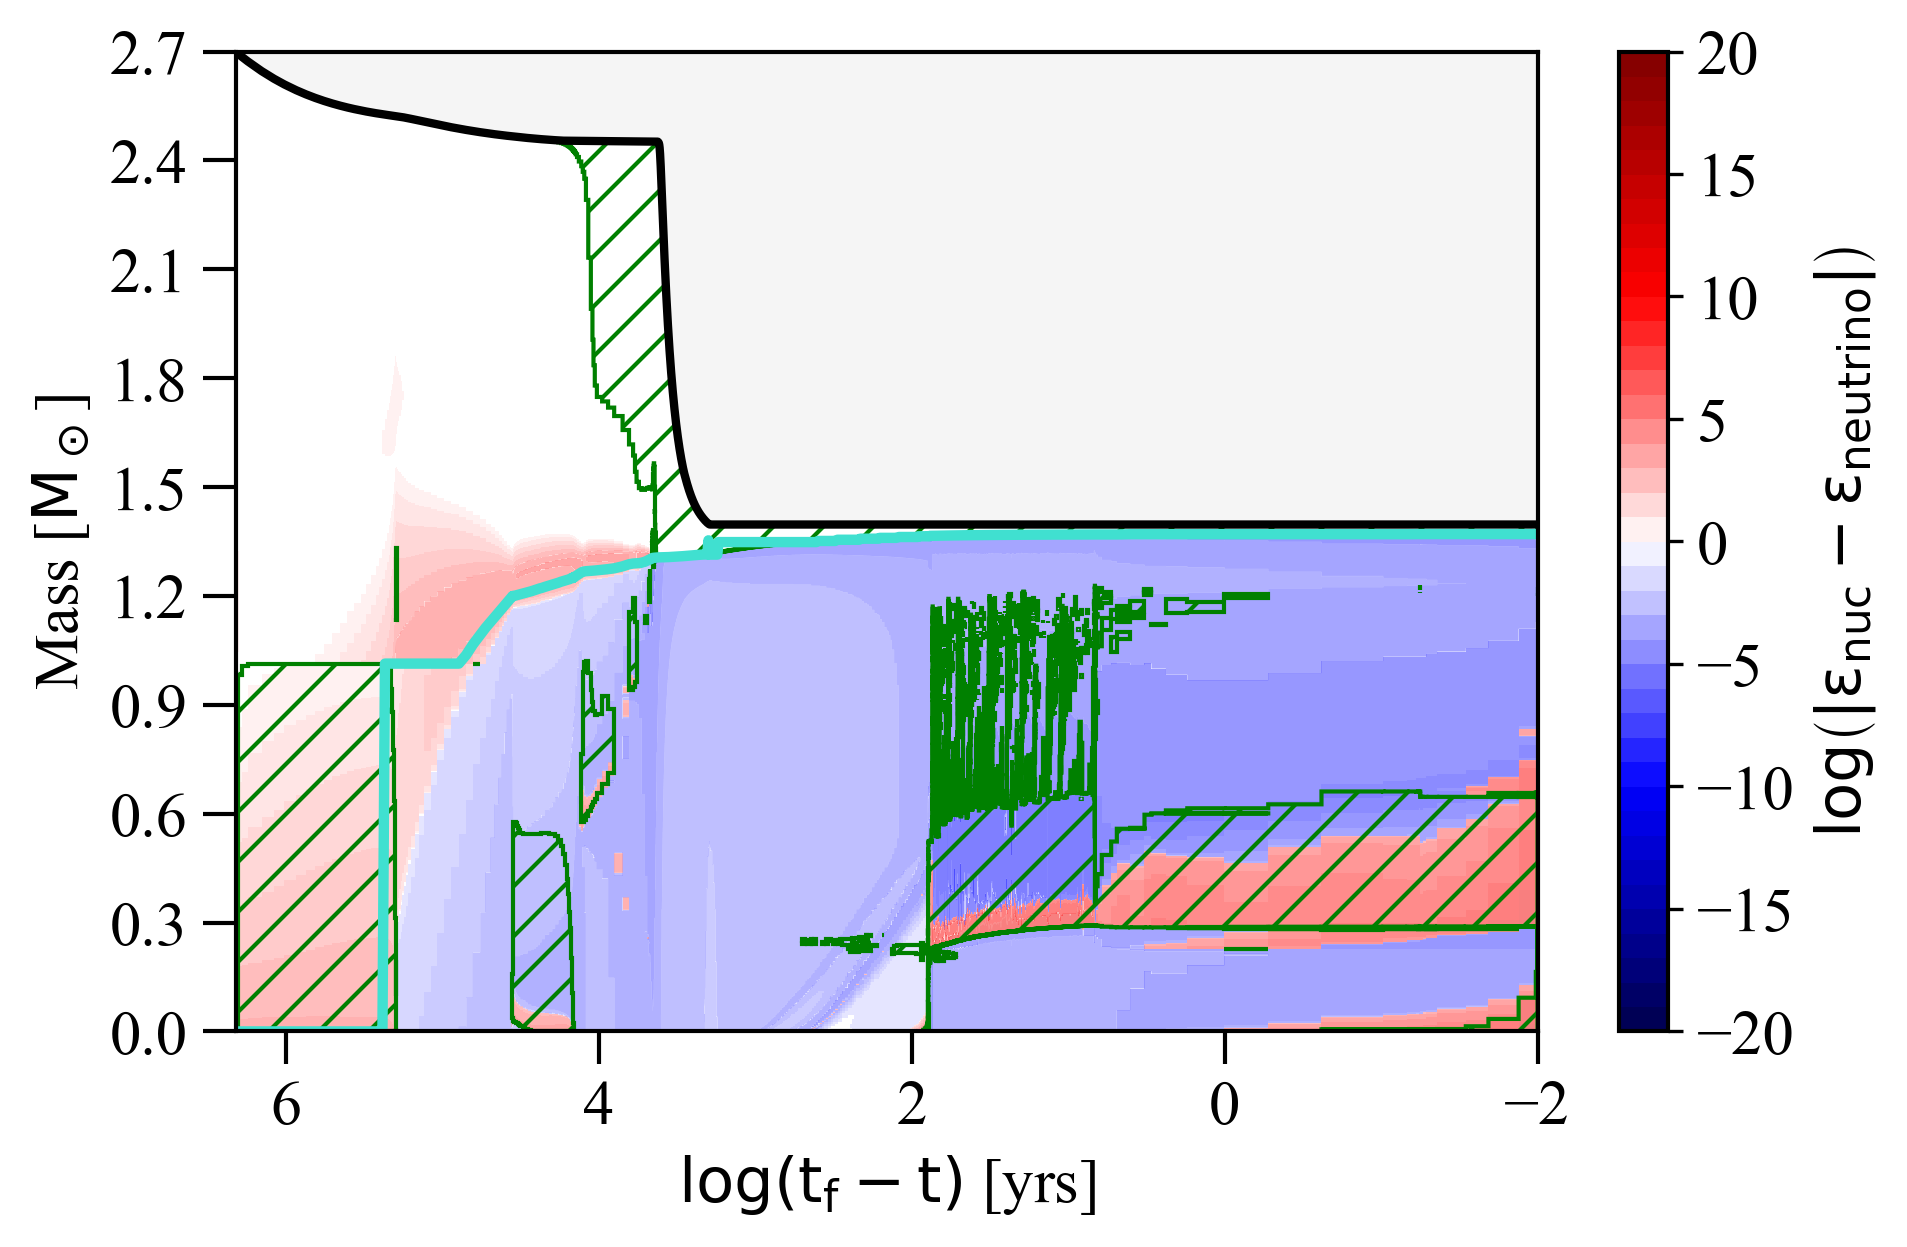
To better illustrate the properties of these stars during their late evolutionary stages, we now focus on a fiducial model with an initial mass of and , as representative for this mass range. The evolution of this model is illustrated by the blue curves in Figs. 2 and 3, while Fig. 7 shows the corresponding Kippenhahn diagram. Following the depletion of helium in the center, the model initially ignites carbon at a mass coordinate when the CO core has a mass of , and the total mass of the star is . The carbon flame advances in both directions processing the material in . During this period, the star resembles a red giant with an extended envelope that has , , and . Its mass loss rate during this phase is , as estimated using the de Jager et al. (1988) wind scheme that has been empirically calibrated for red super giants (see top panel of Fig. 8). The surface composition is dominated by helium (see Fig. 9).
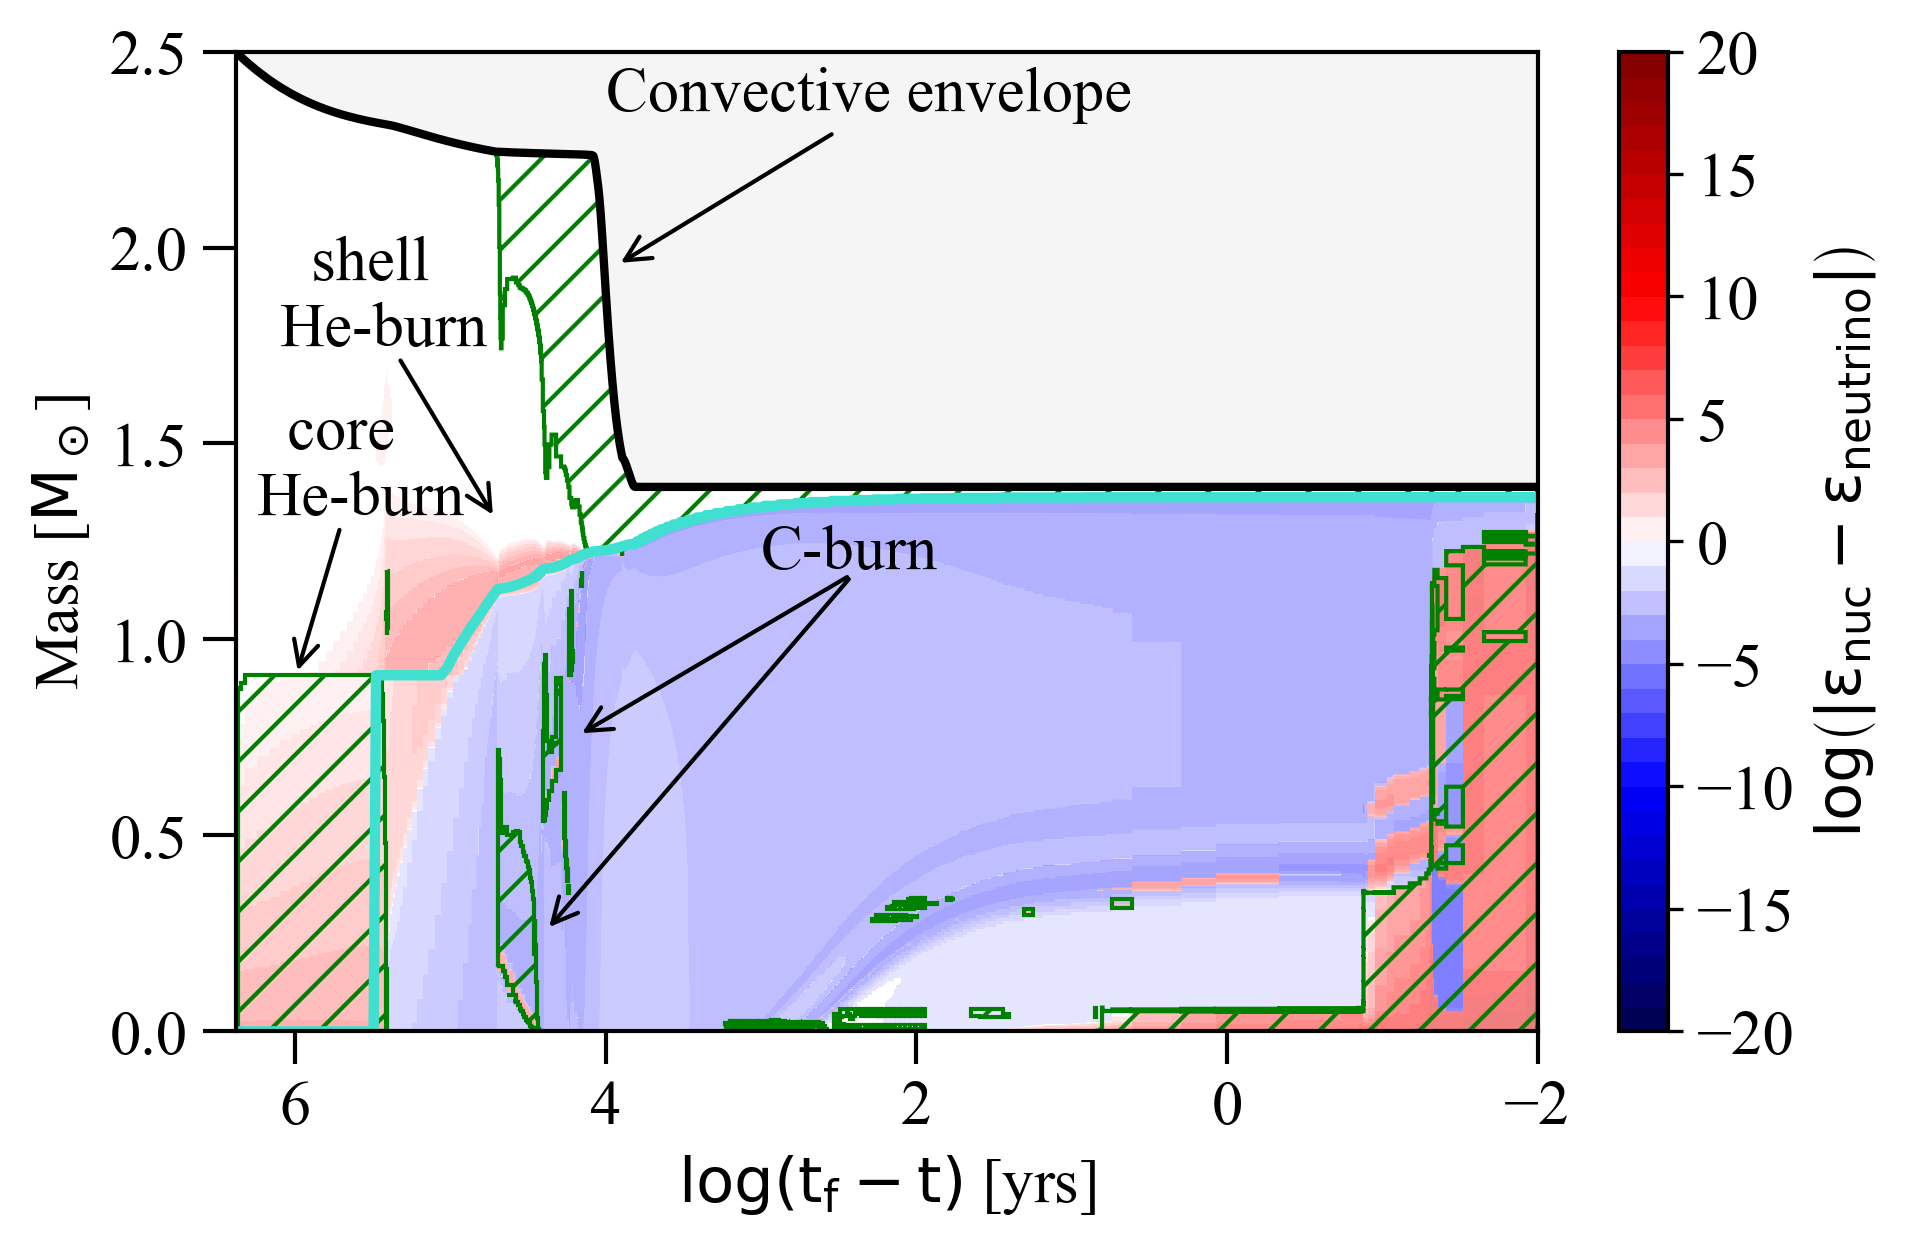
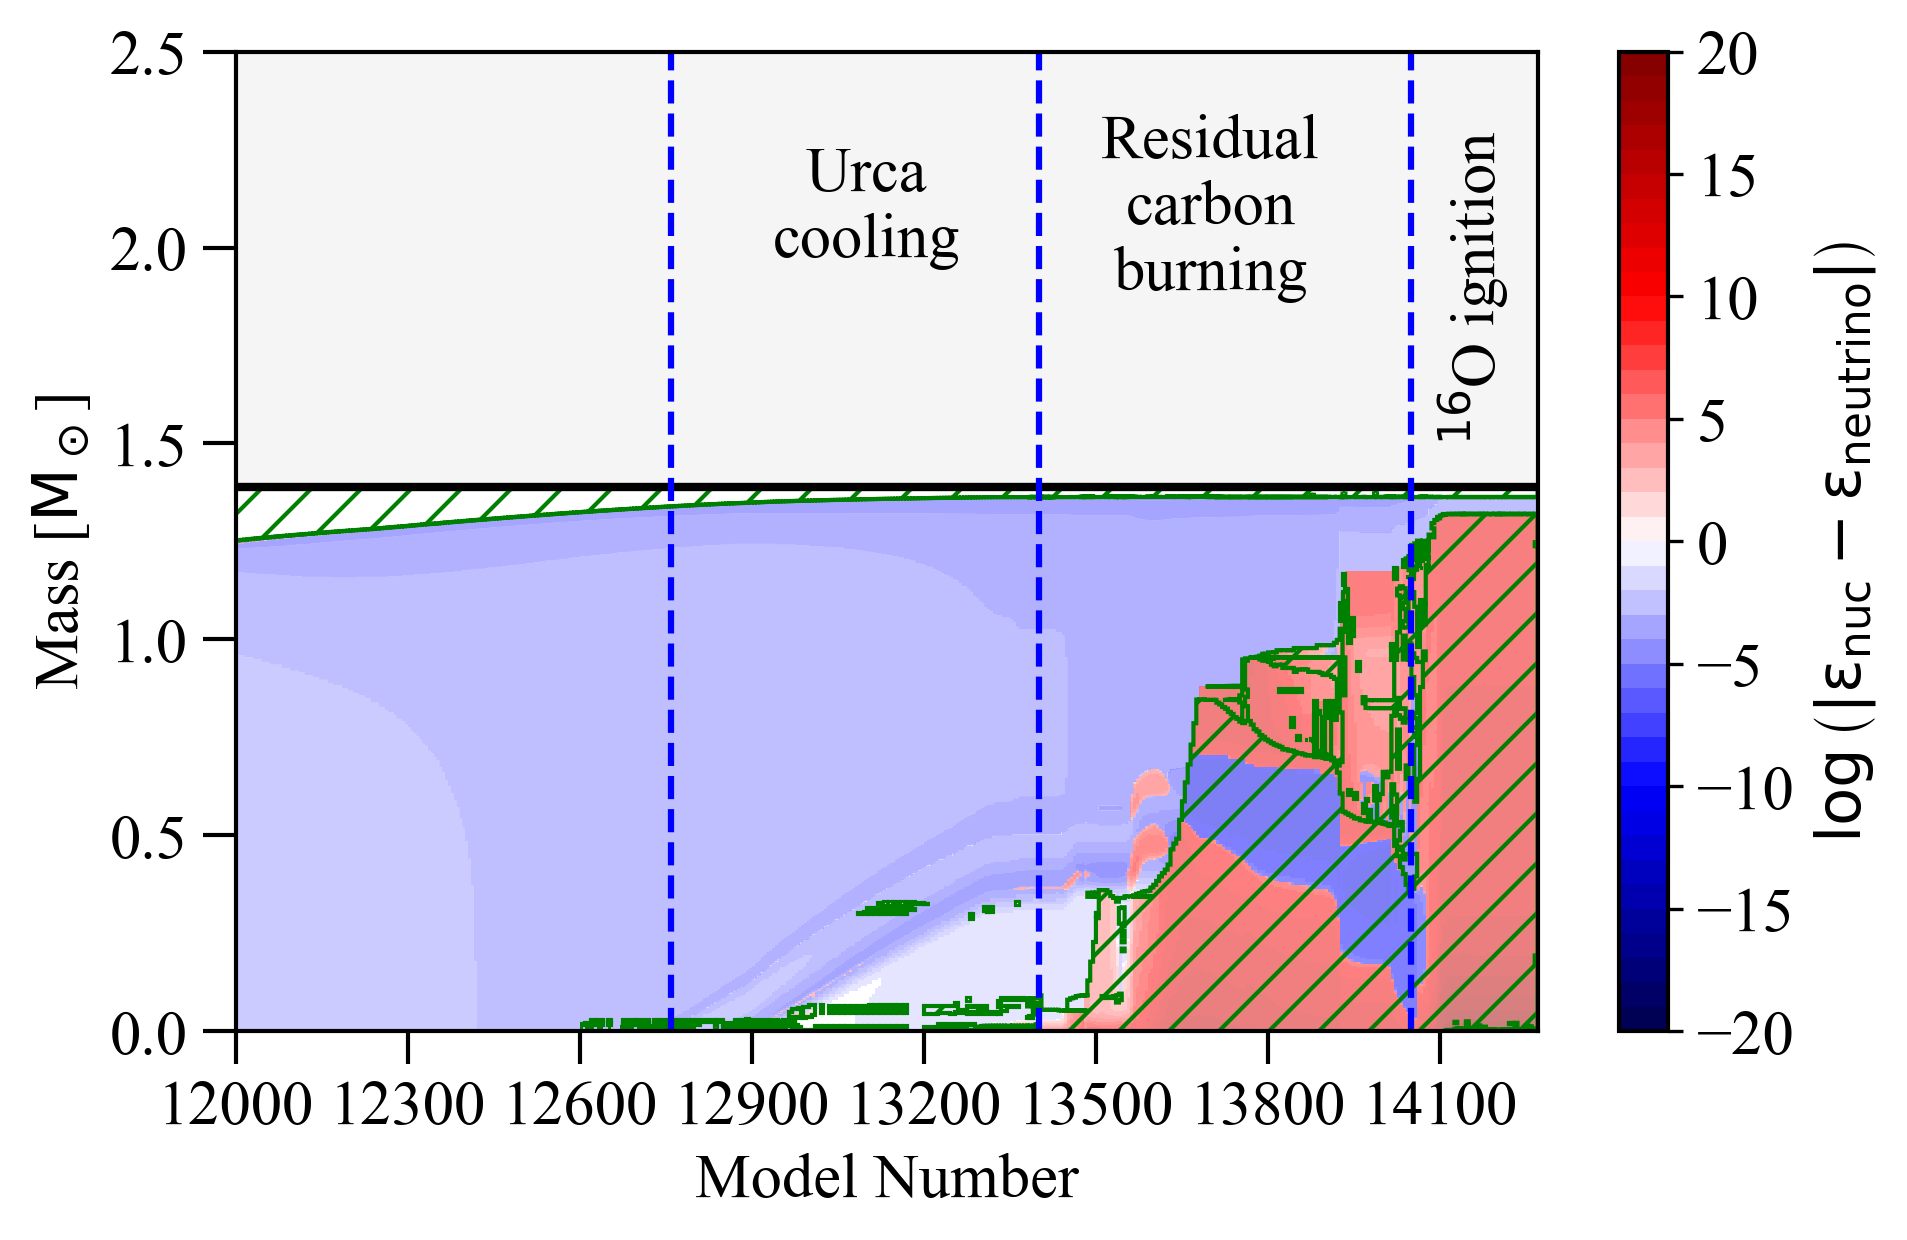
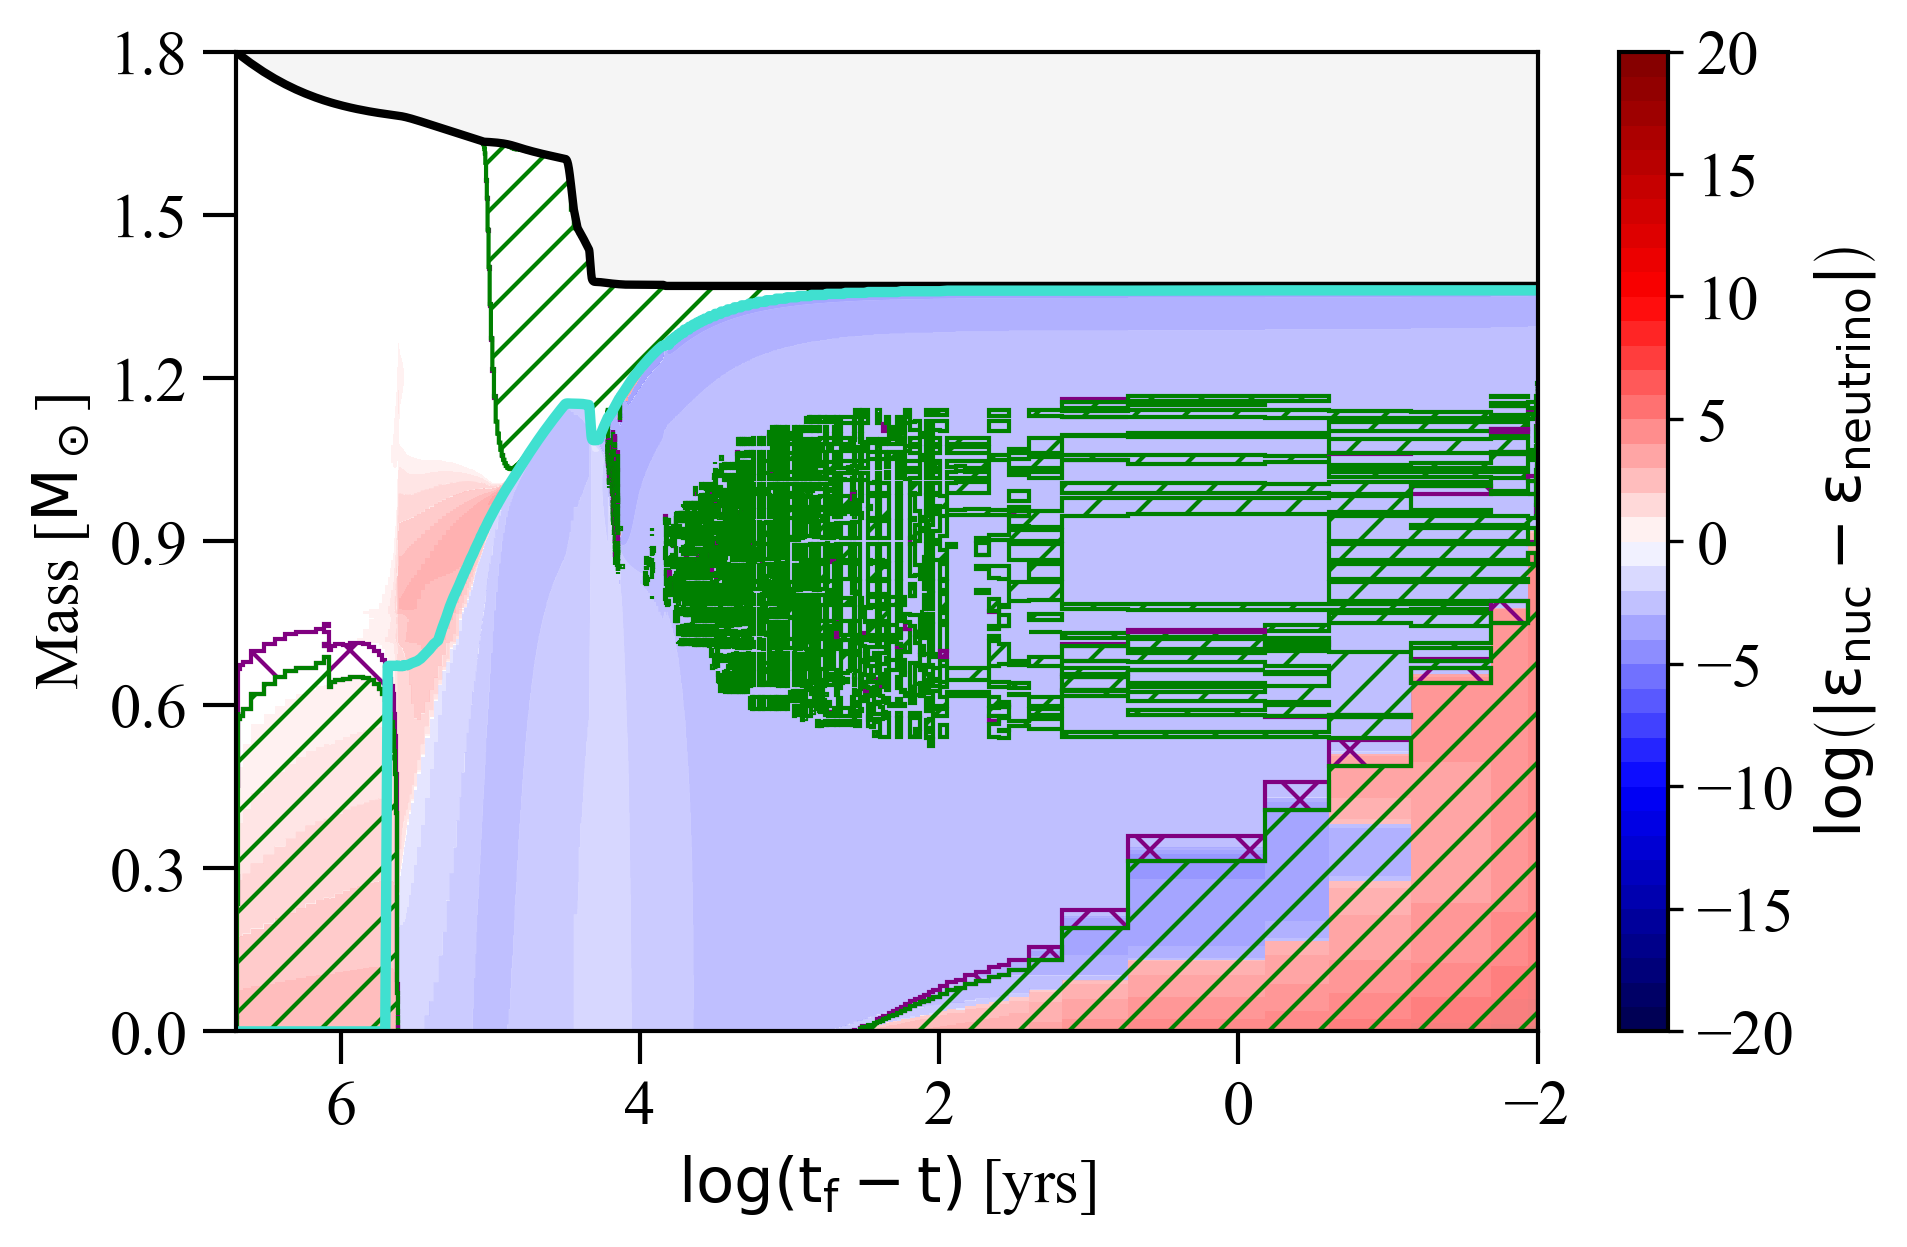
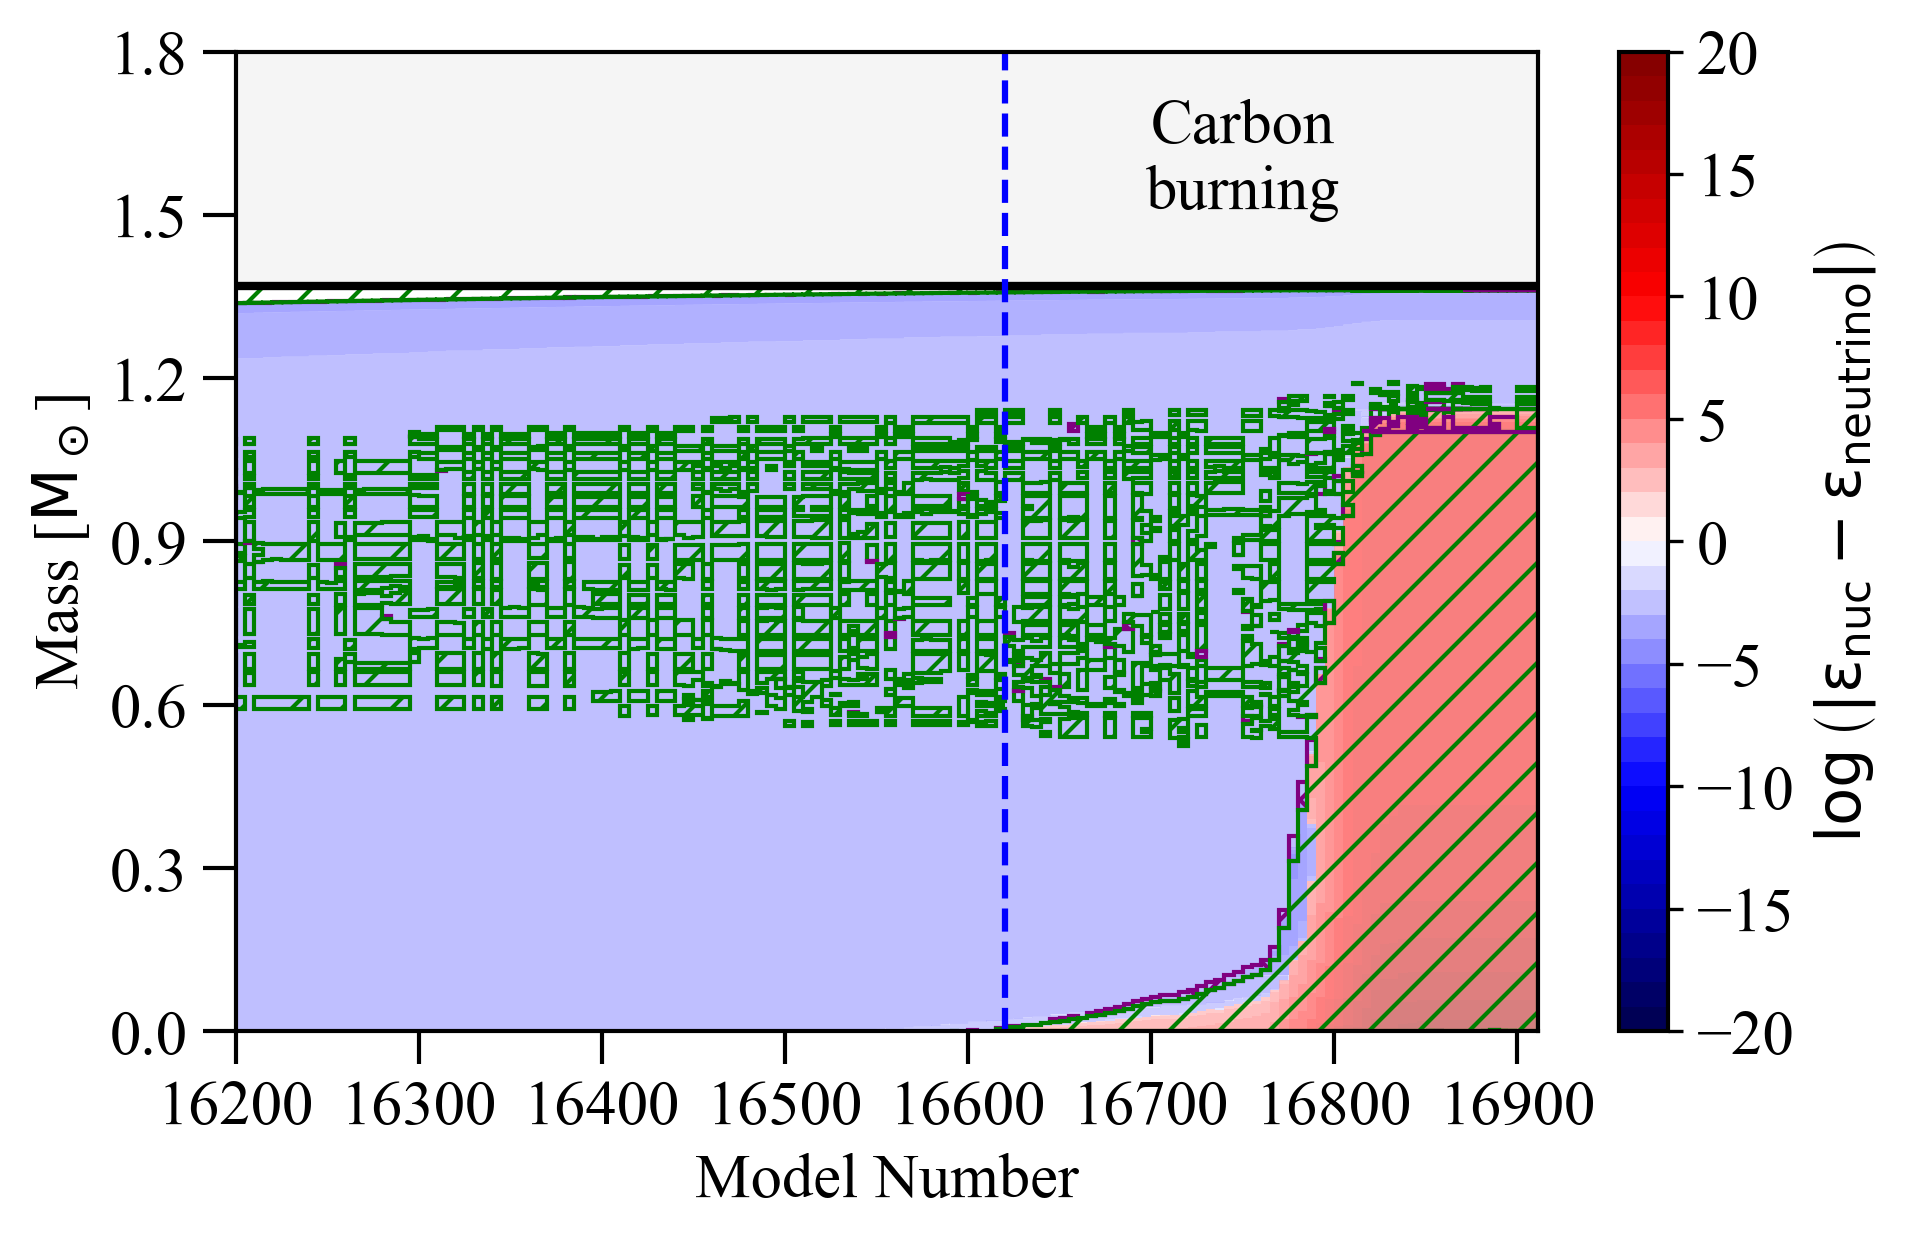


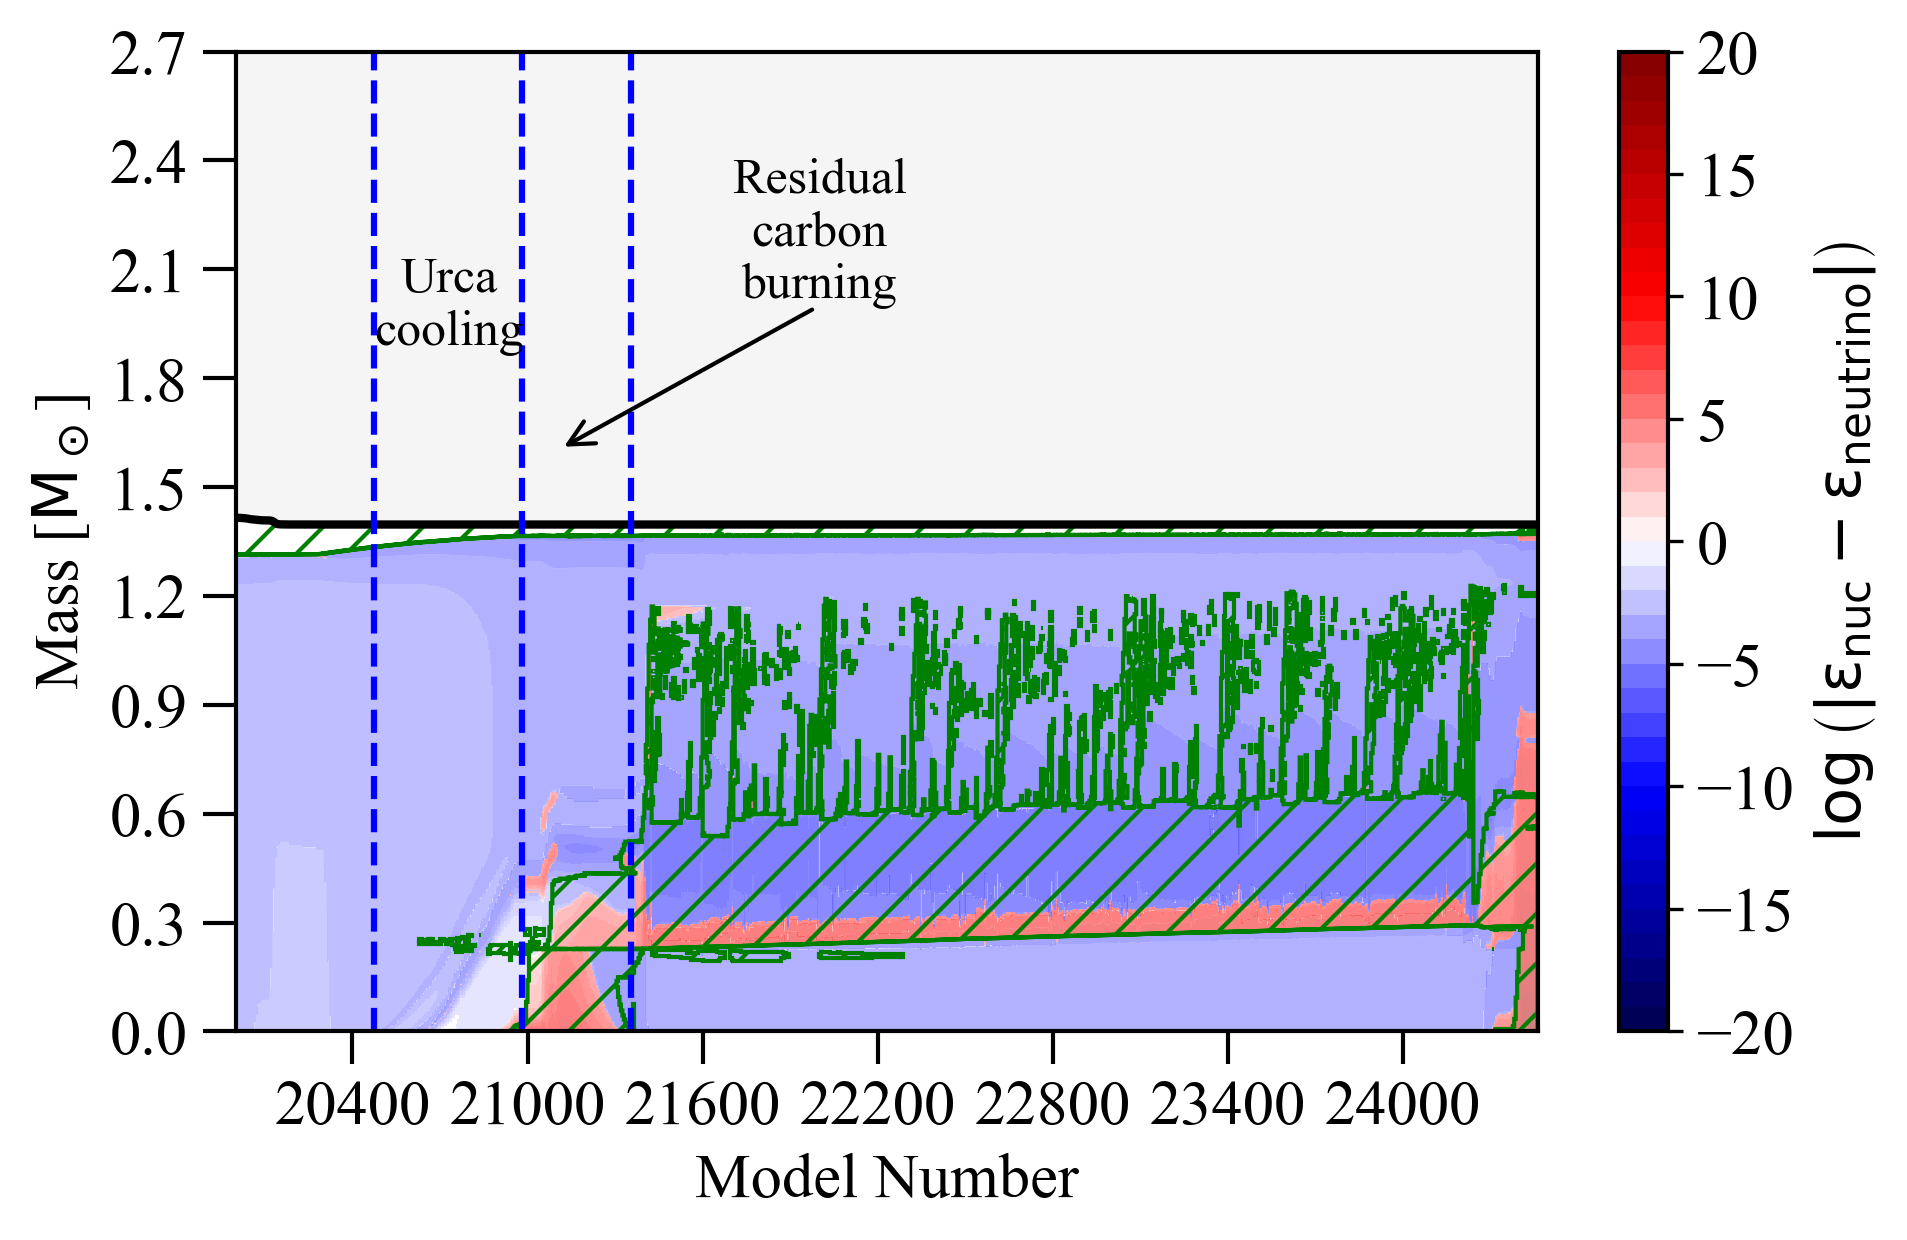
Following carbon burning, the degenerate core is composed primarily of oxygen and neon; , , as well as traces of residual carbon; , or , where refers to the mass of the degenerate core that is composed of carbon. The top panel of Fig. 7 shows the Kippenhahn diagram for this model as a function of remaining time (left), and as a function of model number, focusing on the evolution following carbon burning (right). For the last 104 yr of the evolution, the center contracts and cools due to thermal neutrino losses, while the envelope expands and develops a deep convective region that penetrates into the thin nuclear burning shell. Using the standard MLT formalism, during this stage the envelope becomes dynamically unstable, resulting in numerical convergence issues. This is a known problem in radiation-dominated envelopes of massive stars where convection is not strong enough to carry away energy. With the MLT++ that we employed in our calculations (see Sect. 4.4), the envelope is allowed to expand to R⊙, as can be seen in the bottom panel of Fig. 8, and Fig. 10 where we display the maximum radius of our Series I models as a function of the initial helium star mass. The star reaches high luminosities ( L⊙) resulting in a very strong wind of M⊙ yr-1 that removes the helium envelope on a timescale of kyr. At the same time, a large amount of metals is produced in the envelope as a result of helium-rich material being processed in a very hot burning shell. This is yet another unique feature of models in this mass range which, for the final yr of their evolution, possess an extended atmosphere composed entirely of metals, as can be seen in Figs. 8 and 9.
While the evolution and exact composition of the envelope are somewhat uncertain due to the dependence on the energy-transport mechanism and the limited nuclear network that we employed, the estimates for the wind mass loss rate are consistent with the theoretical upper limit for super-Eddington winds (Owocki et al. 2004; Smith & Owocki 2006). The aforementioned behavior, also appears to be indifferent to variations in wind efficiency (see Sect. 4).
The mass of the star following this phase is , while the mass of the degenerate core has reached , due to shell accretion at an average rate of . Subsequently, the core continues to grow in mass at a rate of until it reaches a mass of (see Fig. 8). The late evolution of the core is represented by the blue curve in Fig. 3. For the last 5 kyr, compressional heating is balanced by thermal neutrino emission, until the onset of Urca reactions. The (,), and (,) Urca pairs are of utmost importance, at densities , and , respectively. Both aforementioned reactions cool the core, effectively delaying the onset of runaway thermonuclear burning. Following the Urca cooling phase, there is no significant neutrino emission and the core evolves along the adiabatic curve between . Further compression leads to exothermic -captures on nuclei at . Following the onset of these reactions, the temperature rises sufficiently for residual carbon to ignite, as the star enters a brief carbon burning phase (3 yr), as seen in the top right panel of Fig. 7. The central temperature at the time the core has reached its maximum compactness is . The energy yield from carbon burning is sufficient to raise the temperature further for explosive oxygen burning to occur. As a result, a thermonuclear runaway ensues at , when the average electron-to-baryon ratio of the core is , and the total binding energy is . This ignition density is much lower than what is expected for typical ECSNe; . Our simulation indicates that the energy released at this stage, causes the core to expand. In turn, this means that -captures on are likely completely avoided. As discussed in ACGL20 and in Sect. 3.4, the available nuclear energy in principle suffices to completely unbind the star which, by virtue of vigorous shell burning, contains no helium at the time of the explosion. Such a thermonuclear runaway would therefore be observable as a SN Ia subtype. Further details on the chemical makeup of this model, at various evolutionary points, can be found in Appendix A.
In total, only four ONe models from Series I evolved past the runaway oxygen burning phase (green fully hatched squares in Fig. 4) before terminating due to numerical difficulties related to high temperatures ( K). An additional seven models from Series II (Section 4) also initiated oxygen burning before stopping for the same reason (). Furthermore, sixteen models terminated during the Urca cooling phase, when they already had a near- core—within the range—and no helium in their envelopes (hatched squares in Fig. 4). All remaining Series I ONe models terminated during the envelope ejection phase (i.e., following carbon burning), due to numerical convergence issues, when their core mass was in the range (green, non-hatched regions). Consequently their final fate is not directly constrained by our simulations. We encountered similar numerical issues for the majority of models that we label as CONe WDs. We note that it might be the case that some of these CONe cores could still end up as ONe cores (given that the C-flame will not be quenched).
The lowest-mass model with an ONe core that reached , had . Hence, it is reasonable to assume that all stars with , and higher masses () are also capable of developing a near- core and initiating explosive oxygen burning. This conclusion is further supported by the core growth rates of these models when the simulations stopped; (; see also Poelarends et al. 2017). For , the least massive model that developed a core had an initial mass of . As can be seen in Fig. 4, for lower metallicities, terminal core masses and final outcomes are even more uncertain. However, based on the overall trend of the initial-to-final mass relation shown in Fig. 11, we conclude that at least models with reach the Chandrasekhar-mass limit, independently of metallicity and overshooting. ONe cores that do not manage to reach the Chandrasekhar-mass limit become massive ONe WDs instead (we recall that our most massive CONe WDs have masses of ). However, none of our models successfully settled on the WD cooling track.
To further constrain the initial-to-final mass relation, we attempted to interpolate between our models, by fitting a power-law function of the form , as can be seen in Fig. 11. Here, we only used models that terminated after ejecting most of their envelope (residual envelope mass ), as well as those that evolved toward a core-collapse SN. We found reasonable fits only for models, as those terminated at similar evolutionary stages. These fits similarly suggest that the Chandrasekhar-mass limit can be reached for .


3.3 Hybrid CONe cores with near- masses
Two of our Series I models developed a hybrid structure in their core, but still managed to reach the Chandrasekhar-mass limit. Both stars had an initial mass of , , and . The explosive ignition of carbon and oxygen was initiated at even lower densities compared to the case of ONe models, due to the significantly larger amount of residual carbon. The degenerate core for the model with is represented by the magenta track in Fig. 3. The core composition is dominated by carbon and oxygen, with and respectively (average values for the degenerate core). Since the carbon flame does not reach the center, the Urca pairs (,), and (,) do not play a major role in the temperature evolution. The lower panel of Fig. 7 shows the Kippenhahn diagram for the same model. In the absence of significant Urca cooling, once the compressional heating timescale is equal to that of thermal neutrino emission, the density continues to rise until the onset of explosive carbon- and oxygen burning at a density of . The substantially larger amount of carbon compared to the ONe cores discussed in the previous section, could in principle lead to more energetic explosions. The central temperature, when density reaches its maximum value, is . As in the case of ONe cores, the helium envelope of those hybrid models is lost only after the core has reached a near-Chandrasekhar mass value. If the envelope is removed at an earlier stage, for instance as a result of mass transfer or a common envelope event, then a sub-M hybrid CONe WD would have been formed, similarly to the models discussed in Sect. 3.1.
3.4 Pre-explosion properties of (C)ONe cores: SNe Ia and ECSNe
Based on the results presented above, stars with a degenerate near- core in the range may experience one of the following outcomes: firstly, for ONe cores, if oxygen ignites at low densities () and the core immediately expands as a response to the thermonuclear runaway, then -captures on may be completely avoided. In this case, the star may undergo a thermonuclear runaway that resembles a SN Ia explosion. The kinetic energy of the ejecta and the composition of the material depend on the explosion conditions, for instance and .
Secondly, hybrid near- cores ignite oxygen at even lower densities (). These objects do not experience -captures and may yield SN Ia-like explosions with higher kinetic energies compared to ONe cores.
Lastly, if an ONe core ignites oxygen at high densities () then -captures on lead to rapid deleptonization, and the star evolves toward an ECSN. Depending on the explosion conditions, the latter can be either a tECSN, in which part of the star is disrupted, or a ccECSN that forms a neutron star.
In the remainder of this section, we describe the pre-explosion properties of models that successfully initiated explosive oxygen burning. A more in-depth discussion on the possible final fates of near- models that terminated before reaching this stage follows in Sect. 4.
Figure 12 summarizes the relation between , central density, and binding energy at the onset of oxygen ignition for the twelve models that evolved past this phase. As can be seen, with few exceptions, the binding energy of these models lies within and the average electron-to-baryon ratio is . Our simulations indicate that these stars respond to oxygen burning by expanding. As discussed in ACGL20, if one assumes that the thermonuclear runaway produces a typical SN Ia composition ( of iron-peak and of Si-group elements), then the nuclear energy yield suffices to completely unbind the star and produce ejecta with kinetic energies . Consequently, these thermonuclear runaways would belong to the first category (ONe SNIa explosions). The exact yield depends on when the deflagration transitions to a detonation, and cannot be directly predicted by our simulations. If nuclear statistical equilibrium is achieved when the cores are still around their maximum compactness, then based on the core compositions shown in Fig. 12, the resulting explosions would synthesize mostly stable iron-group elements and only of radioactive iron-group elements. Such low nickel yields would translate to underluminous explosions with light curves resembling those of SNe Iax (e.g., Jha 2017). On the other hand, if the cores expand before a detonation occurs, then up to of nickel may be synthesized (see ACGL20).


As can be seen, two models ignited oxygen when . The model represented by a red square corresponds to the CONe cores described in Sect. 3.3 and produces an explosion that belongs to the second category (CONe SNe Ia). The other model (depicted with brown color) is a Series II ONe core with initial mass of and an enhanced wind efficiency of (see Sect. 4.1.3). The explosion would belong to the first category discussed above, producing ejecta with kinetic energy of . Finally, one Series II model with reduced wind efficiency, ignited oxygen only after surpassing the density threshold for -captures on and will therefore produce an ECSN. As we discuss in Sect. 4, we identify the decisive property for this behavior to be its low residual carbon abundance. Hence, we expect the same outcome for all stars with similar compositions.
3.5 Core-collapse supernovae
If (for models without overshooting), then the core reaches a sufficiently high temperature to undergo on-center carbon ignition, under nondegenerate conditions, leading to more advanced burning stages. The evolution of these stars is similar to those described in Jones et al. (2013) and Woosley (2019). Models that fall within this category, develop a silicon core and evolve toward an iron core-collapse that ultimately forms a neutron star. These models retain a -rich envelope, so assuming that a successful explosion follows the collapse of the core, it would probably be observable as a SN Ib. Type Ic SNe are also expected to form from stripped-envelope stars, but not in the mass range of our models, unless additional mass loss takes place, either via winds, pulsations (Aguilera-Dena et al. 2022), or case BB mass transfer, which may result in the formation of ultra-stripped SNe (Tauris et al. 2015).
4 Physical uncertainties
4.1 Wind and mass loss uncertainties
There are two phases where mass loss through stellar winds affects the outcome of our model computations. Firstly, because of its long duration, mass loss during the core helium burning phase may influence both the total mass and the size of the degenerate core. In our Series I models the total mass removed in this phase is . Secondly, our models reach very high luminosities toward the end of their evolution, when they expand and their atmospheres become cooler (up to for the example in Fig. 8). In this short phase, the remaining -envelope is likely removed. The competition between envelope removal and core growth is critical for the final fate of the star: if the envelope is lost before the core reaches the Chandrasekhar-mass limit, then the star becomes a WD. Contrarily, if enough of the envelope survives, helium might become observable in the resulting explosion.
In our models, we adopted the Dutch mesa wind scheme which extrapolates empirical mass loss relations for more massive Wolf-Rayet (WR) stars from Nugis & Lamers (2000) for K, and uses the prescription of de Jager et al. (1988) for cool stars. These mass loss rates are uncertain and may overestimate the total mass lost during the post main sequence evolution (Beasor et al. 2021). Empirically mass loss rates for low mass helium stars are also still very uncertain, mainly because they are only formed in binary systems where they are difficult to observe (Smith et al. 2018; Zapartas et al. 2017). Recent theoretical work suggests that mass loss rates in this regime could lie significantly below the relations for massive Wolf-Rayet stars (Gräfener et al. 2017; Vink 2017).
In late phases, when the degenerate core is near its maximum mass, our models reach extremely high super-Eddington luminosities of up to . This results in a strong stellar wind that eventually removes the -rich envelope. While the mass loss rates of such stars are also extremely uncertain, it is notable that the maximum wind strength achieved in our models lies near the theoretically expected maximum values for super-Eddington winds (Owocki et al. 2004; Smith & Owocki 2006).
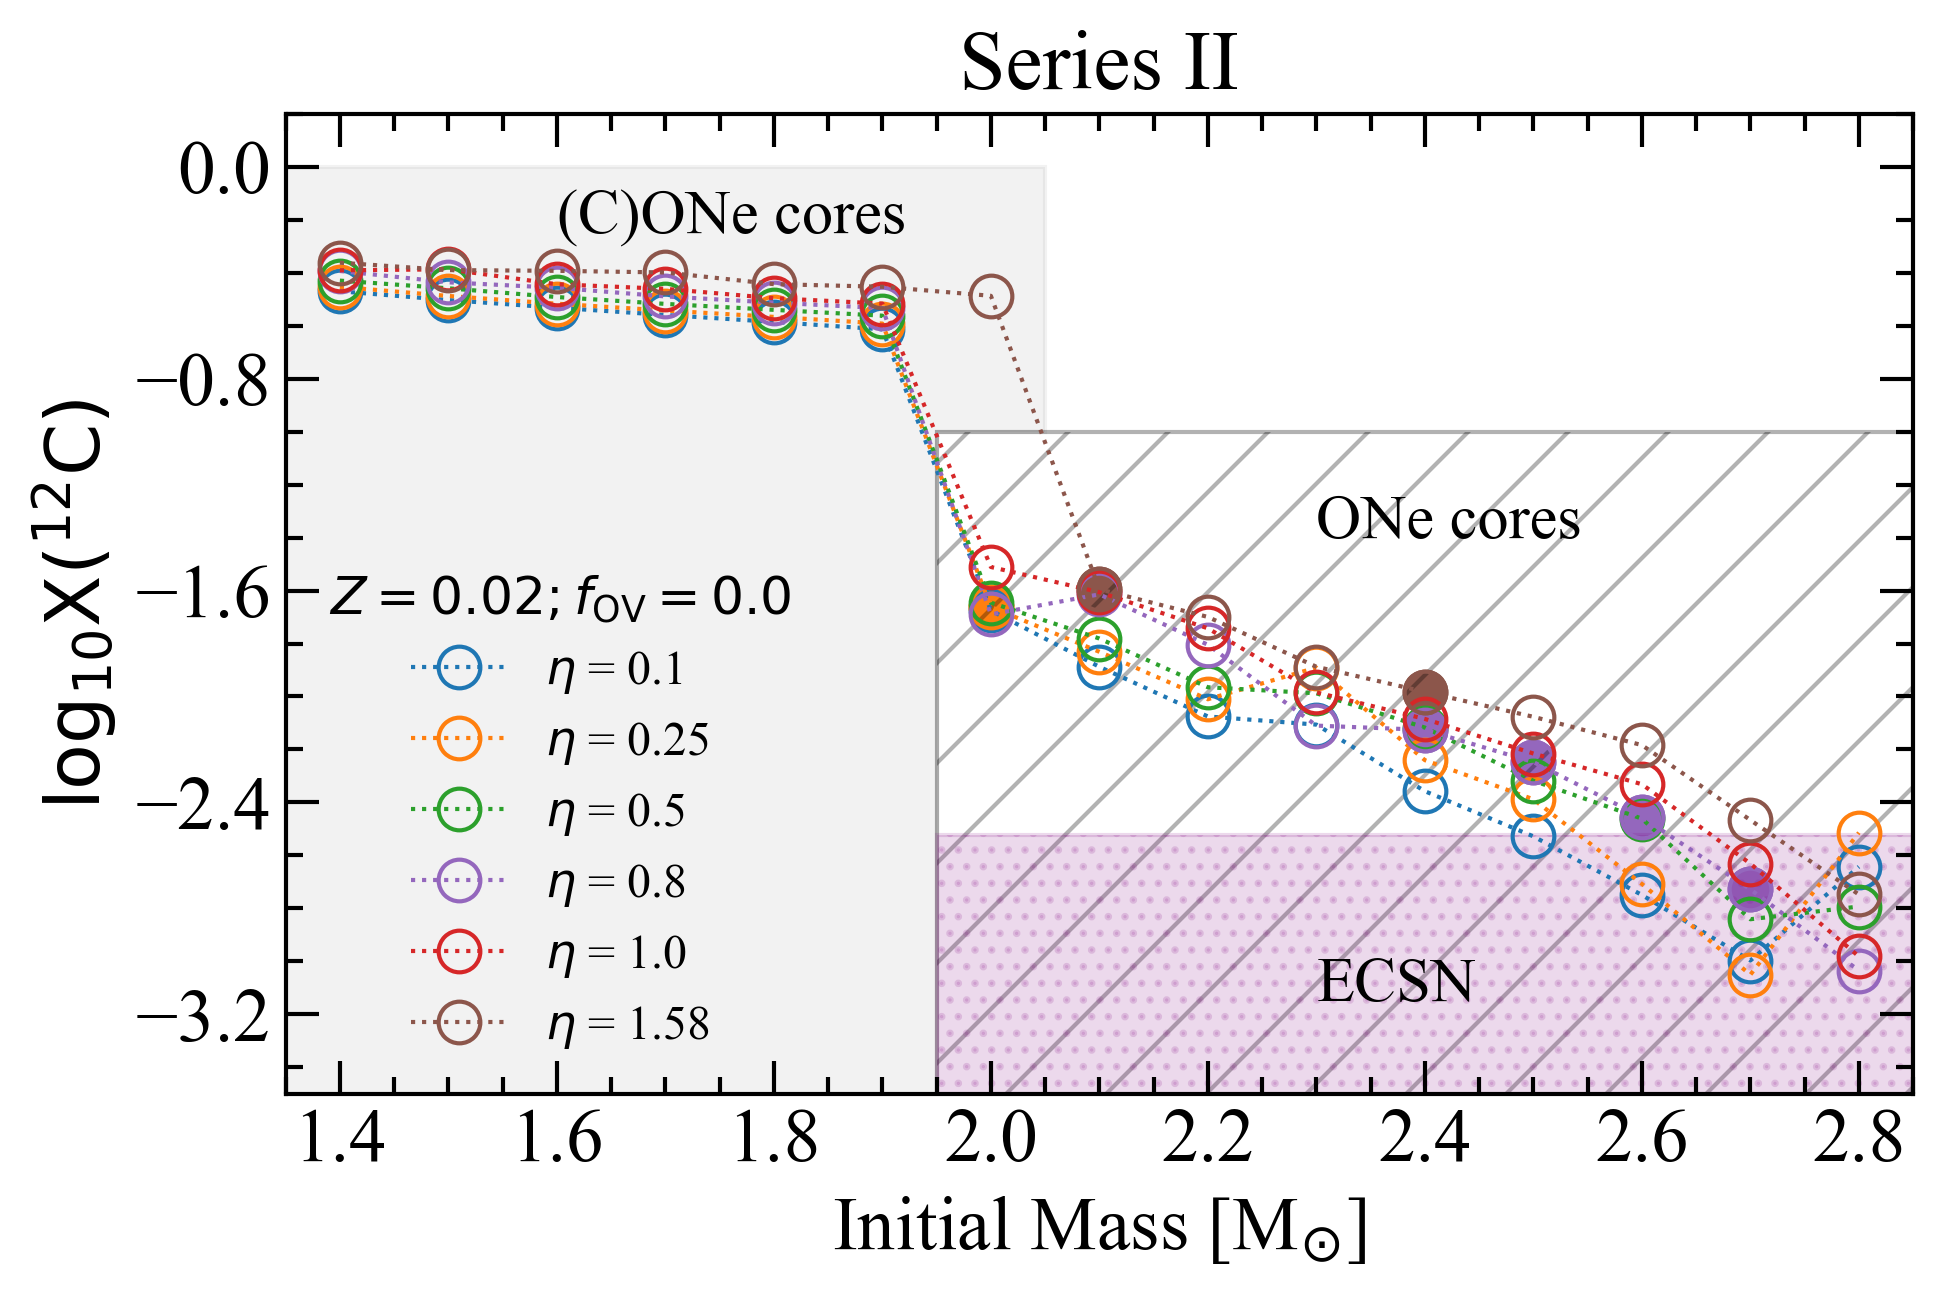
To further explore the influence of mass loss uncertainties, we computed an additional grid consisting of 110, models, with varying wind efficiency parameter (). Figure 13 shows the effects of wind on core growth (top panel), and on the retention efficiency of envelope mass (bottom panel). Notwithstanding that most models in the mass range terminated during the Urca reactions stage, we find that the ability of the core to reach a near-Chandrasekhar mass is not hindered by the adopted wind efficiency parameter. Contrarily, the mass of the envelope retained by the star is sensitive to the -parameter. The chemical composition of the envelope is similar to our Series I models, where the original helium-rich envelope has been replaced by a metal-rich atmosphere due to intense helium shell burning (see Appendix A). As all models within the subsets failed to converge after the -captures on , in the remainder of this section we describe some representative evolutionary models from the remaining subsets, namely .


4.1.1
In this section, we present the evolution of a Series II model with initial mass of , since it is the lowest initial mass model with able to achieve oxygen ignition, and simultaneously holds the most massive envelope compared to similar models within this grid.
The off-center ignition of carbon took place at a mass coordinate of when the total mass of the star was and the mass of the core was . The main carbon burning phase lasted , resulting in an ONe core of , composed primarily of oxygen and neon with central abundances of and respectively. The degenerate core also retained some residual carbon mass fraction of . During this time the star grew to R⊙ and had an effective temperature of while it was losing mass at a rate . At the end of the simulation it possessed a helium-free, metal-rich envelope of (see Fig. 18).
Figure 14 illustrates the evolution of the core in terms of central density and central temperature. By comparing the adiabatic tracks of this models (orange line) with the Series I fiducial model (grey dash-dotted line) one sees that the core is significantly hotter after the end of the Urca process. The inefficiency of Urca cooling is most likely related to the smaller amount of distributed in the core, compared to the Series I fiducial model versus 0.057, respectively). As the core compresses adiabatically, the star enters a short carbon simmering phase. The structure of the star during this period is depicted in the top right panel of Fig. 15. After the temperature has increased up to causing residual carbon to ignite before the density reaches the threshold value for -captures on nuclei. This results in an even lower ignition density for the deflagration front at which, most likely, affects the transition time from deflagration to detonation and consequently the whole explosion dynamics. At the onset of oxygen ignition, the model has a binding energy of with an average electron-to-baryon ratio of the core . Hence, this star is also prone to complete disruption.

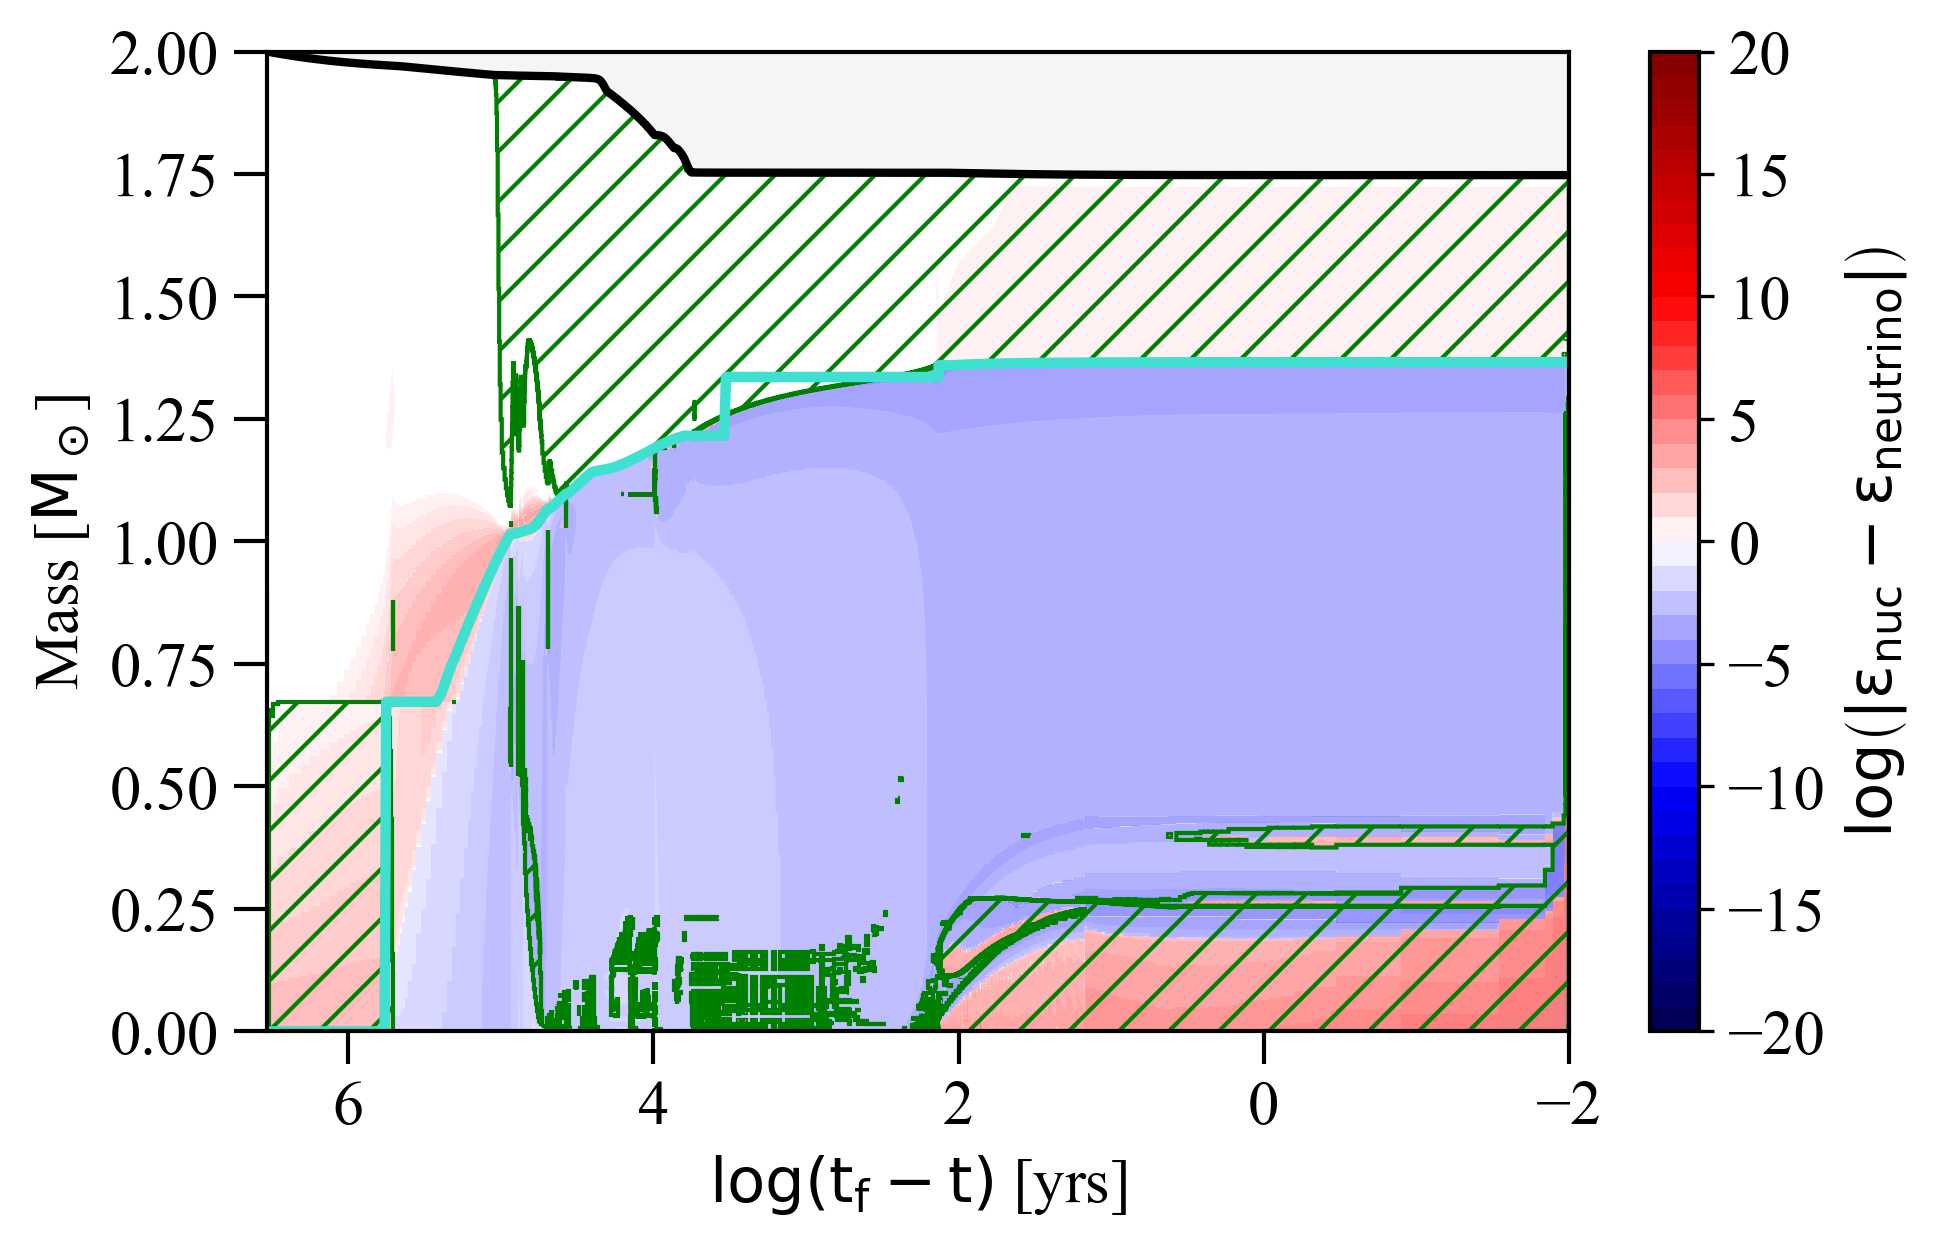
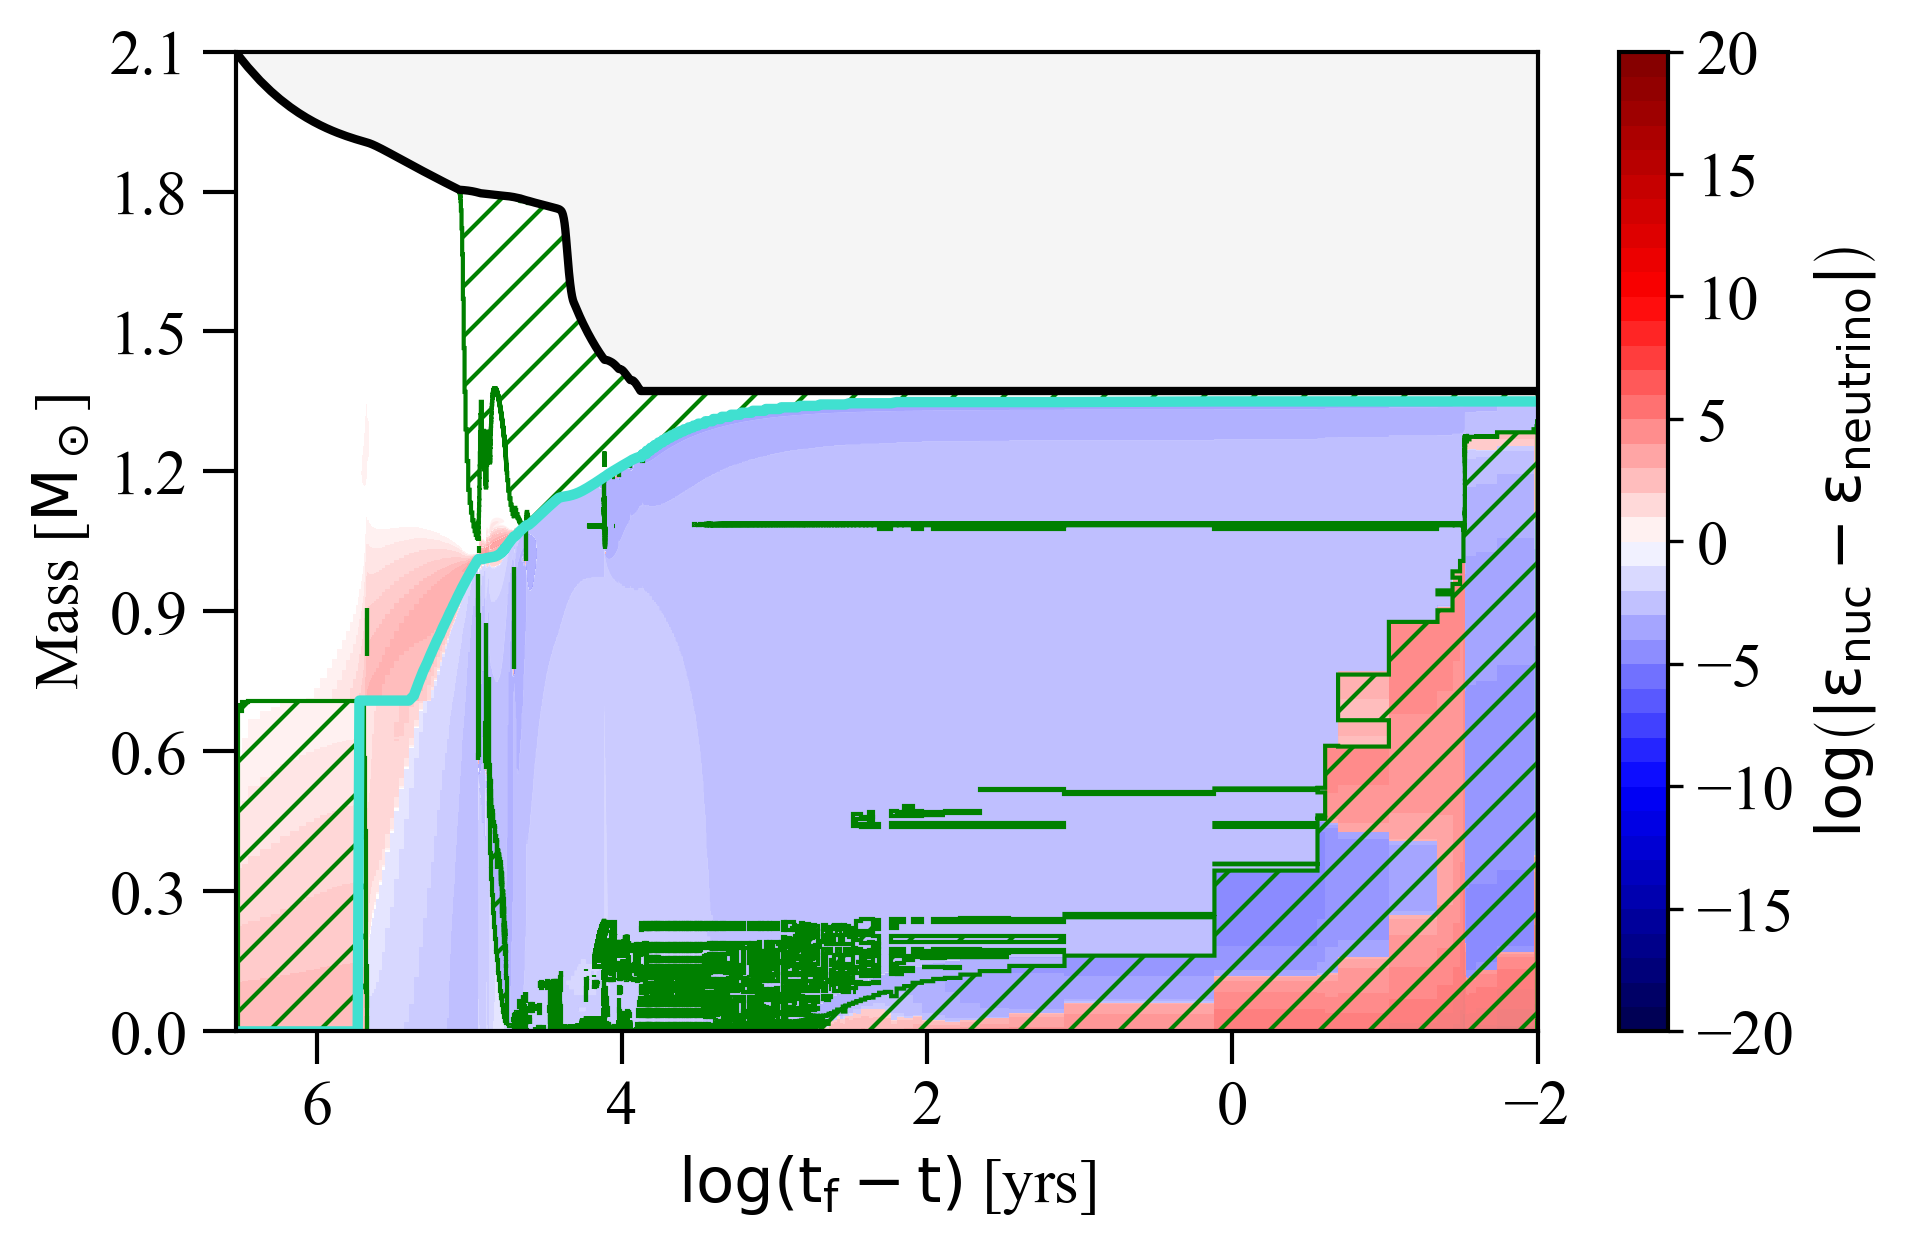
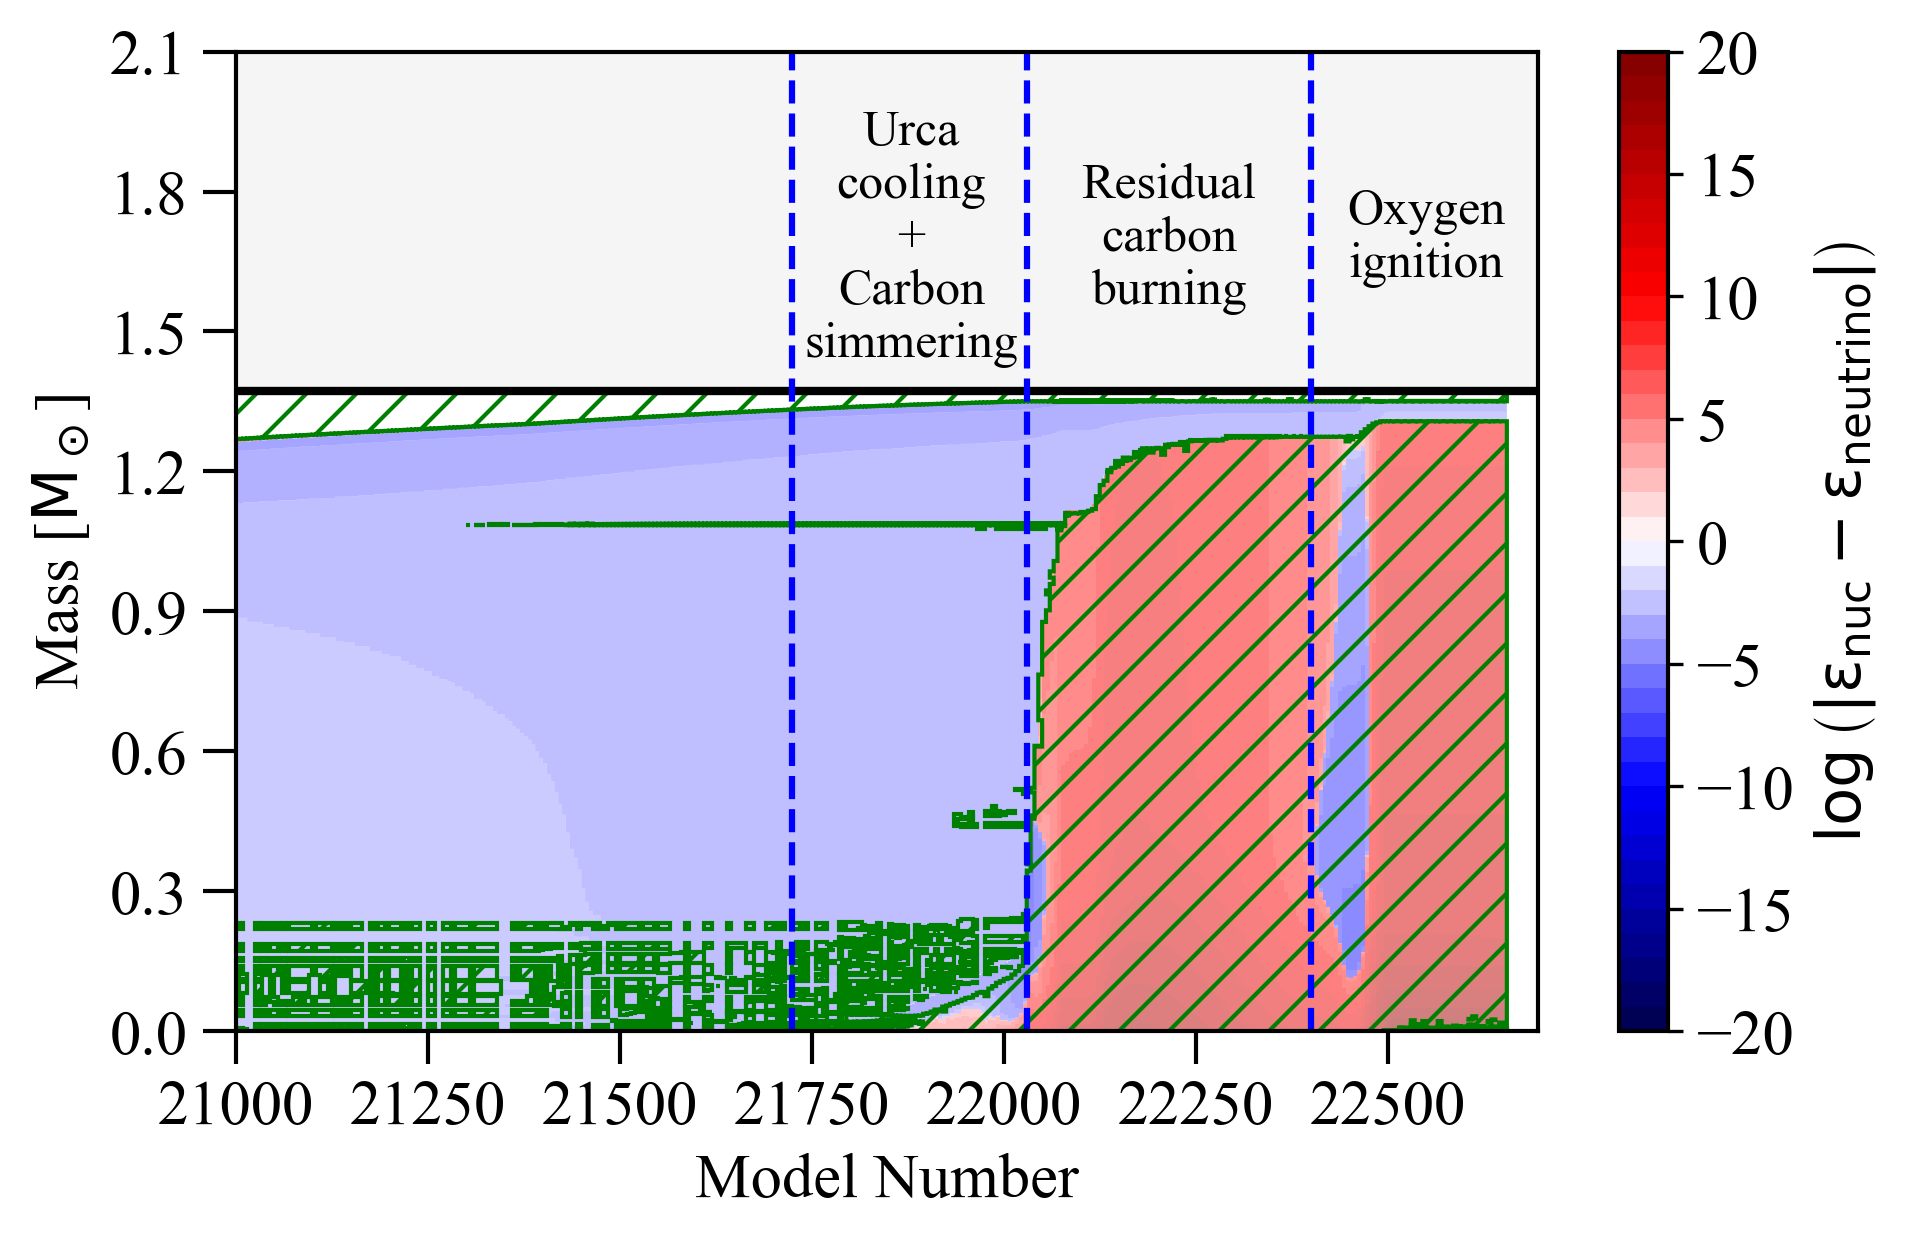
As we discuss above, mass loss rates for Wolf-Rayet stars currently employed by many stellar evolution codes probably overestimate the strength of the wind in low mass helium stars (e.g., Vink 2017; Sander & Vink 2020). The formation of thermonuclear supernovae progenitors through our evolutionary channel in models with such a small wind efficiency demonstrates the robustness of our conclusions to assumptions in the wind.
4.1.2
For the subset of models with , only four in the mass range , reached the residual carbon ignition stage. All of these models develop a degenerate ONe core of with an average residual carbon abundance of . Three of them ignited oxygen at low densities, with the subsequent evolution being almost identical to their Series I counterparts.
One stellar model however, ignited oxygen at higher densities, within the ECSN regime (purple line in Fig. 14). This model had an initial mass of and retained only of carbon mass fraction. Shortly after the -captures on nuclei, the residual carbon ignited when . After the depletion of carbon, the core expanded, and the burning region moved into a thin shell. This is illustrated in the middle-right panel of Fig. 15. After the core contracted again, reaching the threshold density for -captures on (). The thermal runaway occurred when and the average electron-to-baryon ratio of the degenerate core was . The core at this point was primarily composed of oxygen and neon with and , respectively.
4.1.3
We also investigated the evolution of models with an enhanced wind efficiency. We were able to follow the evolution of only two models, after oxygen ignition. The first stellar model had an initial mass of and ignited carbon off-center when the total mass is . The characteristics of carbon burning (ignition location, flame propagation) and the evolution of the envelope are similar to the ones we describe in Sect. 4.1.1. As a result of the enhanced wind efficiency, the star lost mass during this time at a rate of allowing the degenerate ONe core to grow to with a central abundance of residual carbon circa .
After the onset of Urca cooling, the star entered a simmering phase that lasted , until the core reached its maximum compactness when . When this happened, the temperature reached a value of , triggering residual carbon ignition. The next were characterized by vigorous burning which led to a thermal runaway. At the time of oxygen ignition the core had a central abundance of and , and an average electron-to-baryon ratio of .
The second stellar model had an initial mass of , an ONe core of , and a central abundance of leftover carbon of . Its evolution followed the same steps already described above. The main difference was that after the depletion of residual carbon, the core expanded significantly and oxygen was ignited off-center. This resulted to residual oxygen being distributed within a silicon core , as seen in the bottom-right panel of Fig. 20. Although we could not follow the evolution past this stage, the model most likely evolves toward a core-collapse SN, similar to the ultra-stripped SN scenario described by Tauris et al. (2015).
4.2 Residual carbon: (C)ONe SNe Ia vs ECSNe
In Sects. 3.2 and 3.3 we discussed how in a subset of our (C)ONe models, the ignition of residual carbon leads to explosive oxygen burning. Besides its critical role in enabling thermonuclear explosions, the amount of residual carbon may also influence the explosion energetics and yields (see Sect. 3.4 and also Willcox et al. 2016). The carbon abundance in (C)ONe WDs also influences their ability to trigger SNe Ia via mass accretion (e.g., see Dominguez et al. 1993; García-Berro et al. 1997; Gutiérrez, J. et al. 2005; Waldman & Barkat 2007; Schwab & Rocha 2019).
To further gauge the importance of residual carbon in determining the final fate of our models, we also computed a 2.5 model in which the rate of all carbon-participating nuclear reactions was set to zero, once the central density became larger than for the first time (black cross-mark in Fig. 3). The evolution of this model is represented by the blue dashed line in Fig. 3. As can be seen, in the virtual absence of carbon, the evolution of the core is almost identical to our fiducial model (blue line) up to the point where -captures on occur. From there on, instead of igniting oxygen, the model evolves toward higher densities until it crosses the threshold for -captures on , thereby triggering an ECSN. A similar outcome was found for the Series II model represented by the purple line in Fig. 14, which had an average residual carbon mass fraction of . This behavior confirms that the final outcome (ONe SN Ia vs ECSN) of near- cores depends critically on the residual carbon mass fraction. In Fig. 6, one sees that the latter varies significantly, both with initial mass and metallicity. More specifically, one sees that lower-mass models generally retain more carbon. Variations are also seen as a function of metallicity, especially for . For example, for and , one sees that the model has more than 10 times less carbon than the one. Finally, one also sees some small variations with wind efficiency, which imply that the core evolution is not completely decoupled from the envelope during carbon burning (lower panel of Fig. 6).
The model with the lowest amount of residual carbon that was able to initiate an ONe SN Ia, had an initial mass of and a mass averaged carbon mass fraction of within the degenerate core. Hence for an ONe SN Ia to occur, the core must have a minimum carbon mass fraction of (see Appendix A for distribution profiles). Based on these constrains, we conclude (rather conservatively) that near-ONe cores with carbon mass fractions experience an ONe SN Ia, while those with a smaller carbon content undergo an ECSN (thermonuclear or core-collapse). Given that the carbon abundance in the core changes with initial metallicity, so does the relative rates of ONe SNe Ia and ECSNe, with the former being more likely for higher metallicities.
4.3 Binary interactions
A key feature in the evolution of hydrogen-rich SAGB stars is the occurrence of the 2DU episode, during which the mass of the helium core is being reduced. Moreover, the existence of two burning shells in the structure of these stars leads to periodic thermonuclear instabilities that reduce the accretion of material onto the core (Denissenkov et al. 2013). These two effects make it harder for the core to grow, leaving only a very narrow window, in the mass range, for which the cores of SAGB stars can finally reach the Chandrasekhar-mass limit. Owing to the absence of a hydrogen envelope, our models are not subject to any of those effects, although our models do experience a shallower dredge up which it does not seem to have the same impact as the 2DU to the -rich counterparts. However, since helium stars in our considered mass range are expected to be produced in binaries, some residual hydrogen may be present in the envelope when these stars detach from their Roche lobes (Sen et al. 2022, and references therein). This thin layer of hydrogen might influence the evolution, for instance by increasing the surface luminosity (and therefore mass loss rate) due to additional shell burning, or by inducing instabilities such as the ones described above. This could potentially inhibit the growth of the core and therefore reduce the expected mass range for core-collapse.
Similarly, binary interaction, both during and after core helium burning, can potentially influence the final core mass. As can be seen in Fig. 10, our models remain relatively compact () during this phase. Hence, additional mass stripping via Case BB mass transfer is only expected to play a significant role in very compact binaries. Contrarily, we find significant radius expansion for all models with initial masses above (see lower panel of Fig. 10), meaning that late mass transfer likely affects the most extended SAGB stars, independently of their final fate ((C)ONe SNe Ia vs ECSNe vs iron core-collapse). While such interaction is not considered in our models, it will most likely influence our results by effectively shifting the mass boundaries shown in Fig. 4. Bearing in mind the importance of these caveats, we plan to investigate this further by performing detailed binary calculations in a future project.
4.4 Other sources of uncertainty
Besides the effects discussed previously in this section, there are several additional physical uncertainties that may influence the final fate of stars in this regime. One of these uncertain factors is the propagation of the flame during the main carbon burning phase. Both the ignition location of carbon and the flame propagation speed are sensitive to several physical mechanisms such as thermohaline, convective and rotational mixing, the neutrino cooling timescale, and other uncertainties related to winds (Farmer et al. 2015, and references therein). Here, we only investigated one small component of this issue that is related to convective overshooting. Our models confirm that the carbon flame propagation is indeed sensitive to assumptions related to mixing, suggesting that other mixing mechanisms may play a significant role as well.
The accuracy of numerical calculations during the late stages of the evolution also contributes some uncertainty. It is unclear if our simulations can accurately reproduce the structure and properties of the outermost layers of stars with convective envelopes. For instance, our models reach a short phase of super-Eddington luminosities causing convection to become insufficient to transport the energy, due to the necessary high superadiabatic temperature gradient. This leads to increasingly short timesteps when one attempts to resolve this evolutionary stage. In our calculations, we circumvented these issues by artificially reducing the superadiabatic temperature gradient using the MLT++ option, which increases the efficiency of convective energy transport. However, this approach also influences radii estimates, as it suppresses envelope inflation, thereby also affecting other properties such as the effective temperature and surface luminosity.
During the aforementioned super-Eddington phase, some of our models also achieve effective temperatures that are below the lowest temperature covered by the OPAL opacity tables included in mesa . This forces mesa to use other low-temperature opacity tables that in principle assume different composition. This means that there might be significant changes in opacity at the location of the blend due to the change in the assumed composition (see Schwab 2019, for details). These issues motivate further investigations to understand the complex underlying physics of stellar winds and envelope ejection.
Finally, we did not investigate in detail the impact of uncertainties in nuclear reaction rates. For instance, the uncertain , and rates may substantially influence the pre-SN and abundances. Similarly, as Strömberg et al. (2022) point out, the details of -capture processes and the associated weak reaction rates can also introduce substantial uncertainties. They argue that taking into consideration the second forbidden transition lowers the threshold density for , allowing it to occur soon after the , for temperatures . We did not consider this transition in our calculations. Instead, the temperature in this regime increases in two separate steps, at slightly different densities, owing to the allowed transition between and , and the between the and . For our models that feature residual carbon in their cores, the close succession of those two reactions—forced by the forbidden transition—could have a non-negligible effect on the overall outcome by reducing the carbon ignition density.
5 Summary & discussion
Antoniadis et al. (2020) presented a case study of two helium star models that develop a degenerate (C)ONe core and subsequently experience a thermal runaway when their central density is . These stars likely avoid -captures on and produce a (C)ONe SN Ia. In this work, we build on this result by using mesa to model the evolution of helium stars, exploring the influence of initial composition, stellar-wind efficiency, and mixing assumptions. Our models confirm that (C)ONe SNe Ia may occur for a sizeable fraction of helium stars in the range. The salient properties of our models which we identify as responsible for enabling this outcome can be summarized as follows: firstly, unlike hydrogen-rich SAGB stars, our models do not experience a 2DU episode, nor undergo unstable shell burning. Consequently, their cores grow fast via stable -shell burning. This significantly broadens the mass range for which stars develop degenerate Chandrasekhar-mass cores. Our findings (Fig. 5) are consistent with previous studies (e.g., Podsiadlowski et al. 2004; Poelarends et al. 2008, 2017), confirming that ECSNe are mostly relevant to interacting binary systems. In Sects. 3.2 and 3.3 we argue that all (C)ONe cores originating from helium stars with initial masses are able to reach the Chandrasekhar limit, independently of overshooting efficiency and initial metallicity. At and , near- cores become possible for all stars with . This includes the entire mass range for which ONe cores are produced. Consequently, ONe WDs are not expected for these initial conditions.
Secondly, (C)ONe cores are formed via carbon burning that initiates off-center and propagates inward. This leaves a certain amount of unburned carbon distributed throughout the core. In Sects. 3.2 and 4.2 we demonstrate that leftover carbon plays a critical role in determining the final fate of near- (C)ONe cores. For hybrid CONe compositions, residual carbon ignites when leading to a thermonuclear runaway. Similarly, in ONe cores a carbon simmering phase is triggered by exothermic -captures on and . This may raise the temperature sufficiently to initiate explosive oxygen burning when .
Our models suggest that degenerate cores with a mass averaged mass fraction of produce ONe SNe Ia, whereas those with lower mass fractions yield ECSNe (Section 4.2). This is approximately equal to 0.005 of residual carbon distributed in the degenerate core. Figure 6 illustrates how the residual mass fraction varies with initial mass, composition, and overshooting efficiency. Larger residual carbon mass fractions are favored for lower masses and high metallicities, especially for . This means that (C)ONe SNe Ia are mostly relevant to high-metallicity environments: for , the initial mass range for which near- degenerate cores have is or for and 0.016, respectively. For , the corresponding range becomes and for and 0.016.
Thirdly, prior to collapse, near- models undergo a period of vigorous shell burning, during which the envelope reaches super-Eddington luminosities. In Sect. 3 we demonstrate that this “hot-bottom -burning” episode leads to helium-free, metal-rich envelopes. In Sect. 4 we explore uncertainties related to the power of the stellar wind. We find that the final envelope mass depends on the strength of the stellar wind during the core helium burning phase. However, in all cases, no helium is present at the time of core-collapse.
In Sect. 4 we discuss several factors that could affect these explosions, including uncertainties in nuclear reaction rates, mixing processes, stellar winds, and binary interaction. If (C)ONe SNe Ia indeed occur in nature, they can significantly influence the properties of compact object populations, as well as the chemical evolution of galaxies. For instance, the formation of neutron stars via ECSNe in binaries would be affected, particularly at high metallicities. Such potentially important consequences raise the question of how (C)ONe SNe Ia and their progenitors could be identified. In Sect. 3.4 we estimated that (C)ONe SNe Ia have a sufficiently large reservoir of nuclear energy to appear similar to normal SNe Ia in terms of iron-group elements yields and kinetic energies. Evidently, more robust constraints on the nucleosynthesis and explosion energies require detailed multidimensional hydrodynamic simulations of the explosive oxygen burning phase. Another distinct characteristic that could help constrain their observational counterparts is the intense mass loss taking place during the few thousand years leading to the explosion. This mass loss history will likely create a dense metal-rich circumstellar material (CSM) that can subsequently interact with the SN ejecta. This presents some similarities to the “core-denegerate” SN Ia scenario (e.g., Wang et al. 2017; Soker 2019, 2022). However, binary interactions—involving these stars with the most extended envelopes—may occur leading to a more diverse CSM spectrum.
In terms of explosion sites, we expect (C)ONe SNe Ia to be relevant mostly to high-metallicity star-forming regions. Similarly to ECSNe, we expect a delay time distribution dominated by the main sequence lifetime of their progenitors, that is to be (200 Myr), although it might be possible to form similar ONe cores via WD mergers (Schwab et al. 2016). Antoniadis et al. (2020), argued that the frequency of ONe SNe Ia can be comparable to the observed SNe Ib/c rates. Considering the results presented here, we update the relative ratio between ONe SNe Ia and SNe Ib/c to be at and at (assuming a Chabrier 2005, initial mass function).
Interestingly, these population properties are very similar to what has been inferred for SNe Iax (Foley et al. 2013; Meng & Podsiadlowski 2018; Jha 2017) but also for some high-velocity (e.g., Pan 2020; Zeng et al. 2021) and normal SNe Ia (Maoz & Badenes 2010; Soker 2022). SNe Iax in particular, present some properties that make them particularly attractive as potential ONe SN Ia counterparts. While they are usually interpreted as CO or (C)ONe WD deflagrations (e.g., Kromer et al. 2015; Yamanaka et al. 2015; Magee et al. 2016), at least a fraction of them occur inside a helium-rich CSM (Magee et al. 2019; Jacobson-Galán et al. 2019), while none has been observed in an elliptical galaxy host (Foley et al. 2013). Lastly, at least one nearby SN Iax, SN 2012Z, has been securely associated with a luminous blue progenitor (McCully et al. 2014; Stritzinger et al. 2015; Yamanaka et al. 2015; McCully et al. 2022), with properties similar to those inferred for our ONe models prior to collapse (Section 3).
Besides the explosions themselves, the progenitors of (C)ONe SNe Ia might also be easily identifiable, particularly in the few thousand years leading to the collapse. This is because of their high luminosities (Fig. 2), but most importantly due to their hydrogen- and helium-free, metal-rich atmospheres (Fig. 9). Such peculiar atmospheric abundances are not easily produced via ordinary stellar evolution paths. A unique object that presents some interesting similarities to our progenitor models is WS35 (Gvaramadze et al. 2019; Oskinova et al. 2019). This star is luminous ( L⊙), hot (200,000 K), as well as hydrogen- and helium-free (Oskinova et al. 2019). It is also embedded in a circular nebula (Gvaramadze et al. 2019), that was likely produced via a strong stellar wind. While our progenitor models are somewhat cooler prior to collapse, this could be due to artifacts related to, for instance, mixing assumptions or surface boundary conditions.
Other indirect, but distinct observational evidence could be related to the properties of compact-object populations at different metallicities. For instance if neutron star formation via ECSNe is suppressed at high- environments (Fig. 5), as our results suggest, both the integrated and -dependent double NS (DNS) merger rates would be affected (Mandel & Broekgaarden 2022). One would also expect to see differences between Galactic and extra-galactic DNSs (e.g., in their mass ratio distributions). Similarly, the Galactic pulsar population might also be affected, for example fewer ECSNe could lead to a decreased number of young radio pulsars in wide binary systems and globular clusters (Antoniadis 2021; Willcox et al. 2021, and references therein). However, we note that there might be other core-collapse SN mechanisms that produce low-velocity pulsars (see Antoniadis, John et al. 2022, and references therein)
Lastly, models that do not reach the Chandrasekhar limit, but become (C)ONe WDs instead, also present some interest as possible thermonuclear SN and NS progenitors. Their high masses (up to 1.35; Section 3.1) imply that they only need to accrete very small amounts of mass to become unstable. Their collapse would then lead to a thermonuclear deflagration (Meng & Podsiadlowski 2014; Willcox et al. 2016; Bravo, E. 2019), or the formation of a neutron star in an accretion-induced collapse (e.g., Nomoto & Kondo 1991; Tauris et al. 2013; Ruiter et al. 2019; Wang & Liu 2020). Similarly to what has been discussed in this work, we expect the core composition—particularly the amount of residual carbon and its distribution in the core—to play a critical role in determining their fate (Brooks et al. 2017). It is conceivable that if these WDs can achieve oxygen ignition conditions similar to those of (C)ONe SNe Ia, then the resulting explosions would also have similar appearance. In this case, (C)ONe WDs may contribute SNe Ia with much longer delay times.
Acknowledgements.
We thank the referee for the extremely helpful report. This work was supported by the Stavros Niarchos Foundation (SNF) and the Hellenic Foundation for Research and Innovation (H.F.R.I.) under the 2nd Call of “Science and Society” Action Always strive for excellence – “Theodoros Papazoglou” (Project Number: 01431). GG acknowledges support from Deutsche Luft- und Raumfahrt (DLR) grant No. 50 OR 2009. Results presented in this work have been produced using the Aristotle University of Thessaloniki (AUTh) Aristotelis cluster. SC would like to acknowledge the support provided by the Bonn-Cologne Graduate School for Physics and Astronomy (BCGS) and the IT center of the Aristotle University of Thessaloniki throughout the progress of this research work. This research made extensive use of NASA’s ADS, MESA555http://mesastar.org (Paxton et al. 2011, 2013, 2015, 2018), PyMesaReader666https://zenodo.org/record/826958 (Wolf & Schwab 2017), mesaPlot777https://zenodo.org/record/4729811 (Farmer 2021), Kippenhahn plotter for MESA888https://zenodo.org/record/2602098 (Marchant 2019), Astropy999http://www.astropy.org (Astropy Collaboration & Astropy Contributors 2018), Matplotlib (Hunter 2007), NumPy (Harris et al. 2020), and Jupyter (Kluyver et al. 2016).References
- Aguilera-Dena et al. (2022) Aguilera-Dena, D. R., Langer, N., Antoniadis, J., et al. 2022, Astronomy & Astrophysics, 661, A60
- Antoniadis (2021) Antoniadis, J. 2021, Monthly Notices of the Royal Astronomical Society, 501, 1116
- Antoniadis et al. (2020) Antoniadis, J., Chanlaridis, S., Gräfener, G., & Langer, N. 2020, Astronomy and Astrophysics, 635, A72
- Antoniadis, John et al. (2022) Antoniadis, John, Aguilera-Dena, David R., Vigna-Gómez, Alejandro, et al. 2022, A&A, 657, L6
- Astropy Collaboration & Astropy Contributors (2018) Astropy Collaboration & Astropy Contributors. 2018, The Astronomical Journal, 156, 123
- Beasor et al. (2021) Beasor, E. R., Davies, B., & Smith, N. 2021, The Astrophysical Journal, 922, 55
- Bravo, E. (2019) Bravo, E. 2019, A&A, 624, A139
- Brooks et al. (2017) Brooks, J., Schwab, J., Bildsten, L., Quataert, E., & Paxton, B. 2017, The Astrophysical Journal, 834, L9
- Brown et al. (2013) Brown, J. M., Garaud, P., & Stellmach, S. 2013, The Astrophysical Journal, 768, 34
- Canal et al. (1992) Canal, R., Isern, J., & Labay, J. 1992, The Astrophysical Journal Letters, 398, L49
- Chabrier (2005) Chabrier, G. 2005, The Initial Mass Function 50 Years Later, 327, 41
- Chen et al. (2014) Chen, M. C., Herwig, F., Denissenkov, P. A., & Paxton, B. 2014, Monthly Notices of the Royal Astronomical Society, 440, 1274
- de Jager et al. (1988) de Jager, C., Nieuwenhuijzen, H., & van der Hucht, K. A. 1988, Astronomy and Astrophysics Supplement Series, 72, 259
- Denissenkov et al. (2013) Denissenkov, P. A., Herwig, F., Truran, J. W., & Paxton, B. 2013, The Astrophysical Journal, 772, 37
- Doherty et al. (2015) Doherty, C. L., Gil-Pons, P., Siess, L., Lattanzio, J. C., & Lau, H. H. B. 2015, Monthly Notices of the Royal Astronomical Society, 446, 2599
- Doherty et al. (2010) Doherty, C. L., Siess, L., Lattanzio, J. C., & Gil-Pons, P. 2010, Monthly Notices of the Royal Astronomical Society, 401, 1453
- Dominguez et al. (1993) Dominguez, I., Tornambe, A., & Isern, J. 1993, ApJ, 419, 268
- Farmer (2021) Farmer, R. 2021, rjfarmer/mesaplot: Release v1.1.0
- Farmer et al. (2015) Farmer, R., Fields, C. E., & Timmes, F. X. 2015, The Astrophysical Journal, 807, 184
- Foley et al. (2013) Foley, R. J., Challis, P. J., Chornock, R., et al. 2013, ApJ, 767, 57
- García-Berro et al. (1997) García-Berro, E., Ritossa, C., & Iben, Icko, J. 1997, ApJ, 485, 765
- Gil-Pons et al. (2003) Gil-Pons, P., García-Berro, E., José, J., Hernanz, M., & Truran, J. W. 2003, A&A, 407, 1021
- Glebbeek et al. (2009) Glebbeek, E., Gaburov, E., de Mink, S. E., Pols, O. R., & Portegies Zwart, S. F. 2009, Astronomy and Astrophysics, 497, 255
- Gräfener et al. (2017) Gräfener, G., Owocki, S. P., Grassitelli, L., & Langer, N. 2017, A&A, 608, A34
- Grevesse & Sauval (1998) Grevesse, N. & Sauval, A. J. 1998, Space Science Reviews, 85, 161
- Gutierrez et al. (1996) Gutierrez, J., Garcia-Berro, E., Iben, Jr., I., et al. 1996, The Astrophysical Journal, 459, 701
- Gutiérrez, J. et al. (2005) Gutiérrez, J., Canal, R., & García-Berro, E. 2005, A&A, 435, 231
- Gvaramadze et al. (2019) Gvaramadze, V. V., Gräfener, G., Langer, N., et al. 2019, Nature, 569, 684
- Harris et al. (2020) Harris, C. R., Millman, K. J., van der Walt, S. J., et al. 2020, Nature, 585, 357
- Henyey et al. (1965) Henyey, L., Vardya, M. S., & Bodenheimer, P. 1965, The Astrophysical Journal, 142, 841
- Herwig (2000) Herwig, F. 2000, Astronomy and Astrophysics, 360, 952
- Hunter (2007) Hunter, J. D. 2007, Computing in Science & Engineering, 9, 90
- Iben & Renzini (1983) Iben, Jr., I. & Renzini, A. 1983, Annual Review of Astronomy and Astrophysics, 21, 271
- Iben et al. (1997) Iben, Jr., I., Ritossa, C., & García-Berro, E. 1997, The Astrophysical Journal, 489, 772
- Iglesias & Rogers (1996) Iglesias, C. A. & Rogers, F. J. 1996, The Astrophysical Journal, 464, 943
- Itoh et al. (2002) Itoh, N., Tomizawa, N., Tamamura, M., Wanajo, S., & Nozawa, S. 2002, The Astrophysical Journal, 579, 380
- Jacobson-Galán et al. (2019) Jacobson-Galán, W. V., Foley, R. J., Schwab, J., et al. 2019, Monthly Notices of the Royal Astronomical Society, 487, 2538
- Jha (2017) Jha, S. W. 2017, Type Iax Supernovae, ed. A. W. Alsabti & P. Murdin, 375
- Jha (2017) Jha, S. W. 2017, Handbook of Supernovae, 375
- Jones et al. (2014) Jones, S., Hirschi, R., & Nomoto, K. 2014, \apj, 797, 83
- Jones et al. (2013) Jones, S., Hirschi, R., Nomoto, K., et al. 2013, The Astrophysical Journal, 772, 150
- Jones et al. (2019) Jones, S., Röpke, F. K., Fryer, C., et al. 2019, Astronomy & Astrophysics, 622, A74
- Jones et al. (2016) Jones, S., Röpke, F. K., Pakmor, R., et al. 2016, Astronomy & Astrophysics, 593, A72
- Kippenhahn et al. (1980) Kippenhahn, R., Ruschenplatt, G., & Thomas, H.-C. 1980, Astronomy and Astrophysics, 91, 175
- Kirsebom et al. (2019a) Kirsebom, O. S., Hukkanen, M., Kankainen, A., et al. 2019a, Physical Review C, 100, 065805
- Kirsebom et al. (2019b) Kirsebom, O. S., Jones, S., Strömberg, D. F., et al. 2019b, Physical Review Letters, 123, 262701
- Kitaura et al. (2006) Kitaura, F. S., Janka, H.-T., & Hillebrandt, W. 2006, Astronomy and Astrophysics, 450, 345
- Kluyver et al. (2016) Kluyver, T., Ragan-Kelley, B., Pérez, F., et al. 2016, in Positioning and Power in Academic Publishing: Players, Agents and Agendas, ed. F. Loizides & B. Schmidt, IOS Press, 87 – 90
- Kromer et al. (2015) Kromer, M., Ohlmann, S. T., Pakmor, R., et al. 2015, Monthly Notices of the Royal Astronomical Society, 450, 3045
- Langer (1991) Langer, N. 1991, Astronomy and Astrophysics, 252, 669
- Langer et al. (1983) Langer, N., Fricke, K. J., & Sugimoto, D. 1983, Astronomy and Astrophysics, 126, 207
- Laplace et al. (2020) Laplace, E., Götberg, Y., de Mink, S. E., Justham, S., & Farmer, R. 2020, A&A, 637, A6
- Lecoanet et al. (2016) Lecoanet, D., Schwab, J., Quataert, E., et al. 2016, The Astrophysical Journal, 832, 71
- Leung et al. (2020) Leung, S.-C., Nomoto, K., & Suzuki, T. 2020, The Astrophysical Journal, 889, 34
- Magee et al. (2016) Magee, M. R., Kotak, R., Sim, S. A., et al. 2016, Astronomy & Astrophysics, 589, A89
- Magee et al. (2019) Magee, M. R., Sim, S. A., Kotak, R., Maguire, K., & Boyle, A. 2019, Astronomy & Astrophysics, 622, A102
- Mandel & Broekgaarden (2022) Mandel, I. & Broekgaarden, F. S. 2022, Living Reviews in Relativity, 25, 1
- Maoz & Badenes (2010) Maoz, D. & Badenes, C. 2010, Monthly Notices of the Royal Astronomical Society, 407, 1314
- Marchant (2019) Marchant, P. 2019, Kippenhahn plotter for MESA
- McCully et al. (2014) McCully, C., Jha, S. W., Foley, R. J., et al. 2014, Nature, 512, 54
- McCully et al. (2022) McCully, C., Jha, S. W., Scalzo, R. A., et al. 2022, The Astrophysical Journal, 925, 138
- Meng & Podsiadlowski (2014) Meng, X. & Podsiadlowski, P. 2014, ApJ, 789, L45
- Meng & Podsiadlowski (2018) Meng, X. & Podsiadlowski, P. 2018, The Astrophysical Journal, 861, 127
- Miyaji et al. (1980) Miyaji, S., Nomoto, K., Yokoi, K., & Sugimoto, D. 1980, Publications of the Astronomical Society of Japan, 32, 303
- Nomoto (1984) Nomoto, K. 1984, The Astrophysical Journal, 277, 791
- Nomoto & Kondo (1991) Nomoto, K. & Kondo, Y. 1991, The Astrophysical Journal, 367, L19
- Nugis & Lamers (2000) Nugis, T. & Lamers, H. J. G. L. M. 2000, Astronomy and Astrophysics, 360, 227
- Oskinova et al. (2019) Oskinova, L. M., Gvaramadze, V. V., Gräfener, G., Langer, N., & Todt, H. 2019, Nature, 569, 684
- Owocki et al. (2004) Owocki, S. P., Gayley, K. G., & Shaviv, N. J. 2004, The Astrophysical Journal, 616, 525
- Pan (2020) Pan, Y.-C. 2020, The Astrophysical Journal, 895, L5
- Paxton et al. (2011) Paxton, B., Bildsten, L., Dotter, A., et al. 2011, The Astrophysical Journal Supplement Series, 192, 3
- Paxton et al. (2013) Paxton, B., Cantiello, M., Arras, P., et al. 2013, The Astrophysical Journal Supplement Series, 208, 4
- Paxton et al. (2015) Paxton, B., Marchant, P., Schwab, J., et al. 2015, The Astrophysical Journal Supplement Series, 220, 15
- Paxton et al. (2018) Paxton, B., Schwab, J., Bauer, E. B., et al. 2018, The Astrophysical Journal Supplement Series, 234, 34
- Podsiadlowski et al. (2004) Podsiadlowski, P., Langer, N., Poelarends, A. J. T., et al. 2004, The Astrophysical Journal, 612, 1044
- Poelarends et al. (2008) Poelarends, A. J. T., Herwig, F., Langer, N., & Heger, A. 2008, The Astrophysical Journal, 675, 614
- Poelarends et al. (2017) Poelarends, A. J. T., Wurtz, S., Tarka, J., Cole Adams, L., & Hills, S. T. 2017, The Astrophysical Journal, 850, 197
- Potekhin & Chabrier (2010) Potekhin, A. Y. & Chabrier, G. 2010, Contributions to Plasma Physics, 50, 82
- Potekhin et al. (2009) Potekhin, A. Y., Chabrier, G., & Rogers, F. J. 2009, Phys. Rev. E, 79, 016411
- Raddi et al. (2019) Raddi, R., Hollands, M. A., Koester, D., et al. 2019, Monthly Notices of the Royal Astronomical Society, 489, 1489
- Ritossa et al. (1999) Ritossa, C., García-Berro, E., & Iben, Icko, J. 1999, ApJ, 515, 381
- Rose (1969) Rose, W. K. 1969, The Astrophysical Journal, 155, 491
- Ruiter et al. (2019) Ruiter, A. J., Ferrario, L., Belczynski, K., et al. 2019, Monthly Notices of the Royal Astronomical Society, 484, 698
- Sander & Vink (2020) Sander, A. A. C. & Vink, J. S. 2020, MNRAS, 499, 873
- Schwab (2019) Schwab, J. 2019, The Astrophysical Journal, 885, 27
- Schwab et al. (2017) Schwab, J., Bildsten, L., & Quataert, E. 2017, Monthly Notices of the Royal Astronomical Society, 472, 3390
- Schwab et al. (2020) Schwab, J., Farmer, R., & Timmes, F. X. 2020, The Astrophysical Journal, 891, 5
- Schwab et al. (2016) Schwab, J., Quataert, E., & Kasen, D. 2016, Monthly Notices of the Royal Astronomical Society, 463, 3461
- Schwab & Rocha (2019) Schwab, J. & Rocha, K. A. 2019, The Astrophysical Journal, 872, 131
- Sen et al. (2022) Sen, K., Langer, N., Marchant, P., et al. 2022, Astronomy & Astrophysics, Volume 659, id.A98, NUMPAGES33/NUMPAGES pp., 659, A98
- Siess (2006) Siess, L. 2006, Astronomy and Astrophysics, 448, 717
- Siess (2007) Siess, L. 2007, A&A, 476, 893
- Siess (2009) Siess, L. 2009, A&A, 497, 463
- Siess & Lebreuilly (2018) Siess, L. & Lebreuilly, U. 2018, A&A, 614, A99
- Smith et al. (2018) Smith, N., Götberg, Y., & de Mink, S. E. 2018, MNRAS, 475, 772
- Smith & Owocki (2006) Smith, N. & Owocki, S. P. 2006, ApJ, 645, L45
- Soker (2019) Soker, N. 2019, New Astronomy Reviews, 87, 101535
- Soker (2022) Soker, N. 2022, Research in Astronomy and Astrophysics, 22, 035025
- Stritzinger et al. (2015) Stritzinger, M. D., Valenti, S., Hoeflich, P., et al. 2015, Astronomy and Astrophysics, 573, A2
- Strömberg et al. (2022) Strömberg, D. F., Martínez-Pinedo, G., & Nowacki, F. 2022, Phys. Rev. C, 105, 025803
- Suzuki et al. (2016) Suzuki, T., Toki, H., & Nomoto, K. 2016, The Astrophysical Journal, 817, 163
- Tauris & Janka (2019) Tauris, T. M. & Janka, H.-T. 2019, The Astrophysical Journal Letters, 886, L20
- Tauris et al. (2017) Tauris, T. M., Kramer, M., Freire, P. C. C., et al. 2017, ApJ, 846, 170
- Tauris et al. (2015) Tauris, T. M., Langer, N., & Podsiadlowski, P. 2015, Monthly Notices of the Royal Astronomical Society, 451, 2123
- Tauris et al. (2013) Tauris, T. M., Sanyal, D., Yoon, S.-C., & Langer, N. 2013, Astronomy & Astrophysics, 558, A39
- Timmes & Swesty (2000) Timmes, F. X. & Swesty, F. D. 2000, ApJS, 126, 501
- Timmes & Woosley (1992) Timmes, F. X. & Woosley, S. E. 1992, The Astrophysical Journal, 396, 649
- Vassiliadis & Wood (1993) Vassiliadis, E. & Wood, P. R. 1993, The Astrophysical Journal, 413, 641
- Vink (2017) Vink, J. S. 2017, Astronomy & Astrophysics, 607, L8
- Waldman & Barkat (2006) Waldman, R. & Barkat, Z. 2006, Ph.D. Thesis
- Waldman & Barkat (2007) Waldman, R. & Barkat, Z. 2007, The Astrophysical Journal, 665, 1235
- Waldman et al. (2008) Waldman, R., Yungelson, L. R., & Barkat, Z. 2008, in Astronomical Society of the Pacific Conference Series, Vol. 391, Hydrogen-Deficient Stars, ed. A. Werner & T. Rauch, 359
- Wang & Liu (2020) Wang, B. & Liu, D. 2020, Research in Astronomy and Astrophysics, 20, 135
- Wang et al. (2017) Wang, B., Zhou, W.-H., Zuo, Z.-Y., et al. 2017, Monthly Notices of the Royal Astronomical Society, 464, 3965
- Wheeler (1978) Wheeler, J. C. 1978, The Astrophysical Journal, 225, 212
- Willcox et al. (2016) Willcox, D. E., Townsley, D. M., Calder, A. C., Denissenkov, P. A., & Herwig, F. 2016, The Astrophysical Journal, 832, 13
- Willcox et al. (2021) Willcox, R., Mandel, I., Thrane, E., et al. 2021, The Astrophysical Journal, 920, L37
- Wolf & Schwab (2017) Wolf, B. & Schwab, J. 2017
- Woosley (2019) Woosley, S. E. 2019, The Astrophysical Journal, 878, 49
- Yamanaka et al. (2015) Yamanaka, M., Maeda, K., Kawabata, K. S., et al. 2015, The Astrophysical Journal, 806, 191
- Yan et al. (2016) Yan, J.-Z., Zhu, C.-H., Wang, Z.-J., & Lü, G.-L. 2016, Research in Astronomy and Astrophysics, 16, 009
- Zapartas et al. (2017) Zapartas, E., de Mink, S. E., Van Dyk, S. D., et al. 2017, ApJ, 842, 125
- Zeng et al. (2021) Zeng, X., Wang, X., Esamdin, A., et al. 2021, The Astrophysical Journal, 919, 49
Appendix A Composition profiles
A.1 The Series I Grid


A.2 The Series II Grid


