GASP XXXVII: The Most Extreme Jellyfish Galaxies Compared to Other Disk Galaxies in Clusters, an HI Study
Abstract
We present the results of a VLA HI imaging survey aimed at understanding why some galaxies develop long extraplanar H tails, becoming extreme jellyfish galaxies. The observations are centered on five extreme jellyfish galaxies, optically selected from the WINGS and OmegaWINGS surveys and confirmed to have long H tails through MUSE observations. Each galaxy is located in a different cluster. In the observations there are in total 88 other spiral galaxies within the field of view (40x40) and observed bandwidth (6500 km s-1). We detect 13 of these 88 spirals, plus one uncatalogued spiral, with HI masses ranging from 1 to 7 109 M⊙. Many of these detections have extended HI disks, two show direct evidence for ram pressure stripping, while others are possibly affected by tidal forces and/or ram-pressure stripping. We stack the 75 non-detected spiral galaxies and find an average HI mass of 1.9 108 M⊙, which given their average stellar mass, implies they are very HI deficient. Comparing the extreme jellyfish galaxies to the other disk galaxies, we find that they have a larger stellar mass than almost all disk galaxies and than all HI detected galaxies, they are at smaller projected distance from the cluster center and at higher relative velocity to the cluster mean than all HI detections and most non-detections. We conclude that the high stellar mass allows extreme jellyfish galaxies to fall deeply into the cluster before being stripped and the surrounding ICM pressure gives rise to their spectacular star-forming tails.
1 Introduction
Galaxy clusters are the largest virialized structures in the universe. The mix of galaxy populations in clusters differs from regions of lower galaxy density exhibiting the so called morphology density relation, with a much higher fraction of ellipticals and S0s in the cluster centers than elsewhere (Hubble & Humason, 1931; Dressler, 1980). These observations have led to a nature-versus-nurture debate where galaxies are thought to be different either because they were formed in higher density regions (nature) or because the environment affects their evolution. Although this debate is still not completely settled, there is a wealth of observations that show that galaxies do get affected by their environment (Cortese et al., 2021; Boselli et al., 2021). The main processes being invoked are gas-gas interactions and gravitational interactions.
The GAs Stripping Phenomena in galaxies (GASP) survey (Poggianti et al., 2017a) is a multi-wavelength study of the processes driving the removal of gas from galaxies. In particular, GASP focuses on studying the mechanisms driving the creation of jellyfish galaxies, which have H tendrils, that extend from the galaxy disks with a length at least comparable to that of the galaxy diameter. Jellyfish galaxies appear to exist in a range of environments, from the very dense centers of large clusters to the low-density outskirts (e.g. Vulcani et al., 2018a; Gullieuszik et al., 2020; Vulcani et al., 2021). There is a growing consensus that many jellyfish galaxies have been shaped by ram pressure stripping, i.e. the removal of cold gas from the galaxy disk by pressure from the hot intra-cluster medium (Gunn & Gott, 1972). Although jellyfish galaxies are undergoing ram pressure stripping, there are also many examples of galaxies undergoing ram pressure stripping that do not show the jellyfish galaxy morphology (Chung et al., 2009). This brings up the question: does the jellyfish galaxy morphology occur at a particular time in the stripping process, does it depend on the stripping parameters, or is it the local environment of the jellyfish that makes them light up in H?
In this paper, we explore the differences between the most extreme jellyfish galaxies, and other disk galaxies in clusters, and aim to address why some galaxies in clusters become extreme jellyfish galaxies while others do not. For this work, we define extreme jellyfish galaxies as those that the authors in Poggianti et al. (2016a) gave a Jclass rating of 4 or 5 to, from the homogeneous sample of observations of clusters with a redshift between 0.04 - 0.07. The visual inspection of optical images in Poggianti et al. (2016a) found 344 candidate jellyfish galaxies in 71 clusters, 34 of which were classified as Jclass=4,5. These candidates were subsequently confirmed to have large tails of ionized gas in Poggianti et al. (2017a). In order to explore the differences between these two samples, we analyze neutral hydrogen and radio continuum data for disk galaxies in clusters of galaxies that contain an extreme jellyfish galaxy.
HI observations have been used extensively to study the environmental effects in clusters. Disk galaxies in clusters are HI deficient compared to galaxies in lower density environments. Solanes et al. (2001) show in a study of 18 nearby clusters that the HI deficiency decreases gradually with increasing projected distance from the cluster center out to about 2 Abell radii. For an indepth study of the effect of the environment on the HI scaling relations see Cortese et al. (2011). To understand the physical mechanisms that affect the neutral hydrogen we can distinguish between hydrodynamical interactions, such as ram pressure stripping, turbulent viscous stripping and evaporation, and gravitational interactions, such as tidal interactions, harassment and mergers. While the former only affects the gas, the latter affects both stars and gas. Since neutral hydrogen extends to the outer parts of galaxies it is an excellent tracer of these interactions. HI imaging can help to identify which mechanism is at work. High resolution HI imaging of Virgo and Coma show many examples of this (Cayatte et al., 1990; Chung et al., 2009; Bravo-Alfaro et al., 2002; van Gorkom, 2004). Cayatte et al. (1994) pioneered identifying the physical mechanisms at work by studying the detailed surface density distributions of the HI gas. In general what is found is that galaxies in the outskirts of clusters have HI disks extending beyond the optical. Then as they travel inward, the gas gets removed from one side of the disk, and often extraplanar gas and HI tails are observed. Once they reach the center, only very small symmetrical HI disks are seen, or they remain undetected (Chung et al., 2007, 2009; Jaffé et al., 2015; Healy et al., 2020; Gogate et al., 2020). The HI morphology combined with relative velocities and location in the clusters have been used to study the orbital history of the galaxies (Vollmer et al., 2001; Jaffé et al., 2015, 2016; Yoon et al., 2017).
In this paper, we use both the HI morphology to identify the physical mechanisms affecting the galaxies and the projected position and relative velocity in phase space diagrams to identify the orbital history of the galaxies (Oman et al., 2013; Jaffé et al., 2015; Rhee et al., 2017; Pasquali et al., 2019). We will use the presence of an undisturbed stellar disk combined with HI removed from within the optical disk as evidence for ram pressure stripping, while a disturbed stellar disk and stellar tidal features might be a sign of a gravitational interaction. The five extreme jellyfish galaxies in our sample are J0135, J0194, J0201, J0204 and J0206 (Poggianti et al., 2017b). All are currently undergoing ram pressure stripping and the ones that have been imaged in HI (J0201, J0204 and J0206) show HI that has been removed from an undisturbed stellar disk (Deb et al., 2020; Ramatsoku et al., 2020, 2019).
This paper is structured in the following manner. In Section 2 we detail the observations, image data properties, and source finding technique and parameters. We also describe the catalogues used for the ancillary data. In Section 3 we present the HI distributions of 14 HI detections and a qualitative description of each of their HI morphologies. Additionally, we show the radio continuum morphology for 5 of the 14 galaxies, and derive the star formation rate. Lastly we show the stacked spectrum of 75 non-detected disk galaxies. Although we do not directly detect them individually in HI, we do detect them in the stacked spectrum. In Section 4 we discuss the implications of our results and in Section 5 we give concluding remarks about the results of this study.
In this work we assume a standard flat CDM cosmology with H0 = 70, = 0.7 and = 0.3.
| Cluster Name | X-Ray Center | Central Redshift | R200 | M200 | Velocity Dispersion | JellyfishaaFor more more details on the GASP jellyfish galaxies see Poggianti et al. (2017b, 2019); Gullieuszik et al. (2020); Radovich et al. (2019); Vulcani et al. (2018b); Moretti et al. (2020); Vulcani et al. (2020). For more information on JO204 see: Gullieuszik et al. (2017); Deb et al. (2020). For more information on JO206 see: Poggianti et al. (2017a); Ramatsoku et al. (2019); Müller et al. (2021). For more information on JO201 see: Bellhouse et al. (2017, 2019); George et al. (2018, 2019); Ramatsoku et al. (2020); Campitiello et al. (2021) |
|---|---|---|---|---|---|---|
| J2000 | Mpc | 1014 M⊙ | km s-1 | |||
| A3532 | 12:57:22.3 -30:21:50.4 | 0.0554 | 1.55 | 4.5 | 662.0 | JO135 |
| A4059 | 23:57:01.0 -34:45:36.0 | 0.0488 | 1.58 | 4.7 | 744.0 | JO194 |
| A85 | 00:41:50.4 -09:18:10.8 | 0.0557 | 2.02 | 9.9 | 859.0 | JO201 |
| A957 | 10:13:38.4 -00:55:33.6 | 0.0450 | 1.42 | 3.4 | 631.0 | JO204 |
| IIZW108 | 21:13:55.9 +02:33:54.0 | 0.0489 | 1.20 | 2.1 | 575.0 | JO206 |
| Cluster Name | Pointing | Velocity CoverageaaVelocity measurements are done using the optical barycentric definition, and the error on them is 13 km s-1. | R.M.S.bbIn a single continuum subtracted channel of channel width 26.4 km s-1. / In the continuum image. | Synth. BeamccIn the HI cube. / In the continuum image. | Galaxy TypesddBreakdown of galaxy types, as defined by Fasano et al. (2012), within the FWHM of the VLA primary beam and the velocity range probed for our observations. |
|---|---|---|---|---|---|
| hh:mm:ss.s dd:mm:ss.s | km s-1 | Jy beam-1 | E:S0:S | ||
| A3532 | 12:57:04.6 -30:22:33.6 | 13593-18126 | 181 / 73 | / | 12:42:26 |
| A4059 | 23:57:01.0 -34:40:51.6 | 10023-15266 | 210 / 73 | / | 12:36:23 |
| A85 | 10:13:24.7 -00:54:21.6 | 9957-15373 | 182 / 40 | / | 6:18:9 |
| A957 | 00:41:30.2 -09:15:46.8 | 10575-16012 | 165 / 40 | / | 5:14:13 |
| IIZW108 | 21:13:46.8 +02:21:18.0 | 12772-18110 | 121 / 27 | / | 9:22:16 |
| Detection IDaaThe letter corresponds to the index on Figures 1, 3, 5, and 6 | Cluster | PositionbbThese positions correspond to the point of peak optical emission. | Central VelocityccVelocity measurements are done using the optical barycentric definition, and the error on them is 13 km s-1. The central velocity is determined by taking the velocity at the middle of the HI integrated profile. | HI Flux | Continuum Flux |
|---|---|---|---|---|---|
| hh:mm:ss.s dd:mm:ss.s | km s-1 | Jy km s-1 | mJy | ||
| JO204 | A957 | 10:13:46.8 -00:54:51.1 | 12703 | 0.1410.014 | 5.930.30 |
| WINGSJ101328.71-011007.6 [a] | A957 | 10:13:28.7 -01:10:07.6 | 14951 | 0.5500.120 | 0.12 |
| WINGSJ101306.33-010216.6 [b] | A957 | 10:13:06.3 -01:02:16.6 | 14221 | 0.1670.027 | 0.12 |
| WINGSJ101302.49-005348.7 [c]ddThis galaxy is also identified in Poggianti et al. (2016a) as stripping candidate JO203. | A957 | 10:13:02.49 -00:53:48.7 | 13590 | 0.2930.057 | 0.400.02 |
| WINGSJ101322.39-005218.3 [d] | A957 | 10:13:22.4 -00:52:18.3 | 14255 | 0.3330.060 | 0.420.02 |
| WINGSJ101318.33-004957.6 [e] | A957 | 10:13:18.3 -00:49:57.6 | 14719 | 0.7490.054 | 0.12 |
| WINGSJ101321.71-004652.7 [f] | A957 | 10:13:21.7 -00:46:52.7 | 14646 | 0.1210.026 | 0.690.03 |
| JO206 | IIZW108 | 21:13:47.4 +02:28:34.4 | 15316 | 0.287 | 5.300.27 |
| WINGSJ211346.12+021420.4 [g]eeThis galaxy is also identified in Poggianti et al. (2016a) as stripping candidate JO205. | IIZW108 | 21:13:46.1 +02:14:20.4 | 13433 | 0.1190.039 | 0.320.02 |
| WINGSJ211334.23+021530.9 [h] | IIZW108 | 21:13:34.2 +02:15:30.9 | 14807 | 0.2910.028 | 0.09 |
| WINGSJ211314.53+022410.7 [i] | IIZW108 | 21:13:14.5 +02:24:10.7 | 14604 | 0.1210.024 | 0.09 |
| WINGSJ211404.17+022552.4 [j] | IIZW108 | 21:14:04.2 +02:25:52.4 | 16179 | 0.1690.030 | 2.010.10 |
| J211330.6+022904.9 [k] | IIZW108 | 21:13:30.6 +02:29:00.3 | 15535 | 0.0980.026 | 0.22 |
| JO194 | A4059 | 23:57:00.7 -34:40:50.1 | 12577 | 0.126 | 6.880.34 |
| WINGSJ235650.48-344138.2 [l] | A4059 | 23:56:50.5 -34:41:38.2 | 14568 | 0.2060.033 | 0.22 |
| JO135 | A3532 | 12:57:04.3 -30:22:30.3 | 16316 | 0.121 | 2.370.12 |
| WINGSJ125623.82-301525.5 [m] | A3532 | 12:56:23.8 -30:15:25.5 | 15158 | 0.2380.1031 | 0.22 |
| WINGSJ125715.40-302753.4 [n] | A3532 | 12:57:15.4 -30:27:53.4 | 16151 | 0.0570.035 | 0.22 |
| JO201 | A85 | 00:41:30.3 -09:15:45.9 | 13380 | 0.113 | 4.730.24 |
| Detection IDaaThe letter corresponds to the index on Figures 1, 3, 5, and 6 | HI Mass | Radio SFRbbComputed based on Equation 13 in Yun & Carilli (2002) assuming a spectral index between -0.7 and -0.8 with the mean value corresponding to -0.75. | Stellar Mass | D25ccThis is the diameter of each galaxy at the R-band 25th magnitude isophote. With the exception of the jellyfish galaxies almost all disks are comparable in size or smaller than the 20 kpc synthesized beam of the VLA. |
|---|---|---|---|---|
| 109 M⊙ | M⊙ yr | 109 M⊙ | ″ | |
| JO204 | 1.320.13 | 8.82 | 75.55 | 39.01.7 |
| WINGSJ101328.71-011007.6 [a] | 5.151.12 | 0.18 | 0.68 | 6.20.4 |
| WINGSJ101306.33-010216.6 [b] | 1.560.25 | 0.18 | 3.21 | 15.40.4 |
| WINGSJ101302.49-005348.7 [c]ddThis galaxy is also identified in Poggianti et al. (2016a) as stripping candidate JO203. | 2.740.53 | 0.59 | 7.18 | 38.00.8 |
| WINGSJ101322.39-005218.3 [d] | 3.120.56 | 0.51 | 7.45 | 15.40.3 |
| WINGSJ101318.33-004957.6 [e] | 7.010.51 | 0.18 | 26.17 | 21.80.8 |
| WINGSJ101321.71-004652.7 [f] | 1.130.24 | 1.03 | 4.50 | 21.80.3 |
| JO206 | 3.20 | 9.37 | 82.88 | 49.80.7 |
| WINGSJ211346.12+021420.4 [g]eeThis galaxy is also identified in Poggianti et al. (2016a) as stripping candidate JO205. | 3.240.43 | 0.57 | 5.05 | - |
| WINGSJ211334.23+021530.9 [h] | 1.350.31 | 0.16 | 2.02 | - |
| WINGSJ211314.53+022410.7 [i] | 1.880.27 | 0.16 | 1.11 | 10.20.3 |
| WINGSJ211404.17+022552.4 [j] | 1.300.33 | 3.55 | 23.42 | 22.40.3 |
| J211330.6+022904.9 [k] | 1.090.29 | 0.16 | - | 3.40.1 |
| JO194 | 1.39 | 12.17 | 380.55 | 52.22.4 |
| WINGSJ235650.48-344138.2 [l] | 2.280.37 | 0.39 | 3.14 | - |
| JO135 | 1.75 | 5.43 | 95.11 | 33.60.3 |
| WINGSJ125623.82-301525.5 [m] | 3.431.48 | 0.51 | 3.98 | 18.60.3 |
| WINGSJ125715.40-302753.4 [n] | 0.820.51 | 0.51 | 0.54 | 5.00.6 |
| JO201 | 1.65 | 11.01 | 92.24 | 39.21.1 |
2 Data
2.1 Observations and Reduction
The 5 extreme jellyfish galaxies, that were observed were taken from the sample in Poggianti et al. (2016b). This sample is the first large homogeneous compilation of jellyfish galaxies in clusters from the WINGS and OmegaWINGS surveys. The five extreme jellyfish galaxies were confirmed to have large H tails in follow-up MUSE observations from the GASP MUSE program. They were chosen because they are among the most convincing cases of stripping with clear tentacles of stripped ionized material. J0135 and J0194 are JClass 4 and J0201, J0204 and J0206 are JClass 5, where JClass goes from 1 to 5, with 5 showing the clearest tentacles (Poggianti et al., 2016b). An additional constraint was that they fell in the Declination and LST range observable with the VLA. They are located in the following clusters IIZW108, A85, A957, A3532, and A4059, which have redshifts in the range 0.045 to 0.055, see Table 1. The observations were done with the Karl G. Jansky Very Large Array (VLA) in C configuration. The C-array resolution of approximately 20″, corresponding to a physical scale of approximately 20 kpc at these redshifts, is optimal for these sources, as at this resolution disk components and extraplanar gas can be distinguished, while the shortest antenna spacings are also sensitive to diffuse emission. The observations were centered spatially, and in velocity, close to, or on the location of the extreme jellyfish galaxies (See Table 1 for the properties of each cluster and the target extreme jellyfish galaxy). The field of view of the VLA primary beam (FWHM) is approximately 40, corresponding to about 2.3 Mpc at the cluster redshifts. The velocity range probed is roughly 6500 km s-1 (1024 velocity channels with a 31.25 kHz width). The fraction of each cluster captured in these pointings varies depending on the location and velocity of the jellyfish target and ranges from 12% in A85, to 52% in A957 of cluster members confirmed through spectroscopy taken in OMEGAWINGS (Moretti et al., 2017). Each source field was observed for a total of 20 hours, corresponding to approximately 16 hours on source, as part of JVLA project 17A-293.
The data reduction was carried out using the Common Astronomy Software Application (CASA), with standard calibration methods (McMullin et al., 2007). The calibration was done in an iterative process of calculating an initial calibration, flagging Radio Frequency Interference (RFI) from the data, and recalculating the calibration on the RFI free data. The target fields were flagged manually, and with the default values of the automated flagger, RFLAG, an internal flagging agent to CASA that flags out statistical outliers. In A3532, we had to flag approximately 15% of the total bandwidth due to severe RFI.
Self calibration and HI imaging. Three of the five fields had strong continuum sources which were used for several iterations of phase self calibration to reduce residual artifacts in the images. The data were smoothed to a spectral resolution of 125 kHz corresponding to a channel width of 26 km s-1 at = 0, and the pixel size chosen was 5, in order that we suitably cover the synthesized beam. We imaged the data with a robust weighting of 0.5 to create a cube with the optimal combination of resolution and sensitivity, and to have the point-spread function still be well approximated as a Gaussian. We then cleaned the data down to the 1 level, and identified the emission free channels. The continuum subtraction was done by considering each pixel in the image-plane independently. For each pixel, a first-order polynomial was fit to the emission free channels, and then subtracted from the entire bandwidth. This is done using the CASA data analysis task, imcontsub. These techniques were sufficient to produce HI line cubes with little imaging artifacts and near gaussian noise. A summary of the observations and properties of the five resultant data cubes are summarized in Table 2.
Self calibration and continuum imaging. Self calibration and imaging was repeated by transforming the already flagged and cross calibrated measurement set into Miriad (Sault et al., 1995). A sparse imaging was done to create a first source mask that is then used for self calibration. We iteratively shortened the solution interval and included shorter baselines into the (u,v)-range in the calibration process until a 30 s interval was reached and all baselines were included. We re-imaged the data, improved the source masks, and repeated the self-calibration on the cross calibrated data. We created continuum images for each HI source separately in which we flagged the corresponding HI channels in the data individually to not contaminate the continuum signal with HI emission. Final images were created with a robust weighting of 0. This choice of weighting improves the resolution, in comparison to a naturally weighted image, while only having a minimal effect on the point-source sensitivity, providing us with an appropriate compromise of resolution and sensitivity (see Table 2 for properties of the images). Lastly, the primary beam correction was used for all analysis and all subsequent measurements, and measurement errors, are taken from this final primary beam corrected image.
2.2 Source Detection
Source finding was done manually and blindly (i.e., initially ignoring any information about the optical position and redshift of galaxies in the field) through a thorough inspection of source persistence across different spatial and spectral smoothing combinations. We first required a candidate detection to have emission at, or above, the three sigma level in three adjacent channels. A candidate detection was deemed real if the emission stayed above the 2 sigma level after spatially smoothing to up to a factor 2 larger beam size, spectrally smoothing up to a factor 4, and the combination of the two. Using the deep optical images from WINGS and OMEGAWINGS (Fasano et al., 2006; Gullieuszik et al., 2015), we only considered a detection real if an optical counterpart was seen in the images within three pixels, in the HI cube, of the peak HI emission. HI line cubes of different spatial and velocity resolutions were created and then independently searched for HI sources. Masks were created for each cube by including all emission greater than positive 2. These masks were combined and applied to the full resolution cubes, which were used for the final HI maps. The final HI maps were created by integrating over all pixels within the mask with values greater than positive 1.5. HI masses were calculated by finding the flux in a region uniform across all channels, selected by being 2 pixels wider on each side than the lowest contour on the final moment map, in order to be sensitive to any low level emission. The galaxy distances were set by the systemic velocity of the cluster (Table 1).
In order to understand the depth of our observations, and the galaxies we can probe, we calculate the HI observed mass limit for our data. We assume a velocity width of 132 km s-1, three sigma emission in each channel, that the emission fills exactly one synthesized beam, and the galaxy is at the center of the pointing, and thus does not suffer from primary beam attenuation. For each cluster, we use the the distances set by the systemic velocity of the cluster (Table 1) and the calculated r.m.s. in a single channel with width 26.4 km s-1 (Table 2). This calculation yields an HI lower mass limit range of 0.6 1.1 109 M⊙ for our observed clusters.
We detect 14 other disk galaxies in HI emission. In Table 3, we present the coordinates of the optical counterpart, HI central velocity, defined by the midpoint of the integrated profile, the HI flux, and the radio continuum flux for each galaxy. Their HI masses range from 1 to 7 . For one of our detections no counterpart was found in the WINGS and OMEGAWINGS catalogs (see Section 2.3 for a thorough description). However, inspection of the images shows a faint optical galaxy coinciding in position with the HI. 99% of the galaxies detected by the OMEGAWINGS survey have magnitude V brighter than 24.5 Gullieuszik et al. (2015). We can therefore say that if the galaxy was not detected by the automatic source extraction, it will have a V magnitude fainter than 24.5. Since the HI line center is within the velocity range of the cluster, we assume that this optical galaxy is also a cluster member. As a result of its exclusion from the catalogues, we do not have photometry or spectroscopy for this galaxy. We therefore cannot calculate its stellar mass, and will leave it out in much of the discussion.
We also searched for continuum emission from the 14 galaxies detected in HI. Associated continuum sources were identified by overlaying the HI detections. We identify something as a detection if the continuum flux at the position of the optical galaxy is larger than 3. Five of the 14 galaxies were detected in radio continuum. Upper limits are taken to be 3 assuming the sources are unresolved (see Table 4). All five extreme jellyfish galaxies are detected in radio continuum and details about these extreme jellyfish galaxies will be presented in Müller et al. in prep.
2.3 Catalogue Compilation
The cluster sample is taken from the WINGS (Fasano et al., 2006; Moretti et al., 2014) and OMEGAWINGS (Gullieuszik et al., 2015; Moretti et al., 2017) surveys. A galaxy is considered a cluster member if its redshift lies within from the cluster mean redshift (see Cava et al. 2009). The spectroscopic catalog is complete to a magnitude of V 20 mag, as defined by the Vega system. Velocity dispersions and virial radii are taken from Biviano et al. (2017).
Stellar masses were derived as in Vulcani et al. (2011), following Bell & de Jong (2001) and exploiting the correlation between stellar mass-to-light (M/L) ratio and optical colours of the integrated stellar populations. The total luminosity, , was derived from the Kron (SEXTRACTOR AUTO) observed B magnitude (Varela et al., 2009; Gullieuszik et al., 2015), corrected for distance modulus and foreground Galaxy extinction, and k-corrected using tabulated values from Poggianti (1997). The rest-frame colour used to calculate masses was derived from observed B and V aperture magnitudes measured within a diameter of 10 kpc around each galaxy barycenter, corrected for Galaxy extinction and k-corrected as the total magnitude. Then, we used the equation , for the Bruzual & Charlot model with a Salpeter (1955) IMF (0.1-125 M⊙) and solar metallicity, = -0.51 and = 1.45. Then, we scale our masses to a Chabrier (2003) IMF adding -0.24 dex to the logarithmic value of the masses. Morphological types were derived from V-band images using MORPHOT, an automatic tool for galaxy morphology, purposely devised in the framework of the WINGS project (Fasano et al., 2012). This catalog is complete for galaxies within the spectroscopic catalog and only for galaxies which cover more than 200 pixels in the image.
3 Results
In Table 1, we list the properties of the observed clusters, their redshifts, , , velocity dispersions and the extreme jellyfish galaxy located in that cluster. Their masses and distances range from 2.2 1014 M⊙ to 9.9 1014 M⊙ and 190 Mpc to 235 Mpc, respectively. In Table 2 we list in the last column the number of catalogued galaxies of different morphology within the FWHM of the VLA primary beam and velocity range.
In Table 3 we present the measured radio properties of the 14 HI detections and the five extreme jellyfish galaxies. For the 3 published extreme jellyfish galaxies the listed HI flux is taken from Ramatsoku et al. (2019, 2020); Deb et al. (2020), and the continuum flux of JO206 from Müller et al. (2021). One of the extreme jellyfish galaxies J0194 is not detected in HI, and we calculated an upper HI mass limit at 3 assuming a linewidth of 350 km s-1, which is the stellar linewidth from Poggianti et al. (2017b). Two other galaxies J0204 and J0135 have strong HI absorption toward the central source. The listed HI flux only includes the emission signal and thus provides a lower limit to the total HI mass. The derivation of total HI and continuum flux is described in Section 2.2. The central velocities of the HI emission are determined by taking the velocity at the middle of the HI integrated profile. In Table 4, we present the HI masses, star-formation rates, derived from the continuum emission, stellar masses and disk diameters for the 13 catalogued HI detected galaxies (Fasano et al., 2006) and the 5 extreme jellyfish galaxies (Ramatsoku et al., 2020, 2019; Deb et al., 2020).
The star formation rates are calculated based on Equation 13 in Yun & Carilli (2002) using the same assumptions. We used a mean spectral index of -0.75 (with where is the synchrotron surface brightness at frequency given the spectral index ) for each source and estimated the errors based on a spectral index error of (corresponding to a spectral index range of -0.7 to -0.8 Yun & Carilli, 2002) and the flux uncertainty given in Table 3. A complication in using radio continuum to estimate star formation rates is that there may be a radioloud AGN in the center of the galaxies. Based on the BPT diagrams in Poggianti et al. (2019), Liner/AGN like emission could be identified in the central region of the extreme jellyfish galaxies. The continuum emission of the extreme jellyfish galaxies is mostly resolved and have indeed an AGN in the center. We subtracted the contribution of the radioloud AGN by making an image using only the longest antenna spacings, allowing for better resolution than the observations would normally allow, the so called super resolution. The AGN contribution was typically about %. For the five non-extreme jellyfish galaxies we were not able to identify an AGN with the emission being mostly unresolved. Our derived star formation rate for those galaxies are therefore upper limits.
In the following we present images arranged by cluster of the total HI emission and continuum emission overlaid on optical B-band images of the HI detected galaxies. HI images of J0201, J0204, J0206 can be found in Deb et al. (2020); Ramatsoku et al. (2020, 2019), respectively. We present here the total HI map of J0135 and an upper limit to the HI of J0194. In these images arranged by cluster we also show projected on the sky the location of the extreme jellyfish galaxies in red, of the HI detected galaxies in blue letters, and in green the non detected catalogued disk galaxies within the FWHM of the primary beam of our VLA pointing. In addition we show for these galaxies the location in a projected distance-relative velocity phase space diagram, i.e. the projected distance from the cluster center versus the relative velocity with respect to the cluster mean velocity. In those diagrams we also indicate the velocity range probed by our observations. For a few systems we also show position-velocity diagrams along the optical and HI major axes, and selected position angles, where we considered this helpful in the interpretation.
In the following subsections we qualitatively describe each individual cluster galaxy detection. A few things need to be kept in mind. While the extreme jellyfish galaxies have disk sizes (D25 at R-band) from 34 to 50 kpc, most of the other disk galaxies have sizes of 20 kpc or less (Table 4), which is comparable to the 20 kpc synthesized beam of the VLA. Most of the detections have HI extending beyond the stellar disk. We describe disturbances that we see in these outer HI disks, but we can only hint at the possible mechanisms that affect them as the signature of a gravitational or gas-gas interaction would be the same. The only direct evidence of an ICM-ISM interaction is removal of gas from the stellar disk. In some cases we lack the resolution to say this.
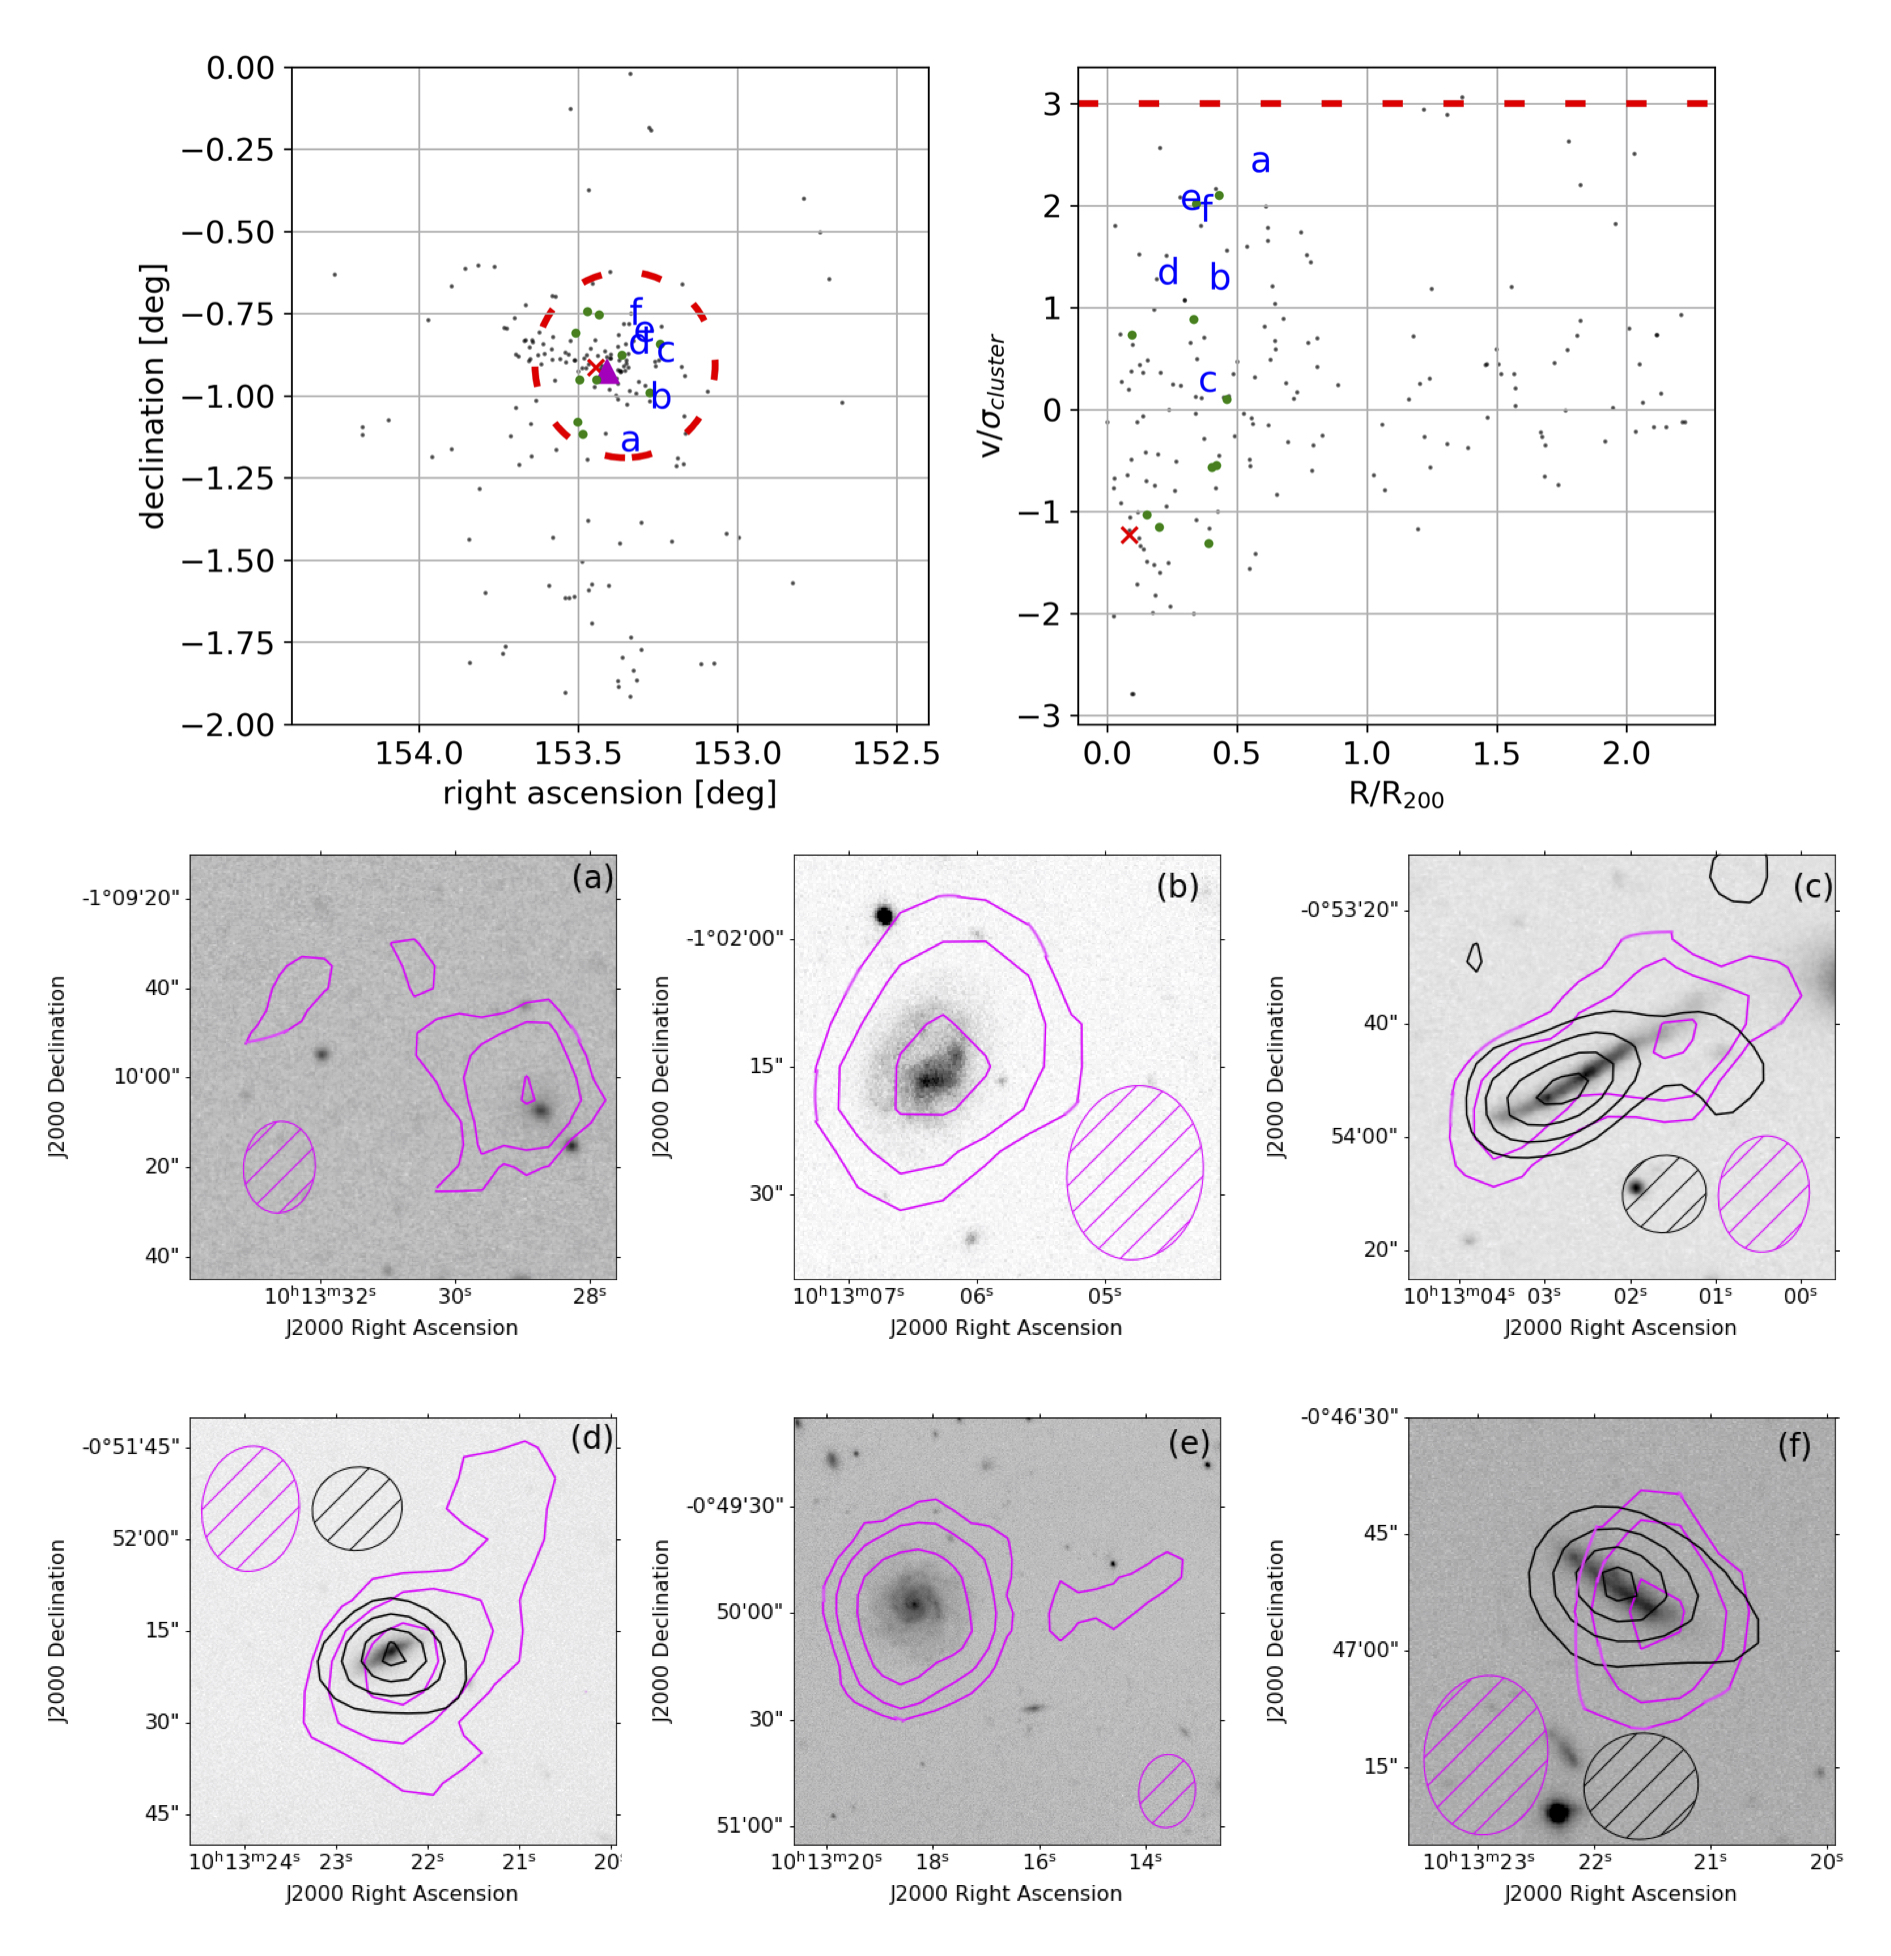
3.1 A957
Abell 957 is the second smallest of the five clusters with a velocity dispersion of 631 km s-1 and a R200 of 1.42 Mpc. In addition to the extreme jellyfish galaxy JO204, we detect six galaxies in HI out of the 13 spiral galaxies within the primary beam. Three of the HI detections are also detected in radio continuum. Looking at the phase-space diagram in the upper right of Figure 1, we see that the non detected disks cover much of velocity space from +2 to -1. The HI detections are all at redshifted velocities with respect to the cluster mean. It could be a group falling in from the front. Of the six galaxies three, c,d, and f, show an HI morphology that could have been affected by the cluster environment. In the subsequent sections we briefly describe all detections.
WINGSJ101328.71-011007.6 (a) The optical disk is about 6kpc, while the HI diameter is at least 40 kpc and very extended on one side (eastern direction), which is contiguous in velocity. The optical is slightly asymmetric with more diffuse light in the eastern direction as well. Some asymmetry in stars and gas is not unusual for galaxies in any environment. We do not have a redshift for the galaxy to the south west. If it turns out to be another cluster member, close in velocity to galaxy a, then it could have gravitationally disturbed the galaxy.
WINGSJ101306.33-010216.6 (b) The HI is slightly asymmetric with respect to the optical, but is still fully enveloping the galaxy, extending at least 2 independent VLA beams, while the galaxy size of 15 kpc is less than one synthesized beam.
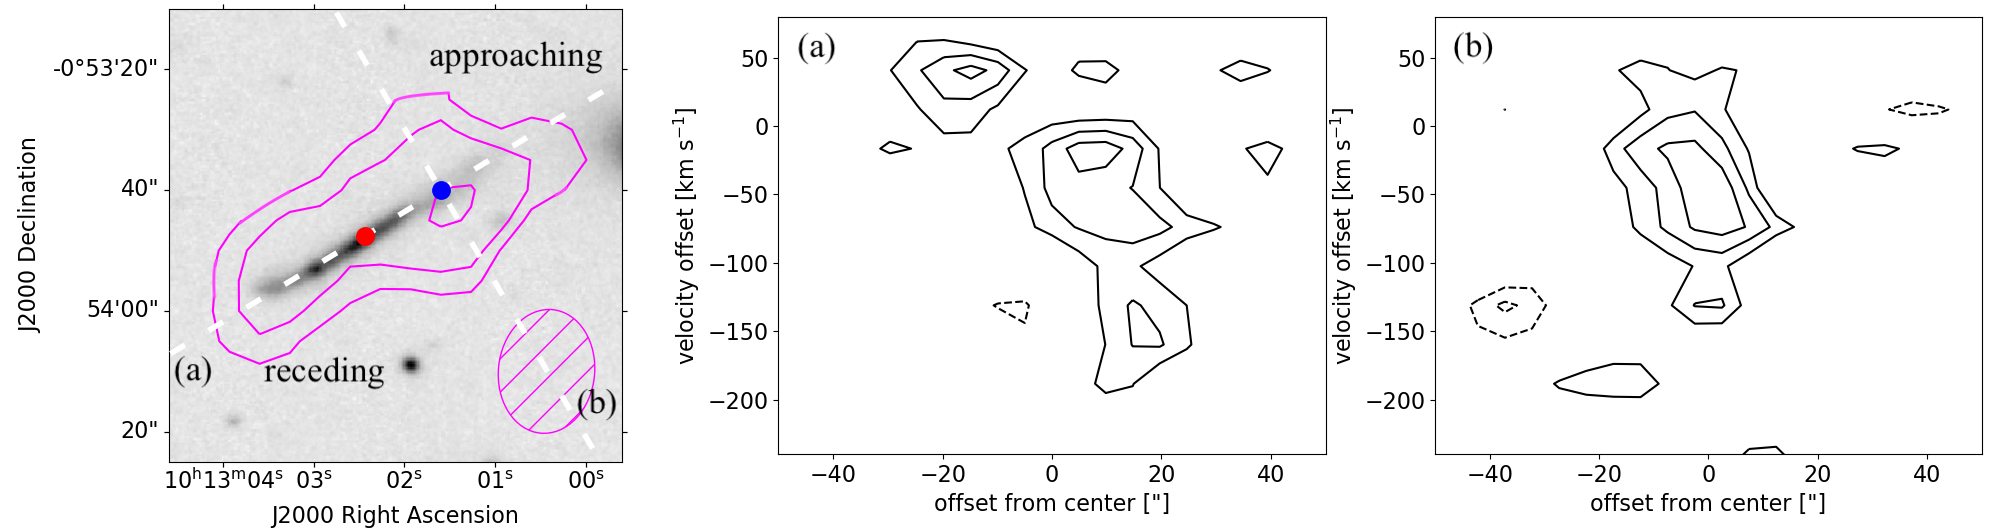
WINGSJ101302.49-005348.7 (c) The optical light shows a warped disk to the east and significant debris in the northwest of the galaxy. The HI is very asymmetric extending further in the direction of the debris, the scale height increases there, and the HI peaks slightly offset from the center of the debris. This could be consistent with a warp on both sides, where the HI becomes more face on in the west. The continuum emission peaks in the center and shows very faint emission in the north-western direction. It is unclear if this galaxy’s disturbed morphology is a result of ram pressure stripping or a gravitational interaction, or possibly both. The presence of stellar disturbances indicates a gravitational interaction. Furthermore, the disturbed radio continuum emission could indicate ram pressure stripping, as disturbed radio continuum emission is seen in all extreme jellyfish galaxies (see Müller et al. in prep.).
In addition, the position-velocity diagrams (shown in the top row of Figure 2) is suggestive of a galaxy undergoing ram pressure stripping. The HI peaks to the northwest of the optical center of the galaxy, on the approaching side of the galaxy. The large amount of total gas, and large velocity gradient in the negative velocities is likely the result of gas being removed via ram pressure stripping, and then falling to systemic velocity of the cluster. Note that the galaxy is falling in from the front and needs to decelerate in order to join the cluster. When considering that the offset HI peak, the bend in continuum, and large gradient in velocity all occur at the same place outside of the inner region of the optical disk, the case for ram pressure stripping in this galaxy is very strong.
WINGSJ101322.39-005218.3 (d) The galaxy shows an HI tail pointing north west, away from the cluster center and a smaller counter tail (about half the size) to the south west. The continuum seems mostly undisturbed but has a slight elongation in the south-western direction, perpendicular to the disk. On the other hand, the stellar disk looks undisturbed. A tail and counter tail in the HI could indicate a weak gravitational disturbance by the cluster potential. There is no other galaxy nearby that could have caused this. We note that the lowest contour lies above the 2 expectation for the noise in the final moment map.
WINGSJ101318.33-004957.6 (e) The HI distribution and the optical appears to be undisturbed and the HI disk is slightly more extended. The tail to the west, although low column density is almost certainly real. As noted above, the lowest contour lies above the 2 expectation for the noise in the final moment map. We made HI images using different smoothing and cutoff parameters to ensure that the tail was real. The tail might have been formed in an interaction with WINGSJ101321.71-004652.7 (source f shown in Figure 1). These galaxies are very close in projection (110 kpc) and velocity (70 km s-1). The HI in the tail is of low column density, and is pointing away from WINGSJ101321.71-004652.7.
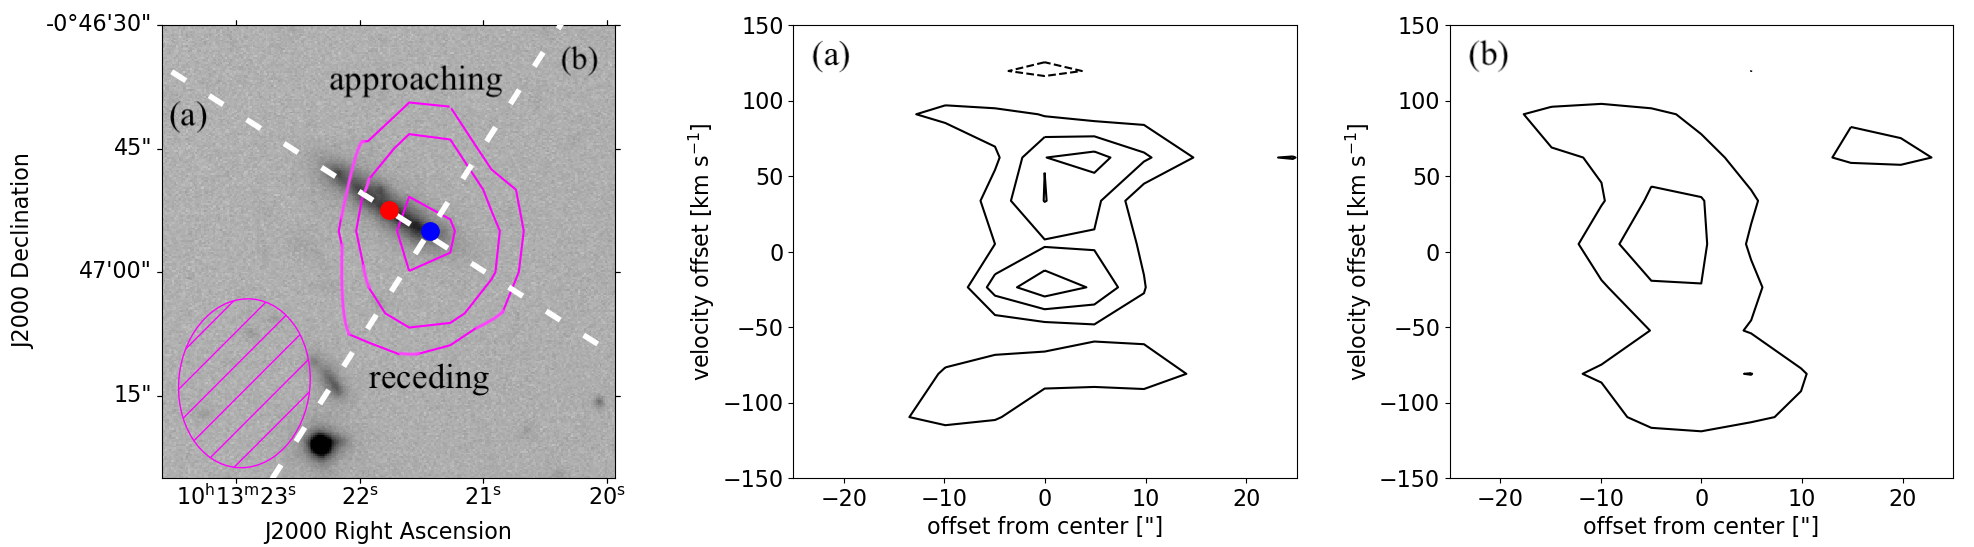
WINGSJ101321.71-004652.7 (f) This galaxy shows the clearest evidence for ram pressure stripping. The HI has been removed from part of the disk and peaks off center, a clear signature of ongoing ram pressure stripping. The continuum although still centered on the disk, is extended in the direction of the displaced HI, and extends slightly beyond it. Such morphology is comparable to the findings of the extremely ram pressure stripped jellyfish galaxies (Müller et al., 2021). There is however also asymmetry in the stellar disk, with more light coming from the same part of the galaxy where the HI is found. The direction of the HI points to WINGSJ101318.33-004957.6 (source e), and the two galaxies are very close in projection (110 kpc) and velocity (70 km s-1). We can not rule out that the extended morphology is due to a gravitational interaction.
In addition, the position velocity slice (shown in the bottom row of Figure 2) is further indicative of a galaxy undergoing ram pressure stripping. Both position-velocity slices show a large, approximately 200 km s-1, velocity width that is being pushed from the brightest region of the optical galaxy.
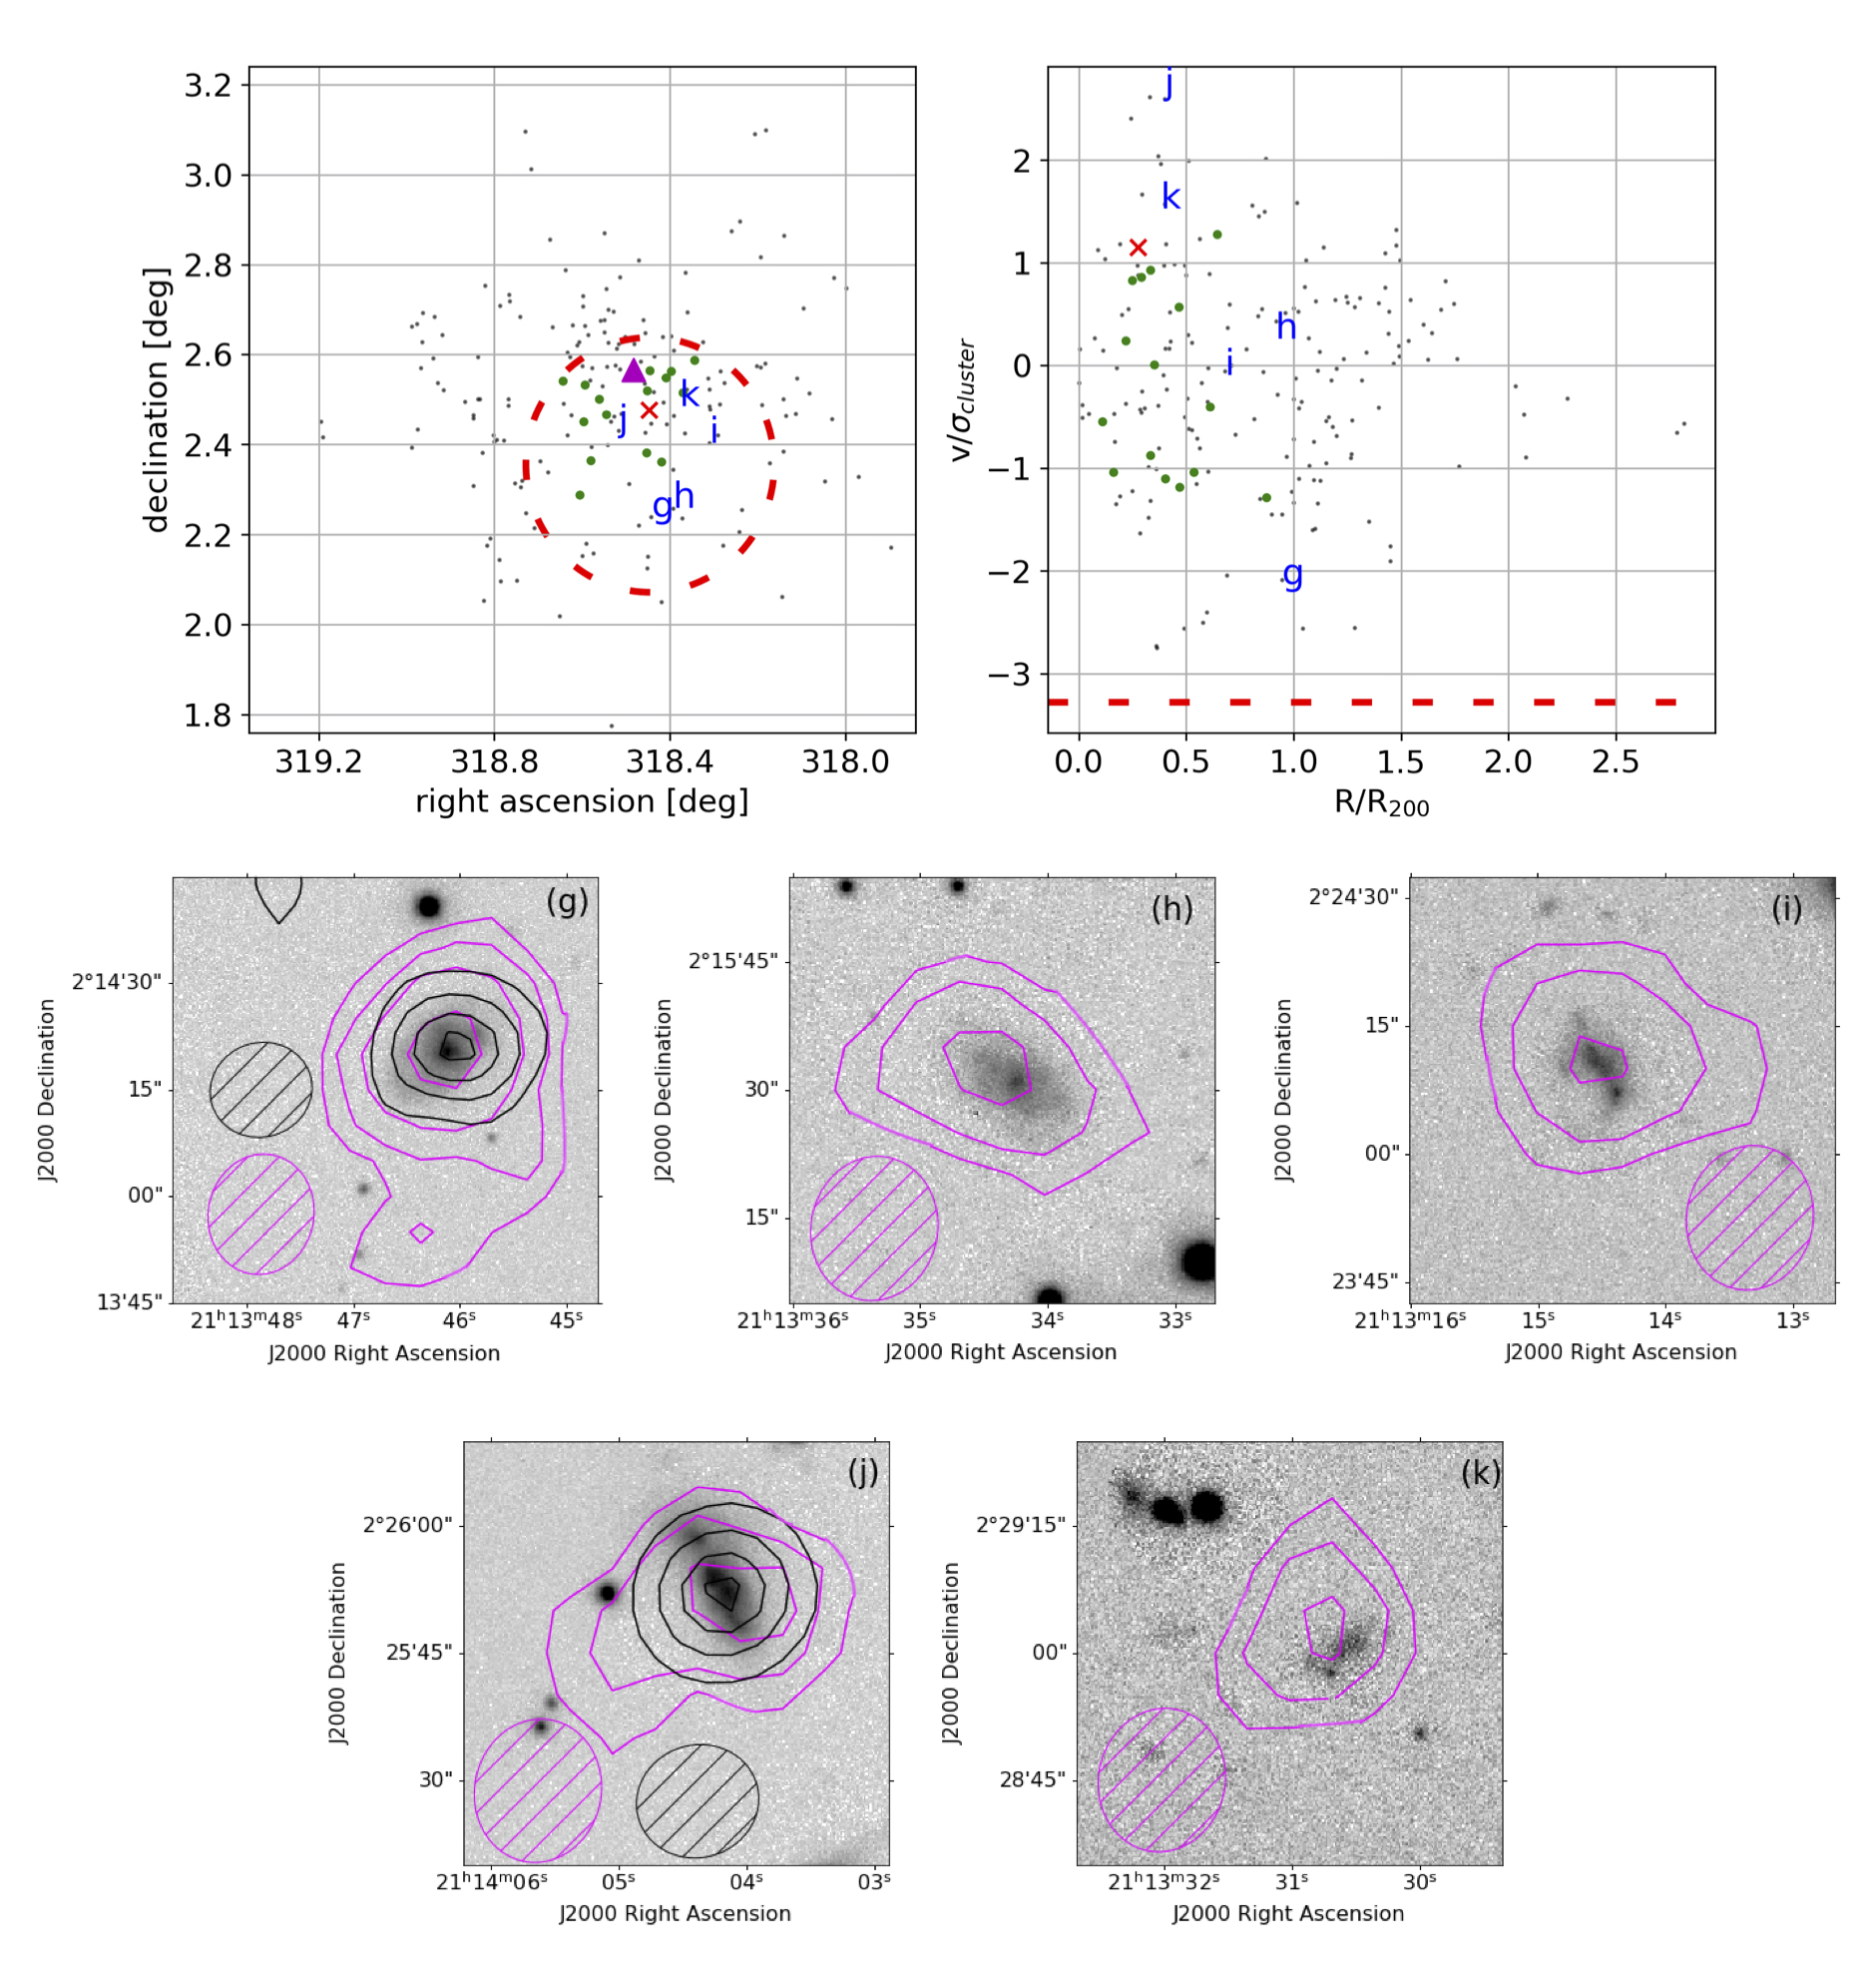
3.2 IIZW108
IIZW108 is the least massive of our five galaxy clusters with a velocity dispersion of 575 km s-1 and a R200 of 1.2 Mpc. In addition to the extreme jellyfish galaxy JO206 (for HI see Ramatsoku et al. (2019) and continuum Müller et al. (2021)), we detect four HI sources out of the 16 catalogued disk galaxies. Two of the HI detections are also detected in continuum. One galaxy (k) is not catalogued. In this cluster, we see again that the catalogued disk galaxies are spread throughout the velocity range, while 4 of the 5 HI detections are at a redshifted velocity, quite possibly falling in as a group. In all cases the HI extends further than the disk.
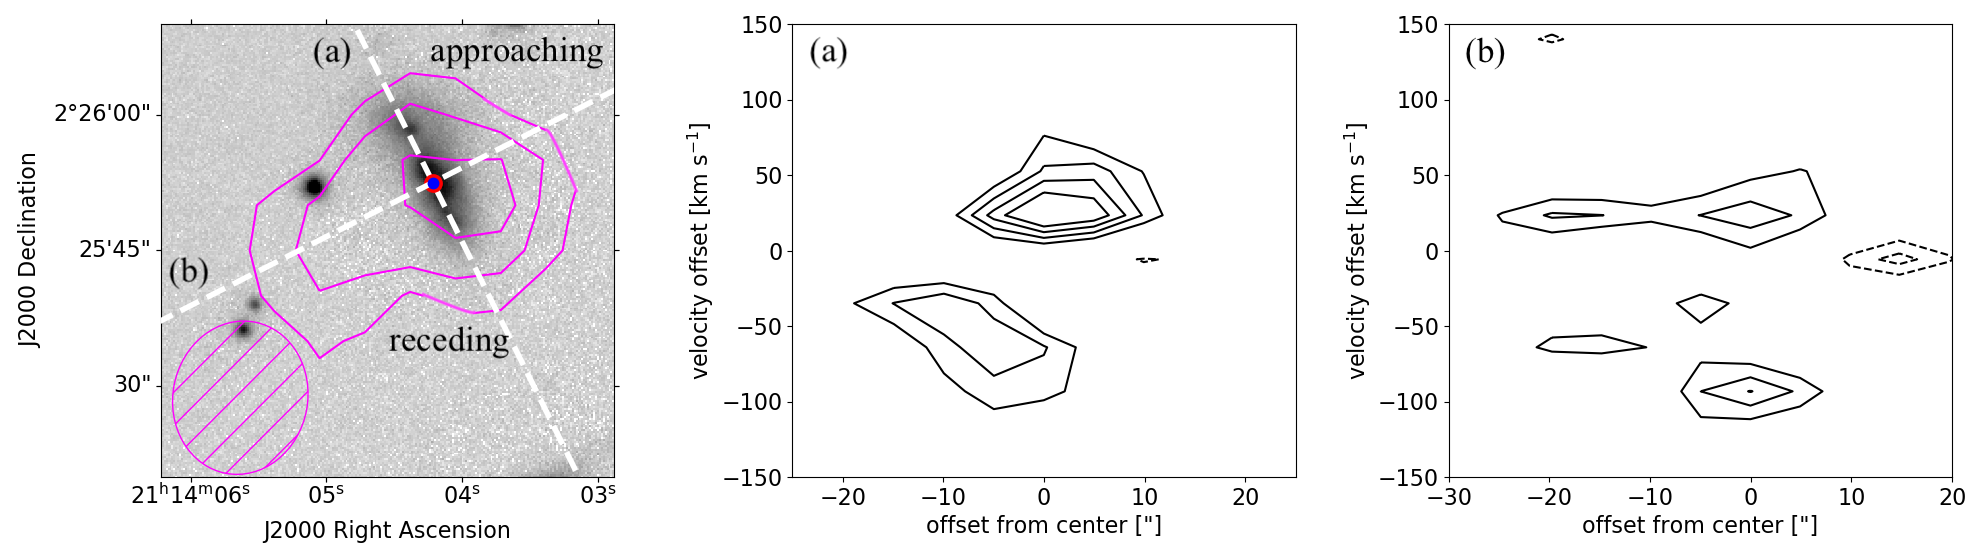
WINGSJ211346.12+021420.4 (g) The HI distribution is highly asymmetric with an extension to the south of at least 20kpc beyond the optical disk, while the optical disk is asymmetric and extends further to the south east. The HI tail is pointing away from the cluster center and could be due to an interaction with the cluster potential or the onset of ram pressure stripping. Most interestingly, the continuum emission is point-like but off-center from the stellar light on the western side.
WINGSJ211334.23+021530.9 (h) Both the HI and the stellar distribution are symmetric. Remarkably, the HI and stellar disks are not centered on the same place.
WINGSJ211314.53+022410.7 (i) The optical image indicates an irregular galaxy, and the HI morphology shows also an extension away from the cluster center of at least 10 kpc.
WINGSJ211404.17+022552.4 (j) The optical morphology is complex due to a possible superposition of two galaxies. The radio continuum emission is symmetrically and point like and centered on the stellar light disk center, indicating that there is either an AGN or a bright central star-forming region. Based on another deep C-array S-band JVLA observation in full polarization mode (EVLA Project 18B-018), we find a total radio continuum intensity at S-band of 0.990.05 mJy, as measured from a robust 0 weighted image with an r.m.s. of 3Jy/beam. With this, we measure a spectral index of -0.900.02, a polarised intensity of 0.015 mJy, and fractional polarisation of 1.5%. This indicates that the continuum is likely comprised of both an AGN and star formation. Unfortunately, no other HI sources could be identified in the S-band data.
In addition, the position velocity slice (shown in Figure 4) is indicative of a galaxy with complex kinematics. Both position-velocity plots show a small velocity gradient along their respective axes. While the gradient along the disk is consistent with rotation, the velocities perpendicular to the disk could be due to a polar ring or disk.
J211330.6+022904.9 (k) The HI is asymmetric about the irregular optical galaxy. Interestingly, the extension is in the direction of JO206, and the two are close in velocity (20 km s-1) and in projection (300 kpc) indicating that this possibly due to a gravitational interaction.
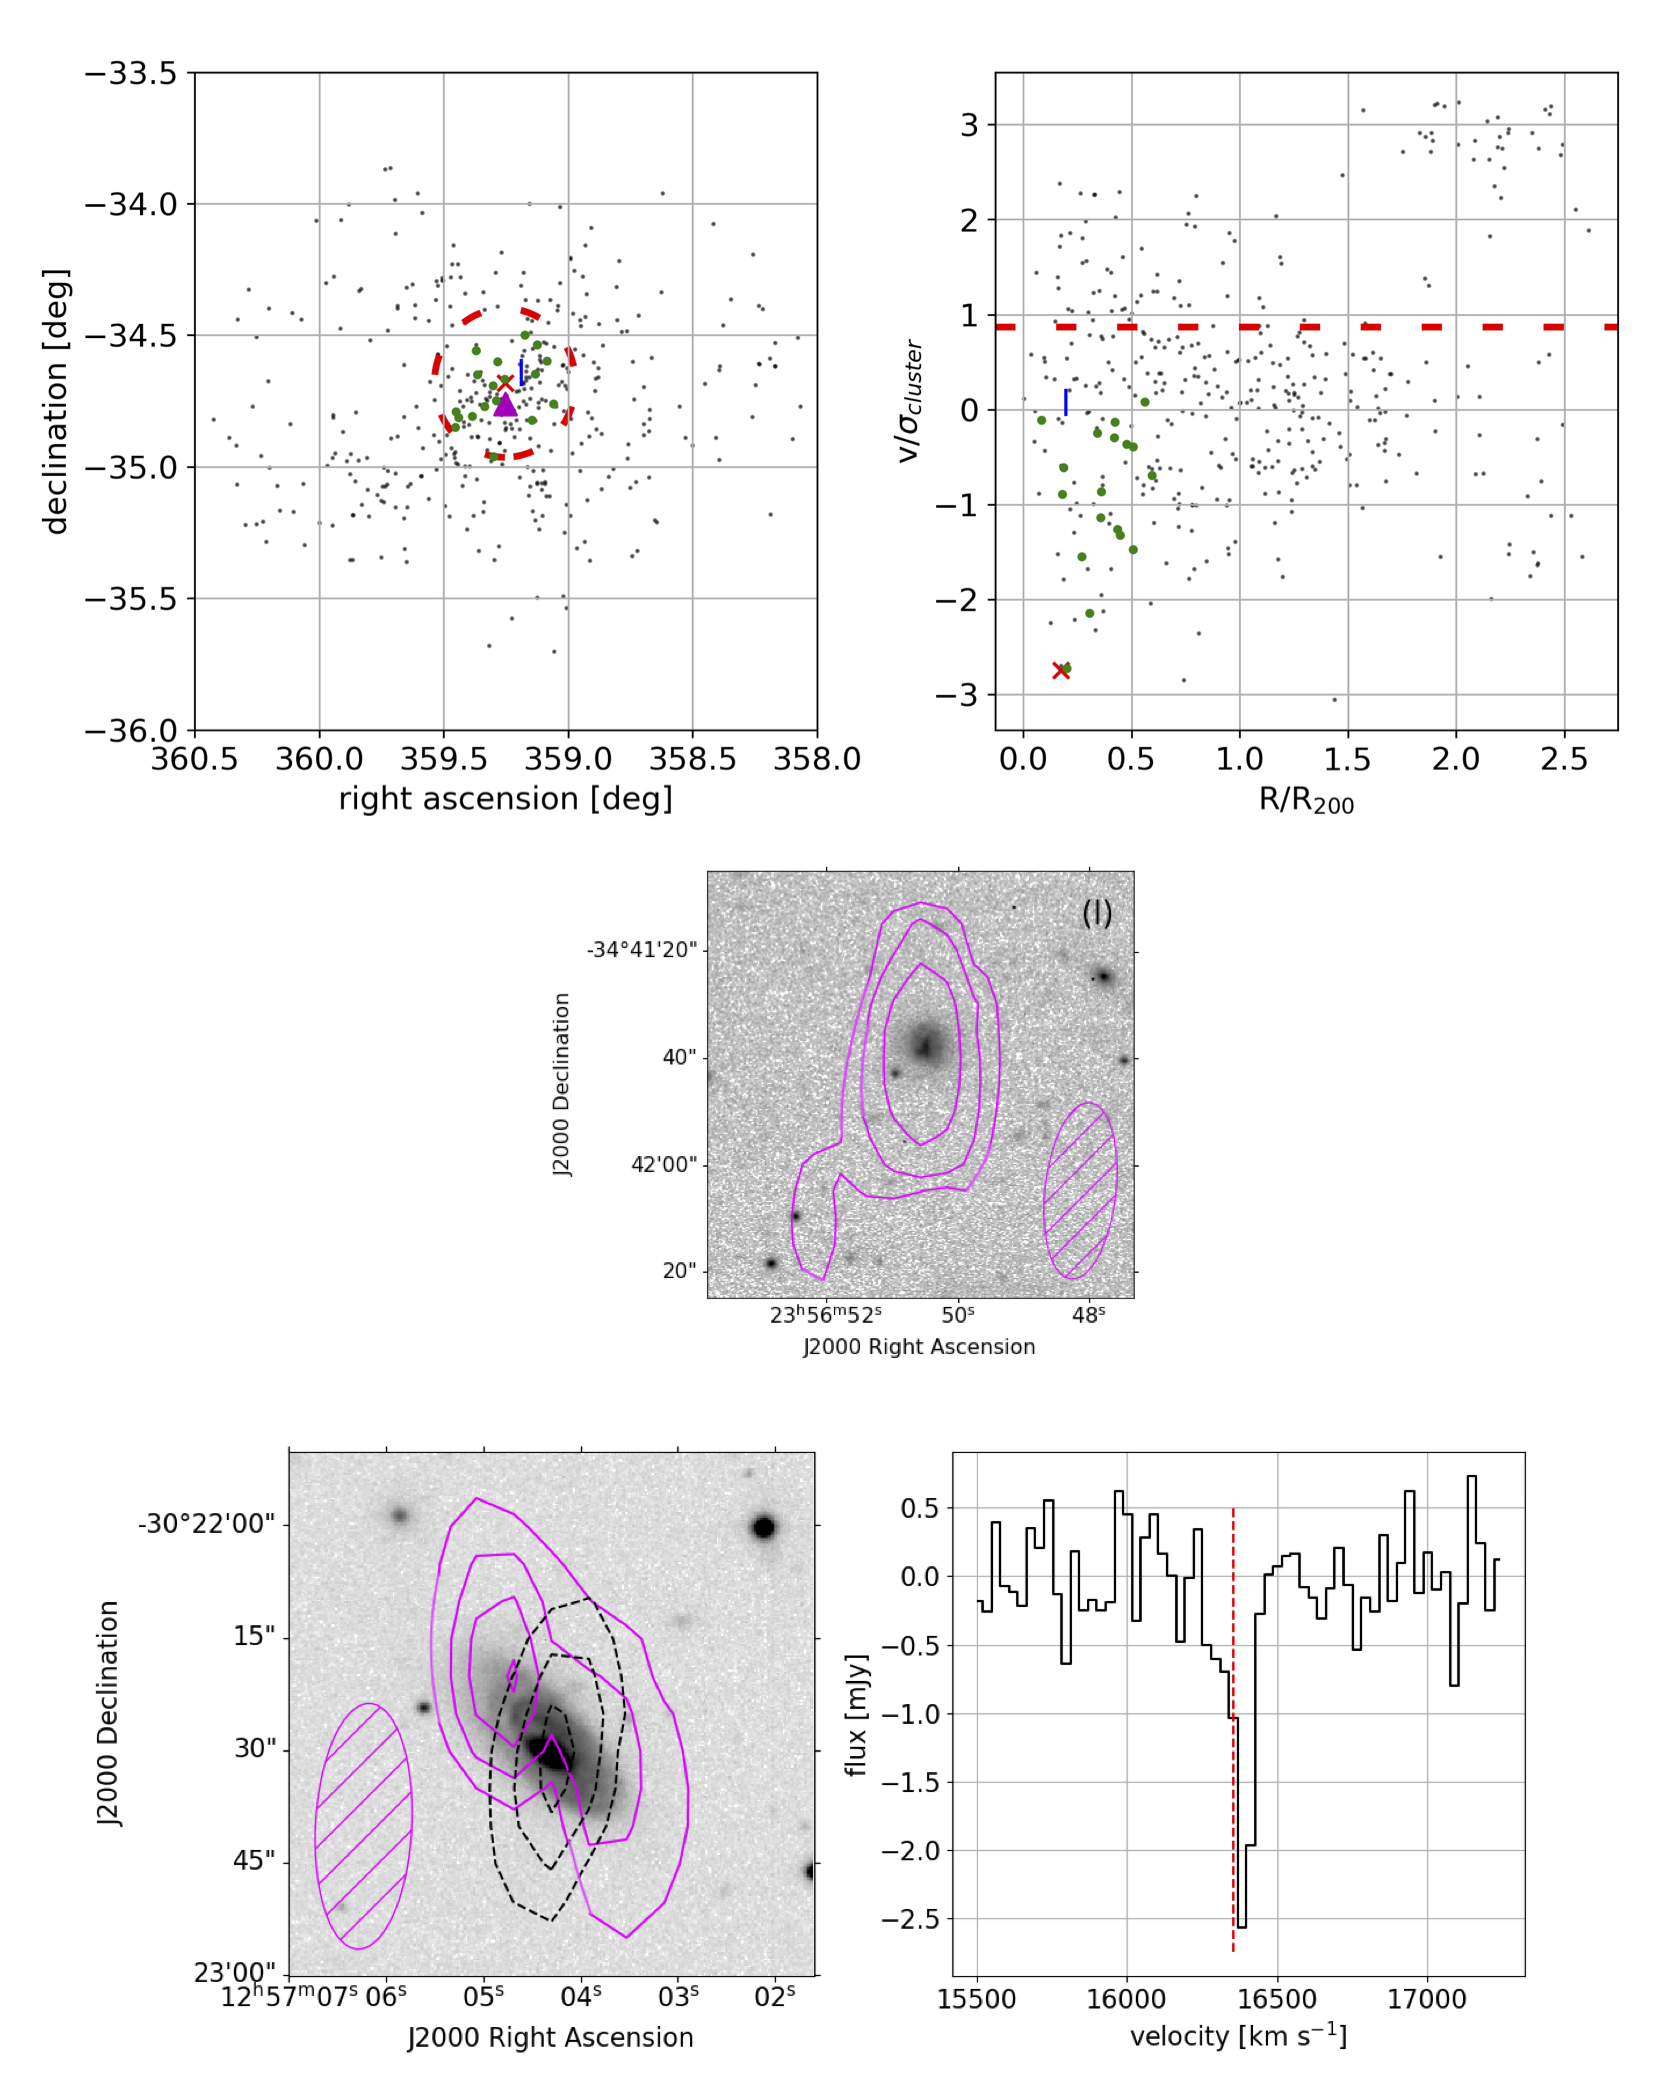
3.3 A4059
Abell 4059 is the second most massive of our five galaxy clusters with a velocity dispersion of 744 km s-1 and a R200 of 1.58 Mpc. We detect only one source in HI out of 23 catalogued disk galaxies. The HI source is not detected in continuum.
WINGSJ235650.48-344138.2 (l) The optical is clumpy but not asymmetric. The HI has an extension to the southeast, which could be caused by a gravitational interaction, although there is no close neighbour for this galaxy.
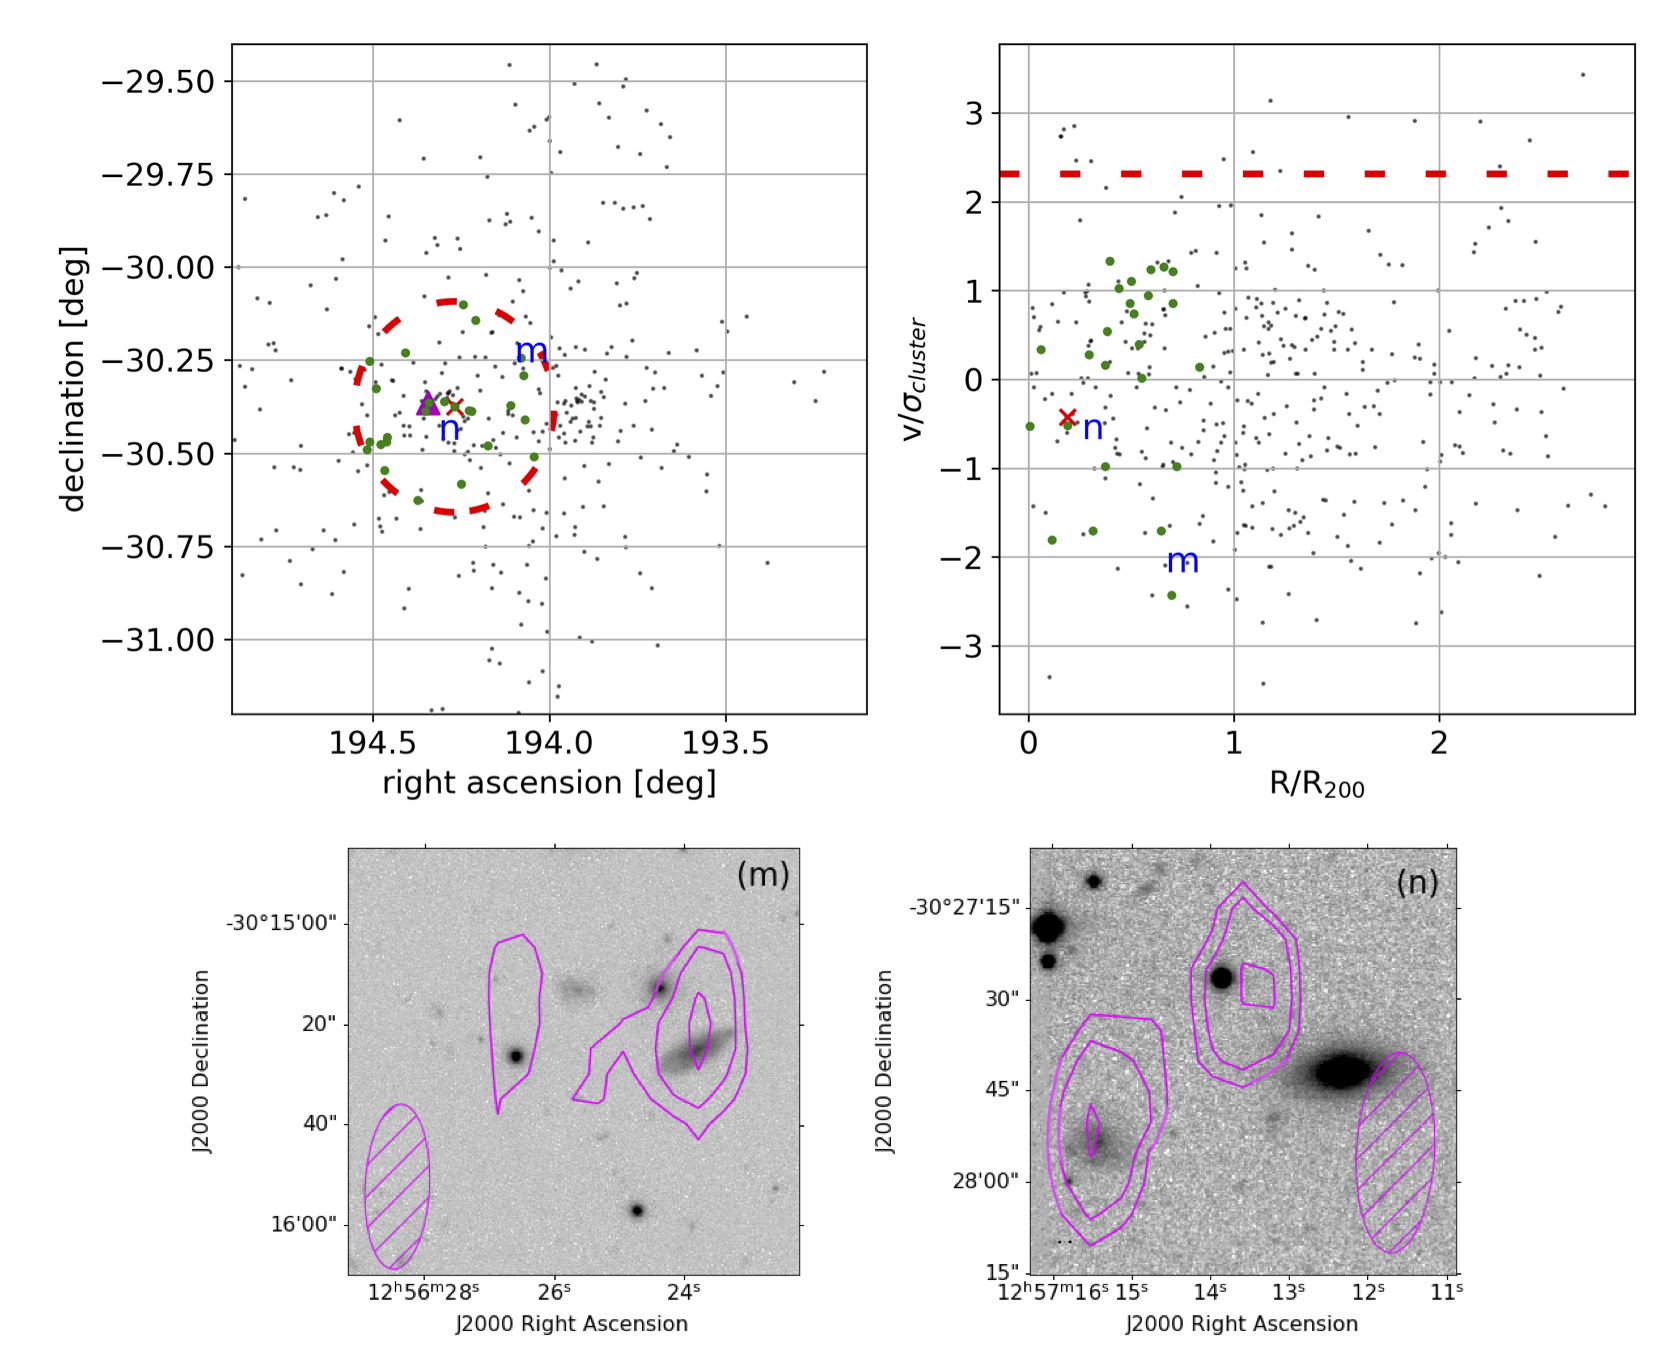
3.4 A3532
Abell 3532 is likely merging with the nearby cluster Abell 3530 and has a velocity dispersion of 662 km s-1 and a R200 of 1.55 Mpc. In addition to the extreme jellyfish galaxy JO135, we detect two additional HI sources, out of 26 catalogued disks. Neither HI detection is detected in continuum.
WINGSJ125623.82-301525.5 (m) The HI is asymmetric and extended in one direction. There are no known close neighbors which makes a tidal interaction unlikely for this peculiar morphology. Due to the small size of optical component of the galaxy, with respect to the VLA synthesized beam, we cannot determine if this is a case of ram-pressure stripping, because we cannot show that HI has been removed from the disk.
WINGSJ125715.40-302753.4 (n) There is clear HI asymmetry and a cloud to the northwest. The cloud and the galaxy appear to be connected kinematically, as the velocity gradient smoothly varies. The optical galaxy is irregular, but disturbed, though not obviously enough to cause the strange HI morphology.
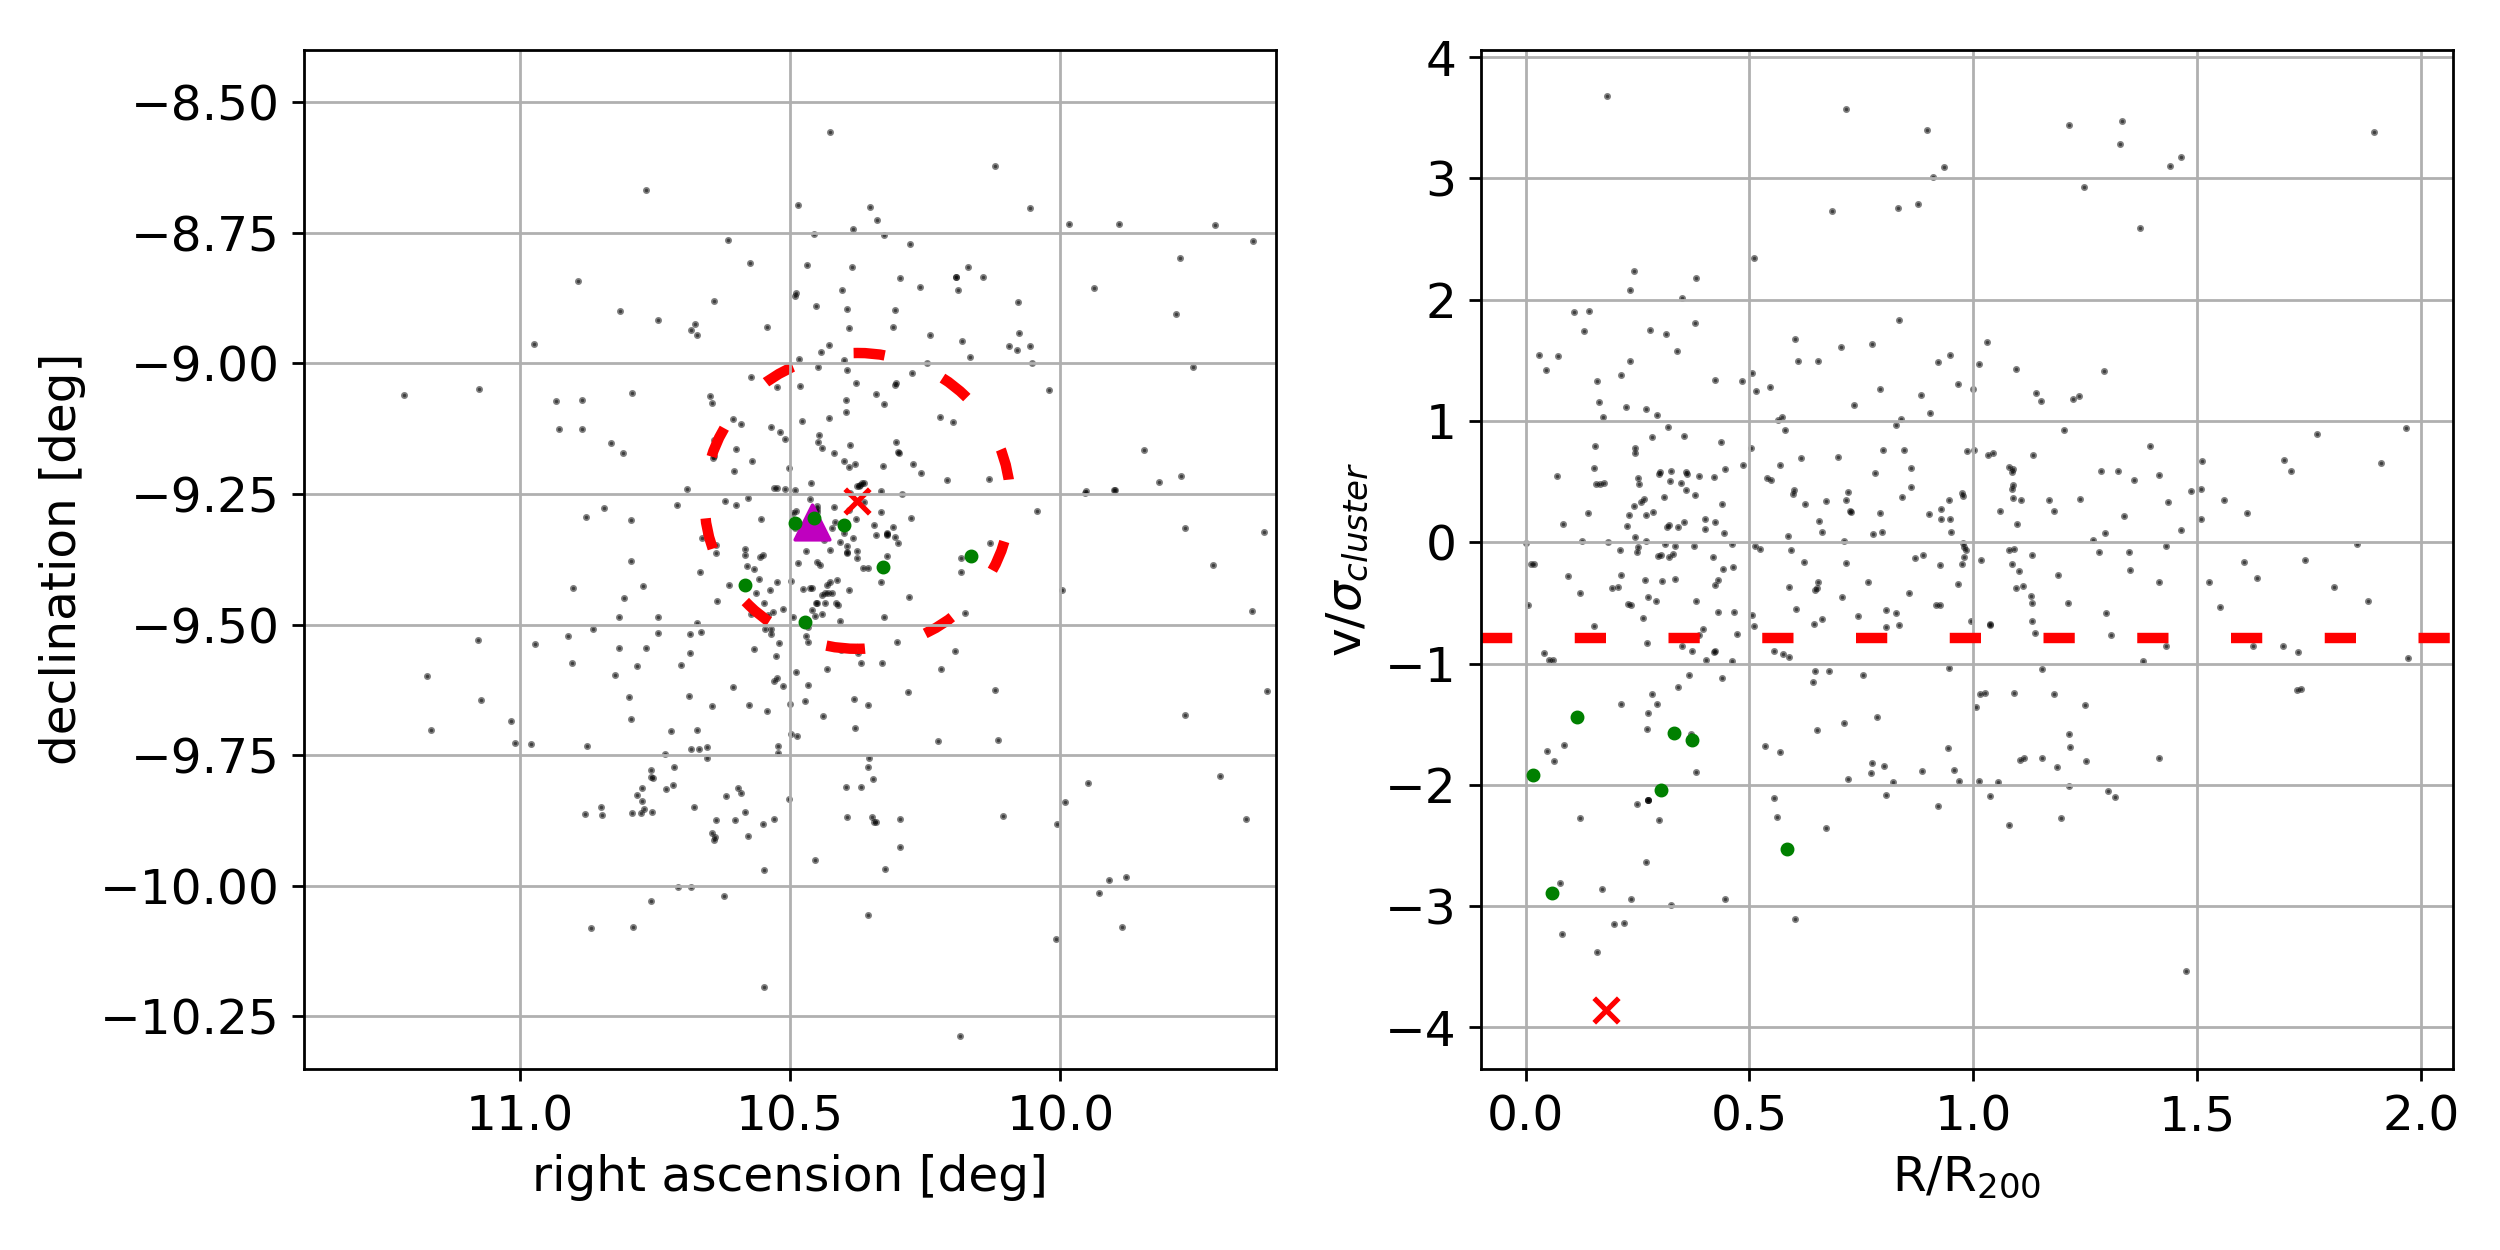
3.5 A85
Abell 85 is the most massive of the five clusters. We detect no HI in A85 other than the extreme jellyfish galaxy JO201, which has been presented in Ramatsoku et al. (2020). Since the velocity of J0201 is more than 3 of the cluster mean we only probed the low velocity tail of the cluster velocity range, containing only 9 disk galaxies.
3.6 HI Stacking
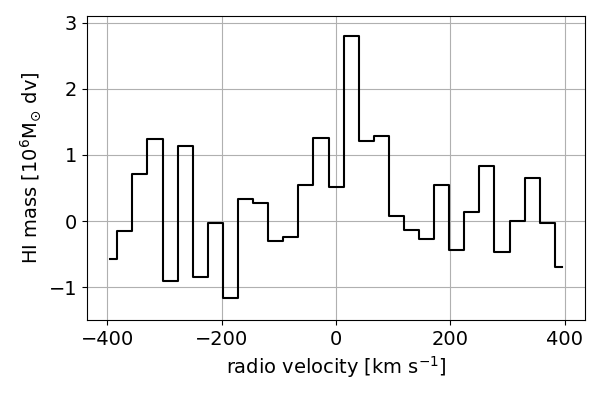
We detect only 13 of the 88 catalogued disk galaxies within the primary beam of the observations in addition to the five extreme jellyfish galaxies. We can improve on our sensitivity by producing a stacked spectrum of the 75 non-detected spirals to calculate a mean HI mass for these 75 spirals. In order to produce this stacked signal, we smoothed each HI line cube to a common angular resolution of 35 and spectral resolution of 125 kHz. We produced a primary beam corrected flux spectrum, dividing by the dirty beam area as these sources have not been cleaned, in a region around each spiral, approximately 50 kpc in diameter, and also calculate the primary beam corrected local noise in this region. These spectra and noise for each galaxy are then converted into units of HI mass per radio velocity channel, by using the luminosity distance to the cluster that each galaxy resides in. This allows us to average the spectra for the five different clusters, that lie at different distances, in an unbiased manner. The HI mass spectra are then averaged together channel by channel, using the local HI mass noise in each spectrum as a weight. We then subtract a first order polynomial using a fit that excludes the channels within 250 km s-1 of line center. The HI mass is calculated by summing the values in the channels between the velocity window of -100 and +150 km s-1. The uncertainty is calculated by using the same stacking procedure, but stacking locations with no emission, and then summing the emission in the same velocity window. This results in an average stacked HI mass for the 75 HI non detected spirals of 1.9 0.4 , an order of magnitude below that of our HI detections.
In Figure 8, we show the stacked spectrum of the HI emission of 75 non-detected spirals across the five clusters.
4 Discussion
4.1 HI Properties
In this section, we compare the properties of our HI detections, and non-detections of the spiral galaxies in the five clusters, with the properties of the five targeted extreme jellyfish galaxies. HI images have been published for three of the five extreme jellyfish galaxies, J0201, J0204 and J0206, and can be found in Deb et al. (2020); Ramatsoku et al. (2020, 2019), respectively. In addition to their H tentacles, the extreme jellyfish galaxies have HI displaced from the disk, with J0204 and J0206 showing evidence that HI is removed from within the optical disk, while J0201 still seems to have HI in the entire disk, but the authors in Ramatsoku et al. (2020) argue that this is a projection effect, and the HI is largely removed from the disk along the line of sight. For these three extreme jellyfish galaxies, the HI morphology confirms that these galaxies are undergoing ram pressure stripping as only a gas-gas interaction removes HI from the disk.
We show the total HI image of J0135 in the bottom row of Figure 5. It has a radio continuum source, with integrated flux of approximately 11 mJy, in the center, against which we see HI absorption. The absorption line spectrum shown in Figure 5 is very similar to what is seen in J0204 (Deb et al., 2020). The HI absorption is seen in the approaching side of the disk (the northeast of the galaxy), while the absorption is redshifted with respect to the systemic velocity, indicated by the red dotted line. This suggests that the HI is pushed toward the center via ram pressure. The HI disk is symmetrical in morphology and does not extend beyond the optical. The H tail extends to the NW from the center, but unfortunately the very elongated beam in our observations makes it impossible to see if there is any HI emission from the tail, as it is in the same beam as the very strong absorption. The fifth extreme jellyfish galaxy J0194 is not detected in the current observations.
The HI morphologies for our 14 detections, shown in Figures 1,3,5, and 6, vary widely. Galaxy f in Abell 957 (1) shows HI removed from most of the stellar disk, and is clearly undergoing ram pressure stripping. For galaxy c, the HI surface density distribution is very asymmetric, and peaks at an optically very faint extension of the disk. Although this fact by itself does not provide enough evidence for ram pressure stripping, an inspection of a position-velocity diagram (Figure 2) at that location suggests the gas is being accelerated out of the disk toward the systemic velocity of the cluster, suggestive of ongoing ram pressure stripping. All the other detections have extended HI, with many having asymmetric extensions, but no clear hallmarks of ram pressure stripping.
In 4 galaxies, the HI asymmetry points away from the cluster center, a feature also seen for example in the Virgo cluster (Chung et al., 2007) and interpreted as evidence for the onset of ram pressure stripping at about the virial radius of the cluster. Unlike in Virgo where the tails extend in one direction and gas is removed from the disk on the opposite side, here we don’s see direct evidence of ram pressure stripping and the tails could be due to a gravitational interaction with the galaxy cluster potential, or the onset of ram pressure stripping by the ICM. Several other galaxies are candidates for a gravitational interaction as they have a companion that is close spatially, and in velocity. In summary, our 14 detections are being affected by the cluster environment in different ways, but due to their still high HI content, they are in the early stages of gas removal.
We detect only 13 of the 88 catalogued disk galaxies, and one additionally uncatalogued galaxy. A stacked HI profile of the 75 non detected galaxies gives an average HI mass that is an order of magnitude lower than the average mass for the 14 HI detections. In the subsequent sections, we will show that these non-detected galaxies are the galaxies that have been most strongly affected by the environment.
4.2 Stellar Mass of Cluster Members vs. Extreme Jellyfish Galaxies
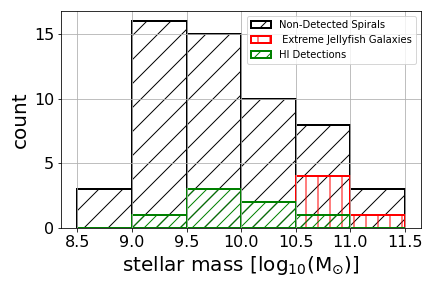
In Figure 9, we show the distribution of stellar masses for the five targeted extreme jellyfish galaxies, the 13 non-jellyfish HI detections for which we have stellar masses, and the 75 non-detected catalogued spiral galaxies. The histogram spans a stellar mass range of 108.5-12.0 M⊙, with 7 bins of the equal size of 0.5dex. There is no correlation between the HI detection rate and the stellar mass of the galaxies in the cluster.
The most striking result is that the 5 Jclass=4,5 extreme jellyfish galaxies have a significantly higher stellar mass than almost all spiral galaxies in the clusters. The average log stellar mass for these extreme jellyfish galaxies is 11.16 M⊙, which is approximately a factor 5 greater than the average log stellar mass for the non-detected spirals. In addition the 5 extreme jellyfish galaxies are more massive than any of the HI detected galaxies. While Jaffé et al. (2018) has found that extreme jellyfish galaxies (Jclass = 4,5) are the most massive of all jellyfish galaxies, here we find that these jellyfish are more massive than all disk galaxies in the clusters. This brings up the possibility, does the extreme jellyfish phenomenon depend on stellar mass?
4.3 Location in Cluster: Extreme Jellyfish Galaxies vs. Cluster Spiral Galaxies
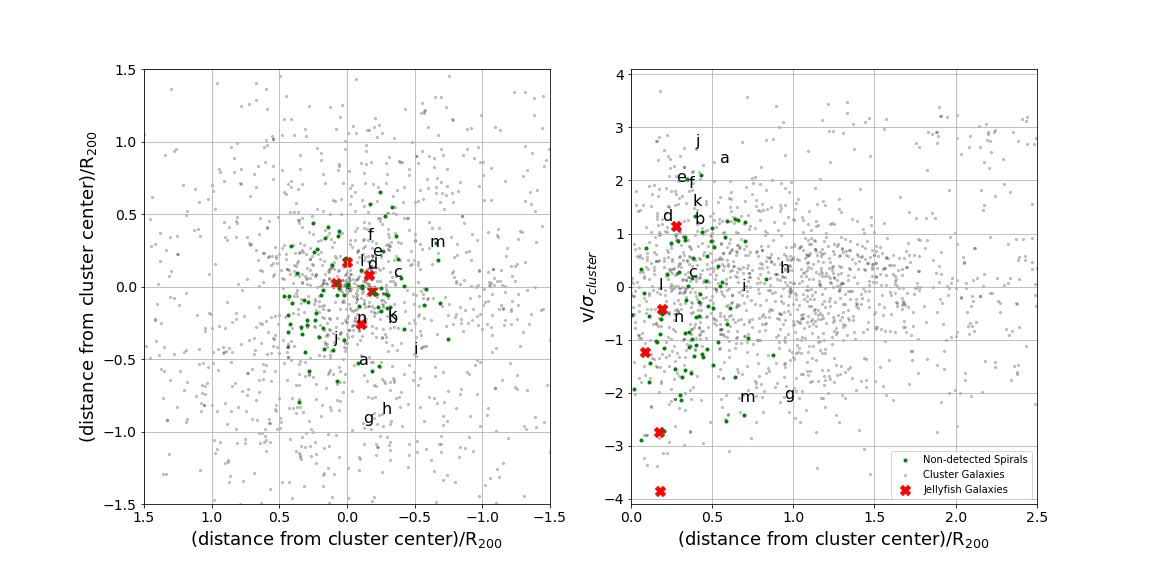
In Figure 10, we plot a composite of the distribution of all cluster members for the five observed clusters. On the left, we show the distribution on the plane of the sky, and on right the, projected distance - relative velocity phase space distribution. In the plot on the left, the sky coordinates have been normalized by the cluster radius (R200) and on the plot on the right, by the cluster velocity dispersion () and radius (R200). This allows us to look at all cluster members, HI detections, spiral galaxies, and extreme jellyfish galaxies for all five clusters in a single image.
Using the information conveyed in Figure 10, we are able to distinguish the locations of the three populations we have HI information for, the stacked spirals, the directly detected spirals, and the extreme jellyfish galaxies. The mean projected radial distance, and the range of all distances in parenthesis, in Mpc for the extreme jellyfish galaxies is 0.1803 (0.0841-0.2759), for the HI detections it is 0.4671 (0.1712-0.9458), and for the stacked galaxies is 0.3915 (0.0037-0.8718). To investigate whether or not the differences in mean radial projected distances were statistically meaningful we conducted a two sample Kolmogorov–Smirnov (KS) test to compare the different combinations of our three groups. For the two combinations of the stacked spiral galaxies and the extreme jellyfish galaxies, and the HI detections and extreme jellyfish galaxies, the KS test yielded p-values of 0.00386 and 0.01152, respectively. This result confirms that the difference in mean projected distance for the extreme jellyfish galaxies, compared to the other two samples, is statistically significant. The fact that extreme jellyfish galaxies are not only in projection close, but also span a large range in relative velocities, suggests they are on radial orbits reaching their maximum velocity close to the center, as first observed in (Jaffé et al., 2018).
What is unusual is that the extreme jellyfish galaxies still have detectable HI (in 4 out of 5 systems) despite being close (in projection) to the cluster centers, moving at high velocities, and if they are really close experiencing maximal ram pressure. Jaffé et al. (2018) found in an orbital study of 409 jellyfish galaxies that the most extreme jellyfish galaxies (Jclass=4,5) were at extreme locations in phase space, making it plausible that they are experiencing maximum ram pressure. Here we find that the most extreme jellyfish galaxies (Jclass=4,5) are among the most massive of all the disk galaxies, and that they are the only disks which still have significant amounts of HI at such an extreme location in phase space. Thus our results generalize the results of Jaffé et al. (2018). The extreme Jclass4,5 jellyfish galaxies are more massive than most disk galaxies, and are thus more able to hold onto their neutral gas until they reach peak ram pressure in the center of the cluster.
4.4 HI Deficiency In Different Environments
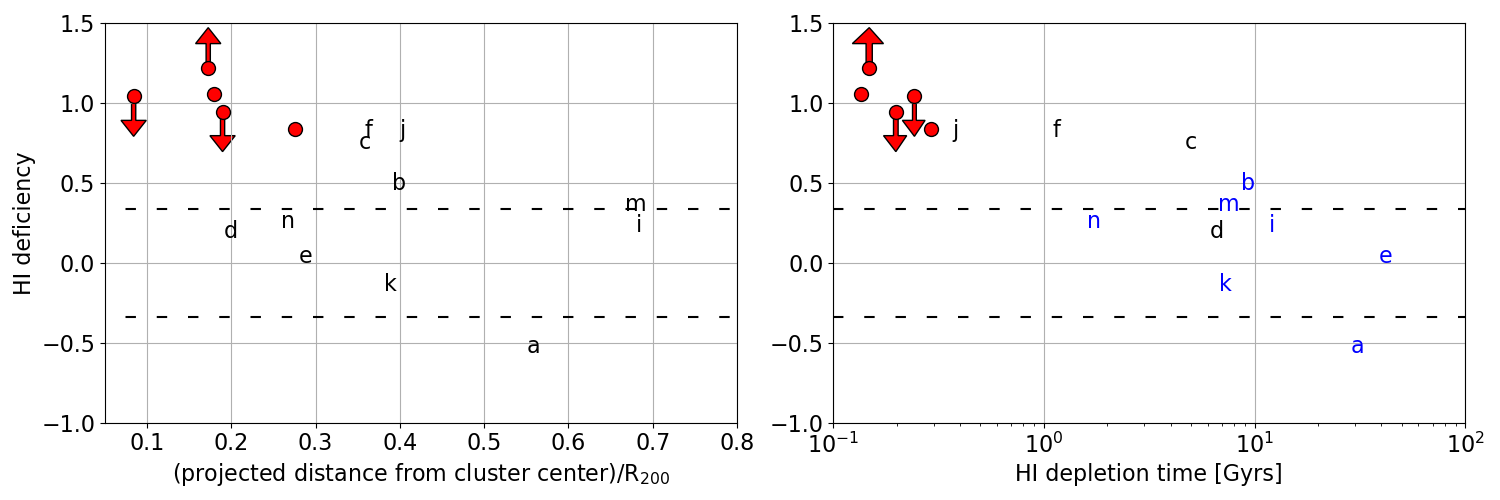
In Figure 11, we show the relationship between HI deficiency and projected distance from the cluster center (left) and HI depletion time (right). HI deficiency is a useful quantitative measure of how much HI gas a galaxy should have compared to how much HI gas is measured Giovanelli & Haynes (1983). This relationship is given by:
| (1) |
In order to use this measure we need to first calculate the expected HI mass. This is possible via different scaling relationships that correlate a galaxy’s optical properties with HI content. For this work, we use the relationship between B-band optical diameter and HI total content as presented in Dénes et al. (2014).
| (2) |
We calculate the B-band R25 for our galaxies by taking the mean semi-major axis of the elliptical isophotes, whose surface brightness values are equal to 25 mag arcsec-2. Note that we did not correct for dust extinction. Dénes et al. (2014) found that the scatter in the relation did not decrease using that correction, probably due to large uncertainties in correction for internal dust and inclination. Galaxies, g,h and l are missing from the plots because no reliable diameter could be determined as they lie outside of the WINGS pointings.
Taking into account the intrinsic scatter in the HI properties of galaxies, a galaxy with an HI deficiency greater than 0.3 is HI deficient. In figure 11, we show that the extreme jellyfish galaxies are HI deficient, noting that the upper limits are due to the fact that there is HI absorption in those two galaxies, giving a lower limit to the total HI mass, and the HI deficiency lower limit is due to the fact JO194 had no direct detection. Three of the HI detected disk galaxies c, f, and j are HI deficient. Interestingly, of our 14 detections, f, and c, are the only galaxies with strong evidence for ongoing ram pressure stripping. Galaxy j may be a superposition of two galaxies, and if so, the optical diameter might have been overestimated. Figure 11 recapitulates a well known fact for gas in cluster galaxies, namely that the HI deficient galaxies are in projection closest to the cluster center (Giovanelli & Haynes, 1985; Solanes et al., 2001; Chung et al., 2009; Healy et al., 2020), as we also discussed in the introduction.
In order to confirm that our sample is replicating these results in a statistically significant manner, we calculate the Pearson correlation coefficient for HI deficiency and projected radius. This coefficient is then tested against the null hypothesis, that there is no correlation present. We use a t-test to calculate the probability value of the null hypothesis being true, and find that it is lower than 0.001, confirming that there is a negative correlation between HI deficiency and projected cluster radius, as was expected.
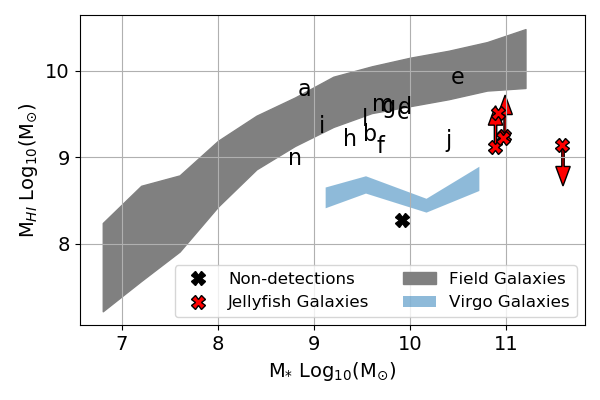
A different way to compare observed HI mass to expected HI mass is to look at the HI mass-stellar mass relation for galaxies in different environments (Cortese et al. (2011)). In Figure 12, we compare the HI masses of the 13 detected disk galaxies, for which we also have a stellar mass, and the HI masses of the extreme jellyfish galaxies and the mean HI mass derived from the stacked spectrum of the 75 galaxies, that were not detected individually to a sample of field galaxies and a sample of galaxies in and near the Virgo cluster. The grey band shows the mean HI mass for a sample of nearby galaxies taken from Maddox et al. (2015), as well as the 1 spread, the blue band shows the mean HI mass for a sample of galaxies in the Virgo cluster and surrounding clouds, as well as the 1 spread Cortese et al. (2011). For both samples, the data are flux-limited. Our HI detections indicated by letters fall mostly within the grey band. In this case only galaxy f and j have somewhat less HI than expected for a galaxy in a low density environment. The mean stacked HI mass for our non detected galaxies falls on the blue line. They are as deficient as other cluster galaxies. The extreme jellyfish galaxies indicated in red are the most interesting, they are in between the two lines, on their way to losing their gas. Figure 12 clearly demonstrates that not only are the extreme jellyfish galaxies amongst the most massive galaxies, in terms of their stellar mass, but also have a detectable amount of HI while still being deficient. This than allows the figure to serve as a synthesis of Figures 9 and 11.
4.5 Star Formation Rates and HI Depletion Times
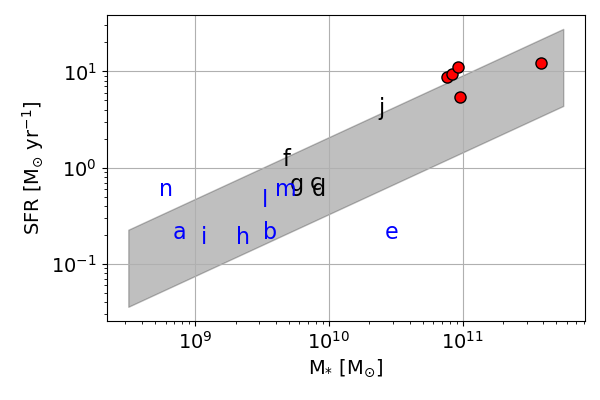
It has been found that jellyfish galaxies, especially those observed by GASP, have elevated star formation rates, while other spiral galaxies in clusters have star formation rates lower than those in the field (Vulcani et al., 2018b; Poggianti et al., 2016a). We are able to study this relationship for our HI detections and the five extreme jellyfish galaxies (Jclass=4,5) by using the radio continuum emission to compare the star formation rates. In Figure 13, we plot the star formation rate as a function stellar mass for our 13 detections, for which we have stellar masses, and for the five extreme jellyfish galaxies. We only detect radio continuum in 5 of the 13 galaxies, and indicate this by coloring the detections black, and the non-detections blue. The shaded region is the SFR main-sequence, 1, as derived in Poggianti et al. (2016a) for the WINGS sample. The SFR main-sequence for cluster galaxies is likely to be different from that for a general sample of galaxies, such as that, for example, in Renzini & Peng (2015). We decided to use the SFR main-sequence for cluster galaxies from Poggianti et al. (2016a) to make sure that all quantities for our galaxies and the comparison sample were derived consistently. In addition it offers the opportunity to see whether galaxies that are currently undergoing ram-pressure stripping differ from other cluster galaxies. Of the 5 radio continuum detected spiral galaxies (the black markers), only galaxies j and f appear to have a slightly elevated SFR for their mass compared to spiral galaxies in the WINGS sample, but still only lie at the +1 point. Similarly, the extreme jellyfish galaxies, J0204, J0206 and J0201 have a slightly elevated SFR. This similarity is of particular interest, as galaxies j and f are two of the three best candidates of our 14 detections that currently might undergo ram pressure stripping.
With both gas and SFR in hand, we can also calculate depletion times for the galaxies, and we show HI deficiency as a function of HI depletion time in the right panel of Figure 11. Interestingly, in addition to the already known fact that jellyfish have short depletion times, galaxy j and f stand out as they have both an elevated SFR and an unusually small HI reservoir. Galaxy f fits the picture of currently undergoing strong ram pressure stripping and possibly having ram pressure enhanced star formation. We saw before that galaxy j may not be HI deficient, if in fact it is a superposition of two galaxies. The radio continuum, however, is centered on the main galaxy and the conclusion is that it is forming stars too rapidly for its HI mass.
Aside from the extreme jellyfish galaxies, we have detected 2 galaxies with stellar mass larger than 1010 M⊙, galaxy e and j. Do we expect these galaxies to be or become Jclass= 4,5 jellyfish? Interestingly, galaxies e and f are at very similar location in phase space, spatially and in velocity. Galaxy f is ten times less massive than e, is HI deficient and has slightly elevated star formation. Galaxy e does show a one sided tail but there is no sign that the HI disk is experiencing ram pressure. It is not HI deficient and its SFR is unusually low. If these two galaxies are indeed physically close and experiencing similar ram pressure then it shows that stellar mass is important for a galaxy to hold onto its gas. On the other hand, Galaxy j is HI deficient, has an elevated SFR, and is already at an extreme location in phase space. It shows all the characteristics to already be, or soon become, an extreme (Jclass=4,5) jellyfish galaxy.
Our observations are consistent with the suggestion by Jaffé et al. (2018) that galaxies with the highest stellar mass are most likely to show the extreme H tentacles seen in extreme (Jclass=4,5) jellyfish galaxies. The high stellar mass enables the galaxies to hold onto their gas until they reach the highest density ICM. Although few theoretical studies have been done on star formation in tails, it has been suggested that the star formation rate depends mostly on the pressure of the ICM, for example see Tonnesen & Bryan (2012); Roediger et al. (2014).
4.6 GASP compared to other jellyfish samples, what does it mean to be extreme?
Our 5 extreme jellyfish galaxies are selected from the first large homogeneous compilation of jellyfish galaxies in clusters from the WINGS and OMEGAWINGS surveys. Jaffé et al. (2018) showed that within this compilation, the extreme jellyfish (Jclass=4,5) differ from the other jellyfish galaxies in the sample in stellar mass and location in phase space. We show in this paper that these extreme jellyfish galaxies differ not only from other jellyfish galaxies, but from all disk galaxies in their respective clusters in stellar mass, location in phase space, and HI properties at that location in phase space. The question is now, what does it mean to be an extreme jellyfish in GASP and how does our results compare to other surveys. A few other surveys of jellyfish galaxies have been carried out, though, we are the first to present HI properties for all disk galaxies near the jellyfish galaxies and then compare the properties of these two populations. Here we briefly discuss the differences in selection criteria and compare and contrast some results.
The jellyfish galaxy candidates in the GASP survey were selected by manual inspection of each galaxy, looking for asymmetries, in the B-band images. This selection process may be biased toward actively star-forming galaxies. In fact, Poggianti et al. (2016a) found that the star-formation rate in the jellyfish galaxies is a factor two higher than in non-stripped galaxies in this sample. Several searches for a few galaxies undergoing ram-pressure stripping, with enhanced star-formation, and long ionized tails have been performed in Virgo (Boselli et al., 2021), and in massive X-ray clusters at higher redshift (Ebeling et al., 2014). These results are consistent with ours, with Ebeling et al. (2014) finding that the jellyfish candidates at higher z outshine all the other disks in the clusters.
Yagi et al. (2010, 2017) used the Subaru telescope, and narrow band filters covering the H line, to do a search for ram-pressure stripping in the nearby clusters Coma and Abell 1367. They give an in-depth discussion of the evolutionary history of the two clusters and galaxies therein. They find in both clusters spectacular tails of ionized gas, mostly, but not all, associated with galaxies. In both clusters the parent galaxies occupy extreme velocities in phase space, as we find in GASP, and the authors speculate that they are falling in for the first time.
An important difference between the GASP survey and the Yagi et al. (2010, 2017) surveys is that GASP is trying to find galaxies that show signs of undergoing ram-pressure stripping by looking at B-band images of the galaxies, while Yagi et al. (2010, 2017) search for ionized gas tails directly with the H line. Yagi et al. (2010, 2017) distinguish three categories of cloud-parent connection: 1) connected H clouds with disk star-formation, 2) connected H clouds without disk star-formation, and 3) detached H clouds. At first glance, we would expect that type 1 would be similar to the galaxies categorized in GASP as jellyfish galaxies. In Coma, all but one of the type 1 cases have parent galaxies with stellar mass in excess of 1010 M⊙. In Abell 1367, the stellar masses are lower than in Coma and our sample, which they suggest could be because this cluster is much less massive. This difference in cluster mass would lower the density of the ICM allowing for the extreme ram-stripping we see in jellyfish galaxies to happen to lower mass galaxies, in the manner we are hypothesize in this work. As a result, we think, in general, there is very good agreement with the surveys of Yagi et al. (2010, 2017). Their type 1 galaxies are massive galaxies currently undergoing ram pressure stripping with enhanced star formation in disk and tail. Type 2 is at a later stage of stripping, evident because the gas is already removed from the galaxy, and only some star formation is found in the tail. Type 3 galaxies have already been completely stripped, as the tails are part of the gas that has been removed from the galaxies, and, as expected, they are mostly the lower mass galaxies which get stripped first and most easily. These stripped tails without star formation would not have been detected in B-band images and as the galaxy morphology itself is no longer affected they would not be classified as extreme jellyfish by GASP.
5 Conclusions
In this paper, we have presented new VLA-C array observations of neutral hydrogen in regions centered on extreme (Jclass=4,5) jellyfish galaxies in five galaxy clusters. Our work presents the HI morphology, and radio continuum morphology, for 14 non-extreme jellyfish galaxies within these clusters. In addition, we detect 75 disk galaxies that are not directly detected in HI by making a stacked spectrum. We draw comparisons between the extreme jellyfish galaxies, and the disk galaxies within the clusters. Our results are best summarized as follows:
-
1.
We detect HI in 14 cluster member galaxies with a variety of HI morphologies and an average HI mass of 4109 M⊙. One galaxy (f, Figure 1) shows clear evidence for ram pressure stripping, Another galaxy, c, might be affected by ram pressure (Figure 1). Most of our HI detections have HI extending beyond the stellar disk, making it difficult to disentangle the physical mechanisms that affect them. We stacked profiles of the 75 non-detected galaxies and find an average HI mass of 1.9108 M⊙.
-
2.
The five extreme jellyfish galaxies have a larger stellar mass than almost all disk galaxies observed in the five clusters, and they are more massive than any of our HI detected galaxies.
-
3.
Combining the data on stellar mass and HI content we find that our HI detections are not, or only mildly HI deficient, our non-detected spirals are as deficient as typical cluster galaxies. The Jclass=4,5 galaxies are at the extreme mass side of this diagram and have HI deficiencies in between the two populations.
-
4.
The distribution in phase space is different for the extreme jellyfish galaxies than the other HI detected galaxies. Their high relative velocity and projected location close to the center makes them experience peak ram pressure. The less massive galaxies at these locations have already lost their gas.
-
5.
We conclude, in agreement with (Jaffé et al., 2018), that the extreme jellyfish galaxies, those classified as Jclass=4,5, have such extreme star-forming tails due to their high stellar mass. The high stellar mass allows them to more easily hold onto their gas, and they only get ram-pressure stripped as they plunge through the center of the cluster. The tails of stripped gas can form stars due to the high pressure of the surrounding ICM (Tonnesen & Bryan, 2012; Roediger et al., 2014; Poggianti et al., 2019).
Our results are based on a selection of galaxies from the WINGS and OMEGAWINGS surveys and follow up MUSE data. Our selection of extreme jelly fish is based on optical distortions of the galaxies showing signs of extraplanar light as seen in B-band images. This almost certainly means that they are currently undergoing ram pressure stripping. A next step could be to investigate whether this result applies to other ram pressure stripped galaxies with long H star forming tentacles. The stellar mass of the most extreme tail galaxies is likely to depend on the mass of the cluster, and density of the ICM. Of course there are other circumstances where the ICM pressure can locally be enhanced due to shocks resulting from infalling groups. Future HI observations with the MeerKAT telescope of all the disks in clusters with extreme jellyfish galaxies will be useful in assessing the relation between stellar mass and location in phase space with HI stripping, ICM pressure and star formation in stripped gas.
References
- Astropy Collaboration et al. (2013) Astropy Collaboration, Robitaille, T. P., Tollerud, E. J., et al. 2013, A&A, 558, A33, doi: 10.1051/0004-6361/201322068
- Bell & de Jong (2001) Bell, E. F., & de Jong, R. S. 2001, ApJ, 550, 212, doi: 10.1086/319728
- Bellhouse et al. (2017) Bellhouse, C., Jaffé, Y. L., Hau, G. K. T., et al. 2017, ApJ, 844, 49, doi: 10.3847/1538-4357/aa7875
- Bellhouse et al. (2019) Bellhouse, C., Jaffé, Y. L., McGee, S. L., et al. 2019, MNRAS, 485, 1157, doi: 10.1093/mnras/stz460
- Biviano et al. (2017) Biviano, A., Moretti, A., Paccagnella, A., et al. 2017, A&A, 607, A81, doi: 10.1051/0004-6361/201731289
- Boselli et al. (2021) Boselli, A., Fossati, M., & Sun, M. 2021, arXiv e-prints, arXiv:2109.13614. https://arxiv.org/abs/2109.13614
- Bravo-Alfaro et al. (2002) Bravo-Alfaro, H., van Gorkom, J. H., Cayatte, V., & Balkowski, C. 2002, in The Universe at Low Radio Frequencies, ed. A. Pramesh Rao, G. Swarup, & Gopal-Krishna, Vol. 199, 163
- Campitiello et al. (2021) Campitiello, M. G., Ignesti, A., Gitti, M., et al. 2021, ApJ, 911, 144, doi: 10.3847/1538-4357/abec82
- Cava et al. (2009) Cava, A., Bettoni, D., Poggianti, B. M., et al. 2009, A&A, 495, 707, doi: 10.1051/0004-6361:200810997
- Cayatte et al. (1994) Cayatte, V., Kotanyi, C., Balkowski, C., & van Gorkom, J. H. 1994, AJ, 107, 1003, doi: 10.1086/116913
- Cayatte et al. (1990) Cayatte, V., van Gorkom, J. H., Balkowski, C., & Kotanyi, C. 1990, AJ, 100, 604, doi: 10.1086/115545
- Chabrier (2003) Chabrier, G. 2003, PASP, 115, 763, doi: 10.1086/376392
- Chung et al. (2009) Chung, A., van Gorkom, J. H., Kenney, J. D. P., Crowl, H., & Vollmer, B. 2009, AJ, 138, 1741, doi: 10.1088/0004-6256/138/6/1741
- Chung et al. (2007) Chung, A., van Gorkom, J. H., Kenney, J. D. P., & Vollmer, B. 2007, ApJ, 659, L115, doi: 10.1086/518034
- Cortese et al. (2011) Cortese, L., Catinella, B., Boissier, S., Boselli, A., & Heinis, S. 2011, MNRAS, 415, 1797, doi: 10.1111/j.1365-2966.2011.18822.x
- Cortese et al. (2021) Cortese, L., Catinella, B., & Smith, R. 2021, arXiv e-prints, arXiv:2104.02193. https://arxiv.org/abs/2104.02193
- Deb et al. (2020) Deb, T., Verheijen, M. A. W., Gullieuszik, M., et al. 2020, MNRAS, 494, 5029, doi: 10.1093/mnras/staa968
- Dénes et al. (2014) Dénes, H., Kilborn, V. A., & Koribalski, B. S. 2014, MNRAS, 444, 667, doi: 10.1093/mnras/stu1337
- Dressler (1980) Dressler, A. 1980, ApJ, 236, 351, doi: 10.1086/157753
- Ebeling et al. (2014) Ebeling, H., Stephenson, L. N., & Edge, A. C. 2014, ApJ, 781, L40, doi: 10.1088/2041-8205/781/2/L40
- Fasano et al. (2006) Fasano, G., Marmo, C., Varela, J., et al. 2006, A&A, 445, 805, doi: 10.1051/0004-6361:20053816
- Fasano et al. (2012) Fasano, G., Vanzella, E., Dressler, A., et al. 2012, MNRAS, 420, 926, doi: 10.1111/j.1365-2966.2011.19798.x
- George et al. (2018) George, K., Poggianti, B. M., Gullieuszik, M., et al. 2018, MNRAS, 479, 4126, doi: 10.1093/mnras/sty1452
- George et al. (2019) George, K., Poggianti, B. M., Bellhouse, C., et al. 2019, MNRAS, 487, 3102, doi: 10.1093/mnras/stz1443
- Giovanelli & Haynes (1983) Giovanelli, R., & Haynes, M. P. 1983, AJ, 88, 881, doi: 10.1086/113376
- Giovanelli & Haynes (1985) —. 1985, ApJ, 292, 404, doi: 10.1086/163170
- Gogate et al. (2020) Gogate, A. R., Verheijen, M. A. W., Deshev, B. Z., et al. 2020, MNRAS, 496, 3531, doi: 10.1093/mnras/staa1680
- Gullieuszik et al. (2015) Gullieuszik, M., Poggianti, B., Fasano, G., et al. 2015, A&A, 581, A41, doi: 10.1051/0004-6361/201526061
- Gullieuszik et al. (2017) Gullieuszik, M., Poggianti, B. M., Moretti, A., et al. 2017, ApJ, 846, 27, doi: 10.3847/1538-4357/aa8322
- Gullieuszik et al. (2020) Gullieuszik, M., Poggianti, B. M., McGee, S. L., et al. 2020, ApJ, 899, 13, doi: 10.3847/1538-4357/aba3cb
- Gunn & Gott (1972) Gunn, J. E., & Gott, J. Richard, I. 1972, ApJ, 176, 1, doi: 10.1086/151605
- Healy et al. (2020) Healy, J., Blyth, S.-L., Verheijen, M. A. W., et al. 2020, arXiv e-prints, arXiv:2011.06285. https://arxiv.org/abs/2011.06285
- Hubble & Humason (1931) Hubble, E., & Humason, M. L. 1931, ApJ, 74, 43, doi: 10.1086/143323
- Jaffé et al. (2015) Jaffé, Y. L., Smith, R., Candlish, G. N., et al. 2015, MNRAS, 448, 1715, doi: 10.1093/mnras/stv100
- Jaffé et al. (2016) Jaffé, Y. L., Verheijen, M. A. W., Haines, C. P., et al. 2016, MNRAS, 461, 1202, doi: 10.1093/mnras/stw984
- Jaffé et al. (2018) Jaffé, Y. L., Poggianti, B. M., Moretti, A., et al. 2018, MNRAS, 476, 4753, doi: 10.1093/mnras/sty500
- Maddox et al. (2015) Maddox, N., Hess, K. M., Obreschkow, D., Jarvis, M. J., & Blyth, S. L. 2015, MNRAS, 447, 1610, doi: 10.1093/mnras/stu2532
- McMullin et al. (2007) McMullin, J. P., Waters, B., Schiebel, D., Young, W., & Golap, K. 2007, Astronomical Society of the Pacific Conference Series, Vol. 376, CASA Architecture and Applications, ed. R. A. Shaw, F. Hill, & D. J. Bell, 127
- Moretti et al. (2014) Moretti, A., Poggianti, B. M., Fasano, G., et al. 2014, A&A, 564, A138, doi: 10.1051/0004-6361/201323098
- Moretti et al. (2017) Moretti, A., Gullieuszik, M., Poggianti, B., et al. 2017, A&A, 599, A81, doi: 10.1051/0004-6361/201630030
- Moretti et al. (2020) Moretti, A., Paladino, R., Poggianti, B. M., et al. 2020, ApJ, 897, L30, doi: 10.3847/2041-8213/ab9f3b
- Müller et al. (2021) Müller, A., Poggianti, B. M., Pfrommer, C., et al. 2021, Nature Astronomy, 5, 159, doi: 10.1038/s41550-020-01234-7
- Oman et al. (2013) Oman, K. A., Hudson, M. J., & Behroozi, P. S. 2013, MNRAS, 431, 2307, doi: 10.1093/mnras/stt328
- Pasquali et al. (2019) Pasquali, A., Smith, R., Gallazzi, A., et al. 2019, MNRAS, 484, 1702, doi: 10.1093/mnras/sty3530
- Perley et al. (2011) Perley, R. A., Chandler, C. J., Butler, B. J., & Wrobel, J. M. 2011, ApJ, 739, L1, doi: 10.1088/2041-8205/739/1/L1
- Poggianti (1997) Poggianti, B. M. 1997, A&AS, 122, 399, doi: 10.1051/aas:1997142
- Poggianti et al. (2016a) Poggianti, B. M., Fasano, G., Omizzolo, A., et al. 2016a, AJ, 151, 78, doi: 10.3847/0004-6256/151/3/78
- Poggianti et al. (2016b) —. 2016b, AJ, 151, 78, doi: 10.3847/0004-6256/151/3/78
- Poggianti et al. (2017a) Poggianti, B. M., Moretti, A., Gullieuszik, M., et al. 2017a, ApJ, 844, 48, doi: 10.3847/1538-4357/aa78ed
- Poggianti et al. (2017b) Poggianti, B. M., Jaffé, Y. L., Moretti, A., et al. 2017b, Nature, 548, 304, doi: 10.1038/nature23462
- Poggianti et al. (2019) Poggianti, B. M., Gullieuszik, M., Tonnesen, S., et al. 2019, MNRAS, 482, 4466, doi: 10.1093/mnras/sty2999
- Radovich et al. (2019) Radovich, M., Poggianti, B., Jaffé, Y. L., et al. 2019, MNRAS, 486, 486, doi: 10.1093/mnras/stz809
- Ramatsoku et al. (2019) Ramatsoku, M., Serra, P., Poggianti, B. M., et al. 2019, MNRAS, 487, 4580, doi: 10.1093/mnras/stz1609
- Ramatsoku et al. (2020) —. 2020, A&A, 640, A22, doi: 10.1051/0004-6361/202037759
- Renzini & Peng (2015) Renzini, A., & Peng, Y.-j. 2015, ApJ, 801, L29, doi: 10.1088/2041-8205/801/2/L29
- Rhee et al. (2017) Rhee, J., Smith, R., Choi, H., et al. 2017, ApJ, 843, 128, doi: 10.3847/1538-4357/aa6d6c
- Roediger et al. (2014) Roediger, E., Bruggen, M., Owers, M. S., Ebeling, H., & Sun, M. 2014, MNRAS, 443, L114, doi: 10.1093/mnrasl/slu087
- Salpeter (1955) Salpeter, E. E. 1955, ApJ, 121, 161, doi: 10.1086/145971
- Sault et al. (1995) Sault, R. J., Teuben, P. J., & Wright, M. C. H. 1995, in Astronomical Society of the Pacific Conference Series, Vol. 77, Astronomical Data Analysis Software and Systems IV, ed. R. A. Shaw, H. E. Payne, & J. J. E. Hayes, 433. https://arxiv.org/abs/astro-ph/0612759
- Solanes et al. (2001) Solanes, J. M., Manrique, A., García-Gómez, C., et al. 2001, ApJ, 548, 97, doi: 10.1086/318672
- Tonnesen & Bryan (2012) Tonnesen, S., & Bryan, G. L. 2012, MNRAS, 422, 1609, doi: 10.1111/j.1365-2966.2012.20737.x
- van Gorkom (2004) van Gorkom, J. H. 2004, in Clusters of Galaxies: Probes of Cosmological Structure and Galaxy Evolution, ed. J. S. Mulchaey, A. Dressler, & A. Oemler, 305. https://arxiv.org/abs/astro-ph/0308209
- Varela et al. (2009) Varela, J., D’Onofrio, M., Marmo, C., et al. 2009, A&A, 497, 667, doi: 10.1051/0004-6361/200809876
- Vollmer et al. (2001) Vollmer, B., Cayatte, V., Balkowski, C., & Duschl, W. J. 2001, ApJ, 561, 708, doi: 10.1086/323368
- Vulcani et al. (2011) Vulcani, B., Poggianti, B. M., Aragón-Salamanca, A., et al. 2011, MNRAS, 412, 246, doi: 10.1111/j.1365-2966.2010.17904.x
- Vulcani et al. (2018a) Vulcani, B., Poggianti, B. M., Jaffé, Y. L., et al. 2018a, MNRAS, 480, 3152, doi: 10.1093/mnras/sty2095
- Vulcani et al. (2018b) Vulcani, B., Poggianti, B. M., Gullieuszik, M., et al. 2018b, ApJ, 866, L25, doi: 10.3847/2041-8213/aae68b
- Vulcani et al. (2020) Vulcani, B., Poggianti, B. M., Tonnesen, S., et al. 2020, ApJ, 899, 98, doi: 10.3847/1538-4357/aba4ae
- Vulcani et al. (2021) Vulcani, B., Poggianti, B. M., Moretti, A., et al. 2021, arXiv e-prints, arXiv:2104.02089. https://arxiv.org/abs/2104.02089
- Yagi et al. (2017) Yagi, M., Yoshida, M., Gavazzi, G., et al. 2017, ApJ, 839, 65, doi: 10.3847/1538-4357/aa68e3
- Yagi et al. (2010) Yagi, M., Yoshida, M., Komiyama, Y., et al. 2010, AJ, 140, 1814, doi: 10.1088/0004-6256/140/6/1814
- Yoon et al. (2017) Yoon, H., Chung, A., Smith, R., & Jaffé, Y. L. 2017, ApJ, 838, 81, doi: 10.3847/1538-4357/aa6579
- Yun & Carilli (2002) Yun, M. S., & Carilli, C. L. 2002, ApJ, 568, 88, doi: 10.1086/338924