Red Variable Stars in Three M81 Group Dwarf Galaxies
Abstract
Archival [3.6] and [4.5] images are used to identify and characterize variable stars in the Magellanic-type galaxies Holmberg II, NGC 2366, and IC 2574. Using parametric and non-parametric detection methods, 74 confirmed or suspected long period variables (LPVs) are found. The period distributions of the LPVs in NGC 2366 and IC 2574 are similar. While the period distribution of LPVs in Ho II is uncertain due to small number statistics there appears to be a deficiency of LPVs with periods between 550 and 650 days when compared with NGC 2366 and IC 2574. The LPVs are diffusely distributed on the sky, and do not follow the underlying light from unresolved stars, as expected if episodes of star formation within the past few hundred Myr have occured throughout the galaxies, including their outer regions. Distances computed for Ho II and NGC 2366 from the period-luminosity relations (PLRs) agree to within magnitudes with those based on the tip of the red giant branch (RGB). Efforts to estimate an LPV-based distance modulus for IC 2574 are complicated by the presence of first overtone pulsators among LPVs with periods days, although the PLR at the long period end is consistent with the distance estimated from the RGB-tip. In addition to the LPVs, 10 candidate sgB[e] or luminous blue variables and 2 candidate red supergiant variables are also identified. Nine candidate sgB[e] stars that do not show evidence of variability are also identified based on their locations in the color-magnitude diagram.
1 INTRODUCTION
The intrinsic high luminosity of long period variables (LPVs) means that they can be observed at cosmologically interesting distances, even with telescopes of moderate aperture. As LPVs are among the coolest and most luminous stars in a galaxy, the contrast with the underlying main body of stars is enhanced in the infrared (IR), making it a natural wavelength regime for their study. However, there are additional motivations for observing LPVs in the IR. Light in the IR is less prone to the molecular line blanketing that depresses the brightnesses of cool stars at shorter wavelengths (e.g. Bica et al. 1991), further facilitating the detection of LPVs in environments where crowding may otherwise complicate efforts to resolve them. LPVs are also standard candles in the IR (e.g Glass & Lloyd Evans 1981), and their intrinsic IR period luminosity relation (PLR) is not sensitive to galaxy metallicity (Goldman et al. 2019). Unlike many other variable stars, the light curves of LPVs have large amplitudes in the IR (e.g. Le Bertre 1993; Glass et al. 2001), simplifying their detection. An added bonus is that surveys for LPVs in the IR have the potential also to identify highly evolved, massive variable stars that are embedded in circumstellar envelopes. The study of such stars is of obvious interest for examining the end points of stellar evolution at high masses.
In the current paper, archival images taken with the Spitzer telescope (Werner et al. 2004) are used to search for cool variables in the M81 group Magellanic galaxies Holmberg II (Ho II), NGC 2366, and IC 2574. These galaxies have similar morphologies, integrated brightnesses, and distances. Cignoni et al. (2019) find that dwarf irregular galaxies such as these tend to have had more or less constant SFRs during the past 100 Myr, with departures that are no more than that from historic means, and so it is then expected that galaxies of this type will harbor intrinsically luminous LPVs and massive stars. Basic observational properties of these galaxies are summarized in Table 1. To the extent that MB tracks mass then the stellar masses of these galaxies agree to within a factor of .
| Name | TypeaaFrom de Vaucouleurs et al. (1991) RC3 | BTaaFrom de Vaucouleurs et al. (1991) RC3bbTotal B brightness. | logD25aaFrom de Vaucouleurs et al. (1991) RC3ccIsophotal diameter at 25 mag/arcsec2 surface brightness in B. | SBD25aaFrom de Vaucouleurs et al. (1991) RC3ddMean B surface brightness within the D25 isophote. | DM0eeA |
|---|---|---|---|---|---|
| (mag) | (log arcmin) | (mag arcsec-2) | (mag) | ||
| Holmberg II | Im | 11.1 | 1.9 | 15.2 | |
| NGC 2366 | IB(s)m | 11.5 | 1.9 | 14.8 | |
| IC 2574 | SAB(s)m | 10.8 | 2.1 | 15.3 |
bsolute distance modulus from Karachentsev et al. (2002), as estimated from the RGB-tip and assuming M for the intrinsic magnitude of the RGB-tip (Da Costa & Armandroff 1990). The uncertainties in these entries are those in the RGB-tip brightness measurements, and do not include uncertainties in the reddening and calibration of the RGB-tip brightness.
The absolute integrated brightness of Ho II is similar to that of the SMC, and HII regions in Ho II have oxygen abundances that are similar to those in other dwarf irregular galaxies (Richer & McCall 1995). Gas accounts for 50% of the total galaxy mass (Puche et al. 1992), and so it is not surprising that there is a large population of young blue stars that are indicative of very recent large-scale star formation (Hoessel & Danielson 1984). Older stars in Ho II are more centrally concentrated than younger stars (Bernard et al. 2012), and this is consistent with the tendency for dwarf irregular galaxies to have recent star forming activity that is more diffusely distributed than at earlier epochs (e.g. Cignoni et al. 2019).
As in Ho II, there is clear evidence of recent active star formation in NGC 2366, and a prominent signature of this is the supergiant HII region NGC 2363. NGC 2363 is in many respects similar to 30 Dor (Kennicutt 1984), and harbors a large population of young massive objects, including luminous blue variables (LBVs) and Wolf-Rayet stars (e.g. Drissen et al. 2000). Other recent and on-going star formation sites are seen throughout the galaxy (e.g. Aparacio et al. 1995). McQuinn et al. (2010) find evidence for a lull in the SFR 2 – 3 Gyr ago, although the SFR has increased markedly in the past 1 – 2 Gyr. Thuan & Izotov (2005) identify a population of very bright AGB stars, indicating elevated levels of star formation during the past few hundred Myr. Searches for red variables in NGC 2366 might then find a number of very luminous LPVs. The O abundances of HII regions in NGC 2366 are SMC-like (Talent 1980).
Based on the BT and distance modulus entries in Table 1, IC 2574 is the most massive of the galaxies. The O abundance deduced from the spectra of HII regions is consistent with its MB (Miller & Hodge 1996). Mondal et al. (2019) find evidence of on-going star formation throughout the galaxy. Pasquali et al. (2008) examine the photometric properties of IC 2574, and find that there is a dominant 100 Myr population within the central 4 kpc, with a 10 Myr population at galactocentric radii between 4 and 8 kpc. The diffuse nature of recent star formation in IC 2574 is thus qualitatively consistent with the spatial distribution of young and old stars in Ho II and other dwarf irregular galaxies. Dalcanton et al. (2012) examine the SFH of IC 2574, and find that the SFR has increased during the past 20 Myr.
All three galaxies show evidence of an active interstellar medium (ISM). The ISM of Ho II is riddled with cavities that are in excess of a kpc across (Puche et al. 1992). Weisz et al. (2009) argue that these may not be the result of single concentrated large-scale star formation events, while Egorov et al. (2016) suggest that they are large-scale coherent star-forming complexes. Cavities similar to those in Ho II are found in the ISM of IC 2574, and star formation is occuring along the edges of these structures (Walter & Brinks 1999). The largest cavity in IC 2574 is a supergiant shell that has massive star-forming regions along its rim that may account for much of the present day star formation in that galaxy (Walter et al. 1998; Cannon et al. 2005). While holes in the ISM are usually attributed to sources internal to a galaxy, interactions with high velocity clouds are another possible cause (e.g. Mirabel & Morras 1990).
Weisz et al. (2008) investigate the SFHs of all three galaxies by applying the same procedure to each system, thereby providing a basis for direct comparison. They find that all three galaxies experienced a dip in their mean SFRs during intermediate epochs, and that there has been an uptick in the SFRs during the past Gyr. The SFRs estimated by Weisz et al. (2008) averaged over the past 20 Myr are 0.08 M⊙/year (Ho II), 0.07 M⊙/year (NGC 2366), and 0.11 M⊙/year (IC 2574).
HII regions also provide a means of directly comparing the recent SFHs of these galaxies. Miller & Hodge (1994) conduct a census of HII regions in all three galaxies, and estimate recent SFRs of 0.05 M⊙/year for Ho II, 0.10 M⊙/year for NGC 2366, and 0.08 M⊙/year for IC 2574. The SFR diagnostics applied by Weisz et al. (2008) and Miller & Hodge (1994) sample slightly different time scales, as HII regions are ionized by stars with ages Myr, while the Weisz et al. (2008) SFRs are averages over the past 20 Myr. Thus, there might be some disagreement between the two estimates.
There have been previous searches for variable stars in Ho II and NGC 2366, and these have identified a number of objects. Hoessel et al. (1998) conclude that Ho II is ’extremely rich in variable stars’. They identify 28 pulsating variables, of which seven have colors that are consistent with those of Cepheids. Tolstoy et al. (1995) identify 13 variable stars in NGC 2366. Six are classified as Cepheids and four are probable eclipsing binaries. The remaining three were not classified.
The paper is structured as follows. Information about the images used in this study and the processing that was performed on them following the application of corrections for instrumental and optical artifacts are discussed in Section 2. The procedures used to extract stellar brightnesses are the subject of Section 3. Section 4 deals with the identification and characterization of the variables, while an examination of their spatial distribution with respect to the underlying body of stars follows in Section 5. The PLRs of the LPVs are examined in Section 6, and these provide insights into the distances of the host galaxies and the pulsational properties of the stars. Conclusions and a discussion of the results can be found in Section 7.
2 ARCHIVAL DATA
This study uses images recorded for the SPIRITS survey (Kasliwal et al. 2017), the goal of which is to identify photometric transients in Spitzer IRAC (Fazio et al. 2004) images of nearby galaxies. Survey galaxies were typically observed for 10 epochs over a year time span, although additional exposures with longer time baselines were recorded for some galaxies. Images for each epoch have a total exposure time of 93.6 sec, and these are the deepest IRAC observations of the galaxies considered in the present study.
Processed [3.6] and [4.5] images of the galaxies were downloaded from the IPAC Spitzer Heritage Archive 111https://sha.ipac.caltech.edu/applications/Spitzer/SHA/. Two sets of images are available for Ho II: one is centered on the main body of the galaxy, while the other is centered on Ho II X-1 (Zezas et al. 1999), which is located to one side of the galaxy. Only the images in the first group are considered here. The AORs of the images used in this study are listed in Table 2.
| Ho II | NGC 2366 | IC 2574 |
|---|---|---|
| 50639104 | 50508800 | 50580992 |
| 50639872 | 50509056 | 50581504 |
| 50640384 | 50509312 | 50582016 |
| 52733184 | 52721600 | 52720640 |
| 52733440 | 52729856 | 52720896 |
| 52733696 | 52730112 | 52721152 |
| 52733952 | 52730368 | 52721408 |
| 52734208 | 52730624 | 52721664 |
| 52734464 | 52730880 | 52721920 |
| 52734720 | 52731136 | 52722176 |
The observations of each galaxy were recorded with a range of satellite position angles. The downloaded images for each galaxy were rotated to a common orientation, aligned, and then trimmed to the area of common sky coverage. While the last step curtails the areal coverage, it ensures that a complete set of epochs is available for each star, thereby producing a homogeneous dataset for period determination and characterization. A background light level was then measured and subtracted from each aligned image. These background-subtracted images for each galaxyfilter combination form the final datasets that are examined for stellar variability.
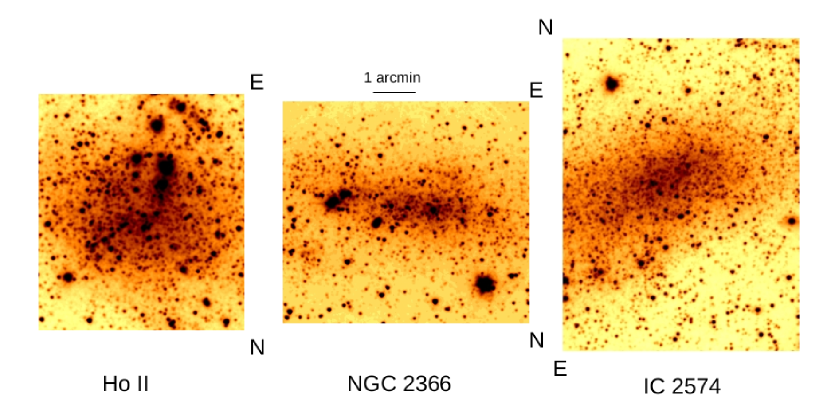
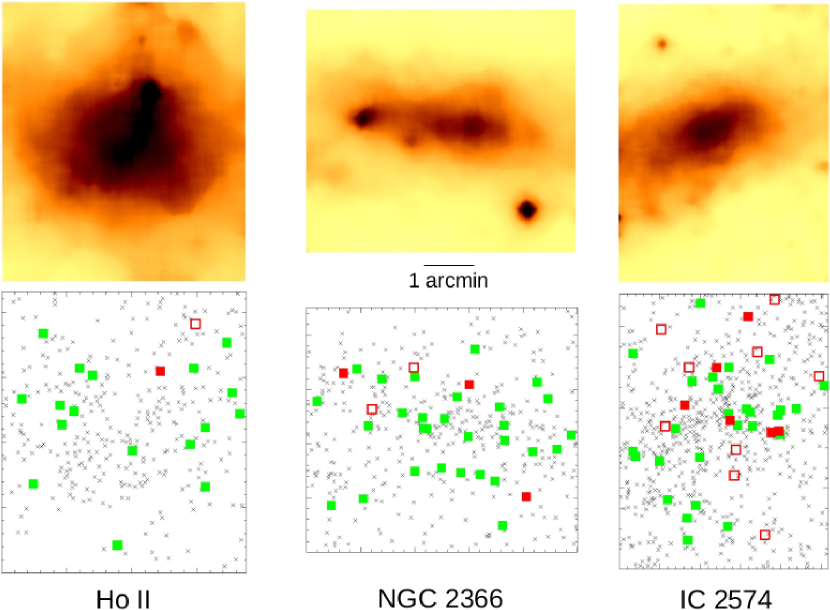
Reference [3.6] and [4.5] images for each galaxy were constructed by finding the median light level at each shifted pixel location in the background-subtracted images. The brightnesses of variable stars in these median images provide ’typical’ values over the observing timespan, and so are a reference for assessing variability and obtaining representative magnitudes and colors for gauging the evolutionary state of each star. The median [3.6] image of each galaxy is shown in Figure 1.
3 PHOTOMETRIC MEASUREMENTS
Angular resolution elements in the [3.6] and [4.5] images of these galaxies subtend a projected area of pc2, and so source blending is a concern when measuring stellar brightnesses. These concerns are mitigated to some degree by the intrinsic IR brightnesses of LPVs, which are such that they stand out from the surrounding background of unresolved stars. The effect of this background on the detection of variables can be suppressed by differencing images taken with the same exposure time in the same filter with the same angular resolution. This is not a new concept: Tomaney & Crotts (1996) discuss the detection of variable stars in crowded M31 fields, and demonstrate that reliable light variations can be detected differentially after suitable adjustments are made for variations in the point spread function (PSF) between exposures and within the science field. Contrast arguments aside, there are also areas in crowded environments where stochastic effects may produce angular resolution elements where the stellar density is comparatively low, with the result that the light in a given resolution element may originate predominantly from a single source, even in areas with extremely high projected mass densities (Davidge et al. 2010).
Kasliwal et al. (2017) point out that the PSF is poorly sampled in raw IRAC images, and this could result in false detections. In recognition of this, photometry for the SPIRITS database was conducted by making aperture measurements on differenced images. While the prognosis for obtaining reliable changes in light levels from aperture measurements is promising, there is a tendency for at least some of the variables to be located in locally dense environments. This complicates attempts to obtain the reliable absolute photometric measurements that are required to place these objects on CMDs. In any event, photometry of non-variable sources in a galaxy is required to understand the stellar content of the host system and detect objects of special interest, such as the very massive stars that are also a target of this study. Finally, if a star in close proximity to a variable is itself variable then this may compromise the photometry of both objects made from differenced images.
PSF sampling issues aside, Davidge (2014) shows that the application of PSF-fitting to IRAC images of crowded fields results in photometric measurements that are deeper and have smaller uncertainties than those obtained from aperture measurements. Given the crowded nature of some parts of the galaxy images, the photometric measurements used here were made with the PSF-fitting program ALLSTAR (Stetson 1994). Source catalogues, preliminary magnitudes, and PSFs were constructed from the median [3.6] and [4.5] images using routines in DAOPHOT (Stetson 1987). The PSFs were constructed from bright, unsaturated, isolated stars, and stellar brightnesses were found by fitting the PSFs to the area within the FWHM (full width at half maximum) in stellar light profiles. The source catalogues obtained from the [3.6] images were adopted to perform photometry on the [4.5] images. The source catalogues, initial magnitudes, and PSFs constructed from the median images were then used to perform photometry on the exposures recorded at different epochs.
The unresolved body of stars in these galaxies forms a non-uniform background that complicates efforts to determine reliable local background light levels. This is of greatest concern for objects that are near the photometric faint limit, where background light is a significant fraction of the observed light within the PSF. Faint stars are thus most susceptible to uncertainties in the local background. The presence of this background is not an issue for photometry made from differenced images.
A template of the unresolved galaxy background was constructed and removed from the images to account for non-uniform local light levels. Preliminary magnitudes were first measured from images with the background light in place. All photometered stars were then subtracted from the images, and the results were smoothed with a arcsec median filter to suppress residuals from the subtraction process. The smoothing kernel size was selected as a compromise between the need to suppress subtraction artifacts while still retaining angular resolution in the template. The resulting smoothed images track the unresolved background light, and were subtracted from the initial images. A final set of magnitudes was then obtained from the background-subtracted images. The removal of the background light improved the photometry in two ways. First, the number of stars that were retained by ALLSTAR was increased by . Second, the dispersion in measurements near the faint end of the CMDs was also reduced.
Examples of the photometry obtained using the procedures described above as well as the suppression of systematic effects when measuring light variations are shown in Figure 2. The left hand panel of Figure 2 shows the CMD of NGC 2366. The [3.6]–[4.5] color broadens when [3.6], marking the onset of large numbers of evolved stars in NGC 2366 that have hot circumstellar dust envelopes. In Section 4.1 it is shown that this is also the approximate magnitude where the number of sources detected in the median NGC 2366 image exceeds that expected from foreground and background sources; still some objects with [3.6] may belong to NGC 2366.
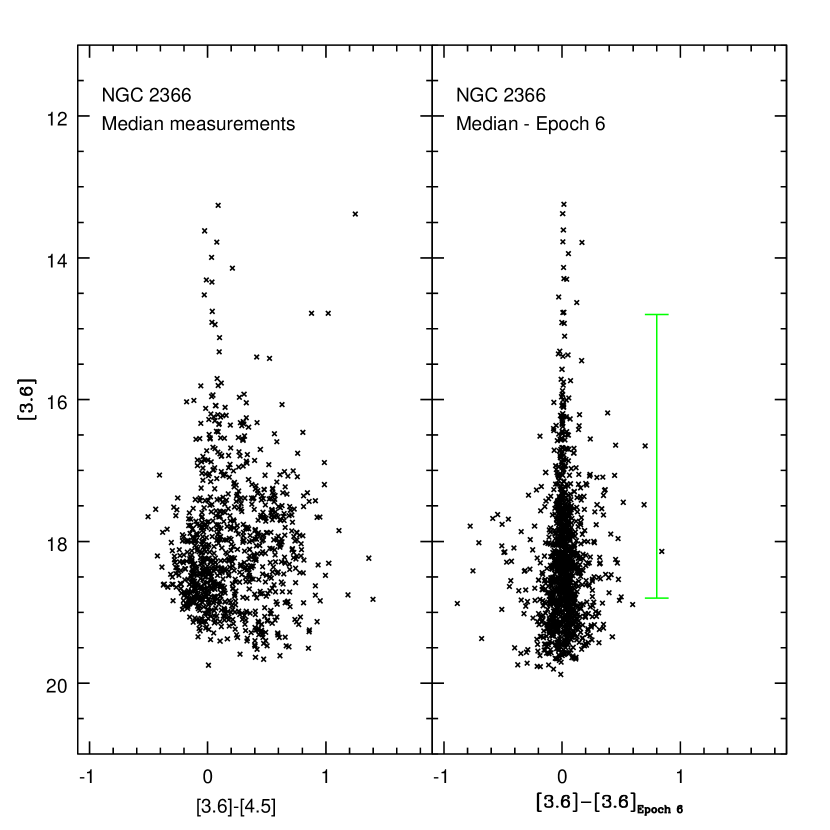
The suppression of systematic effects is demonstrated in the right hand panel of Figure 2, which shows the difference in [3.6] magnitudes between measurements made from the AOR 52730112 (hereafter ’Epoch 6’) image and median-combined images for each star. In contrast to the CMD in the left hand panel, the differences between the measurements made from the Epoch 6 and median-combined datasets form a narrow sequence that widens progressively towards fainter magnitudes, with a width that amounts to only a few hundredths of a magnitude over a wide range of [3.6] magnitudes, even near the faint limit. The compact width of this sequence is noteworthy given the range of stellar densities in the NGC 2366 image (Figure 1). The spray of points that cluster about the dominant plume in the right hand panel of Figure 2 are potential variable stars. The tight sequence in the right hand panel of Figure 2 demonstrates the feasibility of identifying modest changes in light levels, even near the faint limit of the data. Similar results are obtained when measurements from other epochs are examined.
The photometric measurements obtained here are deeper and have a lower random uncertainty than those previously published. For example, Williams & Bonanos (2016) present IRAC photometry of 505 sources in NGC 2366 over a 28.8 arcmin2 area. The CMD of NGC 2366 obtained from the Williams & Bonanos (2016) photometry is compared with the CMD obtained from our measurements in Figure 3. While the two CMDs have similarities when [4.5] , at fainter magnitudes they are very different, in the sense that the CMD constructed from the measurements made here is better defined and contains many more stars. In particular, we recover in excess of 6500 sources in NGC 2366 over an area of 22.6 arcmin2.

4 DETECTION AND CHARACTERIZATION OF VARIABLEs
4.1 Identification
The search for variable stars in the current study was conducted within a [3.6] magnitude interval that covers the brightest stars in each galaxy, as well as stars at fainter magnitudes where it was thought that complete light curves could be obtained without interference from the photometric faint limit. Variability is assessed by comparing differenced photometric measurements obtained from PSF-fitting (see previous section). The use of a single source catalogue to measure stellar brightnesses in each set of images, coupled with the inherent optical stability of a space-based telescope, greatly helps to suppress systematic effects that might otherwise crop up due to crowding when measuring image-to-image changes in photometric measurements.
Two different techniques are used to identify variables. Davidge (2021) surveyed the southern disk of NGC 247 at visible wavelengths to search for variable stars, and the procedures discussed in that paper are applied here. The primary criterion to identify variables employed by Davidge (2021) is the standard deviation () in differenced magnitude measurements. A star is deemed to be variable if the standard deviation in the measurements made at different epochs differs from that defined by non-variables with the same magnitude in the median image at the or higher level. While strict, the criterion ensures that fluctuations due to noise are not flagged as variables. The dispersion for non-variables was estimated from the [3.6]EpochX–[3.6]median measurements, where [3.6]EpochX is the brightness measured at epoch ’X’, and [3.6]median is the brightness in the median image. An iterative rejection filter was applied to remove the contribution made by variable stars when computing the non-variable dispersions.
Another requirement was recovery in all ten images recorded for each galaxy. This ensured light curves that are as complete as possible, which is beneficial for estimating periods in a consistent manner and classifying the nature of the variability given the spotty phase coverage. Eruptive variables with episodes that last only a few days and that have quiescent states below the photometric faint limit are then not flagged as variables, as they are not detected in the full suite of images.
Sokolovsky et al. (2017) discuss and evaluate various techniques that can be applied to detect photometric variability. A robust technique identified in their study uses the median absolute deviation (MAD) of photometric measurements, and a detection scheme that uses this statistic is the second detection technique that is applied to the IRAC images. As the MAD is a non-parametric statistic, it is robust to outliers, and so defines a detection criterion that is sensitive to variables with cyclical light curves or that show frequent non-periodic excursions. It is distinct from the criterion described previously, which relies on a normal distribution of data points and is susceptible to outliers.
When applying the MAD detection technique to the [3.6] images of the three galaxies, a threshold that is the MAD measured for non-variable objects was applied for consistency with the detection threshold. With this threshold, the MAD technique recovers numbers of variables in all three galaxies that are comparable to those found with the technique, suggesting that the and MAD thresholds are consistent. As with the technique, a variable star had to be recovered in all ten images of a galaxy.
The and MAD-based techniques detect many variables in common. However, 15 variables were found with the MAD criterion that were not found with the criterion. The variables found with MAD are unremarkable when compared with the variables found with the criterion. All are LPVs with well-defined light curves that have periods and amplitudes that are consistent with those found using the criterion. The variable star sample discussed in the remainder of the paper is the union of the objects identified with the and MAD-based techniques.
An examination of the variables that are not common to both techniques reveal that these objects tend to be borderline detections. One reason for this is that the magnitude measured from the median image, which is adopted as the reference magnitude for the detection scheme, is not the same as the median magnitude from the various epochs that is used for the reference magnitude by the MAD technique. While these two reference magnitudes typically differ by only a few percent, some variables fall slightly above the faint limit of the search with one technique but not the other. Similarly, while the standard deviation and MAD tend to be consistent (the is expected to be the MAD for a normal distribution) there are subtle differences, causing some stars to fall slightly above the 5 deviation detection threshold for one technique but not the other. The differences between the samples of variables detected by the two techniques are thus attributed to subtle differences in the adopted thresholds and reference magnitudes, and not to systematic differences in the characteristics of the light curves.
4.2 Light Curves, and Periods
Light curves of the variables detected in the IRAC images are shown in Figures 4, 5, and 6. Ho II and NGC 2366 have been surveyed previously for variables stars (Tolstoy et al. 1995; Hoessel et al. 1998), and a number of objects were identified in both galaxies. To avoid confusion with the naming schemes assigned in those surveys, the variables found here have been assigned a ’DV’ (Davidge Variable) number.
The majority of the light curves exhibit the rhythmic, large amplitude light variations that are characteristic of LPVs. Among those objects that are likely LPVs there is a tendency for the brighter variables to have longer periods (i.e. a smaller number of cycles sampled by these data), as expected given that there is a PLR for LPVs that are pulsating in the fundamental mode. There are also some variables, such as DV28 and DV33 in IC 2574 that are likely not LPVs, and spectroscopic follow-up may find that some of these are highly evolved massive stars.

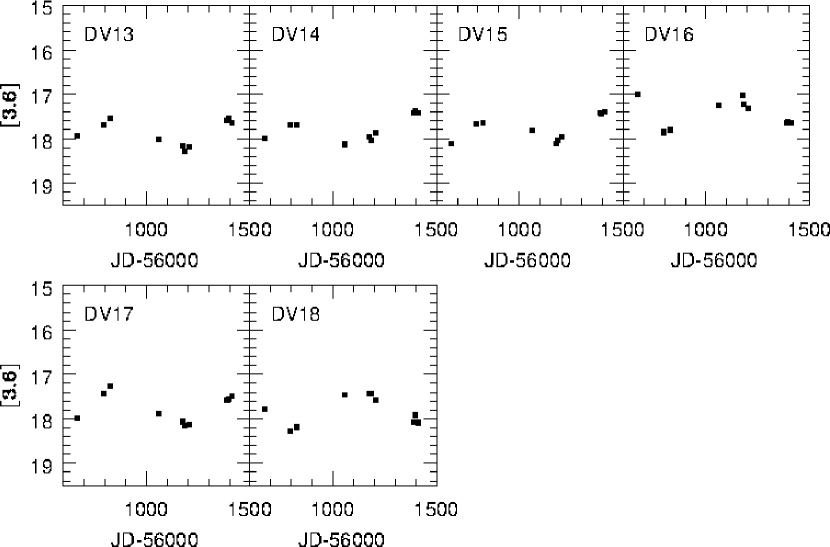


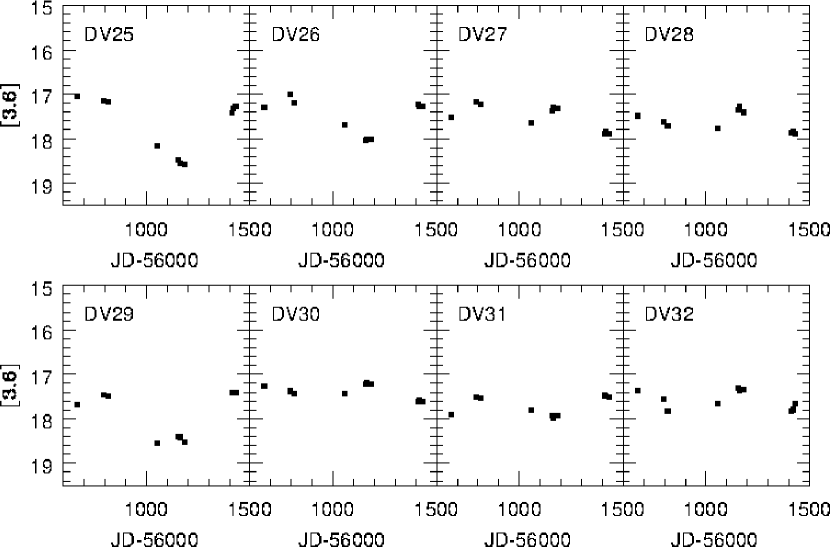


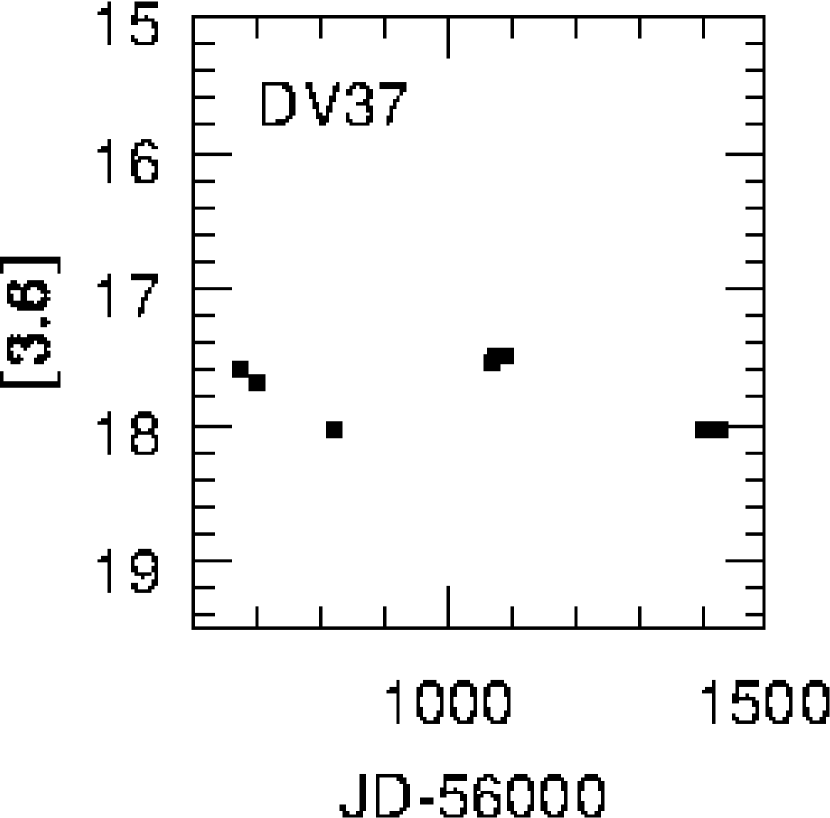
On-sky co-ordinates, preliminary periods, characteristic magnitudes, colors, and amplitude measurements are listed in Tables 3, 4, and 5. The photometric measurements are from the median images, while the photometric errors given in the table footnotes are those in the photometric calibration. These are based on comparisons with the brightnesses and colors of point sources in the NASA/IPAC Infrared Science Archive. The amplitude estimates are the difference between the brightest and faintest points in each light curve, and so are lower limits to the intrinsic photometric amplitude as there are gaps in the light curves. However, Goldman et al. (2019) examine the relation between the light curve amplitude of LPVs and [3.6]–[4.5] color. When binned according to amplitude, there is a general tendency for the mean [3.6]-[4.5] colors in these tables to increase with amplitude and follow the general relationship found by Goldman et al. (2019). This suggests that the amplitude measurements are reliable proxies of the true intrinsic amplitudes. The classification listed in the last column is based on the shape of the light curve and location on the CMD; these are discussed at greater length in the next section. A question mark indicates that the classification is preliminary only. The right ascensions and declinations listed in these tables use the World Co-ordinate System information in the image headers.
| DV# | RA | Dec | Period | [3.6]aaMeasured from median images. The estimated uncertainties are magnitude for [3.6], and magnitude for [3.6]–[4.5]. | [3.6]–[4.5]aaMeasured from median images. The estimated uncertainties are magnitude for [3.6], and magnitude for [3.6]–[4.5]. | AmplitudebbDifference between the brightest and faintest points. | Type |
|---|---|---|---|---|---|---|---|
| (J2000) | (J2000) | (days) | (mag) | (mag) | (mag) | ||
| 1 | 08:19:02.9 | 70:44:51 | – | 17.11 | 0.57 | 1.1 | LPV? |
| 2 | 08:18:47.0 | 70:42:33 | 800ccComplete cycle not observed. | 17.52 | 1.06 | 1.6 | LPV |
| 3 | 08:19:03.2 | 70:43:25 | 900ccComplete cycle not observed. | 16.60 | 0.39 | 0.8 | LPV |
| 4 | 08:19:15.0 | 70:44:05 | – | 16.83 | 0.33 | 1.0 | LPV |
| 5 | 08:18:58.9 | 70:42:20 | – | 16.60 | 0.34 | 0.8 | LPV |
| 6 | 08:19:02.1 | 70:42:20 | 500 | 17.83 | 0.78 | 1.1 | LPV |
| 7 | 08:19:01.5 | 70:42:07 | – | 16.78 | 0.28 | 0.6 | LPV |
| 8 | 08:18:58.0 | 70:41:36 | 700 | 16.94 | 0.51 | 0.5 | LPV |
| 9 | 08:19:09.6 | 70:42:13 | – | 16.98 | 0.75 | 1.2 | LPV? |
| 10 | 08:19:18.0 | 70:43:00 | 800ccComplete cycle not observed. | 17.04 | 0.23 | 0.8 | RSG? |
| 11 | 08:19:09.2 | 70:42:00 | 450 | 18.17 | 0.92 | 1.2 | LPV |
| 12 | 08:19:22.4 | 70:43:22 | 700 | 17.33 | 0.86 | 1.1 | LPV |
| 13 | 08:19:10.0 | 70:41:14 | 550 | 17.80 | 0.66 | 0.8 | LPV |
| 14 | 08:18:47.7 | 70:44:08 | 500 | 17.74 | 0.24 | 0.8 | LPV |
| 15 | 08:19:10.9 | 70:44:03 | 550 | 17.72 | 0.54 | 0.9 | LPV |
| 16 | 08:19:29.9 | 70:43:32 | 450 | 17.46 | 0.20 | 0.9 | LPV |
| 17 | 08:19:23.1 | 70:44:04 | 500 | 17.65 | 0.58 | 0.9 | LPV |
| 18 | 08:19:21.1 | 70:44:22 | 650 | 17.72 | 0.66 | 0.7 | LPV |
| DV# | RA | Dec | Period | [3.6]aaMeasured from median images. The estimated uncertainties are magnitude for [3.6] and mag for [3.6]–[4.5]. | [3.6]–[4.5]aaMeasured from median images. The estimated uncertainties are magnitude for [3.6] and mag for [3.6]–[4.5]. | AmplitudebbDifference between the brightest and faintest points. | Type |
|---|---|---|---|---|---|---|---|
| (J2000) | (J2000) | (days) | (mag) | (mag) | (mag) | ||
| 1 | 07:28:42.9 | 69:14:38 | 550 | 17.44 | 0.86 | 1.0 | LPV |
| 2 | 07:28:24.8 | 69:11:53 | 750 | 17.24 | 0.22 | 0.8 | LPV |
| 3 | 07:28:29.8 | 69:12:16 | 900ccComplete cycle not observed. | 16.89 | 0.99 | 0.7 | LPV |
| 4 | 07:28:50.7 | 69:14:39 | – | 17.51 | 0.60 | 0.8 | LBV? |
| 5 | 07:28:49.4 | 69:14:01 | 400 | 17.71 | 0.43 | 0.7 | LPV |
| 6 | 07:28:48.5 | 69:13:44 | 550 | 17.56 | 0.54 | 0.8 | LPV |
| 7 | 07:28:46.6 | 69:13:25 | 700 | 17.01 | 0.72 | 0.9 | LPV |
| 8 | 07:28:44.8 | 69:13:05 | 500 | 17.50 | 0.63 | 1.0 | LPV? EB? |
| 9 | 07:29:02.5 | 69:14:35 | 550 | 17.36 | 0.81 | 1.0 | LPV |
| 10 | 07:28:57.4 | 69:13:42 | 850ccComplete cycle not observed. | 16.58 | 0.30 | 0.6 | LPV |
| 11 | 07:28:48.7 | 69:12:34 | 600 | 17.40 | 0.54 | 0.8 | LPV |
| 12 | 07:28:49.2 | 69:12:22 | 600 | 17.60 | 0.54 | 0.7 | LPV? |
| 13 | 07:28:42.6 | 69:11:32 | 850ccComplete cycle not observed. | 16.33 | 0.28 | 0.4 | LPV |
| 14 | 07:28:59.8 | 69:13:32 | 550 | 17.64 | 0.69 | 0.7 | LPV |
| 15 | 07:28:50.9 | 69:12:15 | 750 | 17.08 | 0.01 | 0.8 | LPV |
| 16 | 07:28:49.1 | 69:11:54 | 850ccComplete cycle not observed. | 16.78 | 0.34 | 0.9 | LPV |
| 17 | 07:29:02.3 | 69:13:16 | 500 | 17.67 | 0.48 | 0.8 | LPV |
| 18 | 07:28:40.3 | 69:10:31 | 650 | 16.37 | 0.29 | 0.4 | LPV? |
| 19 | 07:29:09.7 | 69:13:53 | 600 | 17.26 | 0.55 | 1.0 | LPV |
| 20 | 07:28:58.9 | 69:12:31 | 700 | 17.09 | 0.76 | 0.8 | LPV |
| 21 | 07:29:02.2 | 69:12:34 | 1300ccComplete cycle not observed. | 17.29 | 0.43 | 1.2 | LBV? |
| 22 | 07:29:11.2 | 69:13:32 | 400 | 17.34 | 0.67 | 0.9 | LPV |
| 23 | 07:28:52.1 | 69:11:13 | 650 | 17.53 | 0.23 | 0.8 | LPV |
| 24 | 07:28:56.6 | 69:11:41 | 450 | 17.74 | 0.72 | 0.8 | LPV |
| 25 | 07:28:48.2 | 69:10:35 | – | 17.43 | 0.91 | 1.5 | LBV? |
| 26 | 07:28:50.6 | 69:10:44 | 750 | 17.32 | 0.85 | 1.0 | LPV |
| 27 | 07:29:08.7 | 69:12:15 | 400 | 17.41 | 0.52 | 0.7 | LPV |
| 28 | 07:28:41.0 | 69:12:44 | 550 | 17.59 | 0.54 | 0.5 | LPV |
| 29 | 07:28:49.5 | 69:12:25 | 650 | 17.61 | 0.89 | 0.5 | LPV |
| 30 | 07:28:53.4 | 69:12:35 | 500 | 17.33 | 0.35 | 0.9 | LPV |
| 31 | 07:28:59.0 | 69:14:15 | 500 | 17.65 | 0.61 | 1.1 | LPV |
| 32 | 07:29:06.7 | 69:14:37 | 450 | 17.47 | 0.58 | 0.9 | LPV |
| DV# | RA | Dec | Period | [3.6]aaMeasured from median images. The estimated uncertainties are magnitude for [3.6] and mag for [3.6]–[4.5]. | [3.6]–[4.5]aaMeasured from median images. The estimated uncertainties are magnitude for [3.6] and mag for [3.6]–[4.5]. | AmplitudebbDifference between the brightest and faintest points. | Type |
|---|---|---|---|---|---|---|---|
| (J2000) | (J2000) | (days) | (mag) | (mag) | (mag) | ||
| 1 | 10:28:57.0 | 68:24:13 | 650 | 17.00 | 0.45 | 0.4 | LPV |
| 2 | 10:28:49.1 | 68:23:27 | 500 | 17.77 | 0.72 | 0.5 | LPV |
| 3 | 10:28:51.5 | 68:24:27 | – | 17.42 | 0.47 | 0.6 | LPV? |
| 4 | 10:28:47.4 | 68:24:23 | 850 ccComplete cycle not observed. | 17.27 | 0.52 | 0.8 | LPV |
| 5 | 10:28:49.1 | 68:25:05 | 500 | 17.63 | 0.69 | 1.0 | LPV |
| 6 | 10:28:40.6 | 68:25:39 | 750 | 17.62 | 0.47 | 1.0 | LPV? |
| 7 | 10:28:35.3 | 68:24:48 | 550 | 17.56 | 0.38 | 0.5 | LPV |
| 8 | 10:28:42.1 | 68:26:15 | 850 ccComplete cycle not observed. | 17.00 | 0.12 | 0.8 | LPV |
| 9 | 10:28:25.9 | 68:22:59 | – | 16.76 | 0.17 | 1.0 | RSG? |
| 10 | 10:28:41.1 | 68:26:22 | 500 | 17.05 | 0.46 | 0.7 | LPV |
| 11 | 10:28:20.7 | 68:23:12 | 550 | 17.55 | 0.67 | 1.0 | LPV |
| 12 | 10:28:21.2 | 68:23:26 | – | 17.67 | 0.57 | 0.5 | LBV? |
| 13 | 10:28:20.1 | 68:23:16 | – | 17.57 | 0.56 | 0.5 | LBV? |
| 14 | 10:28:30.7 | 68:25:38 | 650 | 17.62 | 0.70 | 0.8 | LPV? |
| 15 | 10:28:31.4 | 68:25:53 | 1000 ccComplete cycle not observed. | 16.66 | 0.73 | 1.1 | sgB[e]? LPV? |
| 16 | 10:28:21.6 | 68:23:55 | – | 17.61 | 0.70 | 0.9 | LPV? |
| 17 | 10:28:23.1 | 68:24:15 | 550 | 17.54 | 0.49 | 0.5 | LPV |
| 18 | 10:28:22.7 | 68:24:29 | – | 17.63 | 0.58 | 0.6 | LBV? |
| 19 | 10:28:16.1 | 68:23:28 | 750 | 16.89 | 0.57 | 0.9 | LPV |
| 20 | 10:28:21.3 | 68:24:35 | 700 | 17.53 | 0.32 | 0.6 | LPV |
| 21 | 10:28:18.4 | 68:24:07 | 600 | 17.16 | 0.38 | 0.6 | LPV |
| 22 | 10:28:14.8 | 68:23:27 | 550 | 17.19 | 0.48 | 1.1 | LPV? |
| 23 | 10:28:12.6 | 68:23:06 | 550 | 17.10 | 0.67 | 1.0 | LPV |
| 24 | 10:28:24.0 | 68:25:40 | – | 17.48 | 0.51 | 0.7 | LBV? |
| 25 | 10:28:03.8 | 68:22:42 | – | 16.77 | 0.49 | 0.8 | LPV? |
| 26 | 10:28:17.3 | 68:25:44 | 550 | 17.32 | 0.38 | 0.5 | LPV |
| 27 | 10:28:14.2 | 68:25:19 | 450 | 17.62 | 0.52 | 0.6 | LPV |
| 28 | 10:28:02.1 | 68:22:55 | – | 15.53 | 0.62 | 0.3 | sgB[e]? |
| 29 | 10:28:11.3 | 68:25:19 | – | 16.43 | 0.32 | 1.0 | LBV? |
| 30 | 10:28:03.4 | 68:24:13 | 850 ccComplete cycle not observed. | 17.16 | 0.06 | 0.7 | LPV |
| 31 | 10:28:17.1 | 68:27:21 | 700 | 17.42 | 0.69 | 0.9 | LPV |
| 32 | 10:28:08.0 | 68:26:58 | – | 16.41 | 0.67 | 1.0 | sgB[e]? |
| 33 | 10:27:55.2 | 68:25:08 | – | 17.73 | 0.40 | 0.5 | LBV? |
| 34 | 10:27:57.3 | 68:26:20 | 700 | 17.64 | 0.50 | 0.6 | LPV |
| 35 | 10:28:16.3 | 68:25:04 | – | 17.57 | –0.09 | 0.4 | LPV |
| 36 | 10:28:09.8 | 68:25:03 | 600 | 17.62 | 0.68 | 1.0 | LPV |
| 37 | 10:28:18.2 | 68:24:14 | 500 | 17.63 | 0.39 | 0.5 | LPV |
The periods listed in these tables should be viewed as preliminary only due to the spotty phase coverage in the light curves. For variables in which one complete cycle was not sampled then periods were estimated by assuming that the light curves are symmetric with time. The absence of a period entry in the tables indicates either no evidence of periodicity, and/or insufficient phase coverage. The limits in phase coverage, coupled with the finite time baseline, restricts the ability to measure periods to better than . More specifically, the periods have estimated uncertainties on the order of 50 days if one or more cycles is observed, while those where a complete cycle was not observed have an estimated uncertainty on the order of 100 days. Improved periods will result when the time baseline and the phase coverage are extended. These sources of uncertainty notwithstanding, it is demonstrated in Section 6 that the period estimates in the tables are sufficiently reliable to allow the PLRs of LPVs in each galaxy to be examined.
The number of detected variables is smallest in Ho II. This probably does not reflect a difference in stellar content, as there is a larger inherent dispersion in the Ho II photometry when compared with the other galaxies, such that the detection criterion for the detection of variability results in an amplitude threshold that is larger in Ho II at a given magnitude than in the other galaxies. If the threshold for detecting variable stars in Ho II is lowered then more candidate variables would of course be detected, although contamination from non-variables would then become an issue.
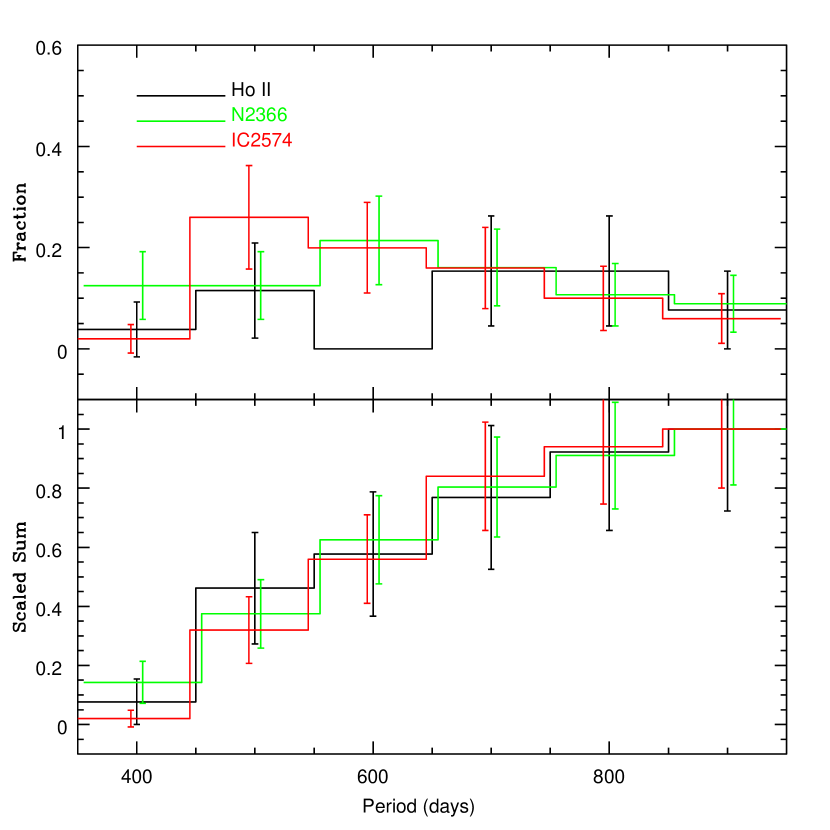
The differential and cumulative histogram distributions of the periods for LPVs and suspected LPVs are compared in Figure 7. The distributions have been normalized to the number of LPVs in each galaxy. The period distributions of NGC 2366 and IC 2574 have been shifted slightly along the horizontal axis to facilitate galaxy-to-galaxy comparisons.
The period distributions of NGC 2366 and IC 2574 are very similar. This agreement is perhaps not surprising given (1) the similarities in SFHs (Section 1), and (2) the homogeneous sampling cadence and temporal baselines of the data for each galaxy. As for Ho II, the smaller number of LPVs identified in that galaxy frustrate efforts to make meaningful comparisons with the other galaxies. There is a possible deficiency of LPVs in Ho II with periods near 600 days, although the significance of this is not clear given the uncertainties arising from small number statistics, coupled with the uncertainties in the period measurements. The mean periods of LPVs in all three galaxies agree within the errors in the mean.
The referee has suggested that data from the Pan-STARRS (PS) Data Release 2 (Chambers et al. 2019) be examined to determine if the variables can be detected at shorter wavelengths. Extending the wavelength coverage and time baseline of these objects are of obvious interest to better understand their properties. However, none of the LPVs were detected in the stacked PS images, let alone the individual images that would be required to construct light curves. This is perhaps to be expected, as the PS survey in this part of the sky has a 50% completeness fraction near , which is near the expected peak brightness of the brightest LPVs at this wavelength. In any event, the [3.6]–[4.5] colors of the LPVs (see next section) indicate that the objects found in the IRAC images are surrounded by circumstellar shells, and hence may be heavily obscured at visible wavelengths. This is consistent with the majority of these being extreme AGB stars, that are near the end point of their AGB evolution (next section). As for the variables that are suspected massive stars, that these were also found in the IR means that there is a similar bias towards large amounts of obscuration. Some of suspected massive stars that have the smallest [3.6]–[4.5] colors, and hence are the least obscured, might be detected in the PS images, but the significance of these detections is clouded by the greater degree of source confusion that occurs at shorter wavelengths, coupled with the crowded enviroments in which these objects tend to be found.
4.3 CMDs, Luminosity Functions, and Classifications
The CMDs of the galaxies are shown in Figures 8, 9, and 10. The locations of variables in each CMD are indicated by filled (‘LPV’) and unfilled (‘LPV?’ and all other types) green squares. The vertical sequence near [3.6]–[4.5] at the bright end of the CMDs is populated by foreground stars and background galaxies. The vertical nature of this sequence reflects the low temperature sensitivity of the [3.6]–[4.5] color among objects with photospheric temperatures (i.e. TK).
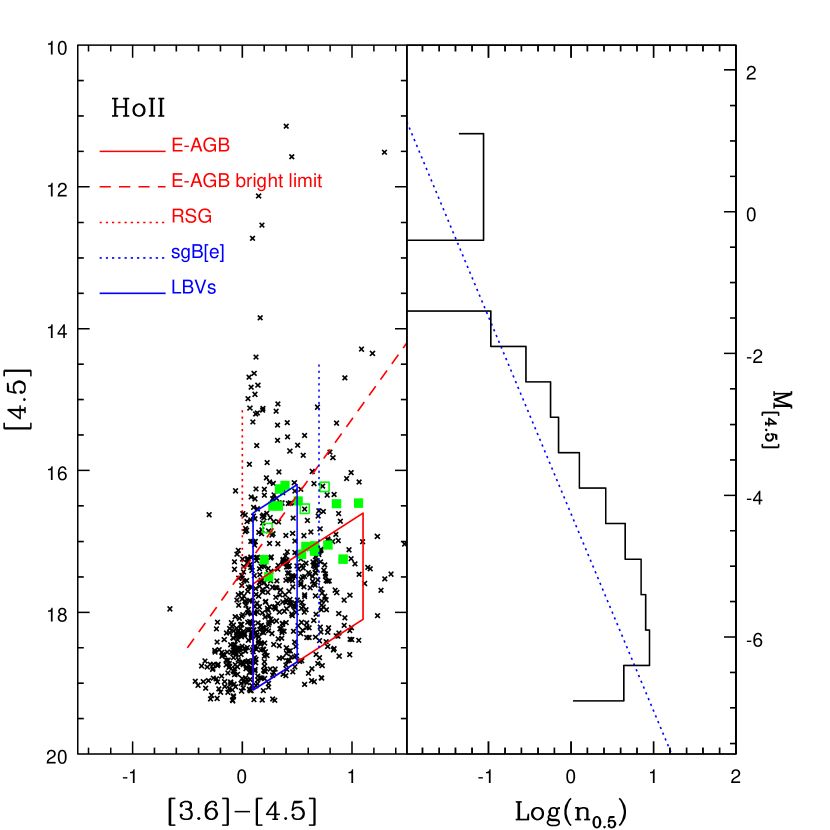
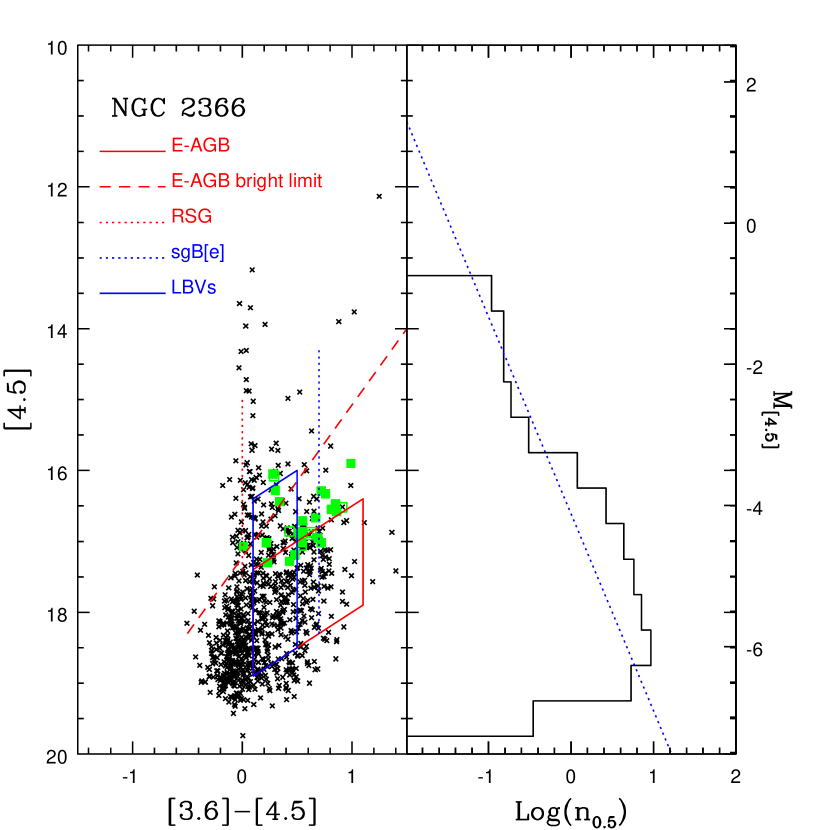
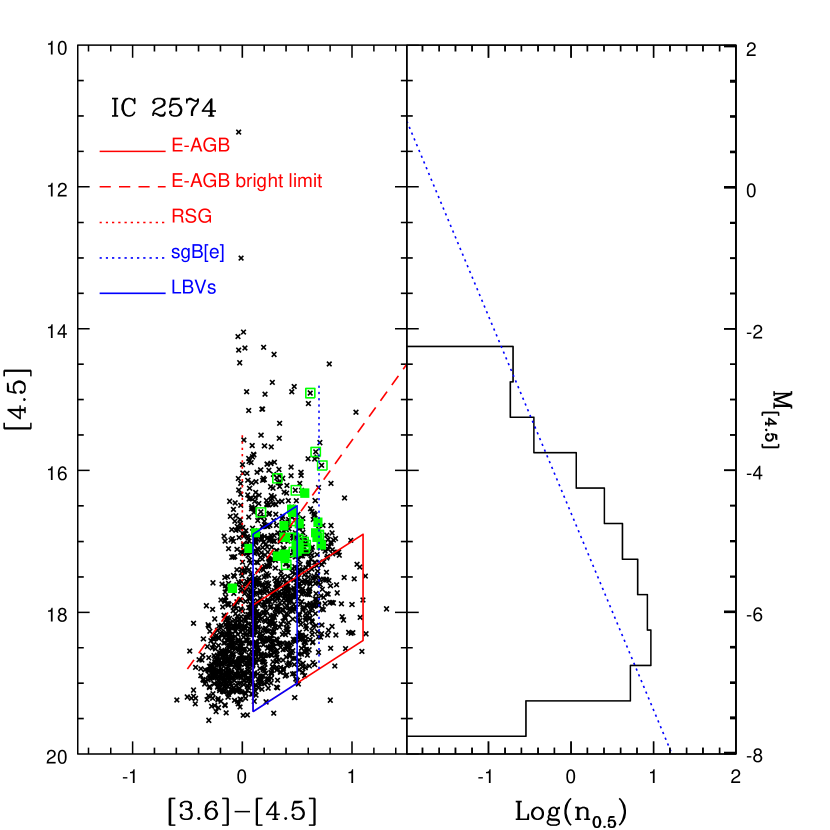
The CMDs broaden along the color axis near [4.5] , due to the onset of luminous, highly evolved stars that are encased in warm circumstellar dust shells. Contamination from foreground stars and unresolved background galaxies remains significant in that magnitude range, especially among objects with [3.6] – [4.5] . To gauge the extent of this contamination, number counts were made in regions that are near the edges of each of the galaxy images in Figure 1. As the three galaxies have similar Galactic latitudes, then the background counts from all three galaxies were combined to reduce statistical uncertainties.
The LF of all sources in each galaxy are plotted in the right hand panels of Figures 8, 9, and 10, where n0.5 is the number of objects per square arcminute per 0.5 magnitude interval in [4.5]. The dotted blue lines in these panels are a power-law that was fit to the number counts in the background/foreground areas of all three fields. Fitting a relation to the combined background/foreground counts suppresses the uncertainties in the measurements in individual magnitude bins. The fitted relation matches the number of objects at intermediate magnitudes in the LFs of NGC 2366 and IC 2574, as expected if it tracks sources that do not belong to the target galaxies.
There is a break in number counts near [4.5] in the LFs of NGC 2366 and IC 2574, and the LFs of those galaxies exceed the expected number of non-galaxy members at magnitudes fainter than these breaks. The breaks in the LFs occur at magnitudes that correspond to the onset of large numbers of stars with [3.6]–[4.5] in the CMDs of NGC 2366 and IC 2574, as expected if the discontinuities in the LFs track the onset of highly evolved stars in each galaxy. In contrast, the LF of Ho II follows a more-or-less continous trend over a wide range of magnitudes with no obvious break. There is also an excess number of sources when compared with the background/foreground counts up to magnitudes brighter than in the other galaxies; stars in Ho II thus appear to occur in statistically significant numbers to as bright as [4.5] . These results likely indicate that there is a population of very bright RSGs in Ho II that is not present in the other galaxies. Indeed, RSGs in the LMC have [3.6]–[4.5] , and the most luminous RSGs in the LMC would occur near [4.5] if shifted to the distance of Ho II (Bonanos et al. 2009), matching the peak of the Ho II sequence. As the [3.6]–[4.5] colors of RSGs are similar to those of foreground stars then a population of RSGs would not cause an obvious widening of the CMD along the color axis.
The photometric faint limit varies with location throughout each field, due to the obvious non-uniform distribution of fainter stars that make up these galaxies. However, there is evidence that the faint limit of the photometry tends not to change by more than magnitude in [4.5] with location in each image. The magnitude at which sample incompleteness sets in can be approximated by the inflexion point in the LF where the number counts turn down, and this occurs near [4.5] in the LFs. While not shown in Figures 8 – 10, the inflexion point in the foreground/background fields occurs near [4.5] , which is only magnitude fainter than in the galaxy LF. This suggests that the stellar samples in each galaxy are likely complete to [4.5] = 18.5. We caution that this does not mean that the sample of LPVs is complete at these magnitudes, as the procedure to detect variables relies on an amplitude criterion, and LPVs with small amplitude light variations are missed. That the photometric completeness limit does not vary greatly with stellar density at these wavelengths is not surprising, as the stars in Figures 8 – 10 are among the brightest objects in these galaxies at these wavelengths, and far exceed in brightness the unresolved stars that make up the bulk of the stellar content. Hence, they are not as susceptible to the crowding issues that occur among stars at fainter magnitudes and shorter wavelengths.
4.3.1 Candidate LPVs
The LMC contains a well-studied population of AGB stars that is a useful reference for assessing the stellar contents of more distant galaxies. An extensive database of measurements of LMC and SMC AGB stars was obtained as part of the SAGE survey (e.g. Blum et al. 2006). This survey identified a number of stars that are nearing the end of their AGB evolution and show signs of significant circumstellar extinction. These extreme AGB (E-AGB) stars have high intrinsic luminosities and [3.6]–[4.5] colors that place them to the right of the dominant stellar plume on the CMD. The red [3.6]–[4.5] color of these objects is due to emission from circumstellar dust that has accumulated as the stars shed mass during the latter stages of evolution. Blum et al. (2006) find that the majority of E-AGB stars in the LMC have [3.6]–[4.5] between 0.1 and 1.5 magnitudes, and M[4.5] between –8 and –11 magnitudes.
Boyer et al. (2015) examine the IR properties of luminous dust-obscured stars in nearby dwarf galaxies, using the Blum et al. (2006) photometry as a reference. The area in their CMDs that contains the main body of E-AGB stars in Figure 1 of Boyer et al. (2015) has been translated into the plane, and the result is shown in Figures 8 – 10 after adjusting for the distances to the M81 group galaxies. The dashed line marks the approximate upper envelope of E-AGB stars in Figure 1 of Boyer et al. (2015).
The majority of LPVs in the three galaxies populate the area of the CMD that contains the most luminous E-AGB stars. Spectroscopic and photometric follow-up will likely reveal that many of these are C stars, as such objects are expected to be common among highly evolved AGB stars in galaxies that have subsolar metallicities and large intermediate age populations. That many of the LPVs are near the upper IR brightness limit for E-AGB stars is a selection effect that results from the faint limit of the SPIRITS observations, coupled with the distances of the galaxies and the magnitude interval searched for LPVs. The dominant clump of LPVs in the CMD of NGC 2366 falls along a locus of roughly constant [3.6], accentuating the [3.6] magnitude selection limit. A sizeable population of fainter LPVs awaits detection in each galaxy.
4.3.2 Candidate Massive Stars
There is a spray of objects that extends magnitudes above the E-AGB cut-off in the CMDs, and thus occupies a region of the CMD that is home to massive stars. Bonanos et al. (2009) discuss the IR properties of massive stars in the LMC, with red supergiants (RSGs) among the brightest of these. The RSGs in the Bonanos et al. (2009) sample tend to have [3.6]–[4.5] colors between –0.2 and 0.2 magnitudes, and can be as bright as [3.6] magnitudes in the LMC, or M magnitudes. This corresponds to [4.5] magnitudes in Ho II and NGC 2366 if [3.6] – [4.5] magnitudes, and [4.5] magnitudes in IC 2574. As noted earlier, the expected peak brightness for RSGs more-or-less corresponds to the magnitude where the number counts in Ho II exceed those expected solely from background/foreground objects. An excess in number counts is not seen in the LFs of the other two galaxies at similar magnitudes, suggesting that Ho II may have a population of luminous RSGs that is not present in the other galaxies.
Some of the variables found here are probably RSGs. DV10 in Ho II is classified as a possible RSG in Table 3, although it also falls in the region of the CMD that is occupied by LBVs. The light curve of DV10 shows an initial dimming episode followed by brightening, and these variations span magnitude in [3.6]. There is also magnitude scatter about the longer term trends. DV9 in IC 2574 is another possible RSG. The light curve of that star shows an overall dimming trend, although there is a discrepant point that suggests more complex light variations are present. Both of these variables fall near the upper boundary of the area in the CMDs that is occupied by LBVs, and so there is ambiguity in their classification.
Some of the candidate massive stars may be LBVs. Bonanos et al. (2009) find LBVs as bright as M magnitudes in the LMC, which corresponds to [4.5] magnitudes in Ho II and NGC 2366 if [3.6] – [4.5] magnitudes, and [4.5] = 17 magnitudes in IC 2574. LBVs in the Bonanos et al. (2009) sample span almost 3 magnitudes in [4.5], and the area of the CMD occupied by the LBVs in Figure 3 of Bonanos et al. (2009), adjusted for the distances to the target galaxies, is indicated with a blue box in Figures 8, 9, and 10.
There is considerable overlap between the areas occupied by LBVs and E-AGB stars in these CMDs, with the upper boundary of the region occupied by LBVs only a few tenths of a magnitude in [4.5] above the upper envelope of E-AGB stars. In fact, LPVs are identified near the upper boundary of the LBV region on the CMD, hinting at substantial contamination from E-AGB stars over the area on the CMD that contains LBVs. Lacking spectra, the primary means of isolating candidate LBVs with these data is then through variability. There are a handful of variables in the galaxies that fall within the LBV area of the CMD that do not show light curves indicative of LPVs, and there are three such objects in IC 2574. The light curve of DV9 in IC 2574 shows evidence of semi-regular variations, although it is listed as a possible RSG variable in Table 5 based on its [3.6]–[4.5] color. As for the other candidate LBVs in IC 2574, the light curve of DV25 shows a progressive decrease in [3.6] magnitudes when these data were recorded, while that of DV29 shows a progressive increase in brightness.
Despite having hot photospheric temperatures, supergiant B[e] (sgB[e]) stars may be among the brightest IR sources in a star forming galaxy. The IR emission from these objects originates in circumstellar shells, and so they are potentially challenging targets for spectroscopy at visible and red wavelengths if the shell is optically thick. Bonanos et al. (2009) find that sgB[e] stars are as bright as [3.6] = 6 magnitudes in the LMC (i.e. as bright as RSGs in that passband), and tend to have [3.6]–[4.5] magnitudes. Therefore, the most luminous sgB[e] stars may be many tenths of a magnitude brighter than the brightest RSGs in the CMD.
The locus of LMC sgB[e] stars is shown as a dashed blue line in the left hand panels of Figures 8, 9, and 10. Each of the galaxies contain objects that fall close to the sgB[e] sequence at [4.5] magnitudes that are well above the E-AGB locus. IC 2574 contains the largest number of very luminous candidate sgB[e] stars, and one of these (DV28) shows evidence of variability that is not indicative of a LPV. The light curve of DV28 gradually increases in [3.6] during the time interval sampled with these data, and its location on the CMD suggests that it is one of the most luminous objects in IC 2574. DV15 and DV32 in IC 2574 are also near the sgB[e] sequence. The light curve of the former shows a steady magnitude increase in [3.6] during the time that these data were recorded. There is no evidence of the intrinsic scatter that appears in some of the light curves of other candidate massive stars. In contrast, the light curve of DV32 shows evidence of magnitude dispersion in [3.6], with a possible overall dimming trend.
Unlike RSGs and LBVs, candidate sgB[e] stars occur in a part of the CMD that is not susceptible to contamination from foreground or E-AGB stars, and so a sample of these objects can be identified without light curve information. The locations, [4.5] magnitudes, and [3.6]–[4.5] colors of non-variable stars that fall close to the sgB[e] sequence in the CMDs of the three galaxies and that are more than 0.5 magnitudes above the E-AGB upper locus in the LBV area on the CMD are listed in Table 6. With the caveat that the number of objects is small, IC 2574 contains twice as many sgB[e] candidates as in the other two galaxies combined. This could suggest a more active SFR in IC 2574 during the past few Myr, or perhaps characteristics of the ISM in IC 2574 that are more amenable to the formation of very massive stars (e.g. Kirk & Meyers 2012).
| # | RA | Dec | [3.6]aaMeasured from median images. | [3.6]–[4.5]aaMeasured from median images. |
|---|---|---|---|---|
| (J2000) | (J2000) | (mag) | (mag) | |
| Ho II B1 | 08:19:29.0 | 70:42:58 | 15.792 | 0.685 |
| NGC 2366 B1 | 07:28:45.9 | 69:11:25 | 14.985 | 0.417 |
| B2 | 07:28:58.0 | 69:11:33 | 14.897 | 0.526 |
| IC 2574 B1 | 10:28:14.3 | 68:25:57 | 15.842 | 0.663 |
| B2 | 10:28:35.9 | 68:23:50 | 15.838 | 0.603 |
| B3 | 10:28:29.5 | 68:24:03 | 15.816 | 0.684 |
| B4 | 10:28:03.1 | 68:24:33 | 15.060 | 0.605 |
| B5 | 10:28:47.1 | 68:22:32 | 15.612 | 0.710 |
| B6 | 10:27:48.3 | 68:24:42 | 15.184 | 1.040 |
5 SPATIAL DISTRIBUTIONS
The on-sky locations of the variable stars track areas of star formation during recent epochs. The variables that are suspected massive stars likely have ages Myr. As for LPVs, those objects with the longest periods in moderately metal-poor environments may have progenitor masses in excess of 4 M⊙ (Whitelock et al. 2018), and hence ages of no more than Myr (e.g. Cordier et al. 2007). LPVs with periods near 400 days may include the least massive – and hence oldest – progenitor stars. While these may have near-solar progenitor masses (Takeuti et al. 2013), there is considerable scatter in any period-mass relation, and at least some of the shortest period LPVs found in this study are likely overtone pulsators (Section 6).
The on-sky locations of LPVs and candidate LBVs and sgB[e] stars are compared with those of non-variable stars and unresolved light in Figure 11. The non-variable stars are restricted to [4.5] magnitudes between 16 and 18 to maintain photometric completeness. The images of unresolved light are those of background light that were constructed by smoothing star-subtracted images of the galaxies (Section 3). Foreground stars and compact background galaxies are a complicating factor when examining the distribution of non-variables, as the predicted counts for these objects in Figures 8 – 10 indicate that they can account for up to 50% of the objects at the magnitudes examined here (Section 4). These contaminants are expected to be more-or-less uniformly distributed on the sky.
The LPVs with the longest periods in these galaxies are likely near their birth places. Evidence to support this claim is presented by Bastian et al. (2011), who examined the two point correlation function of stars in various age intervals to estimate the disruption timescale of stellar groupings in these galaxies. They conclude that groupings in Ho II survive for up to 225 Myr, while in IC 2574 they last 150 - 200 Myr, and in NGC 2366 100 Myr.
Small number statistics are an obvious issue when assessing the distribution of LPVs and candidate massive stars in Ho II. Keeping this caveat in mind, the distribution of LPVs in Ho II appears not to follow the underlying IR light, in the sense that the LPVs are more diffusely distributed. The diffuse distribution of the LPVs in Ho II is consistent with them forming well after the bulk of RGB and fainter AGB stars that presumably dominate the unresolved light. The sole candidate sgB[e] star in Ho II is offset from the main body of the galaxy, and is part of the star forming complex to the East of the galaxy center.
Bernard et al. (2012) found that the exponential scale length of AGB and RGB stars in Ho II is 0.76 - 0.80 arcmin, whereas bright blue MS and blue supergiant stars have a scale length in excess of 3 arcmin. The projected distribution of LPVs and other bright AGB stars found in the IRAC images of Ho II differ from the distribution of AGB stars studied by Bernard et al. (2012) because the two AGB samples have different mean ages. While the area of the CMD that Bernard et al. (2012) use to identify AGB stars almost certainly contains some young AGB stars, the dominant component consists of stars that are immediately above the RGB in the CMD (Figure 4 of Bernard et al. 2012). The Bernard et al. sample thus contains older populations, rather than the intrinsically luminous AGB stars that have been detected in the IRAC images. A further complication for the detection of young LPVs at the wavelengths considered by Bernard et al. (2012) is that E-AGB stars can have substantial circumstellar extinction.
The non-variable star sample in Ho II includes fainter objects than the LPVs, and so likely contains stars that span a broader range of progenitor masses, and hence ages. Still, the distribution of the non-variable stars in Ho II does not appear to track surface brightness in the [3.6] background image, in the sense that stars are not detected near the galaxy center. This is part of a general trend throughout Ho II: non-variable AGB stars appear not to track surface brightness, even near the edges of the galaxy. Gaps are also seen in the distribution of non-variable stars in Ho II. The locations of these holes do not correlate with the HI bubbles found by Puche et al. (1992), although a possible exception is the gap in the stellar distribution near the center of Ho II that coincides with bubble 21 in the Puche et al. (1992) study. This is the largest HI bubble in Ho II.
The projected distribution of LPVs in NGC 2366 and IC 2574 are similar to that in Ho II, in the sense that the LPVs in these galaxies tend to be distributed more-or-less uniformly across the field, with no obvious correlation between number density and [3.6] surface brightness. The candidate massive stars in IC 2574 are much more widely distributed than the unresolved light from these galaxies, although the distribution of non-variable E-AGB stars in IC 2574 more closely tracks unresolved light than in Ho II, in the sense that there is a clear concentration of E-AGB stars along the major axis of IC 2574. The orientation of both galaxies makes it difficult to search for gaps in the distribution of E-AGB stars like those in Ho II.
6 PERIOD-LUMINOSITY RELATIONS AND DISTANCES
The PLRs of LPVs and suspected LPVs in the three galaxies are compared in Figure 12. LPVs occupy multiple sequences on the period-luminsity plane (e.g. Wood et al. 1999; Riebel et al. 2010). Following the nomenclature described by Wood et al. (1999), the majority of LPVs are expected to fall along Sequence C, which is populated by fundamental mode pulsators. First overtone pulsators fall along Sequence C’ magnitude above Sequence C on the period [3.6] magnitude plane. Roughly one third of LPVs fall along Sequence D, which is populated by long secondary period stars (e.g. Riebel et al. 2010). Sequence D is located a few magnitudes below Sequence C in the PLRs, and so is near the photometric faint limit of this study. While no stars on Sequence D are detected in this study, some LPVs found here fall midway between Sequences C and D (see below).
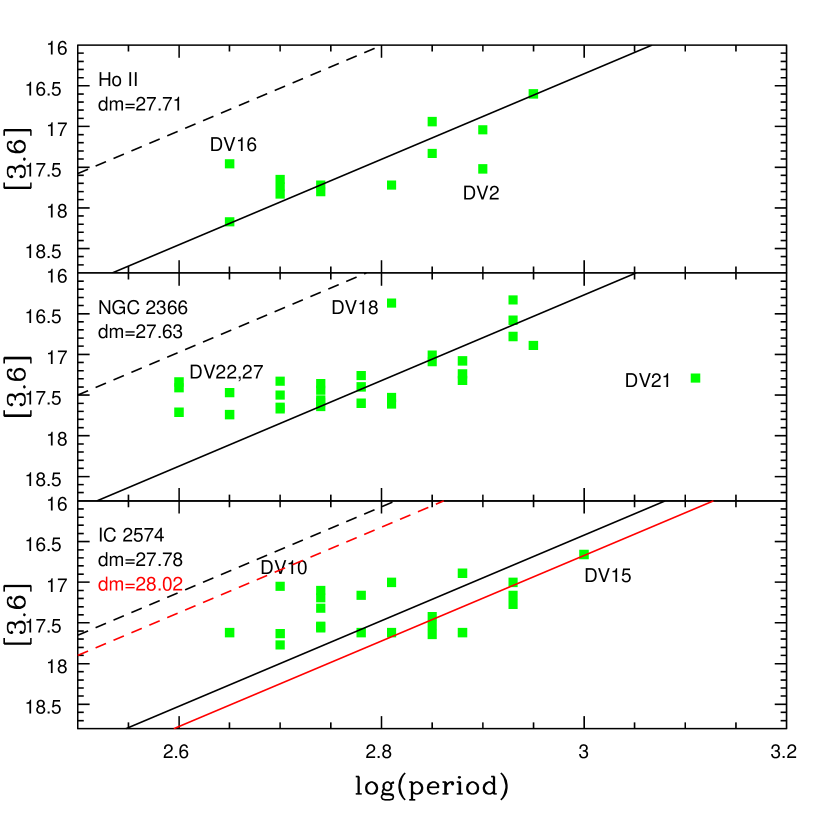
Goldman et al. (2019) examine the [3.6] and [4.5] PLRs of LPVs in galaxies that span a range of metallicities. There is a 0.25 magnitude scatter in the [3.6] relation, with no evidence of a metallicity dependance. The [3.6] PLR from Goldman et al. (2019), shifted by the distance modulus listed in each panel, is compared with the observed PLRs in Figure 12. The comparisons in Figure 12 indicate that the PLRs of the three galaxies have differing apparent slopes in the sense that the relations for NGC 2366 and IC 2574 are flatter than the Goldman et al. (2019) relation. The source of these differences is discussed below.
The LPVs in Ho II fall on or close to Sequence C, and the majority of these define a relation that is well matched by that defined by Goldman et al. (2019). An exception is DV16, which falls roughly midway between the fundamental and overtone pulsation sequences. Another LPV that departs from the PLR is DV2, which is a few tenths of a magnitude below the trend defined by the other LPVs. DV2 has the reddest [3.6]–[4.5] color of the Ho II LPVs, opening the possibility that its intrinsic [3.6] brightness may be affected by circumstellar extinction. The tight relation defined by these data is evidence that there are not significant uncertainties in the estimated periods. If all points are considered when matching the Goldman et al. PLR then a distance modulus of is found, with a dispersion of mag. The uncertainty in the distance modulus is the formal error in the mean, and does not include the uncertainties in Equation 1 of Goldman et al. (2019). This distance modulus is in excellent agreement with the RGB-tip based distance modulus of Ho II listed in Table 1.
LPVs in NGC 2366 define a broader scatter envelope in the PLR than those in Ho II. DV21 has the longest period measured among variables in NGC 2366, and it is classified as a possible LBV in Table 4. It is included in Figure 12 to examine the possibility that it might be an LPV. It is located almost 1.5 magnitudes below the fitted relation, placing it midway between Sequences C and D. A handful of LPVs in a similar part of the PLR are also seen in Figure 6 of Goldman et al (2019), where the PLR of LPVs in a large number of nearby metal-poor galaxies is shown. Unlike DV2 in Ho II, DV21 has a median [3.6]–[4.5] color that is near the midpoint of the other LPVs, suggesting that it is not subject to exceptionally high circumstellar extinction when compared with other LPVs in this sample. We suspect that DV21 is likely not an LPV.
A blind application of the Goldman et al. (2019) calibration to the entire sample of NGC 2366 LPVs yields a distance modulus of , with a dispersion magnitudes. However, a comparison with the Goldman et al. (2019) relation shifted to this distance modulus found that there are LPVs other than DV21 in the NGC 2366 PLR that depart from the relation defined by all objects. In fact, there is a systematic trend, in the sense that LPVs with periods days consistently fall above the fitted Goldman et al. (2019) relation.
The solid line in the middle panel of Figure 12 shows the Goldman et al. relation based on the distance modulus defined by LPVs with periods longer than 500 days, and excluding DV21. The distance modulus defined by these stars is , with a dispersion about the relation of magnitudes. The dashed line shows the expected sequence C’ with that distance modulus. DV18, DV22, and DV27 fall within a few tenths of a magnitude of Sequence C’, making them possible first overtone pulsators, although the 650 day period for DV18 is long for an overtone pulsator.
The PLR for IC 2574 is shown in the bottom panel of Figure 12. DV15, which is listed as a possible sgB[e] star in Table 5 based on its color and brightness, has been included in this plot as its location in Figure 10 is close to the area containing E-AGB stars, opening the possibility that it might be an LPV. A distance modulus of is found if all LPVs and DV15 are considered. The dispersion in the relation is magnitudes, which is larger than that in the Goldman et al. (2019) calibrating relation. In any event, it is clear from the bottom panel of Figure 12 that the slope of the IC 2574 PLR differs from that found by Goldman et al. (2019), in the sense that it is shallower. If the distance modulus is based only on objects with periods in excess of 500 days, then a distance modulus of is found, with a dispersion of magnitudes. This distance modulus is in better agreement with the distance modulus listed in Table 1. The PLR based on this distance modulus is shown in Figure 12, and it can be seen from the bottom panel of Figure 12 that there is still a marked tendency for stars with periods of 550 days to fall above the expected PLR. The location of DV10 on the PLR suggests that it is an overtone pulsator.
The result of placing the Goldman et al. (2019) relation on the IC 2574 period luminosity plane using the distance modulus listed in Table 1 is indicated with the red line in Figure 12. This relation passes through many of the longer period (and hence brighter) LPVs and possible LPVs in IC 2574, including DV15. The LPVs with periods days tend to fall well above the fitted relation. Some of the shorter period LPVs fall close to Sequence C’, which is shown with a red dashed line. This supports the notion that some of the shorter period systems we have found in IC 2574 are likely overtone pulsators.
The flat slope of the apparent PLRs in IC 2574 and NGC 2366 is due to a selection effect. There is a well-defined faint limit near [3.6] in the middle and bottom panels of Figure 12, which was imposed in the variable star search to ensure that full phase coverage could be obtained for any detected variable. This faint limit means that only the brightest fundamental mode pulsators with periods days are detected in the NGC 2366 and IC 2574 observations, along with overtone pulsators. This biases the slope of the observed PLR to become flatter than the intrinsic relation.
7 DISCUSSION AND CONCLUSIONS
Archival Spitzer IRAC observations have been used to identify and characterize bright LPVs and suspected evolved massive stars in the Magellanic-type galaxies Ho II, NGC 2366, and IC 2574. With distances of a few Mpc, these are among the nearest star forming dwarf galaxies outside of the Local Group, and so serve as stepping stones for understanding the stellar contents and SFHs of similar but more distant systems. Aside from having Magellanic-like morphologies, the three galaxies share other properties as well. As members of the M81 group they are more-or-less equidistant. They also have similar integrated brightnesses, and so likely have similar sub-solar metallicities. Finally, previous studies of stellar content in these galaxies suggest they have had similar, active SFHs during the past few hundred Myr, which is the timescale during which the progenitors of the variable stars studied here would have formed.
7.1 LPVs and AGB stars
Luminous LPVs have been detected in all three galaxies. The locations of the LPVs on the CMDs are consistent with them being near the bring end of the magnitude range occupied by E-AGB stars. The highly evolved nature of these objects is evident not only in their intrinsic brightnesses but also their [3.6]–[4.5] colors, which for many are indicative of an SED that has a significant contribution from warm circumstellar dust. Such emission is a signature of substantial mass loss, as would be expected if these objects are nearing the end of evolution on the AGB. Some of these LPVs are likely C stars, given that the galaxies have metallicities that are similar to those of the Magellanic Clouds, where C stars account for more than one quarter of the AGB component (e.g. Blum et al. 2006).
The periods of the LPVs identified in the IRAC images range from 400 to 1300 days. LPVs with periods outside of this interval are missed in these data due to various biases. At short periods the detection of LPVs is compromised by photon noise and crowding, and this is evident in the truncated magnitude distributions of the PLRs of NGC 2366 and IC 2574 in Figure 12. The temporal sampling of the observations likely also complicates efforts to identify very short period variables. As for LPVs with very long periods, their detection is complicated by the cadence of the observations and stochastic effects due to the rapid evolutionary timescales of the most massive AGB stars.
The period distributions of LPVs in NGC 2366 and IC 2574 are very similar. While the temporal sampling of a suite of observations introduces obvious complications when comparing period distributions, this is mitigated to some extent by the similar sampling cadence of the light curves obtained from the SPIRITS images (i.e. ten observations per galaxy recorded at more-or-less similar intervals over a day baseline). The agreement between period distributions includes suspected overtone pulsators (Section 6) that occur at periods days. To the extent that the period of an LPV and its peak brightness are loosely related to the mass of its progenitor (e.g. Takeuti et al. 2013), then the similarity of the period distributions of NGC 2366 and IC 2574 is broadly consistent with the SFHs of the galaxies in the age range over which the LPV progenitors formed having also been similar. The modest number of LPVs detected in Ho II complicates efforts to make meaningful comparisons with the period distributions of the other two galaxies, although there appears to be a deficiency in LPVs with periods days when compared with the others.
The spatial distributions of LPVs in all three galaxies differ from those of non-variable stars. In particular, the LPVs tend to be more diffusely distributed on the sky than the non-variable stars, the vast majority of which are likely also evolving on the AGB. The LPVs found in the IRAC images are among the brightest AGB stars in these galaxies, whereas the non-variable stars span a broader range of brightnesses, and hence ages, than the LPVs. The spatial distribution of the LPVs is then consistent with recent star formation being more diffusely distributed in these galaxies than the main body of older stars.
There are holes in the distribution of bright AGB stars in Ho II. The absence of luminous AGB stars in these holes suggests that their interiors did not form stars for an extended period of time within the past few hundred Myr. These holes are reminiscent of the bubbles that are seen in HI maps of that galaxy. However, with the possible exception of the central HI bubble in Ho II, the voids found here do not have counterparts in the HI distribution. The orientations of NGC 2366 and IC 2574 make it difficult to determine if similar gaps are present in the projected distribution of AGB stars in those galaxies.
7.2 LPV PLRs
The PLRs of the three galaxies constructed from the IRAC observations have different slopes. The PLR of LPVs in the [3.6] filter appears to be well-defined in Ho II, with a dispersion that is smaller than that in the measurements used by Goldman et al. (2019) to construct the calibrating relation. In fact, the dispersion measured from the Ho II data is an upper limit to the intrinsic scatter in the PLR of that galaxy given that there are uncertainties in the estimated periods, coupled with the likely presence of (1) stars that are not fundamental mode pulsators, and (2) LPVs that have optically thick circumstellar envelopes. Still, the slope of the Goldman et al. (2019) PLR in the top panel of Figure 12 provides a reasonable match to the LPVs in Ho II, and the modest dispersion in the PLR suggests that the preliminary period estimates do not contain large errors. The distance estimated for Ho II from the Goldman et al. (2019) [3.6] PLR is consistent with that found from the tip of the RGB to within a tenth of a magnitude.
In contrast to Ho II, the PLRs of NGC 2366 and IC 2574 obtained from the IRAC images are flatter than the Goldman et al. (2019) relation. LPVs in NGC 2366 that have log(P - days) fall above the expected PLR for fundamental mode pulsators, and some of these are probably overtone pulsators. If the most obvious candidates for overtone pulsators are not considered then a distance modulus for NGC 2366 that is consistent with the RGB-tip distance modulus is found. The apparent PLR of IC 2574 is similarly skewed at shorter periods. Indeed, if the RGB-tip distance modulus is adopted for IC 2574 then the LPVs in IC 2574 with periods in excess of days fall along a sequence that follows the Goldman et al. (2019) PLR, while those at shorter periods fall above this relation.
The flat PLRs of NGC 2366 and IC 2574 are not due exclusively to contamination from overtone pulsators, as there is a photometric selection effect at play. The cut-off near [3.6] in the PLRs of NGC 2366 and IC 2574 creates a bias in favor of detecting the brightest fundamental mode pulsators at shorter periods. Hence, it can be anticipated that many of the variables with periods days in these galaxies are likely first overtone pulsators that happen to fall above the PLR; LPVs below the relation are not detected due to the photometric cut-off imposed to detect variables. As stated in the previous paragraph, there are likely also overtone pulsators present with these periods. The period distribution of Ho II is deficient in LPVs with periods days when compared with the other two galaxies, and so any bias is not as obvious in the Ho II PLR. We also note that the apparent PLRs of NGC 2366 and IC 2574 PLRs is similar to that defined by LPVs in IC 1613 in Figure 6 of Goldman et al. (2019), suggesting that similar selection effects are likely at work in the LPV sample of that galaxy.
7.3 Massive Stars
All three galaxies contain luminous red sources that may be among the most highly evolved massive stars in these systems. The brightest of these fall above the bright envelope of E-AGB stars in the CMD, with many to the right of the foreground star sequence on the CMD. The reddest of these sources are likely a mix of sgB[e] stars and LBVs, although only sgB[e] stars occupy a distinct sequence in the CMD, and there is overlap between LPVs and LBVs in the CMD. While a number of potential LBVs are identified based on their light curves, it is likely that some (or all) of these may not turn out to be bona fide LBVs. Spectroscopic follow-up and longer term photometric monitoring will be essential for establishing the nature of these objects.
While the sample size is small, there are hints of galaxy-to-galaxy differences in the numbers of sgB[e] stars. IC 2574 has the largest number of these objects, and this is reflected in the well-defined sgB[e] sequence in the left hand panel of Figure 10. Differences in massive star content may extend to other types of luminous red stars. While foreround contamination confounds efforts to identify individual RSGs with the existing data, the number counts of bright stars in Ho II suggest that that galaxy may host a larger population of very luminous RSGs than the other two galaxies. Given that sgB[e] stars and the most luminous RSGs are highly evolved massive objects, these results hint at galaxy-to-galaxy differences in the SFHs within the past few Myr.
There is a high binary fraction among massive stars (e.g. Sana et al. 2012), and close binary systems will not follow the same evolutionary tracks as single stars. It has been suggested that some of the most luminous young stars in a galaxy might actually be close binary systems, in which mass exchange and mixing could extend the lifetime of the system and create stars that then do not follow the same age mass luminosity relation as single objects (e.g. Smith & Tombleson 2015). Binarity also provides one means of producing the disk that is seen around sgB[e] stars (e.g. Clark et al. 2013).
If the LBVs and sgB[e] stars identified here are binary systems then the numbers of these objects might be expected to show only modest galaxy-to-galaxy scatter given the evidence discussed in Section 1 of similar SFRs over the past few tens of Myr. In addition, if the possible massive stars found here are the result of interactions within binary systems then they would be distributed over a larger part of the sky near the host galaxy than single massive stars and HII regions, given that they live longer than single stars, and so have had more time to move away from their places of birth. The candidate massive stars found in the IRAC images appear to follow a diffuse sky distribution that is similar to that of the LPVs in all three galaxies.
We close by noting that the spatial resolution offered by the JWST in the Virgo cluster (15 – 20 Mpc distance) is comparable to that achieved by Spitzer in the galaxies examined here ( Mpc distance). The even better angular resolution that will be achieved with diffraction-limited VLOTs in will allow LPVs to be resolved in galaxies with distances comparable to those in the Coma cluster (i.e. 100 Mpc). As is the case in NGC 2366 and IC 2574, crowding will likely limit the detection of fundamental mode pulsators in such target galaxies to those with the longest periods, and efforts to find such objects will thus need a suitable temporal sampling strategy. Observations of this nature will also greatly expand the sample of young massive evolved objects. The chances of characterizing a SN progenitor a few years before it explodes will increase as the sample of such highly evolved massive stars is expanded.
(https://doi.org/10.26132/ned1), which is operated by the Jet Propulsion Laboratory, California Institute of Technology, under contract with the National Aeronautics and Space Administration. The Pan-STARRS1 Surveys (PS1) and the PS1 public science archive have been made possible through contributions by the Institute for Astronomy, the University of Hawaii, the Pan-STARRS Project Office, the Max-Planck Society and its participating institutes, the Max Planck Institute for Astronomy, Heidelberg and the Max Planck Institute for Extraterrestrial Physics, Garching, The Johns Hopkins University, Durham University, the University of Edinburgh, the Queen’s University Belfast, the Harvard-Smithsonian Center for Astrophysics, the Las Cumbres Observatory Global Telescope Network Incorporated, the National Central University of Taiwan, the Space Telescope Science Institute, the National Aeronautics and Space Administration under Grant No. NNX08AR22G issued through the Planetary Science Division of the NASA Science Mission Directorate, the National Science Foundation Grant No. AST-1238877, the University of Maryland, Eotvos Lorand University (ELTE), the Los Alamos National Laboratory, and the Gordon and Betty Moore Foundation.
References
- (1)
- (2) Aparacio, A., Cepa, J., Castaneda, H. O., et al. 1995, AJ, 110, 212
- (3)
- (4) Bastian, N., Weisz, D. R., Skillman, E. D., et al. 2011, MNRAS, 412, 1539
- (5)
- (6) Bernard, E. J., Ferguson, A. M. N., Barker, M. J., Irwin, M. J., Jablonka, P., Arimoto, N. 2012, MNRAS, 426, 3490
- (7)
- (8) Bica, E., Barbuy, B., & Ortolani, S. 1991, ApJ, 382, L15
- (9)
- (10) Blum, R. D., Mould, J. R., Olsen, K. A., et al. 2006, AJ, 132, 2034
- (11)
- (12) Bonanos, A. Z., Masa, D. L., Sewito, M., et al. 2009, AJ, 138, 1003
- (13)
- (14) Boyer, M. L., McQuinn, K. B. W., Barmby, P. et al. 2015, ApJ, 800, 51
- (15)
- (16) Cannon, J. M., Walter, F., Bendo, G. J., et al. 2005, ApJ, 630, L37
- (17)
- (18) Chambers, K. C., Magnier, E. A., Metcalfe, N., et al. 2019, arXiv:1612.05560v4
- (19)
- (20) Cignoni, M., Sacchi, E., Aloisi, A., et al. 2018, ApJ, 856, 62
- (21)
- (22) Cignoni, M., Sacchi, E., Tosi, M., et al. 2019, ApJ, 887, 112
- (23)
- (24) Clark, J. S., Bartlett, E. S., Coe, M. J., et al. 2013, A&A, 560, A10
- (25)
- (26) Cordier, D., Pietrinferni, A., Cassisi, S., & Salaris, M. 2007, AJ, 133, 468
- (27)
- (28) Da Costa, G. S., & Armandroff, T. E. 1990, AJ, 100, 162
- (29)
- (30) Dalcanton, J. J., Williams, B. F., Melbourne, J. L., et al. 2012, ApJS, 198, 6
- (31)
- (32) Davidge, T. J., Beck, T. L., & McGregor, P. J. 2010, PASP, 122, 241
- (33)
- (34) Davidge, T. J. 2014, ApJ, 791, 66
- (35)
- (36) Davidge, T. J. 2021, AJ, 162, 152
- (37)
- (38) de Vaucouleurs G., de Vaucouleurs A., Corwin H.G., Buta R.J., Paturel G., & Fouque P., Third Reference Catalogue of Bright Galaxies (RC3), (Springer-Verlag: New York), 1991
- (39)
- (40) Drissen, L., Roy, J-R, Robert, C., Devost, D., & Doyon, R. 2000, AJ, 119, 688
- (41)
- (42) Egorov, O. V., Lozinskaya, T. A., Moiseev, A. V., & Shchekinov, Y. A. 2016, MNRAS, 464, 1833
- (43)
- (44) Fazio, G. G., Hora, J. L., Allen, L. E., et al. 2004, ApJS, 154, 10
- (45)
- (46) Glass, I. S., & Lloyd Evans, T. 1981, Nature, 291, 303
- (47)
- (48) Glass, I. S., Matsumoto, S., Carter, B. S., & Sekiguchi, K. 2001, MNRAS, 321, 77
- (49)
- (50) Goldman, S. R., Boyer, M. L., McQuinn, K. B. W., et al. 2019, ApJ, 877, 49
- (51)
- (52) Hoessel, J. G., & Danielson, G. E. 1984, ApJ, 286, 159
- (53)
- (54) Hoessel, J. G., Saha, A., & Danielson, G. E., 1998, AJ, 115, 573
- (55)
- (56) Karachentsev, I. D., Dolphin, A. E., Geisler, D., et al. 2002, A&A, 383, 125
- (57)
- (58) Kasliwal, M. M., Bally, J., Masci, F., et al. 2017, ApJ, 839, 88
- (59)
- (60) Kennicutt, R. C. Jr. 1984, ApJ, 287, 184
- (61)
- (62) Kirk, H., & Meyers, P. C. 2012, ApJ, 745, 131
- (63)
- (64) Le Bertre, T. 1993, A&AS, 97, 729
- (65)
- (66) McQuinn, K. B. W., Skillman, E. D., Cannon, J. M., et al. 2010, ApJ, 721, 297
- (67)
- (68) Miller, B. W., & Hodge, P. 1994, ApJ, 427, 656
- (69)
- (70) Miller, B. W., & Hodge, P. 1996, ApJ, 458, 657
- (71)
- (72) Mirabel, I. F., & Morras, R. 1990, ApJ, 356, 130
- (73)
- (74) Mondal, C., Subramaniam, A., & George, K. 2019, AJ, 158, 229
- (75)
- (76) Pasquali, A., Leroy, A., Rix, H-W, et al. 2008, ApJ, 687, 1004
- (77)
- (78) Puche, D., Westpfahl, D., Brinks, E., & Roy, J-R 1992, AJ, 103, 1841
- (79)
- (80) Richer, M. G., & McCall, M. L. 1995, ApJ, 445, 642
- (81)
- (82) Riebel, D., Meixner, M., Fraser, O., Srinivasan, S., Cook, K., & Vijh, U. 2010, ApJ, 723, 1195
- (83)
- (84) Sana, H., de Mink, S. E., de Koter, A. et al. 2012, Science, 337, 444
- (85)
- (86) Smith, N., & Tombleson, R. 2015, MNRAS, 447, 598
- (87)
- (88) Sokolovsky, K. V., Gavras, P., Karampelas, A., et al. 2017, MNRAS, 464, 274
- (89)
- (90) Stetson, P. B. 1987, PASP, 99, 191
- (91)
- (92) Stetson, P. B. 1994, PASP, 106, 250
- (93)
- (94) Takeuti, M., Nakagawa, A., Kurayama, T., & Honma, M. 2013, PASJ, 65, 60
- (95)
- (96) Talent, D. J. 1980, PhD Thesis, Rice University
- (97)
- (98) Thuan, T. X., & Izotov, Y. I. 2005, ApJ, 627, 739
- (99)
- (100) Tolstoy, E., Saha, A., Hoessel, J. G., & McQuade, K. 1995, AJ, 110, 1640
- (101)
- (102) Tomaney, A. B., & Crotts, A. P. S. 1996, AJ, 112, 2872
- (103)
- (104) Walter, F., & Brinks, E. 1999, AJ, 118, 273
- (105)
- (106) Walter, F., Kerp, J., Duric, N., Brinks, E., Klein, U. 1998, ApJ, 502, L143
- (107)
- (108) Weisz, D. R., Skillman, E. D., Cannon, J. M., Dolphin, A. E., Kennicutt, R. C. Jr., Lee, J., & Walter, F. 2008, ApJ, 689, 160
- (109)
- (110) Weisz, D. R., Skillman, E. D., Cannon, J. M., Dolphin, A. E., Kennicutt, R. C. Jr., Lee, J., & Walter, F. 2009, ApJ, 704, 1538
- (111)
- (112) Werner, M. W., Roellig, T. L., Low, F. L., et al. 2004, ApJS, 154, 1
- (113)
- (114) Whitelock, P. A., Menzies, J. W., Feast, M. W., & Marigo, P. 2018, MNRAS, 473, 173
- (115)
- (116) Williams, S. J., & Bonanos, A. Z. 2016, A&A, 587, A121
- (117)
- (118) Wood, P. R., Alcock, C., Allsman, R. A., et al. 1999, in IAU Symposium 191, Asymptotic Giant Branch Stars, ed. T. Le Bertre, A. Lebre, & C. Waelkens, (San Francisco: ASP), 151
- (119)
- (120) Zezas, A. L., Geogantopoulus, I., & Ward, M. J. 1999, MNRAS, 308, 302
- (121)