The GatedTabTransformer. An enhanced
deep learning architecture for tabular modeling.
Abstract
There is an increasing interest in the application of deep learning architectures to tabular data. One of the state-of-the-art solutions is TabTransformer which incorporates an attention mechanism to better track relationships between categorical features and then makes use of a standard MLP to output its final logits. In this paper we propose multiple modifications to the original TabTransformer performing better on binary classification tasks for three separate datasets with more than 1% AUROC gains. Inspired by gated MLP, linear projections are implemented in the MLP block and multiple activation functions are tested. We also evaluate the importance of specific hyper parameters during training.
Keywords deep learning Transformer tabular data
1 Introduction
Some of the most common machine learning pipelines with real-world applications involve manipulation of tabular data. The current state-of-the-art approaches for tabular modeling are treebased ensemble methods such as the gradient boosted decision trees (GBDTs) [1]. However, there is also an increasing interest in the application of deep learning techniques in the field due to the possibility for bypassing manual embedding creation and feature engineering. [2]. Multiple neural network solutions such as DNF-Net [3], TabNet [4] or MLP+ [2] have been introduced, all of which demonstrate performance comparable to GBDTs.
On the other hand, as we’ve described in previous studies [5], attention-based architectures, originally introduced to tackle NLP tasks, such as the Transformer [6] are constantly being adapted to solve a wider range of problems. One proposal is the TabTransformer [7] which focuses on using Multi-Head Self Attention blocks to model relationships between the categorical features in tabular data, transforming them into robust contextual embeddings. The transformed categorical features are concatenated with continuous values and then fed through a standard multilayer perceptron [8] (section 1.1). This way the TabTransformer significantly outperforms pure MLPs and recent deep networks (e.g. TabNet [4]) for tabular data. We believe that it is possible to further enhance its architecture by replacing the final MLP block with a gated multi-layer perceptron (gMLP) [9] - a simple MLP-based network with spatial gating projections, which aims to be on par with Transformers in terms of performance on sequential data (section 1.2).
In this paper we will present an enhanced version of the TabTransformer with incorporated gMLP block and the intuition behind it. Also multiple other architecture design decisions based on hyper parameter optimization experiments will be described.
1.1 The TabTransformer
The TabTransformer model, introduced in December 2020 by researchers at Amazon manages to outperform the other state-of-the-art deep learning methods for tabular data by at least 1.0% on mean AUROC. It consists of a column embedding layer, a stack of Transformer layers, and a multilayer perceptron (figure 2). The inputted tabular features are split in two parts for the categorical and continuous values. For each categorical feature the so called column embedding is performed (see [7]). It generates parametric embeddings which are inputted to a stack of Transformer layers. Each Transformer layer [6] consists of a multi-head self-attention layer followed by a position-wise feed-forward layer.
| (1) |
After the processing of categorical values , they are concatenated along with the continuous values to form a final feature vector which is inputted to a standard multilayer perceptron.
1.2 The gMLP
The gMLP model [9] introduces some simple yet really effective modifications to the standard multilayer perceptron. It consists of a stack of multiple identically structured blocks (figure 1) defined as follows:
| (2) |
| (3) |
| (4) |
where is an activation function (e.g. ReLU), and - linear projections along the channel dimension and is the so called spatial gating unit which captures spatial cross-token interactions. is a simplistic linear projection and represents element-wise multiplication. Usually the weights are initialized as near-zero values and the biases as ones at the beginning of training.
This structure does not require positional embeddings because relevant information will be captured in the gating units. From the original gMLP paper we can denote that the presented block layout is inspired by inverted bottlenecks which define as a spatial convolution [10].

gMLP has been proposed by Google in May 2021 as an alternative to Transformers for NLP and vision tasks having up to 66% less trainable parameters. In our study we will replace the pure MLP block in the TabTransformer with gMLP and test how well it can model tabular data and whether it is able to extract any additional information.
2 Related work
In recent years a lot of experiments have been conducted to test the applicability of standard MLPs for tabular modeling [11]. Multiple Transformer-based methods have been also used to fit tabular features [12], [13]. For example AutoInt [12] proposes multi-head self-attentive neural network to explicitly model the feature interactions in a low-dimensional space.
An extensive performance comparison of the most popular tabular models along with their advantages and disadvantages can be found in a paper from August 2021 [2]. It also features enhancements to AutoInt and MLPs such as the use of element-wise linear transformations (gating) followed by LeakyReLU activation. The intuition behind the gates implemented there is similar to the gMLP block in our architecture.
Another recently published paper [14] from June 2021, initially named "Regularization is all you Need", suggests that implementing various MLP regularization strategies in combination with some of the already described techniques has a potential for further performance boosts in deep networks for tabular problems.
3 Model
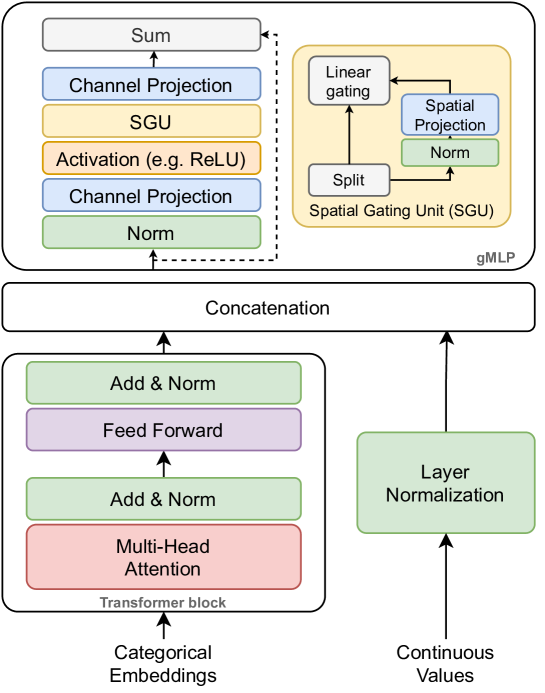
As described in section 1.1, column embeddings are generated from categorical data features. If continuous values are present in the dataset they are passed through a normalization layer.
The categorical embeddings are then processed by a Transformer block. In our case a Transformer block represents the encoder part of a typical Transformer [6]. It has two sub-layers - a multi-head self-attention mechanism, and a simple, positionwise fully connected feed-forward network.
As a final layer we have placed a slight modification of the original gMLP, called gMLP_Classification in our code. It is adapted to output classification logits and works best for optimization of cross entropy or binary cross entropy loss111https://pytorch.org/docs/stable/generated/torch.nn.BCELoss.html.
By stacking multiple Transformer blocks and gMLP structures we were able to outperform some state-of-the-art deep models. More details on how well this solution performs can be found in section 5.
Model implementation222Model implementation, experiments setup and dataset characteristics are publicly available on https://github.com/radi-cho/GatedTabTransformer. is done with the PyTorch [15] machine learning framework in a CUDA environment [16].
4 Experiments
To test the proposed architecture multiple experiments were conducted. Their main objective was to compare the standard TabTransformer’s performance to the proposed model.
4.1 Data
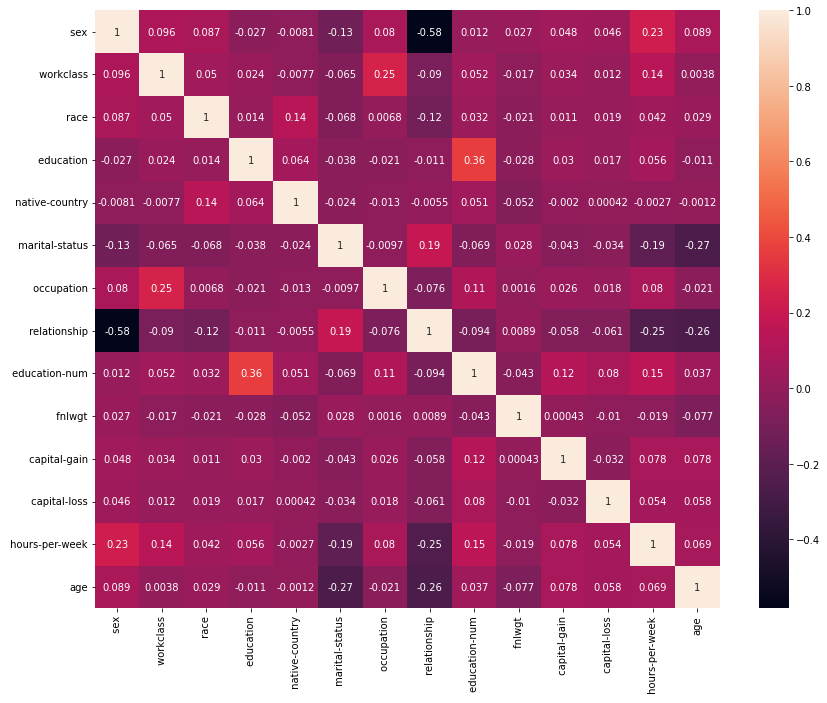
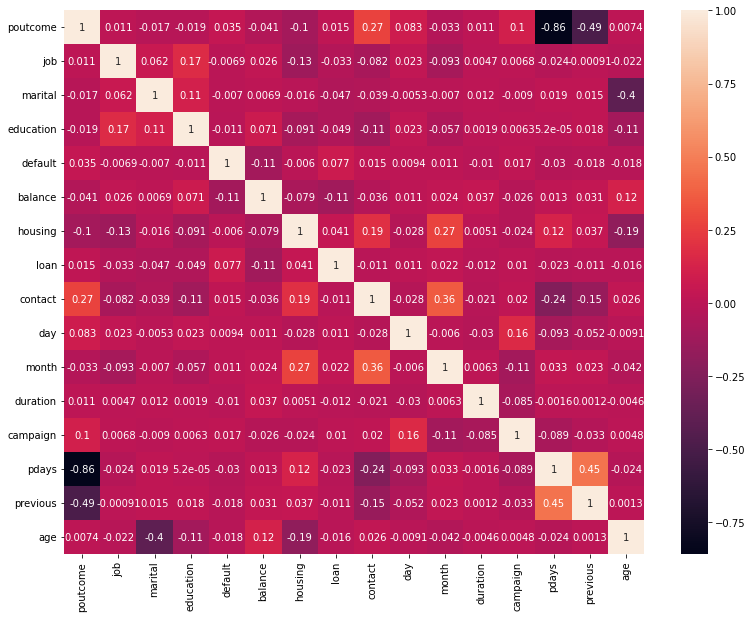
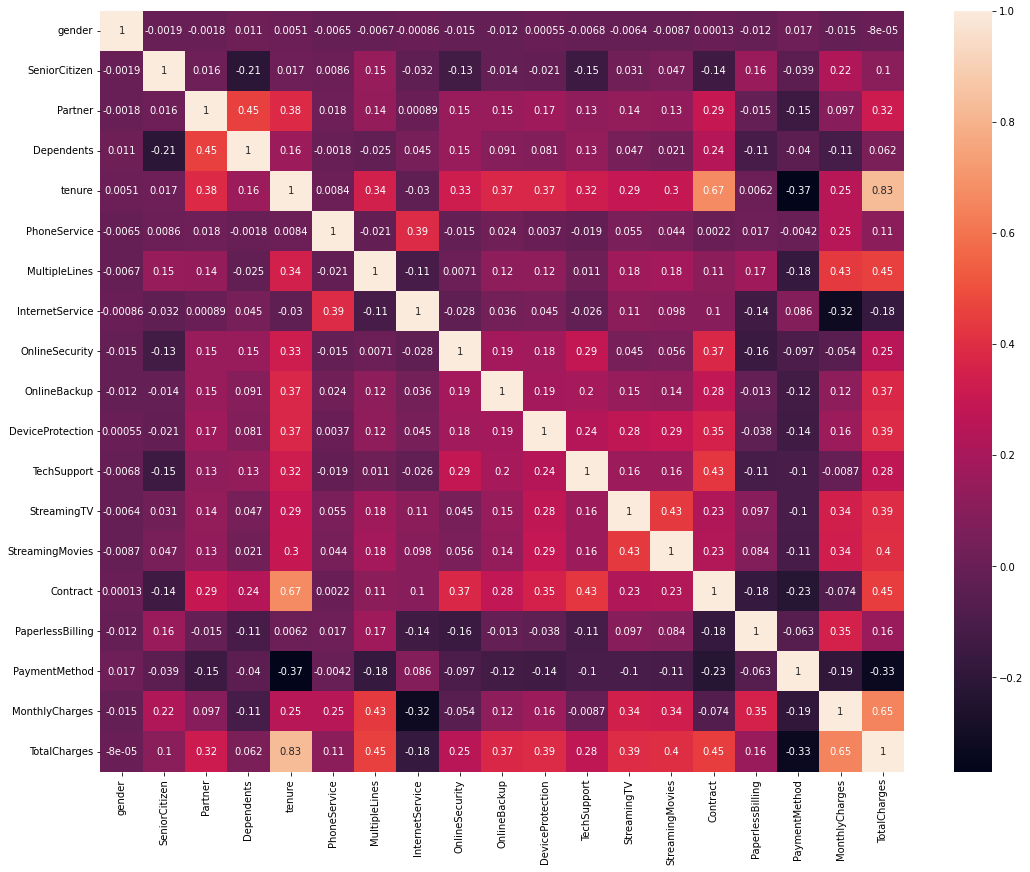
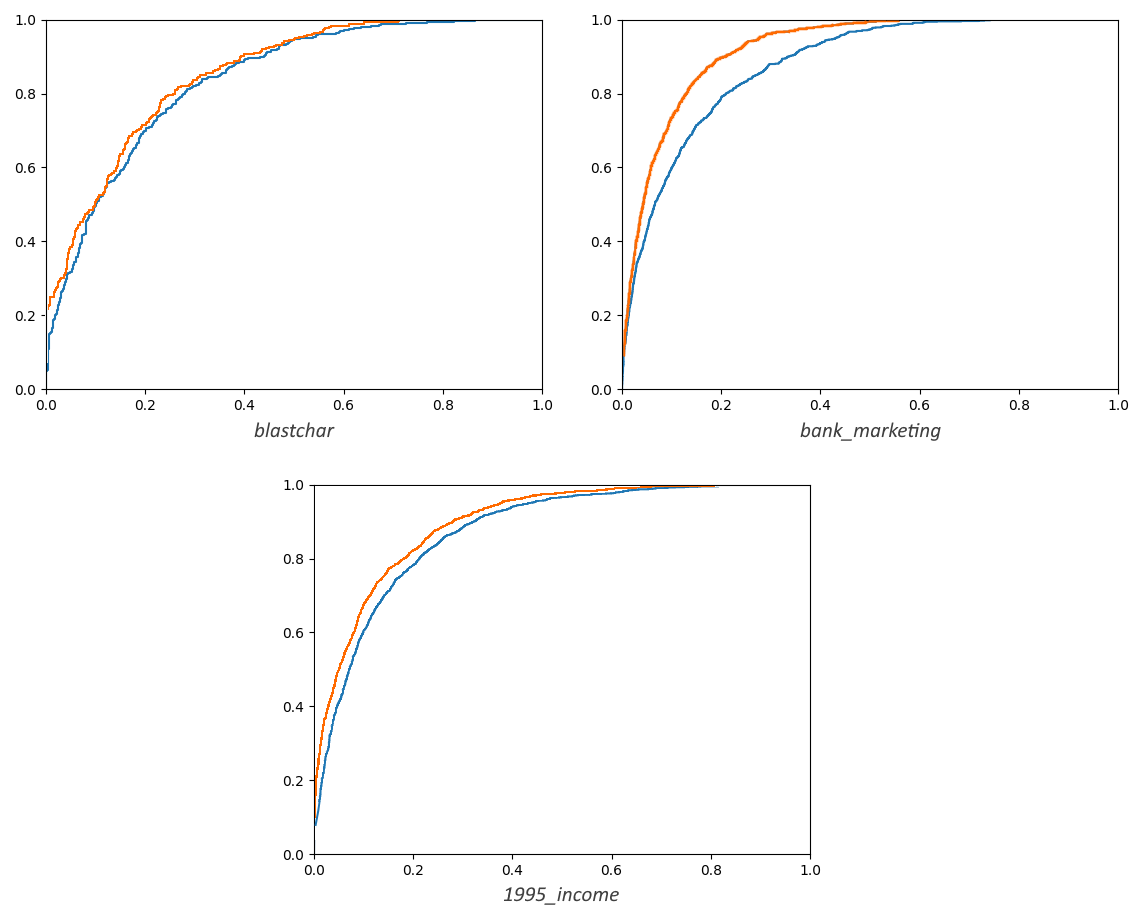
We made use of three main datasets for experimentation - namely blastchar, 1995_income from Kaggle333https://kaggle.com/, and bank_marketing from UCI repository444http://archive.ics.uci.edu/ml/index.php. Their size varies between 7K and 45K samples with 14 to 19 features. In all datasets the label values are binary, thus binary classification should be performed. These three sets are all also mentioned in the original TabTransformer paper [7]. Detailed data characteristics can be found in Appendix B.
Dataset splitting follows the 65/15/20% pattern for train/validation/test. The validation split is used to pick the best performing model state during training and the test split is only used to determine the final scores.
4.2 Hyper parameter optimization
To generate our results (section 5) we set up a simplified pipeline without the optional embedding pre-trainning or self-supervised learning steps described in [7]. As a first step we recreated the implementation of the original TabTransformer and fitted it to the mentioned datasets with manually selected hyper parameters. Secondly, tuning environment was created to find the best performing set of hyper parameters (initial learning rate, hidden layers count, hidden dimensions, dropouts, etc.) for each dataset.
Then we upgraded the TabTransformer as described in section 3 and repeated the HPO process again, finding the best set of parameters for the new model. More details on what parameter values were tested can be found in Appendix A. To avoid overfitting and to speed up training early stopping was implemented.
To train and tune our models efficiently we used the Ray Tune [19] Python library.
4.2.1 Learning rate and optimization objectives
A key parameter when training a ML model is learning rate555https://en.wikipedia.org/wiki/Learning_rate. In our experiments a learning rate scheduler666https://bit.ly/3lt15km was implemented to decay the initial rate by every step size and help for quicker convergence. Values for , and together with epoch count patience for early stopping were tuned with a grid search strategy. The process was executed separately for the gated and baseline TabTransformers.
4.2.2 Hidden layers and dimensions
Other important hyper parameters are count and dimensions of the hidden layers in either the MLP or gMLP and number of heads for the Multi-Head Attention. All of these were also tuned with Ray. Our findings suggest that by increasing the baseline model’s number of MLP neurons its performance peaks at a certain value and slowly decreases from that point onward, whereas the gMLP continues to increase its performance at small steps for much longer. For example if the two models perform equivalently well with hidden dimension of 32, increasing it to 128 is more likely to higher the performance of the gMLP TabTransformer compared to baseline.
4.2.3 Neuron Activation
Yet another aspect of optimization is to choose an activation function for the multilayer perceptorn neurons [20]. During tuning we tested ReLU, GELU, SELU and LeakyReLU777https://paperswithcode.com/method/leaky-relu with multiple options for its negative slope (Appendix A).
| (5) |
For both models LeakyReLU with slopes from 0.01 up to 0.05 and the standard ReLU performed with highest results. For simplicity and consistency we proceeded our work with standard ReLU activation. More about the effect of LeakyReLU can be found in the following study - [2].
5 Results
5.1 Performance evaluation metrics
For consistency with previously conducted studies we utilized area under receiver operating characteristic curve (AUROC)888https://en.wikipedia.org/wiki/Receiver_operating_characteristic as a performance evaluation technique [21]. The reported results are generated by training and evaluating a model configuration with the same parameters but with different seeds or randomized order of data samples multiple times (usually 5, 25 or 50), computing the mean AUROC and then comparing it to the mean scores of the other model configurations. For the TabNet model comparison expected gains were manually calculated based on the results reported in [7] and [2].
5.2 Performance comparisons
As a result of our proposals the GatedTabTransformer shows between 0.5% and 1.1% performance increase in terms of mean AUROC (figure 3) compared to the baseline TabTransformer and 1% to 2% increase compared to MLPs (table 1).
| Gain over | Gain over | Gain over | |
|---|---|---|---|
| Dataset | MLP | TabTransformer | TabNet |
| bank_marketing | 1.3 | 1.0 | 3.1 |
| 1995_income | 0.9 | 0.7 | 2.5 |
| blastchar | 0.4 | 0.5 | 1.6 |
6 Future work
A fruitful direction for further research would be to investigate the effects of combining our current solutions with some of the recent breakthroughs in regularization, feature engineering, etc.
As a long term direction we will be working on a custom AutoML999https://en.wikipedia.org/wiki/Automated_machine_learning pipeline focused on tabular data modeling. It will require the implementation of neural architecture search101010https://en.wikipedia.org/wiki/Neural_architecture_search strategies such as reinforcement learning or evolutionary algorithms [24] to test and discover new model designs. As a reference a paper titled "The Evolved Transformer" [25] by Google from 2019 should be mentioned. It describes how NAS can be used with a Transformer [6] as initial seed to discover more sophisticated architectures. Analogically TabNet, TabTransformer and other tabular models could be used as seeds in a potential NAS process. Additional embedding techniques and manipulated representations of the data (e.g. TaBERT [26], TabFormer [27]) can be incorporated as pre-processing steps.
7 Conclusion
In the presented study we have explored some modifications to the original TabTransformer [7] architecture which impact beneficially binary classification tasks for three separate datasets with more than 1% area under receiver operating characteristic curve gains. Linear projections inspired by gated multilayer perceptrons [9] have been proposed for the TabTransformer’s final MLP block where its final logits are generated. We have also conducted multiple hyper parameter optimization iterations during training to test the impact of different activation functions, learning rates, hidden dimensions and layer structures. These findings have significant importance when working with tabular predictions and we’ve open-sourced our model and applied it in practical use cases to further showcase their importance.
8 Acknowledgements
This paper is purposed to be a part of the 22-nd Student Conference of the High School Student Institute of Mathematics and Informatics - BAS.
We would like to thank Maria Vasileva and Petar Iliev for their helpful feedback.
References
- Chen and Guestrin [2016] Tianqi Chen and Carlos Guestrin. Xgboost: A scalable tree boosting system. In Proceedings of the 22nd acm sigkdd international conference on knowledge discovery and data mining, pages 785–794, 2016.
- Fiedler [2021] James Fiedler. Simple modifications to improve tabular neural networks. arXiv preprint arXiv:2108.03214, 2021.
- Abutbul et al. [2020] Ami Abutbul, Gal Elidan, Liran Katzir, and Ran El-Yaniv. Dnf-net: A neural architecture for tabular data. arXiv preprint arXiv:2006.06465, 2020.
- [4] SO Arik and T Pfister. Tabnet: Attentive interpretable tabular learning. arxiv 2019. arXiv preprint arXiv:1908.07442.
- Cholakov and Kolev [2021] Radostin Cholakov and Todor Kolev. Transformers predicting the future. applying attention in next-frame and time series forecasting. arXiv preprint arXiv:2108.08224, 2021.
- Vaswani et al. [2017] Ashish Vaswani, Noam Shazeer, Niki Parmar, Jakob Uszkoreit, Llion Jones, Aidan N Gomez, Łukasz Kaiser, and Illia Polosukhin. Attention is all you need. In Advances in neural information processing systems, pages 5998–6008, 2017.
- Huang et al. [2020] Xin Huang, Ashish Khetan, Milan W. Cvitkovic, and Zohar S. Karnin. Tabtransformer: Tabular data modeling using contextual embeddings. ArXiv, abs/2012.06678, 2020.
- Haykin [1994] Simon Haykin. Neural networks: a comprehensive foundation. Prentice Hall PTR, 1994.
- Liu et al. [2021] Hanxiao Liu, Zihang Dai, David R. So, and Quoc V. Le. Pay attention to mlps. ArXiv, abs/2105.08050, 2021.
- Sandler et al. [2018] Mark Sandler, Andrew Howard, Menglong Zhu, Andrey Zhmoginov, and Liang-Chieh Chen. Mobilenetv2: Inverted residuals and linear bottlenecks. In Proceedings of the IEEE conference on computer vision and pattern recognition, pages 4510–4520, 2018.
- de Brebisson and Montana [2015] Alexander de Brebisson and Giovanni Montana. Deep neural networks for anatomical brain segmentation. In Proceedings of the IEEE conference on computer vision and pattern recognition workshops, pages 20–28, 2015.
- Li et al. [2020] Zeyu Li, Wei Cheng, Yang Chen, Haifeng Chen, and Wei Wang. Interpretable click-through rate prediction through hierarchical attention. In Proceedings of the 13th International Conference on Web Search and Data Mining, pages 313–321, 2020.
- Sun et al. [2019] Qiang Sun, Zhinan Cheng, Yanwei Fu, Wenxuan Wang, Yu-Gang Jiang, and Xiangyang Xue. Deepenfm: Deep neural networks with encoder enhanced factorization machine. 2019.
- Kadra et al. [2021] Arlind Kadra, Marius Lindauer, Frank Hutter, and Josif Grabocka. Well-tuned simple nets excel on tabular datasets. In Thirty-Fifth Conference on Neural Information Processing Systems, 2021.
- et al. [2019] Paszke et al. Pytorch: An imperative style, high-performance deep learning library. In Advances in Neural Information Processing Systems 32, pages 8024–8035. Curran Associates, Inc., 2019.
- NVIDIA et al. [2020] NVIDIA, Péter Vingelmann, and Frank H.P. Fitzek. Cuda, release: 10.2.89, 2020. URL https://developer.nvidia.com/cuda-toolkit.
- Wes McKinney [2010] Wes McKinney. Data Structures for Statistical Computing in Python. In Stéfan van der Walt and Jarrod Millman, editors, Proceedings of the 9th Python in Science Conference, pages 56 – 61, 2010. doi: 10.25080/Majora-92bf1922-00a.
- Waskom [2021] Michael L. Waskom. seaborn: statistical data visualization. Journal of Open Source Software, 6(60):3021, 2021. doi: 10.21105/joss.03021. URL https://doi.org/10.21105/joss.03021.
- Liaw et al. [2018] Richard Liaw, Eric Liang, Robert Nishihara, Philipp Moritz, Joseph E Gonzalez, and Ion Stoica. Tune: A research platform for distributed model selection and training. arXiv preprint arXiv:1807.05118, 2018.
- Xu et al. [2015] Bing Xu, Naiyan Wang, Tianqi Chen, and Mu Li. Empirical evaluation of rectified activations in convolutional network. arXiv preprint arXiv:1505.00853, 2015.
- Bradley [1997] Andrew P Bradley. The use of the area under the roc curve in the evaluation of machine learning algorithms. Pattern recognition, 30(7):1145–1159, 1997.
- Pedregosa et al. [2011] F. Pedregosa, G. Varoquaux, A. Gramfort, V. Michel, B. Thirion, O. Grisel, M. Blondel, P. Prettenhofer, R. Weiss, V. Dubourg, J. Vanderplas, A. Passos, D. Cournapeau, M. Brucher, M. Perrot, and E. Duchesnay. Scikit-learn: Machine learning in Python. Journal of Machine Learning Research, 12:2825–2830, 2011.
- Hunter [2007] J. D. Hunter. Matplotlib: A 2d graphics environment. Computing in Science & Engineering, 9(3):90–95, 2007. doi: 10.1109/MCSE.2007.55.
- Elsken et al. [2019] Thomas Elsken, Jan Hendrik Metzen, and Frank Hutter. Neural architecture search: A survey. The Journal of Machine Learning Research, 20(1):1997–2017, 2019.
- So et al. [2019] David So, Quoc Le, and Chen Liang. The evolved transformer. In International Conference on Machine Learning, pages 5877–5886. PMLR, 2019.
- Yin et al. [2020] Pengcheng Yin, Graham Neubig, Wen-tau Yih, and Sebastian Riedel. Tabert: Pretraining for joint understanding of textual and tabular data. arXiv preprint arXiv:2005.08314, 2020.
- Padhi et al. [2021] Inkit Padhi, Yair Schiff, Igor Melnyk, Mattia Rigotti, Youssef Mroueh, Pierre Dognin, Jerret Ross, Ravi Nair, and Erik Altman. Tabular transformers for modeling multivariate time series. In ICASSP 2021-2021 IEEE International Conference on Acoustics, Speech and Signal Processing (ICASSP), pages 3565–3569. IEEE, 2021.
- Song et al. [2019] Weiping Song, Chence Shi, Zhiping Xiao, Zhijian Duan, Yewen Xu, Ming Zhang, and Jian Tang. Autoint: Automatic feature interaction learning via self-attentive neural networks. In Proceedings of the 28th ACM International Conference on Information and Knowledge Management, pages 1161–1170, 2019.
Appendix A HPO parameters
-
•
Learning rates: 0.05, 0.01, 0.005, 0.001, 0.0005
-
•
Step sizes for learning rate scheduler: 5, 10, 15 epochs
-
•
Learning rate scheduler slope (gamma): 0.1, 0.2, 0.5
-
•
Dropout: 0.0, 0.1, 0.2, 0.5
-
•
TabTransformer number of heads: 4, 8, 12, 16
-
•
MLP/gMLP number of hidden layers (depth): 2, 4, 6, 8
-
•
MLP/gMLP dimensions: 8, 16, 32, 64, 128, 256
Appendix B Data description
| Total | Categorical | Continous | Positive | ||
|---|---|---|---|---|---|
| Dataset | Datapoints | Features | Features | Features | Class % |
| bank_marketing | 16 | 11 | 5 | 11.7 | |
| 1995_income | 14 | 9 | 5 | 24.1 | |
| blastchar | 19 | 17 | 2 | 26.5 |
| Dataset Name | URL |
|---|---|
| 1995_income | https://www.kaggle.com/lodetomasi1995/income-classification |
| bank_marketing | https://archive.ics.uci.edu/ml/datasets/bank+marketing |
| blastchar | https://www.kaggle.com/blastchar/telco-customer-churn |