Hot Brownian motion of optically levitated nanodiamonds
Abstract
The Brownian motion of a particle hotter than its environment is an iconic out-of-equilibrium system. Its study provides valuable insights into nanoscale thermal effects. Notably, it supplies an excellent diagnosis of thermal effects in optically levitated particles, a promising platform for force sensing and quantum physics tests. Thus, understanding the relevant parameters in this effect is critical. In this context, we test the role of particle’s shape and material, using optically levitated nanodiamonds hosting NV centers to measure the particles’ internal temperature and center-of-mass dynamics. We present a model to assess the nanodiamond internal temperature from its dynamics, adaptable to other particles. We also demonstrate that other mechanisms affect the nanodiamond dynamics and its stability in the trap. Finally, our work, by showing levitating nanodiamonds as an excellent tool for studying nano-thermal effects, opens prospects for increasing the trapping stability of optically levitated particles.
Paris Saclay University] Université Paris-Saclay, ENS Paris-Saclay, CNRS, CentraleSupélec, LuMIn, 91190 Gif-sur-Yvette, France
Introduction
Providing efficient isolation from the environment, optical levitation in vacuum has proven to be an excellent system for investigations of quantum physics at the mesoscale 1, 2, 3, for the tests of fundamental physical laws and weak forces sensing 4, and a unique testbed for stochastic thermodynamics 5. These exciting developments lie in the ability to control the particle’s dynamics finely. Thus, understanding the parameters affecting this dynamics is of prime interest. Specifically, it is known that the particle’s internal temperature may affect its dynamics, an effect known as hot Brownian motion 6, 7 and recently studied for levitated silica nanospheres 8, 9. Nevertheless, this effect is expected to depend on the particles’ shape and material 7, 10. Quantifying these effects is of fundamental interest for describing thermal effects at the nanoscale and for the development of nanothermometry techniques 8, 11, 12.
To study the effect of nanodiamonds’ internal temperature on their dynamics, we use optically levitated nanodiamonds doped with NV centers. Nanodiamonds are particles with disparate shapes 13, 14 that generally present important internal heating induced by laser absorption in levitation experiments 13, 15, an effect particularly significant for optical levitation due to the required high power trapping laser. NV centers are point defects of the diamond matrix, with unique spin and optical properties that can act as efficient temperature sensors 16. In the present paper, we first study the dynamics of optically trapped nanodiamonds in moderate vacuum (> 10 hPa) and assess the energy associated with their center-of-mass motion. Then, we use NV centers thermometry to evaluate their internal temperature . By comparing these two quantities, we describe the coupling between nanodiamonds’ internal temperature and dynamics and discuss how the diamond shape impacts it. These results allow us to assess the accommodation coefficient for nanodiamonds, a quantity challenging to measure at the single-particle level, underlining the power of levitodynamics for material science studies. Also, we introduce a simple method to quantify the internal temperature of a levitated nanodiamond from the measurement of its dynamics, with applications to nanothermometry of non-spherical nanoparticles 11, 12. Finally, we demonstrate that phenomena beyond particles’ internal temperature impact the nanodiamond dynamics, potentially affecting the particle stability in the trap. Since mastering this particle stability is a critical task for developing diamond-based hybrid spin-mechanical levitated systems 17, our study also opens prospects beyond out of equilibrium physics of hot particles.
1 Results and discussion
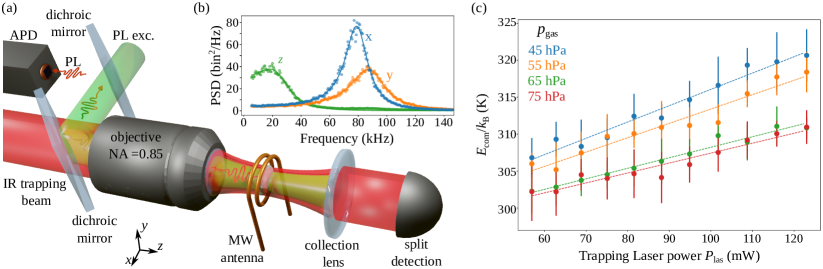
To study the dynamics of optically levitated nanodiamonds, we use the experimental setup depicted in figure 1-(a). A 100-nm nanodiamond (FND Biotech, brFND-100) is optically trapped inside a vacuum chamber, using a highly focused m laser (Keopsys). The gas pressure in the chamber is finely controlled with a manual valve and measured with a capacitance gauge (Pfeiffer vacuum, CMR 361). We measure the nanodiamond dynamics using a standard common path interferometric detection scheme 18. The particle’s forward scattered light is collected using a collimating lens and redirected onto three split detectors to measure the particle motion along the three axes . Typical power spectral densities (PSD) measured from a levitated nanodiamond are shown in figure 1-(b). Assuming a harmonic motion in the underdamped regime, we fit these PSDs for each axis with the function 19:
| (1) |
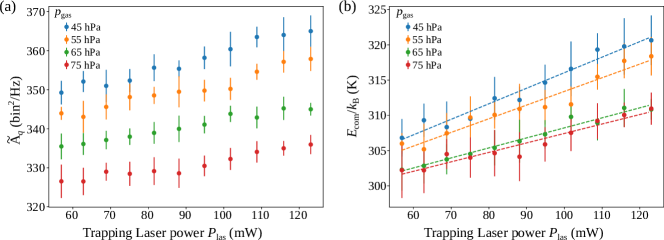
and retrieve the natural frequency of the trap , the damping rate , and the integrated power density of the motion. The energy of the center-of-mass motion is proportional to the integrated power spectral density of the particle motion 19, such that, in the direction , . is a calibration factor related to the efficiency of the detection setup. It depends on our experimental configuration, detectors efficiency, and the laser measurement beam power. Here, we account for the latter by renormalizing the power spectral density by the laser power changes (see Supporting Information). Experimentally, the -axis motion is at a lower frequency due to the weaker confinement along the optical axis. Thus, for most data sets, the -frequency is smaller than the PSD linewidth, making its analysis challenging. Hence, we only address the particle motion along the and directions in the following. In agreement with previous reports 20, 21, we observe that nanodiamonds are stably trapped down to a few tens of hPa and are generally lost from the trap at a pressure between 1 to 10 hPa.
Usually, one assumes that the particle is at room temperature to determine the calibration factor and quantitatively determine the center-of-mass energy. Under this assumption, the center-of-mass energy is the thermal energy , where is the Boltzmann constant and K is the room temperature. In our experiment, since the center-of-mass energy is expected to increase with the laser power, the particle is inherently out-of-equilibrium. While alternative calibration methods have been used 22, we propose here a novel and simple calibration approach to overcome the difficulties imposed by the non-equilibrium situation. We thus record the dynamics of the levitated nanodiamond for increasing laser powers. We then compute and fit the associated PSDs to determine the value of as a function of the trapping laser power (see Supporting Figure S1). To reduce uncertainties, we average the values of over ten successive measurements while ramping the laser power. Finally, from a linear extrapolation to vanishing laser powers, where we expect the particle to be at equilibrium with its environment, we determine the calibration factor:
| (2) |
Note that a benefit from this procedure is that we independently determine the calibration factor at each pressure, overcoming calibration uncertainties related to experimental drifts induced by pressure changes inside the chamber 23.
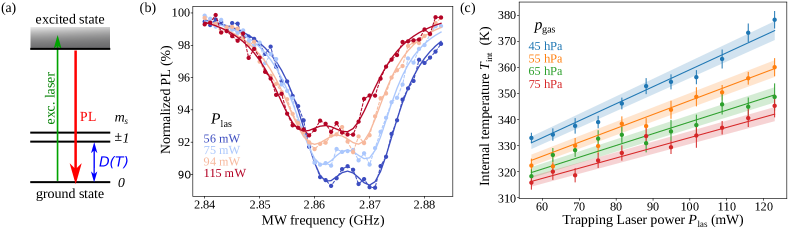
From this calibration, we can determine the center-of-mass energy of the particle. We observe a rise of the center-of-mass energy with increasing laser power and decreasing gas pressures, as plotted in figure 1-(c). This effect can be attributed to an increase of the nanodiamond internal temperature, which will affect its dynamics, as expected for hot Brownian motion 8. To verify this hypothesis and quantify the link between the observed effect and the nanodiamond internal temperature, we measure this temperature using NV color centers hosted in the diamond matrix 21, 24, 15. The trapped nanodiamonds are heavily doped with thousands of NV color centers. Its electronic structure, displayed in figure 2-(a), provides a bright and stable red photoluminescence (PL) under green laser excitation. In addition, its ground state is a spin-triplet , where the exact splitting between the spin sublevels and is temperature-dependent, its dependence being empirically described by a polynomial function 16, 21, 15. Thus, NV centers can be used as sensitive thermometers. The PL being spin-dependent, we can optically detect the electron spin resonance (ESR) of the NV centers and precisely determine the evolution of with temperature. Experimentally, we excite the NV centers in the levitated nanodiamond using a green laser (Laser Quantum GEM, nm, laser power µW mW) through the trapping objective. The weak excitation power that we use prevents heating of the nanodiamond by the green laser absorption. The related photoluminescence (PL) is collected through the same objective, split from the trapping and the green excitation lasers using two dichroic mirrors, and sent onto an avalanche photodiode (APD) in the single-photon counting regime. A copper wire rolled around the optical trap acts as a microwave antenna (fig. 1-(a)). We record ESR spectra by measuring the PL of the NV centers while sweeping the applied microwave frequency for different trapping laser power. As shown in figure 2-(b), we observe a clear shift of the ESR spectra, highlighting the nanodiamond crystal’s heating. From the empirical law proposed by Toyli et al. 16, we quantitatively assess the internal temperature of the levitated nanodiamond. Given the small size of the nanodiamond and its high thermal conductivity, we assume that its internal temperature is homogeneous and corresponds to the particle surface temperature. In the pressure regime explored here, the internal temperature arises from the competition between absorption of the trapping laser and thermal conduction 21, such that it scales as
| (3) |
as demonstrated in figure 2-(c). A fit acting on both gas pressure and laser power, allows us to extract the heating rate and . In practice, internal strain in the nanodiamonds may shift the value of the zero-field splitting , leading to a definition of the internal temperature within a constant. This effect is corrected by shifting the measured temperatures such that the value of returned by the fit is equal to the room temperature 21. Data and fits in figure 2-(c) are corrected from this effect and present quantitative values of the diamond internal temperature.
Thus, our experimental setup allows us to simultaneously assess the energy of the nanodiamond center-of-mass and its internal temperature. To quantify the coupling between these two quantities, we introduce the coefficient such that
| (4) |
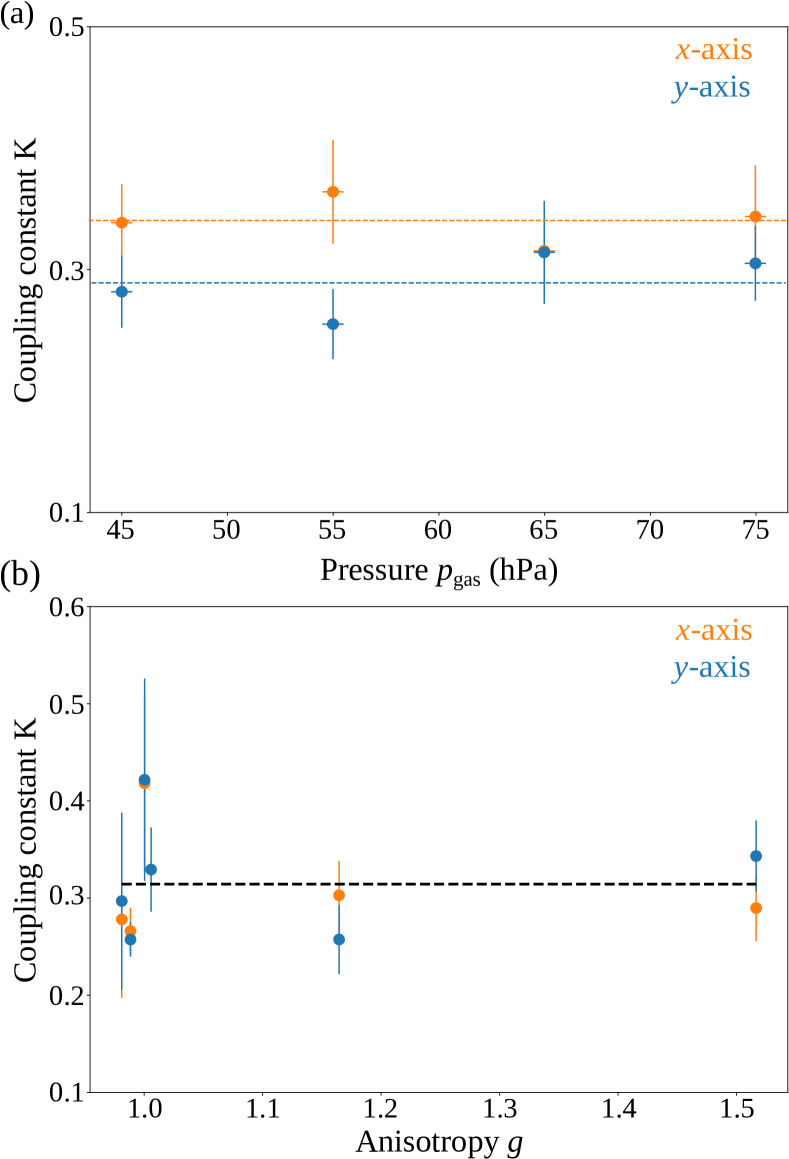
with the increase in center-of-mass energy corresponding to an increase in internal temperature . Since we have shown that, under our experimental conditions, both the center-of-mass energy and internal temperature increase linearly with laser power, is independent of the laser power. Also, it corresponds to the ratio of slopes of the curves in figures 1-(c) and 2-(c). As an example, figure 3-(a) presents the value of this coupling for the nanodiamond used in figures 1-(c) and 2-(c).
It is interesting to note that the value of is independent of the gas pressure and relatively similar for the two axes and . This result can be discussed in light of the two baths formalism introduced by Millen et al. 8 to describe the coupling of the internal temperature of a spherical levitated particle to its center-of-mass motion. In this model, the coupling is mediated by the interaction of the surrounding gas on the hot particle surface. Initially with thermal energy associated with the room temperature , the impinging gas molecules on the hot particle will see the accommodation of their thermal energy when scattered by the hot particle surface. In return, these emerging heated particles will contribute to the particle Brownian motion, as an ancillary thermal bath of effective emerging temperature . The strength of this effect is quantified through the thermal accommodation coefficient , which describes the average fraction of the surface temperature which is transferred to the gas molecules during a collision with the hot particle. It varies from , where all gas molecules are elastically reflected, to , where all gas molecules get an increase of their thermal energy to after the collision. As such, it is a convenient coefficient to describe the interaction of the particle with its environment. Nevertheless, it depends on the particle materials and the surrounding gas, and its determination at the single nanoparticles level is generally challenging. In the case of levitated silica spheres in vacuum, Hebestreit et al. presented an approach to estimate the accommodation coefficient of nano-silica, inferring the internal temperature of the levitated particle from the thermal changes of its physical properties and its relaxation dynamics after a controlled heating 9. However, this characterization can not be straightforwardly applied to any particles. In our experiment, knowing the coupling constant , we can estimate the accommodation coefficient from a linearisation of the two bath model, leading to (see Supporting Information). Thus, from the fits in figure 3-(a), we find a nanodiamond accommodation coefficient for the -axis and for the -axis. Interestingly, we find values very close to the maximal value of , corresponding to the largest coupling possible between the particle Brownian motion and its internal temperature. While we could expect such an excellent thermal accommodation coefficient for bulk diamond, the quality of the diamond surface, i.e., graphitization 14, may drastically reduce the accommodation, an effect we do not observe. Also, we note that accounting for the uncertainties, we observe thermal accommodation coefficients that are slightly above 1 and not isotropic (). We explain this effect because the model is designed for spherical particles. At the same time, the used nanodiamonds, made from bulk diamond milling, are known to present very irregular shapes 13, 14, a parameter that is expected to impact the coupling of the levitated particle to the surrounding gas molecules 25 (see Supporting Information).
To study further the impact of the particle shape on the coupling coefficient , we reproduce the previously described procedure on a batch of nanodiamonds. To characterize the shape of these nanodiamonds, we determine, from the PSD fits, the damping rate of the particle along the and axes. This damping arises from a Stokes drag and is related to the particle effective surface in the particle motion direction 25. While not providing quantitative information about the exact particle shape, the measurement of the ratio is a good indicator of the particle anisotropy. As a good example, the libration mode of levitated nanodiamonds has only been observed for particles with -ratio away from one 13. Also, note that we only observe due to the orientation of the longer axis of the particle along the polarization direction 13.
We plot in figure 3-(b) the coupling constant as a function of the anisotropy -factor. We observe slight variations on the measured values of and the discrepancy between axes remains smaller than the dispersion among different particles. Accounting for this dispersion, both over the studied particles and axes, we estimate an average value of . Therefore, for most investigated nanodiamonds, the coupling between internal temperature and center-of-mass dynamics can be relatively well described by the spherical particle formalism with an accommodation coefficient close from . Also, the relatively small dispersion we observe for the value of may be used to provide a reasonable estimate of any nanodiamond internal temperature from its dynamics using a Hot Brownian coupling constant . This could be particularly helpful to assess the absorption of particles that are not hosting spin-active defects 11.
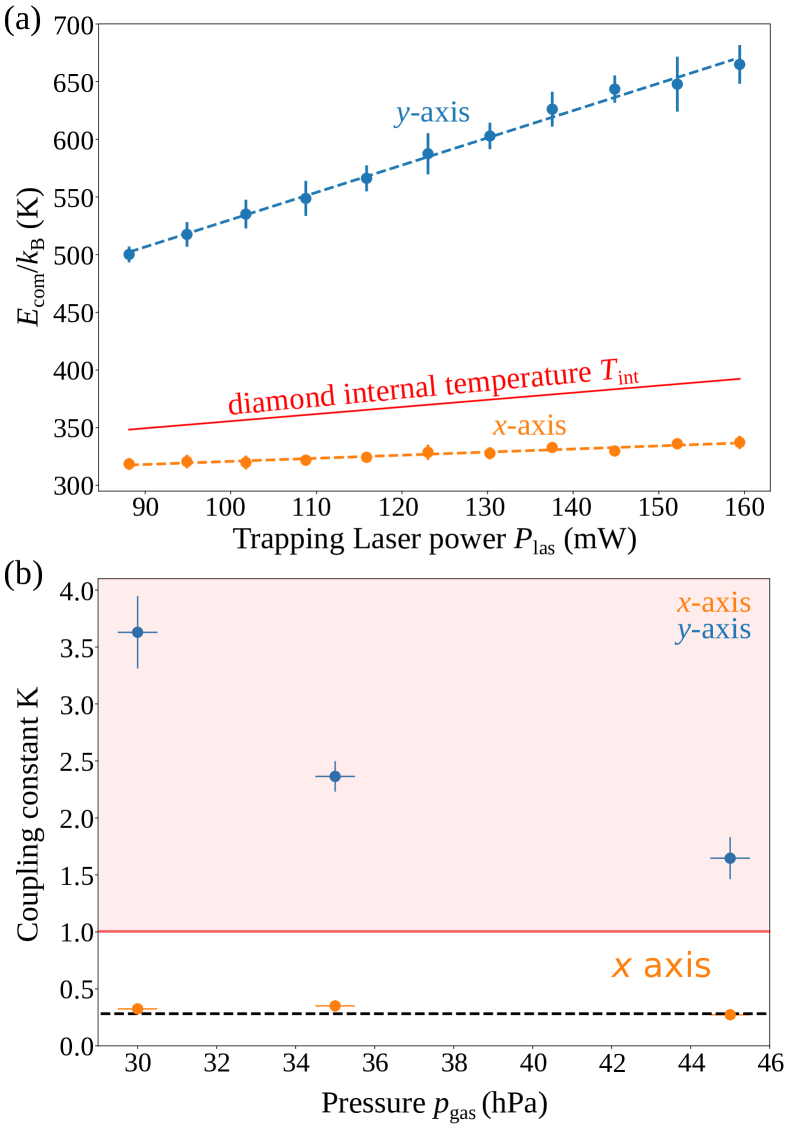
While this proposed model applies to six over the eight studied particles, we observe an unexpected anisotropic over-heating of the diamond center-of-mass energy for the remaining two. Figure 4-(a) shows the measured energy of the center-of-mass for one of these particles. While estimating the coupling coefficient , it appears that it reaches values far above one, along the -axis, while keeping an expected value of along the -axis. Also, as shown in figure 4-(b), the value of along the -axis increases while the gas pressure is reduced, conversely to what we observe for the -axis or the particles in figure 3. The measured is definitive proof that the increase in center-of-mass energy can not be explained only by the diamond internal temperature and is proof that other heating mechanisms exist. The fact that we reproduce each measurement ten times at each pressure rules out a time-dependent change, such as a particle degradation 14 that would modify our measurement over time. In addition, these "over-heated" particles present neither a size, a laser absorption (), nor an anisotropy ratio further away from the particles shown in figure 3-(b) (see Supporting Information). Recently, center-of-mass heating mechanisms have been identified for levitated silica 26 and birefringent 27 micro-particles involving non-conservative interactions. However, in both cases, the particle is coherently driven, leading to a reduction of the PSDs linewidths, an effect we do not observe here. Alternatively, the random shape of the nanodiamonds may also induce non-trivial dynamics. Recent numerical studies have highlighted that optical trapping may become unstable for given random particle shapes, even for particle sizes small compared to the laser wavelength 28. A complete understanding of this effect would require determining the exact particle shape, either by on-demand trapping or using nanofabricated diamond particles of controlled shapes and aspect ratios 29. Besides, it would be beneficial to monitor and control most of the degrees of freedom of the particle dynamics 30 since the complex dynamics potentially arises from the coupling of different degrees of freedom. Finally, beyond the nature of this heating mechanism, which is not driven by the particle’s internal temperature, an important question is to know if this phenomenon exists for all nanodiamonds but with variable strengths. In such a case, reducing the absorption of the nanodiamond, e.g., using ultrapure diamond 11, will not be sufficient to keep levitated nanodiamonds dynamics at equilibrium with its environment, thus eventually limiting its stability in the trap.
Conclusion
Taking advantage of the unique spin features of NV color centers in optically levitated nanodiamonds, we simultaneously measure these nanodiamonds’ internal temperature and center-of-mass energy. We then show that the coupling between these quantities is only weakly affected by the shapes of nanodiamonds and corresponds to a hot Brownian coupling constant in our model. Equivalently, it can be well described by the two baths formalism introduced by Millen et al. 8 for spherical particles, with an accommodation coefficient for the nanodiamond surface close to . These results provide a simple way to assess the internal temperature of non-spherical nanodiamonds from the measurement of their Brownian dynamics with moderate errors. They also demonstrate NV doped nanodiamonds as a powerful tool to study thermal effects at the nanoscale. A natural extension of our work would be investigating the accommodation coefficient dependence on the particle size 31 or the hot Brownian motion for other degrees of freedom such as rotation and libration 10, 25.
Besides, we also report a new center-of-mass heating mechanism that is anisotropic and not driven by the internal temperature. We observe this mechanism on only a fourth of the studied particles, and we attribute it to a complex dynamics linked to the nanodiamonds’ random shapes. We highlight that this heating mechanism may contribute to the nanodiamond exit from the optical trap at medium vacuum pressure, along with the particles’ internal heating. Thus, careful understanding and control of the internal temperature and of the center-of-mass and rotational motion of the levitated nanodiamonds are required to reach higher vacuum conditions and unleash the potential of levitated nanodiamonds for quantum spin-mechanics experiments 17.
Acknowledgments
We thank E. Fayen and C. Fournier for their seminal contribution to experimental developments.
Funding Sources
This work is supported by the Investissements d’Avenir of LabEx PALM (ANR-10-LABX-0039-PALM), by the Paris île-de-France Region in the framework of DIM SIRTEQ, and by the ANR OPLA project (ANR-20-CE30-0014).
References
- Delić et al. 2020 Delić, U.; Reisenbauer, M.; Dare, K.; Grass, D.; Vuletić, V.; Kiesel, N.; Aspelmeyer, M. Cooling of a Levitated Nanoparticle to the Motional Quantum Ground State. Science 2020, 367, 892–895
- Magrini et al. 2021 Magrini, L.; Rosenzweig, P.; Bach, C.; Deutschmann-Olek, A.; Hofer, S. G.; Hong, S.; Kiesel, N.; Kugi, A.; Aspelmeyer, M. Real-Time Optimal Quantum Control of Mechanical Motion at Room Temperature. Nature 2021, 595, 373–377
- Tebbenjohanns et al. 2021 Tebbenjohanns, F.; Mattana, M. L.; Rossi, M.; Frimmer, M.; Novotny, L. Quantum Control of a Nanoparticle Optically Levitated in Cryogenic Free Space. Nature 2021, 595, 378–382
- Moore and Geraci 2021 Moore, D. C.; Geraci, A. A. Searching for New Physics Using Optically Levitated Sensors. Quantum Sci. Technol. 2021, 6, 014008
- Gieseler and Millen 2018 Gieseler, J.; Millen, J. Levitated Nanoparticles for Microscopic Thermodynamics—A Review. Entropy 2018, 20, 326
- Rings et al. 2010 Rings, D.; Schachoff, R.; Selmke, M.; Cichos, F.; Kroy, K. Hot Brownian Motion. Phys. Rev. Lett. 2010, 105, 090604
- Falasco et al. 2014 Falasco, G.; Gnann, M. V.; Rings, D.; Kroy, K. Effective Temperatures of Hot Brownian Motion. Phys. Rev. E 2014, 90, 032131
- Millen et al. 2014 Millen, J.; Deesuwan, T.; Barker, P.; Anders, J. Nanoscale temperature measurements using non-equilibrium Brownian dynamics of a levitated nanosphere. Nat. Nano. 2014, 9, 425–429
- Hebestreit et al. 2018 Hebestreit, E.; Reimann, R.; Frimmer, M.; Novotny, L. Measuring the Internal Temperature of a Levitated Nanoparticle in High Vacuum. Phys. Rev. A 2018, 97, 043803
- Rodríguez-Sevilla et al. 2018 Rodríguez-Sevilla, P.; Arita, Y.; Liu, X.; Jaque, D.; Dholakia, K. The Temperature of an Optically Trapped, Rotating Microparticle. ACS Photonics 2018, 5, 3772–3778
- Frangeskou et al. 2018 Frangeskou, A. C.; Rahman, A.; Gines, L.; Mandal, S.; Williams, O. A.; Barker, P. F.; Morley, G. Pure nanodiamonds for levitated optomechanics in vacuum. New J. Phys. 2018, 20, 043016
- Rahman and Barker 2017 Rahman, A. T. M. A.; Barker, P. F. Laser Refrigeration, Alignment and Rotation of Levitated Yb 3+ :YLF Nanocrystals. Nat. Photonics 2017, 11, 634–638
- Hoang et al. 2016 Hoang, T. M.; Ma, Y.; Ahn, J.; Bang, J.; Robicheaux, F.; Yin, Z.-Q.; Li, T. Torsional Optomechanics of a Levitated Nonspherical Nanoparticle. Phys. Rev. Lett. 2016, 117, 123604
- Rahman et al. 2016 Rahman, A.; Frangeskou, A.; Kim, M.; Bose, S.; Morley, G.; Barker, P. Burning and graphitization of optically levitated nanodiamonds in vacuum. Sci. Rep. 2016, 6, 1–7
- Delord et al. 2017 Delord, T.; Nicolas, L.; Bodini, M.; Hétet, G. Diamonds Levitating in a Paul Trap under Vacuum: Measurements of Laser-Induced Heating via NV Center Thermometry. Appl. Phys. Lett. 2017, 111, 013101
- Toyli et al. 2012 Toyli, D.; Christle, D.; Alkauskas, A.; Buckley, B.; Van de Walle, C.; Awschalom, D. Measurement and control of single nitrogen-vacancy center spins above 600 K. Phys. Rev. X 2012, 2, 031001
- Perdriat et al. 2021 Perdriat, M.; Pellet-Mary, C.; Huillery, P.; Rondin, L.; Hétet, G. Spin-Mechanics with Nitrogen-Vacancy Centers and Trapped Particles. Micromachines 2021, 12, 651
- Gieseler et al. 2012 Gieseler, J.; Deutsch, B.; Quidant, R.; Novotny, L. Subkelvin Parametric Feedback Cooling of a Laser-Trapped Nanoparticle. Phys. Rev. Lett. 2012, 109, 103603
- Hebestreit 2017 Hebestreit, E. Thermal Properties of Levitated Nanoparticles. Ph.D. Thesis, ETH Zurich, 2017
- Neukirch et al. 2015 Neukirch, L. P.; von Haartman, E.; Rosenholm, J. M.; Vamivakas, A. N. Multi-Dimensional Single-Spin Nano-Optomechanics with a Levitated Nanodiamond. Nat. Photon. 2015, 9, 653–657
- Hoang et al. 2016 Hoang, T. M.; Ahn, J.; Bang, J.; Li, T. Electron spin control of optically levitated nanodiamonds in vacuum. Nat. Commun. 2016, 7, 1–8
- Millen et al. 2020 Millen, J.; Monteiro, T. S.; Pettit, R.; Vamivakas, A. N. Optomechanics with Levitated Particles. Rep. Prog. Phys. 2020, 83, 026401
- Hebestreit et al. 2018 Hebestreit, E.; Frimmer, M.; Reimann, R.; Dellago, C.; Ricci, F.; Novotny, L. Calibration and Energy Measurement of Optically Levitated Nanoparticle Sensors. Rev. Sci. Instrum. 2018, 89, 033111
- Pettit et al. 2017 Pettit, R. M.; Neukirch, L. P.; Zhang, Y.; Vamivakas, A. N. Coherent Control of a Single Nitrogen-Vacancy Center Spin in Optically Levitated Nanodiamond. J. Opt. Soc. Am. B 2017, 34, C31–C35
- Martinetz et al. 2018 Martinetz, L.; Hornberger, K.; Stickler, B. A. Gas-Induced Friction and Diffusion of Rigid Rotors. Phys. Rev. E 2018, 97, 052112
- Svak et al. 2018 Svak, V.; Brzobohatý, O.; Šiler, M.; Jákl, P.; Kaňka, J.; Zemánek, P.; Simpson, S. H. Transverse Spin Forces and Non-Equilibrium Particle Dynamics in a Circularly Polarized Vacuum Optical Trap. Nat. Commun. 2018, 9, 5453
- Arita et al. 2020 Arita, Y.; Simpson, S. H.; Zemánek, P.; Dholakia, K. Coherent Oscillations of a Levitated Birefringent Microsphere in Vacuum Driven by Nonconservative Rotation-Translation Coupling. Sci. Adv. 2020, 6, eaaz9858
- Herranen et al. 2019 Herranen, J.; Markkanen, J.; Videen, G.; Muinonen, K. Non-Spherical Particles in Optical Tweezers: A Numerical Solution. PLOS ONE 2019, 14, e0225773
- Radtke et al. 2019 Radtke, M.; Nelz, R.; Slablab, A.; Neu, E. Reliable Nanofabrication of Single-Crystal Diamond Photonic Nanostructures for Nanoscale Sensing. Micromachines 2019, 10, 718
- Bang et al. 2020 Bang, J.; Seberson, T.; Ju, P.; Ahn, J.; Xu, Z.; Gao, X.; Robicheaux, F.; Li, T. Five-Dimensional Cooling and Nonlinear Dynamics of an Optically Levitated Nanodumbbell. Phys. Rev. Research 2020, 2, 043054
- Wang et al. 2020 Wang, J.; Su, J.; Xia, G. Drag Forces on Nanoparticles in the Free-Molecule Regime: Effect of the Particle Temperature. Phys. Rev. E 2020, 101, 013103
Appendix A Supporting Information
A.1 Calibration of the particle displacement
The standard procedure for determining a levitated particle center-of-mass energy is well described by Heberstreit et al. 23.
In brief, we measure the particle dynamics along the -axis through an optical signal , where is a setup-dependent calibration factor.
Assuming that the optical trap is harmonic⋆⋆\star⋆⋆\starDue to trap anharmonicities, our procedure underestimates the center-of-mass energy by a few percent 23. We neglect this effect, since the error is lower than our measurement uncertainties., and by analogy with the equipartition theorem, we defined the center-of-mass energy of the particle , where is the effective temperature of the particle center-of-mass motion, such that
| (S1) |
with the particle mass, and the angular frequency of the harmonic trap.
Furthermore, as shown in section 4.1 of reference 19, under the harmonic oscillator approximation, the power spectral density (PSD) of the signal associated with the particle position writes:
| (S2) |
where is the trap frequency and is the reduced damping. Then, one can show that , such that
| (S3) |
As discussed in the main text, the values of and can be obtained from a fit of the experimental PSD by the equation (S2).
To determine the center-of-mass energy, we need to assess the value of . In the literature, this is generally done from a reference experiment. However, in the present case, we have to account for the calibration factor dependence on the measurement laser power and changes in the detection sensitivity that may arise with setup drifts associated with gas pressure changes 23. In the following sections, we address these questions.
A.1.1 Impact of the laser power on calibration
Our measurement scheme of the particle motion uses a common path interferometer. We use the same infrared laser for the measurements than for trapping the particle. We note the power of this laser. Thus, the displacement signal corresponds to the interference between the field scattered by the particle with the reference field directly transmitted through the chamber . Since both and scale as , the measurement sensitivity is then proportional to .
We note , where is independent of the laser power, and equation (S3) becomes:
| (S4) |
Also, the trap angular frequency scales as the square root of the trapping laser power, , with a constant defined by the physical properties of the trap 18.
Thus, we simplified the expression of the center-of-mass energy as :
| (S5) | |||||
| (S6) | |||||
| (S7) |
where is the detection calibration factor normalized to account for the laser power dependence on the detection sensitivity. Thus, it only accounts for drifts of the detection sensitivity when changing the gas pressure. The dependence of the detection sensitivity on the laser power corresponds to the term . To easily account for it, we introduce the integrated power spectral density normalized by the change in laser power , which is the quantity actually used in the main text.
A.1.2 Quantitative assessment of the calibration factor
As quickly discussed in the main text, we use the following procedure to determine the particle center-of-mass energy:
-
1.
First, we determine the values of from the fit of PSD of the particle trajectories. Then, we measure ten times as a function of the laser power, at each pressure.
-
2.
We fit as a function of by a linear function. From the -intercept of the fit, we extrapolate .
-
3.
Assuming that the particle is at thermal equilibrium with its environment for vanishing laser power, we compute the calibration factor . is determined independently at each pressure, avoiding biases induced by setup drifts with pressure changes.
-
4.
Finally, we plot , as shown in figure S1-(b).
A.2 Linearisation of the two bath model
Following Millen et al. 8, the center-of-mass temperature of a spherical particle writes:
| (S8) |
where is the ambient temperature, is the internal temperature increase, and the accommodation coefficient. One can rewrite it:
| (S9) | |||||
| (S10) |
for moderate increases of internal temperature such that .
Experimentally, fitting the data with the whole equation or the simple linear approximation returns the same value of the accommodation coefficient within the uncertainties. Thus, we assume that the linear approximation is verified in the main text. In such, a case we have
| (S11) |
and we note .
A.3 Particle shape impacts on the hot Brownian constant
To illustrate how the shape of the particle affects its hot Brownian motion, we propose to discuss the simple case of cylinder-like particles.
The effect of surface temperature for cylinders has been investigated by Martinetz et al. 25. We note that the definition of the accommodation coefficient by Martinetz et al. slightly differs from the one used in the main text of this work. Nevertheless, the two definitions are equivalent for , which we demonstrate to be the case for nanodiamonds. Thus we assume in the following.
Following the work by Millen et al.8, we split the gas contribution in two independent heat baths of different temperatures. We thus compute the effective center-of-mass temperature for a hot particle of surface temperature . Figures S2-(a) and (b) show the resulting center-of-mass temperatures for cylinders of radius nm and respective lengths and nm. From the slope of these curves, we estimate the value of the hot Brownian motion constant . As an example, figure S2-(c) shows the values of for a motion along the two symmetry axes of the cylinders as a function of the anisotropy factor , which is varied by changing while keeping nm.
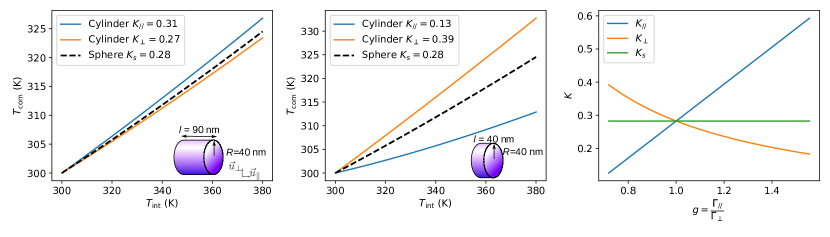
From this simple model, we highlight that:
-
•
Depending on the cylinder geometry, the value of may strongly vary and is axis dependant.
-
•
For isotropic damping (i.e., an anisotropy factor ), the hot Brownian motion is equivalently described by the one of a sphere. This is true at least for other simple geometries such as the cuboid.
-
•
For a non-isotropic particle, we generally observe a value of along one of the cylinder symmetry-axes larger than the expected value for a sphere and smaller along the other cylinder symmetry axis.
These results match well our experimental observations. We always measure and on a different side of the expected for a sphere. The dispersion in is moderate, which is in good agreement with the fact that most particles have a weak damping anisotropy (). This confirms that for a diamond sphere the expected value of will be , which leads to an accommodation coefficient for nanodiamonds of .
Also, we note that the particle asymmetry provides a better coupling to the heat bath than for a sphere (). So, assuming that the particle is a sphere leads to an effective accommodation coefficient larger than one, as discussed in the main text, even if is not physically meaningful.
Finally, in contrast with the cylinder case, we do not observe a significant deviation from the sphere model in our experiments, even for the larger measured values of . This highlights that the cylinder model is not well suited for our nanodiamonds that are of more irregular shapes. To test the model of hot Brownian motion of a cylinder, it would be very interesting to trap diamond nanopillars of well control aspect ratio.
A.4 Characterization of overheated particles
We study height particles, from which two present an unexpected behavior in terms of heating of their center-of-mass motion. Here, we compare some physical parameters measured for these two particles to the value obtained by averaging over all the other particles. The given errors correspond to the fit uncertainties for the overheated particles, and to the standard deviation in the averaged values.
We compare
-
•
the hydrodynamic radius, which is the radius that would have a diamond sphere of the same damping as the particle 21, i.e.
(S12) where Kg/m3 is the diamond density, the molar mass of air, the room temperature and the pressure inside the vacuum chamber. While not giving a precise physical quantity, the hydrodynamic radius provides an idea of the typical particle size.
-
•
the anisotropy ratio .
-
•
the heating rate .
For all these quantities, the overheated particles are in line with the expectation of the whole batch of particles, as shown in Table S1.
| overheated part. 1 | overheated part. 2 | all particles | |
|---|---|---|---|
| (nm) | |||
| (KhPamW-1) |