Adversarial Learning for Incentive Optimization in Mobile Payment Marketing
Abstract.
Many payment platforms hold large-scale marketing campaigns, which allocate incentives to encourage users to pay through their applications. To maximize the return on investment, incentive allocations are commonly solved in a two-stage procedure. After training a response estimation model to estimate the users’ mobile payment probabilities (MPP), a linear programming process is applied to obtain the optimal incentive allocation. However, the large amount of biased data in the training set, generated by the previous biased allocation policy, causes a biased estimation. This bias deteriorates the performance of the response model and misleads the linear programming process, dramatically degrading the performance of the resulting allocation policy. To overcome this obstacle, we propose a bias correction adversarial network. Our method leverages the small set of unbiased data obtained under a full-randomized allocation policy to train an unbiased model and then uses it to reduce the bias with adversarial learning. Offline and online experimental results demonstrate that our method outperforms state-of-the-art approaches and significantly improves the performance of the resulting allocation policy in a real-world marketing campaign.
1. Introduction
Mobile payments such as Alipay, WeChat Pay, Apple Pay are now experiencing rapid growth. To maximize the return on investment, how to allocate the user-specific incentive under budget constraints is playing the central role in marketing budget allocation.
Chu et al. (Chu et al., 2013) (Gupta and Steenburgh, 2008) divided the budget allocation into two stages: adapting a response model to estimate the user’s response score, i.e., MPP in our paper, and applying a linear programming to obtain the optimal incentive allocation under budget constraints. In this paper, we will focus on the first step to learn a better response model and not elaborate the whole literature of the second step.
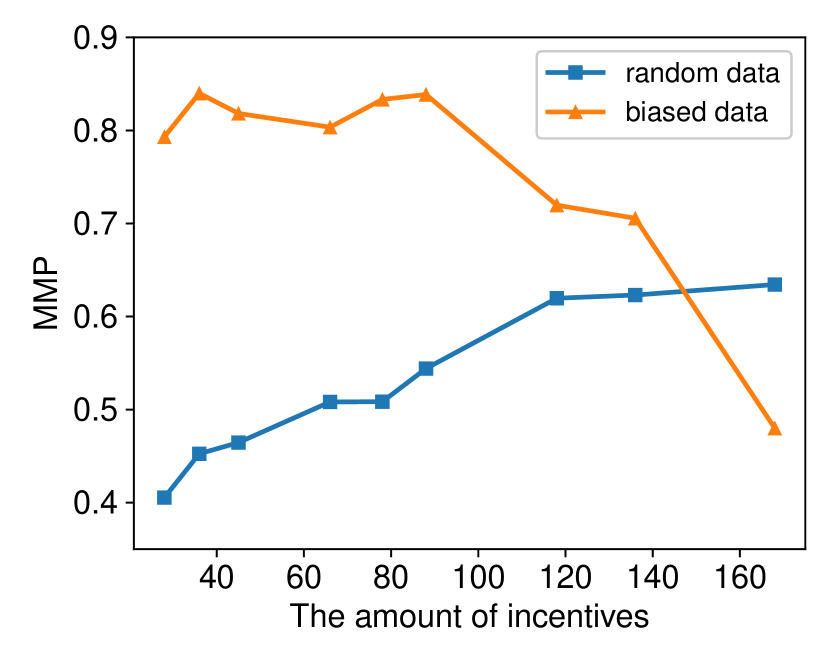
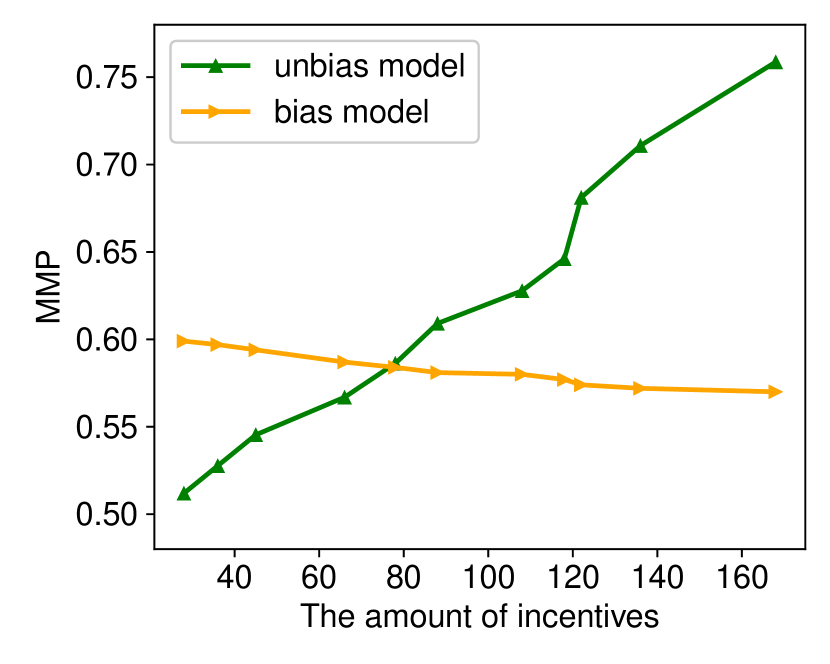
It is non-trivial to estimate the response score of each user to incentives, since the training payment data is typically generated by previous biased allocation policy. Figure 1(a) shows the relationship between MMP and the amount of incentives under random data and biased data. Under random data, the MPP increases as the incentive increases, which describes real user behavior. On the contrary, the previous bias allocation policy generates a large amount of biased data, e.g., active users have a high probability of being allocated a small amount of incentive, while low-active users are the opposite. As a result, the MPP-incentives curve shows a downward trend. Specifically, due to the naturally high MPP of active users, even if a small amount of incentives are allocated, they are more likely to pay through the applications. On the contrary, even if a large amount of incentives are allocated to low-active users, their interest in paying through the applications is also low. The response model trained with these data will over-estimate the response score on a small amount of the incentive and under-estimate the response score on a large amount of the incentive, shown in Figure 1(b), which cannot accurately estimate the user’s response score. As a result, the linear programming algorithm will tend to allocate a relative small amount of incentive to users. One solution to get unbiased estimation is to adapt a full-randomized allocation policy (Bonner and Vasile, 2018) to collect a large amount of unbiased data, which is impractical due to the limited budget. In this paper, we propose a price-bias correction adversarial network (PCAN), which leverages the small set of unbiased data obtained under a full-randomized allocation policy to train an unbiased network and then uses the unbiased network to reduce the price-bias in the biased network with adversarial learning. Specifically, PCAN first learns to distinguish the distribution difference between the biased and unbiased data representation and then teaches the biased network to generate a representation close to the unbiased network, which can alleviate the problem of price-bias.
Our paper is organized as follows. Related works are reviewed in Section 2, followed by our proposed method in Section 3. Experimental results are reported in Section 4 before we conclude the paper in the last section.
2. Related Work
Existing incentives allocation methods usually are divided into two stages: (1) the response model estimates the response score; (2) the response score is served as an input of the optimization model, which tries to maximize the MPP under the budget constraint.
Response Model Estimation. (Akter and Wamba, 2016; Fischer et al., 2011) introduce a dynamic marketing allocation budget. Through strong fitting ability, neural networks can achieve a high prediction accuracy, widely used in many scenarios (Liao et al., 2018; Taieb et al., 2017; Tong et al., 2017). (Ferreira et al., 2016; Ye et al., 2018) use machine learning techniques to estimate future demand for new products and provide recommended prices for Airbnb hosts. However, as a black-box model, there are some gaps between the prediction and decision-making of deep neural networks (Athey, 2017). Therefore, (Zhao et al., 2019; Liu et al., 2019) propose a semi-black box model that extends the logarithmic demand curve through neural network and graph learning to solve this problem.
Allocation Optimization. (Ito and Fujimaki, 2017) proposes a fast approximation using semi-definite programming relaxation. (Ferreira et al., 2016) optimizes pricing decisions by using demand predictions from the regression trees as inputs of the price optimization model. (Boutilier and Lu, 2016; Staib and Jegelka, 2017) through markov decision process value function and the connection with continuous sub-module function to solve the allocation optimization problem.
3. Proposed Method
From the online deployed system, we can collect the logged data , where denotes a feature vector that encodes the information of users’ demographic profiles and online behaviors. represents the amount of incentives allocated to the users, which are usually several preset numbers. is the label, which denotes whether users make mobile payments.
To allocate the budget in an optimal way, a two-stage solution (Liu et al., 2019; Zhao et al., 2019) is a common choice. First, a response model estimates the users’ MPPs for each user described by and each price . Based on the response model, the best allocation under the constraint of the budget can be obtained by solving a linear programming problem. In the following subsections, we illustrate our proposed method from the two perspectives in detail.
3.1. Response Model Estimation
With the collected data , the response model can be estimated through minimizing the following loss function:
| (1) |
where is usually defined as:
| (2) |
where denotes the latent representation of the user. denotes the sigmoid function. and are two trainable functions. To further meet the monotonicity constraint, a semi-black-box model with Softplus (SBBM-Softplus) (Liu et al., 2019) is introduced to guarantee the positive effect of the treatment:
| (3) |
where .
3.2. Price-Bias Correction Adversarial Network
However, due to the budget constraints, we would not deploy a random allocation policy online. Training based on logged data from a biased allocation policy, is easily biased. As pointed by (Schnabel et al., 2016; Yuan et al., 2019), the observed accurate response score is estimated using Inverse Propensity Scoring (IPS)-based methods:
| (4) |
where denotes the probability for the user to be allocated with the incentive .
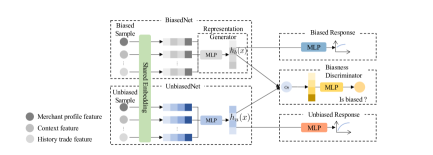
But IPS-based estimators cannot handle well significant shifts in exposure probability between treatment and control policies under biased exposure. Therefore, to correct this bias, in our learning setup, we assume that we have access to a large sample from the online biased allocation policy and a small sample from the randomized allocation policy, i.e., . Specifically, as shown in Figure 2, our entire model includes two subnets named BiasedNet and UnbiasedNet . Two subnets are trained to optimize and , respectively, where and are defined as:
| (5) | |||
Although the distributions of and are different, we assume that the same set of users should have a fixed distribution representation. Therefore, we would like to enforce to follow the same distribution of to alleviate the bias. Specifically, we realize the goal of debiasing using adversarial learning through optimize the following objective function:
| (6) |
As shown in the equation, two components play the central role of representation generator and bias discriminator. We describe two parts in detail in the following subsections.
3.2.1. Representation Generator
BiasedNet, which also acts as the representation generator to generate a biased latent representation in the training process of the adversarial network. In contrast, a user described by in UnbiasedNet represents an unbiased latent representation, which serves as the supervision of . The representation generator will align to to eliminate deviation.
3.2.2. Bias Discriminator
We introduce the bias discriminator to determine which dataset it comes from, i.e., and . Specifically, one batch of training data is mixed with unbiased/biased samples, and is trained to maximize the probability of correctly identifying which dataset is generated from. In an adversarial way, is trained to maximize the probability of incorrectly identifying. Since is trained by unbiased data, the learned representation is assumed to be unbiased. Under the guidance of the adversarial network, BiasNet can gradually learn the distribution of , and finally achieve bias correction.
3.2.3. Optimization Algorithm
To train the response model, we need to alternately optimize Eq. 5 and Eq. 6, which requires carefully update the discriminator and generator. Algorithm 1 summarizes the training details. The algorithm includes two phases of training. The first phase is the warm-up (You et al., 2017), which is designed to ensure the training of adversarial components to start from a relatively good situation. Here the warm-up step is set to 100 in this paper. Then in the second phase, we begin to update the representation generator and bias discriminator under the framework of adversarial learning. Moreover, to enhance the stability of training (Goodfellow et al., 2014), we alternate between five steps of optimizing and one step of optimizing . The algorithm finally returns the learned response model after convergence.
3.3. Allocation Optimization as Linear Programming
Based on the estimated response model, we can get the mobile payment probability for each user with the short form . Assuming that is the treatment list, which is defined as . Then we formalize the allocation as a linear programming problem given the payment probability and the budget , and the objective is to maximize the sum of mobile payment probability over the user set :
| (7) | ||||
where is the number of incentives. is the indicator of whether choosing the incentive for user . The optimal solution is :
| (8) |
where denote the dual optimal.
4. EXPERIMENTS
In this section, we conduct offline and online experiments on the proposed method to demonstrate its effectiveness. Before diving into experimental results, we first introduce experiment settings.
4.1. Experimental Settings
In this section, we first introduce our dataset for training the model and experimental settings.
4.1.1. Dataset
We collected two experimental datasets separately from two real-world mobile marketing campaigns.
Dataset A: Contains more than 50 million samples which include 11 kinds of incentives. 5% of the data is collected by a random strategy. The remaining 95% is collected by the biased strategy.
Dataset B: Contains millions of samples which include 16 kinds of incentives, and the sample ratio is the same as dataset A.
Test Set: All the test set in this paper is the fully random dataset.
4.1.2. Comparison Methods
We compare our method with several baselines:
-
•
SBBM-U (Zhao et al., 2019): A baseline model training based on .
-
•
SBBM-B (Zhao et al., 2019): Similar with SBBM-U, which train the response model on the dataset .
-
•
SBBM-Sp (Liu et al., 2019): A response model with the constraint of the monotonicity trained based on .
-
•
IPW (Rosenbaum and Rubin, 1983): The method which weights each sample with the inverse of its propensity score.
-
•
CausE (Bonner and Vasile, 2018): The approach uses the data from , introducing a regularizer to minimize the difference between the weights of the two models.
4.1.3. Metrics
We introduce Area-Under-Curve (AUC) to quantitatively measure the performance of different methods. Besides, price calibration error (PCE) is also introduced according to expected calibration error (ECE) (Guo et al., 2017), which is defined as:
| (9) |
where represents the number of amounts of the incentive. PCE is designed to measure the difference between the average prediction scores and labels. Due to the confidentiality of data, all metrics are presented the relative improvement over the baseline.
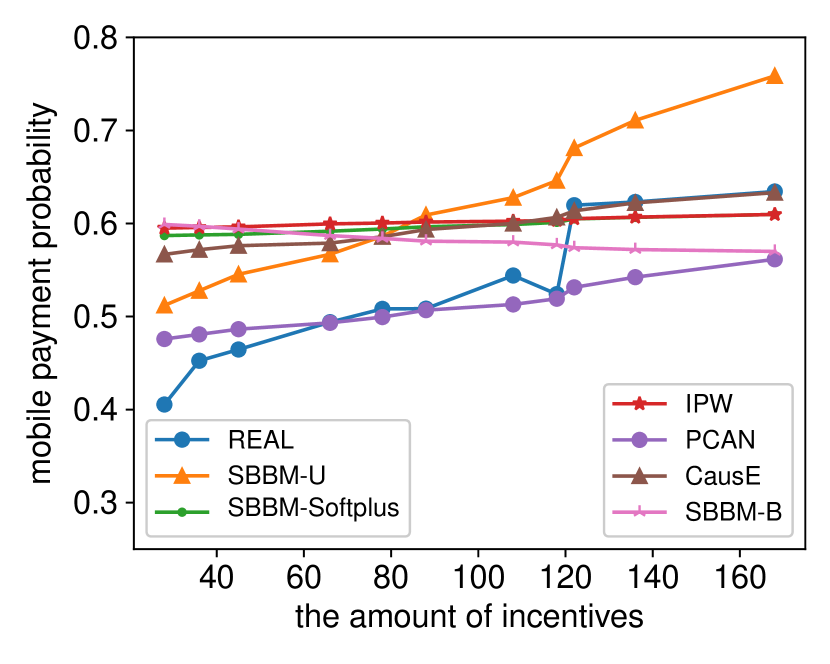
Table 1 shows the experiment result on the dataset. We can observe that PCAN performs the best on the two metrics overall baseline methods across all the two datasets. To further demonstrate the effectiveness of the proposed method in correcting the bias, we show average response scores over a group of users with randomly allocated amount of incentives which shows the average estimated MPP of different models for different amounts in Figure 3(a). Comparing these models trained on the biased dataset, PCAN successfully captures the monotonicity. Besides, PCAN is the most similar to the average score of an actual label in most cases.
4.2. Offline Results
| Model | |||||||
|---|---|---|---|---|---|---|---|
| Data | SBBM-U | SBBM-B | SBBM-Sp | IPW | CausE | PCAN | |
| AUC | A | - | -83.16% | +5.67% | +3.87% | +18.32% | +61.92% |
| B | - | -1.54% | +7.74% | +6.16% | +8.76% | +9.78% | |
| PCE | A | - | -38.38% | +36.58% | +41.80% | +39.30% | +44.35% |
| B | - | -9.58% | +15.01% | +14.12% | +17.36% | +19.04% | |
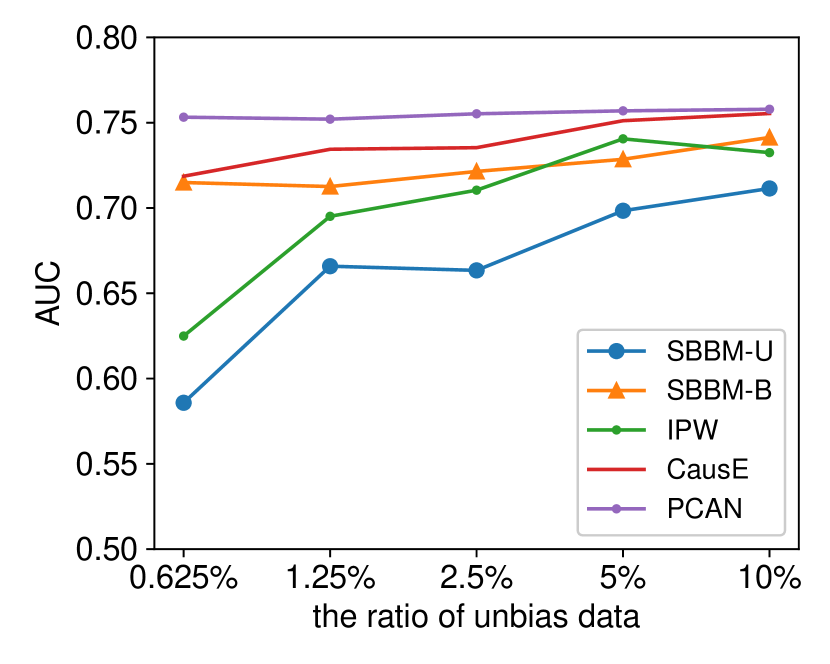
In addition, all the above results are tested with the ratio of . To prove the robustness of our model, we change the proportion of to view the performance of each model. It can be seen in Figure 3(b) that 1) As the proportion of increases, the performance of all models gradually improves. 2) As shrinks, the performance of all methods gradually deteriorates. However, our proposed framework, PCAN, still performs better than other frameworks. In particular, for other methods, the AUC value is strongly affected by the size of , but our method is still stable. Since the cost of an unbiased sample is relatively high in actual marketing activities, PCAN can achieve good results at a relatively low sample ratio, save a lot of costs, and has strong robustness.
4.3. Online Results
To verify the proposed method’s effectiveness, we further conducted an A/B test against a baseline (SBBM-Softplus). In the A/B test, we first randomly split all candidates into two buckets. Under the same budget, the baseline and our approach allocate the incentives to users in the two buckets based on estimated response models, respectively. Over two marketing campaigns, we both observe an over 3% increase in the number of mobile payments.
5. Conclusion
In this paper, we propose an adversarial learning method for incentive optimization in mobile payment marketing. We identify the bias in the response model estimated from the biased data by analyzing the response-incentive curve. We further introduce the mechanism of adversarial learning to build an unbiased response model. Comparing with other state-of-the-arts methods, The online experiment results verify that our proposed method can significantly increase mobile payment usage under a limited budget. Future work will design a more effective method with approximate the accurate response model with less randomized allocation data.
References
- (1)
- Akter and Wamba (2016) Shahriar Akter and Samuel Fosso Wamba. 2016. Big data analytics in E-commerce: a systematic review and agenda for future research. Electronic Markets 26, 2 (2016), 173–194.
- Athey (2017) Susan Athey. 2017. Beyond prediction: Using big data for policy problems. Science (New York, N.Y.) 355, 6324 (February 2017), 483—485. https://doi.org/10.1126/science.aal4321
- Bonner and Vasile (2018) Stephen Bonner and Flavian Vasile. 2018. Causal embeddings for recommendation. In Proceedings of the 12th ACM Conference on Recommender Systems. 104–112.
- Boutilier and Lu (2016) Craig Boutilier and Tyler Lu. 2016. Budget allocation using weakly coupled, constrained Markov decision processes. (2016).
- Chu et al. (2013) Kyounghee Chu, Soyeon Kim, and Changhui Choi. 2013. A Study on the impact of weather on sales and optimal budget allocation of weather marketing. Journal of the Korean Operations Research and Management Science Society 38, 1 (2013), 153–181.
- Ferreira et al. (2016) Kris Johnson Ferreira, Bin Hong Alex Lee, and David Simchi-Levi. 2016. Analytics for an online retailer: Demand forecasting and price optimization. Manufacturing & Service Operations Management 18, 1 (2016), 69–88.
- Fischer et al. (2011) Marc Fischer, Sönke Albers, Nils Wagner, and Monika Frie. 2011. Practice Prize Winner—Dynamic Marketing Budget Allocation Across Countries, Products, and Marketing Activities. Marketing Science 30, 4 (July 2011), 568–585.
- Goodfellow et al. (2014) Ian Goodfellow, Jean Pouget-Abadie, Mehdi Mirza, Bing Xu, David Warde-Farley, Sherjil Ozair, Aaron Courville, and Yoshua Bengio. 2014. Generative adversarial nets. In Advances in neural information processing systems. 2672–2680.
- Guo et al. (2017) Chuan Guo, Geoff Pleiss, Yu Sun, and Kilian Q Weinberger. 2017. On calibration of modern neural networks. arXiv preprint arXiv:1706.04599 (2017).
- Gupta and Steenburgh (2008) Sunil Gupta and Thomas Steenburgh. 2008. Allocating marketing resources. Marketing Mix Decisions: New Perspectives and Practices, Roger A. Kerin and Rob O’Regan, eds., American Marketing Association, Chicago, IL (2008), 90–105.
- Ito and Fujimaki (2017) Shinji Ito and Ryohei Fujimaki. 2017. Optimization beyond prediction: Prescriptive price optimization. In Proceedings of the 23rd ACM SIGKDD International Conference on Knowledge Discovery and Data Mining. ACM, 1833–1841.
- Liao et al. (2018) Binbing Liao, Jingqing Zhang, Chao Wu, Douglas McIlwraith, Tong Chen, Shengwen Yang, Yike Guo, and Fei Wu. 2018. Deep sequence learning with auxiliary information for traffic prediction. In Proceedings of the 24th ACM SIGKDD International Conference on Knowledge Discovery & Data Mining. 537–546.
- Liu et al. (2019) Ziqi Liu, Dong Wang, Qianyu Yu, Zhiqiang Zhang, Yue Shen, Jian Ma, Wenliang Zhong, Jinjie Gu, Jun Zhou, Shuang Yang, et al. 2019. Graph Representation Learning for Merchant Incentive Optimization in Mobile Payment Marketing. In Proceedings of the 28th ACM International Conference on Information and Knowledge Management. 2577–2584.
- Rosenbaum and Rubin (1983) Paul R Rosenbaum and Donald B Rubin. 1983. The central role of the propensity score in observational studies for causal effects. Biometrika 70, 1 (1983), 41–55.
- Schnabel et al. (2016) Tobias Schnabel, Adith Swaminathan, Ashudeep Singh, Navin Chandak, and Thorsten Joachims. 2016. Recommendations as treatments: Debiasing learning and evaluation. arXiv preprint arXiv:1602.05352 (2016).
- Staib and Jegelka (2017) Matthew Staib and Stefanie Jegelka. 2017. Robust budget allocation via continuous submodular functions. In Proceedings of the 34th International Conference on Machine Learning-Volume 70. JMLR. org, 3230–3240.
- Taieb et al. (2017) Souhaib Ben Taieb, Jiafan Yu, Mateus Neves Barreto, and Ram Rajagopal. 2017. Regularization in Hierarchical Time Series Forecasting with Application to Electricity Smart Meter Data.. In Aaai. 4474–4480.
- Tong et al. (2017) Yongxin Tong, Yuqiang Chen, Zimu Zhou, Lei Chen, Jie Wang, Qiang Yang, Jieping Ye, and Weifeng Lv. 2017. The simpler the better: a unified approach to predicting original taxi demands based on large-scale online platforms. In Proceedings of the 23rd ACM SIGKDD international conference on knowledge discovery and data mining. 1653–1662.
- Ye et al. (2018) Peng Ye, Julian Qian, Jieying Chen, Chen-hung Wu, Yitong Zhou, Spencer De Mars, Frank Yang, and Li Zhang. 2018. Customized regression model for airbnb dynamic pricing. In Proceedings of the 24th ACM SIGKDD International Conference on Knowledge Discovery & Data Mining. 932–940.
- You et al. (2017) Yang You, Igor Gitman, and Boris Ginsburg. 2017. Large batch training of convolutional networks. arXiv preprint arXiv:1708.03888 (2017).
- Yuan et al. (2019) Bowen Yuan, Jui-Yang Hsia, Meng-Yuan Yang, Hong Zhu, Chih-Yao Chang, Zhenhua Dong, and Chih-Jen Lin. 2019. Improving ad click prediction by considering non-displayed events. In Proceedings of the 28th ACM International Conference on Information and Knowledge Management. 329–338.
- Zhao et al. (2019) Kui Zhao, Junhao Hua, Ling Yan, Qi Zhang, Huan Xu, and Cheng Yang. 2019. A Unified Framework for Marketing Budget Allocation. arXiv preprint arXiv:1902.01128 (2019).