Counterparts of Candidate Dusty Starbursts at
Abstract
We present an analysis of the optical-to-near-IR counterparts of a sample of candidate dusty starbursts at . These objects were pre-selected based on the rising trend of their far-infrared-to-sub-millimeter spectral energy distributions and the fact that they are radio-weak. Their precise positions are available through millimeter and/or radio interferometry, which enable us to search for their counterparts in the deep optical-to-near-IR images. The sample include five candidates. Three of them have their counterparts identified, one is still invisible in the deepest images, and one is a known galaxy at that is completely blocked by a foreground galaxy. The three with counterparts identified are analyzed using population systhesis model, and they have photometric redshift solutions ranging from 7.5 to 9.0. Assuming that they are indeed at these redshifts and that they are not gravitationally lensed, their total IR luminosities are and the inferred star formation rates are 6.3–13 yr-1. The existence of dusty starbursts at such redshifts would imply that the universe must be forming stars intensely very early in time in at least some galaxies, otherwise there would not be enough dust to produce the descendants observed at these redshifts. The inferred host galaxy stellar masses of these three objects, which are at (if not affected by gravitational lensing), present a difficulty in explanation unless we are willing to accept that their progenitors either kept forming stars at a rate of yr-1 or were formed through intense instantaneous bursts. Spectroscopic confirmation of such objects will be imperative.
keywords:
infrared: galaxies; galaxies: starburst; galaxies: high-redshift; galaxies: evolution1 Introduction
Ultra-luminous Infrared Galaxies (ULIRGs) have extremely high infrared luminosity of (integrated over the rest-frame 8 to 1000 m). It is widely believed that they are starbursts enshrouded by dust, with star formation rates (SFRs) of yr-1. The intense UV radiation from young stars in the starburst region is absorbed by dust, which is re-radiated in infrared (IR) and gives rise to the enormous IR luminosity.
ULIRGs must be heavily metal-enriched because metal is needed to form dust. It is therefore somewhat surprising that ULIRGs are seen at (e.g., Riechers et al., 2013; Strandet et al., 2017), as there is only 1 Gyr for the host galaxies to form sufficient stars and to pollute the ISM with metals. By the same token, ULIRGs at very high redshifts provide a new venue to probe the star formation processes in the early universe, and therefore it is important to assemble a large sample of such objects and to study them systematically.
As young stars nominally can only heat dust to a few tens of kelvin, the far-IR (FIR) to sub-millimeter (sub-mm) spectral energy distributions (SEDs) of ULIRGs can be approximated well by a modified blackbody emission that has a broad peak at roughly 80–100 m. This offers a method to search for ULIRGs at high redshifts, which identifies the rising trend of the SED with wavelength. Tailored for the Spectral and Photometric Imaging Receiver (SPIRE; Griffin et al., 2010) on board the Herschel Space Observatory (Pilbratt et al., 2010), the so-called “500 m peaker” or “500 m riser” technique selects candidates of high-redshift (hereafter “high-”) ULIRGs by searching for sources that are progressively brighter from 250 to 500 m (Pope & Chary, 2010; Roseboom et al., 2012). Presumably, this method can select ULIRGs at (Riechers et al., 2013). Applying it to the wide-field Herschel SPIRE survey data, a number of 500 m riser samples have been constructed (Dowell et al., 2014; Asboth et al., 2016; Ivison et al., 2016; Donevski et al., 2018; Yan et al., 2020). The method can be extended to longer wavelengths by adding sub-mm data to the SPIRE FIR data, which could potentially select ULIRGs at even higher redshifts. Depending on the exact location of the redder sub-mm band in use, it is referred to as the technique of “850 m” or “870 m” riser (Riechers et al., 2017). However, the existing sub-mm surveys cover too small areas as compared to the SPIRE surveys, and 850 m or 870 m risers cannot be directly selected in a significant number. A typical sub-mm source in the existing surveys has flux density of a few mJy, while a typical SPIRE source has flux density of mJy. A systematic search for 850 m risers and the like would have to wait for future sub-mm surveys over at least several tens of deg2 in the existing SPIRE survey fields so that a significant number of rare, bright (several tens of mJy) sub-mm sources would have a chance to be found in the first place. Nevertheless, Yan et al. (2020) have attempted an alternative within the limit of the current 850 m surveys done by the Submillimetre Common-User Bolometer Array 2 (SCUBA2). This is to search for “SPIRE dropouts”, which are objects prominent in 850 m but very weak or invisible in SPIRE and therefore could be potential 850 m risers.
These 500 m risers and SPIRE dropouts are only high- candidates and could suffer from severe contaminations by interloppers at low redshifts. Even for the 500 m risers, which have well-defined colour criteria, one would still expect a high contamination rate if the goal is to search for objects at . Due to the degeneracy between dust temperature and redshift, 500 m risers actually can only select sources at in general (e.g., Pope & Chary, 2010; Yan et al., 2020). To target the highest redshift range of , Yan et al. (2020, hereafter “YMHF20”) took an innovative approach. Using the fact that high- ULIRGs should be radio weak, YMHF20 devised a “high- index” (HiIdx) to further select candidates among their “Tier 1” 500 m risers and SPIRE dropouts. While only a small fraction of these objects (72 out of 629 500 m risers and 29 out of 95 SPIRE dropouts) have sufficiently deep radio data to allow for a meaningful assessment of HiIdx, the total number of candidates still amount to 20 objects (19 500 m risers and 1 SPIRE dropout) and constitute the largest sample of ULIRG candidates.
The true nature of such objects of course is still awaiting spectroscopic confirmation, which can be done in the millimeter regime with current technology (e.g., by identifying CO lines). On the other hand, a lot can be learned if we can identify their counterparts in optical to near-IR (NIR). In this regime, one would not be probing the dusty starburst site but would be detecting the associated host population. If the counterparts are bright enough, one could also pursue optical-to-NIR spectroscopy to confirm their high- nature. Moreover, one could analyze their SEDs in this regime to gain knowledge about the host populations, including deriving their photometric redshifts () to facilitate the interpretation of their nature.
In this work, we study the optical-to-NIR counterparts of the ULIRG candidates YMHF20 in the COSMOS field that are culled by the HiIdx criteria. This work is enabled by the high-resolution interferometry data from the Atacama Large Millimeter/submillimeter Array (ALMA), which allow us to locate the accurate positions of our sources for follow-up studies. We made use of the data from the Automated Mining of the ALMA Archive in the COSMOS Field (A3COSMOS Liu et al., 2019, v20200310). This ongoing ALMA data mining project processes all the non-proprietary continuum imaging data in the COSMOS field and releases the processed images as well as the source catalogs using a number of different extraction methods. The rich multi-wavelength data in the COSMOS field further enable us to study the identified sources in detail.
Our paper is organized as follows. The sample construction is described in §2. The optical-to-NIR counterpart identification is detailed in §3. The SED analysis is given in §4. The implication of our results is discussed in §5. We conclude with a summary in §6. All magnitudes quoted are in the AB system. All coordinates are of J2000.0 Equinox. We adopt the following cosmological parameters: , and km s-1 Mpc-1.
2 Sample Description
Our sample is made of the objects from YMHF20 that satisfy the HiIdx criteria for and are identified in the A3COSMOS data. While they are only a very small fraction of the 500 m risers and SPIRE dropouts in YMHF20, these objects offer the best chance to date to study the most extreme star formation processes in the early universe.
2.1 ALMA identifications
In the COSMOS field, there are 11 500 m risers and one SPIRE dropout satisfying the HiIdx criteria for (see the bold-faced HiIdx entries of Table 7, 8 and 11 in YMHF20 in this field), which constitute the parent sample of this current work. To recapitulate YMHF20, HiIdx is the flux density ratio between FIR/submm and radio:
| (1) |
where , and are the flux densities at 500 m, 850 m and 1.4 GHz, respectively 111To convert from the flux density at an arbitrary frequency to that at 1.4 GHz, YMHF20 adopted a power-law spectrum of . For what is relevant in this study, , where is the flux density at 3.0 GHz.. Based on two known objects with spectroscopic redshifts below and above , respectively, YMHF20 selected objects using an ad hoc criterion of HiIdx(500) for the 500 m risers and HiIdx(850) for the SPIRE dropouts, respectively. The validity of these selections will be tested in this work.
Our current study is based on the latest source catalogs of A3COSMOS (v20200310). We used the “blind” catalog, which contains the sources extracted without using any prior information. However, the publicly available images are still of the previous release (v20180801). As we will show later, one of our identified sources does not yet have publicly available ALMA image because of this reason.
While the SPIRE and the SCUBA2 data have coarse spatial resolutions (with the beam sizes of 18″.1 and 14″.9 in SPIRE 250 m and SCUBA2 850 m, respectively), their centroid positions should still have 1 accuracy of 3″.1 and 2″.5, respectively (see YMHF20). Here we adopted the matching radius of 9″ when matching them to the ALMA positions. Among the 11 high- 500 m risers satisfying HiIdx(500) , seven are in the current A3COSMOS coverage and all were matched. The only SPIRE dropout satisfying HiIdx(850) was also matched. Table 1 shows the details of these matches. As it turns out, the ALMA positions and the SPIRE/SCUBA2 centroid positions are all within ″. The ALMA detections almost all have S/N ; the only exception is the one for 500R_COSMOS_T1_x08, which has S/N . We accepted this case because the ALMA source position coincides with that of the VLA detection (as presented in YMHF20) almost exactly, which gives credibility of the identification.
The VLA image has the synthesized beam size of 0″.75, which is better than most of the ALMA observations listed in Table 1. Therefore, under the assumption that the radio and the FIR-to-mm emissions are originated from the same region in the host, the VLA data should provide better localizations for most of the sources. However, ALMA identifications are the least ambiguous in our context, and we adopt the ALMA positions except in the special case of 500R_COSMOS_T1_x08.
| Short ID | R.A. & Decl. | f(500850) | R.A. & Decl. | HiIdx | R.A. & Decl. | ||||
| (HerMES/S2CLS) | (mJy) | (VLA) | (Jy) | (500850) | (ALMA) | (mm) | (″) | (mJy) | |
| 500R_x08 | 10:01:42.2 2:37:26.9 | 10:01:42.20 2:37:27.10 | 0.82 | 10:01:42.17 2:37:27.47 | 1.34 | 2.76 | |||
| 500R_x24 | 10:02:40.4 1:45:40.2 | 10:02:40.43 1:45:44.11 | 1.34 | 10:02:40.44 1:45:44.17 | 0.873 | 1.27 | |||
| 500R_x26† | 10:00:59.0 1:33:08.8 | 10:00:59.18 1:33:06.73 | 0.72 | 10:00:59.17 1:33:06.67 | 1.03 | 0.83 | |||
| 1.31 | 1.88 | ||||||||
| 1.32 | 1.66 | ||||||||
| 1.29 | 1.20 | ||||||||
| 500R_x31 | 10:01:26.1 1:57:50.4 | 10:01:26.02 1:57:51.32 | 0.81 | 10:01:26.03 1:57:51.27 | 0.873 | 0.84 | |||
| 1.25 | 1.81 | ||||||||
| 500R_x02 | 10:01:42.3 2:00:19.3 | 10:01:42.55 2:00:14.69 | 1.25 0.13∗ | 10:01:42.54 2:00:14.67 | 0.873 | 0.85 | |||
| 500R_x10 | 10:01:40.5 2:30:14.7 | 10:01:40.44 2:30:10.44 | 1.34 1.33∗ | 10:01:40.43 2:30:10.55 | 1.25 | 1.79 | |||
| 500R_x34a | 10:00:09.9 2:22:22.0 | 10:00:09.49 2:22:19.48 | 1.87 0.12∗ | 10:00:09.49 2:22:19.47 | 0.873 | 0.29 | |||
| 1.25 | 1.84 | ||||||||
| 500R_x34b | 1.87 0.12∗ | 10:00:10.36 2:22:24.43 | 0.873 | 0.29 | |||||
| 1.25 | |||||||||
| SD850_A03 | 9:59:57.4 2:27:28.6 | 9:59:57.29 2:27:30.54 | 0.56 0.22∗ | 9:59:57.29 2:27:30.60 | 0.873 | 0.29 | |||
| 1.25 | 1.85 | ||||||||
| 1.29 | 1.20 |
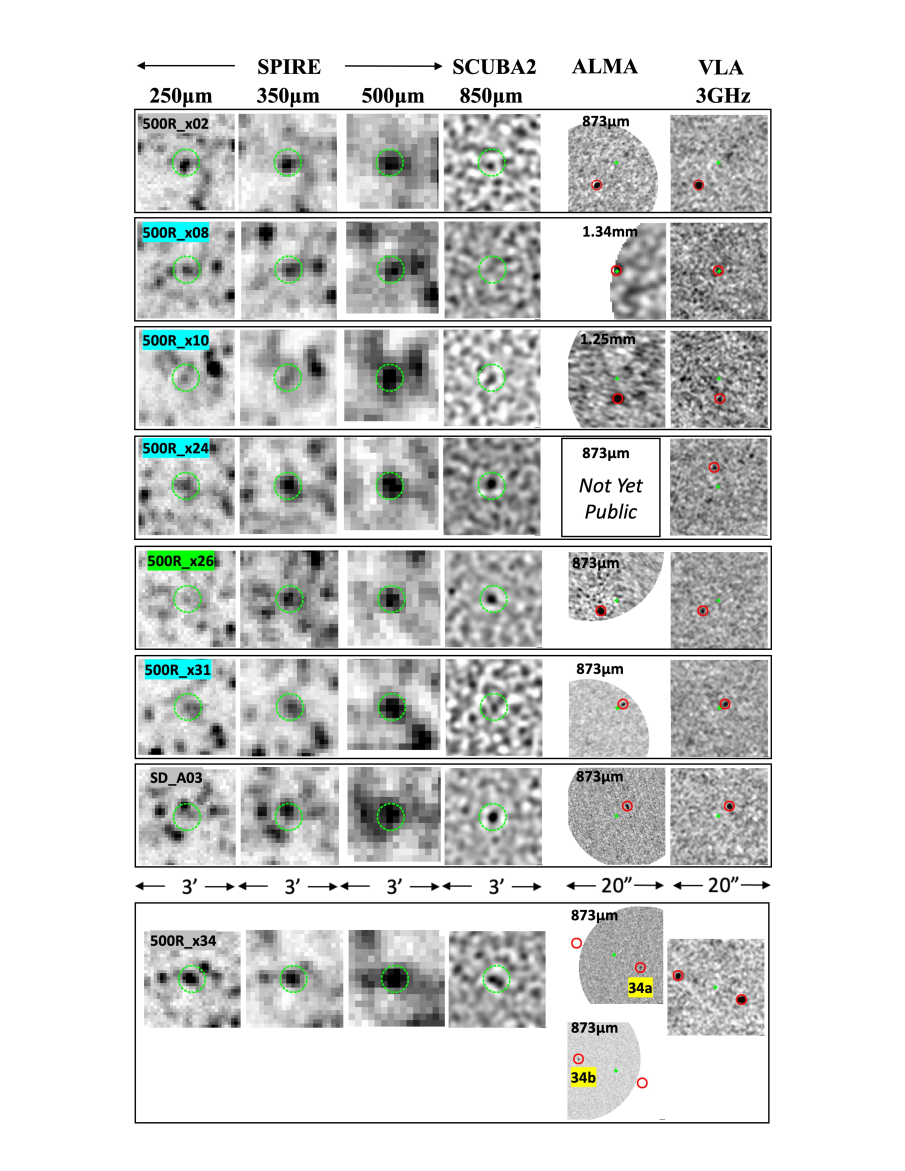
Figure 1 shows the SPIRE and the SCUBA2 images for all these eight objects as well as their ALMA identification images and their images in the VLA 3 GHz. In particular, 500R_COSMOS_T1_x34 is identified with two ALMA sources, which we call the “a” and “b” components, respectively.
2.2 Detections and non-detections in the VLA Image
We first revisit the HiIdx assessment of these objects based on the new identifications, because the calculations of HiIdx in YMHF20 used the upper limit of the VLA 3 GHz map for the non-detections in this map. YMHF20 matched the 500 m risers and the SPIRE dropouts with the VLA sources using the criterion of , where is the positional offset to the nearest 3 GHz source and is the overall positional uncertainty by adding in quadrature the errors of the reported SPIRE (or SCUBA2) and VLA positions. is dominated by the SPIRE (or SCUBA2) positional error, which depends on the source S/N in the SPIRE/SCUBA2 data, and the error term from the VLA positions is minimal (set to 0″.13 at the fixed S/N ). For the 500 m risers and the SPIRE dropouts, 3″.1 and 2″.2, respectively.
Following this matching criterion, four of the 11 aforementioned 500 m risers were labeled as detected in radio by YMHF20. These are 500R_COSMOS_T1_x08, x24, x26, and x31, all among the seven that have ALMA coverage. The ALMA counterparts very well coincide with the VLA counterparts, and the slight differences in the positions are all consistent with the respective positional errors. Their HiIdx values remain the same as reported in YMHF20. Seven of the 11 sources were labeled by YMHF20 as undetected in radio, and their reported HiIdx values were above the threshold because of the use of the upper limit for . On the other hand, YMHF20 did carry out a more generous match using a searching radius of 10″, and found that three of these seven had corresponding 3 GHz matches; they were still labeled as radio non-detections in YMHF20 only because these matches have (see the bottom part of Table 7 in YMHF20). These three are 500R_COSMOS_T1_x02, x04 and x10, which are also within the ALMA coverage. The ALMA identifications now show that these 3 GHz matches are in fact the right counterparts (i.e., the no-match criterion in YMHF20 should be relaxed to ). Therefore, their HiIdx must be revised. Similarly, the only previous candidate among the SPIRE dropouts, SD850_COSMOS_T1_A03, is of the same situation (see the bottom part of Table 10 in YMHF20) 222We note that Table 10 in YMHF20 (for the radio matching of the SPIRE dropouts) has an error in reporting the and values for the bottom six objects; the values in these two columns should be swapped. and its HiIdx must also be revised.
The updated HiIdx(500850) values are included in Table 1. To summarize, five of the seven 500 m risers satisfy HiIdx(500) and are candidates at (including 500R_COSMOS_T1_x10 whose HiIdx(500) has been revised), which we will refer to as the “high- candidates” in the rest of this paper. The other two 500 m risers (including 500R_COSMOS_T1_x34, which is still considered as a single source in this context) no longer satisfy this criterion, which we will refer to as the “contaminators” hereafter. The SPIRE dropout, SD850_COSMOS_T1_A03, is also a contaminator. These eight sources constitute the sample of this study.
3 Multi-wavelength properties of the counterparts
3.1 Data Description
The COSMOS field has accumulated a wealth of multi-wavelength data, which make it possible to further study the properties our sources. These include the HST Wide Field Camera 3 (WFC3) F160W (hereafter ) images from the COSMOS-Drift And SHift program (COSMOSDASH; Mowla et al., 2019) and Advanced Camera for Surveys (ACS) F814W (hereafter ) image that defines the original COSMOS field (Koekemoer et al., 2007), the VISTA VIRCAM , , , and images from the UltraVISTA program (McCracken et al., 2012), the Subaru Hyper Suprime-Cam , , , , and images from the Hyper Suprime-Cam Subaru Strategic Program (HSC-SSP; Aihara et al., 2018a, b), and the Spitzer Infrared Array Camera (IRAC) and Multi-Band Imaging Photometer for Spitzer (MIPS) images from the Spitzer COSMOS program (S-COSMOS; Sanders et al., 2007). These datasets are briefly described below. In most cases, we had to carry out our own photometry using SExtractor (Bertin & Arnouts, 1996), for which we adopted its MAG_AUTO. In some cases we adopted the photometry from the relevant data releases, and these cases will be explictly noted in the rest of the paper.
HST WFC3 . We used the v1.2.10 data released by the COSMOS-DASH program, which incorporate its own observations as well as those from other programs in this field. The image mosaic effectively covers 0.66 deg2 and has the scale of 0″.1 pix-1. The full-width at half-maximum (FWHM) of the point spread function (PSF) is 0″.21. The mosaic has reached the 5 sensitivity of mag for point sources (using an aperture of 0″.3 in diameter) in general, but in some regions it is significantly deeper.
HST ACS . We used the image mosaic with the scale of 0″.03 pix-1 included in the v2.0 data release of the COSMOS program. The image covers 1.7 deg2 and reaches the 5 sensitivity of mag for point sources sources (0″.24 diameter aperture). The PSF FWHM is 0″.095.
VISTA near-IR. We used the v4.0 image stacks of the UltraVISTA program, which cover deg2 in four “Ultra-deep” and four “Deep” stripes. The PSFs in all these four bands have FWHM of 0″.76–0″.78. The 5 limiting magnitudes (2″ diameter aperture) in , , , and are 25.8, 25.6, 25.2, and 24.9 mag in the Ultra-deep stripes, respectively, and 24.7, 24.5, 24.1, and 24.5 mag in the Deep stripes, respectively.
Subaru optical. We used the five broad-band image stacks from the third public data release (PDR3) of the HSC-SSP program, which has observed the COSMOS field as one of the survey’s UltraDeep fields. These data have reached the 5 limits (within aperture of 2″ diameter) of 28.2, 27.9, 27.7, 27.1, and 26.1 mag in , , , , and , respectively, with the PSF sizes varying from 0″.7 to 0″.8.
Spitzer IR. We used the data from the S-COSMOS program, which include the IRAC data in Ch1 through Ch4 (3.6 to 8.0 m) and the MIPS data in 24 m. For the IRAC photometry, we adopted the GO2 catalog. Specifically, we used the fluxes extracted through a 2″.9 aperture. These fluxes were corrected to the total fluxes by dividing the correction factors of 0.90, 0.90, 0.84, and 0.73 in Ch1, Ch2, Ch3, and Ch4, respectively, as per the instruction of the data release. The MIPS data were only used to aid the visual inspection of the sources; for the sake of completeness, the 24 m photometry, which was taken from the GO3 catalog, will be listed when appropriate.
| Short ID | 500R_x08∗ | 500R_x24∗ | 500R_x31∗ | 500R_x10∗ | 500R_x02 | 500R_x34a | 500R_x34b | SD850_A03 |
| 28.2 | ?28.70.4 | 28.2 | 28.2 | 26.780.07 | 25.030.05 | 27.140.20 | 27.230.10 | |
| 27.9 | 27.9 | 27.9 | 27.9 | 25.820.05 | 24.130.03 | 26.640.19 | 26.780.10 | |
| 27.7 | 27.7 | 27.7 | 27.7 | 25.510.04 | 23.770.03 | 25.890.10 | 25.770.05 | |
| 27.1 | 27.1 | 27.1 | 27.1 | 25.020.05 | 23.230.03 | 25.330.11 | 25.270.05 | |
| 26.1 | 26.1 | 26.1 | 26.1 | 25.000.08 | 24.150.13 | 25.440.22 | 24.910.07 | |
| 25.8 | 24.7 | 24.7 | 25.8 | 24.730.04 | 22.350.01 | 24.100.03 | 24.7 | |
| 22.470.04 | 24.5 | 24.910.31 | 26.520.81 | 24.310.03 | 21.570.01 | 23.970.03 | 24.5 | |
| 21.610.02 | 24.1 | 24.460.24 | 24.530.17 | 23.290.02 | 21.300.01 | 23.010.02 | 24.1 | |
| 21.030.02 | 24.5 | 24.190.14 | 23.550.09 | 22.930.02 | 20.890.01 | 22.240.01 | 23.770.16 | |
| 27.2 | 27.2 | 27.2 | 27.2 | 27.2 | 26.670.22 | 27.2 | 27.2 | |
| 22.150.11 | N/A | 24.610.25 | 25.1 | 24.020.29 | 21.600.09 | 23.350.33 | N/A | |
| Ch1 (3.6 m) | … | 24.1 | 22.350.05 | … | 21.720.03 | 20.320.01 | 20.700.01 | 22.880.07 |
| Ch2 (4.5 m) | … | 23.3 | 21.750.04 | … | 21.320.03 | 20.020.01 | 20.310.01 | 22.690.10 |
| Ch3 (5.8 m) | … | 21.3 | 21.400.13 | … | 21.040.10 | 19.920.03 | 20.040.04 | 21.3 |
| Ch4 (8.0 m) | … | 21.0 | 21.520.33 | … | 20.550.13 | 20.360.11 | 20.490.13 | 21.0 |
| MIPS (24 m) | … | 71 | 71 | … | 16716 | 38114 | 41415 | 71 |
3.2 Counterparts of the high- candidates
We start from identifying the optical-to-NIR counterparts of the five high- candidates using the positions verified by the ALMA data.
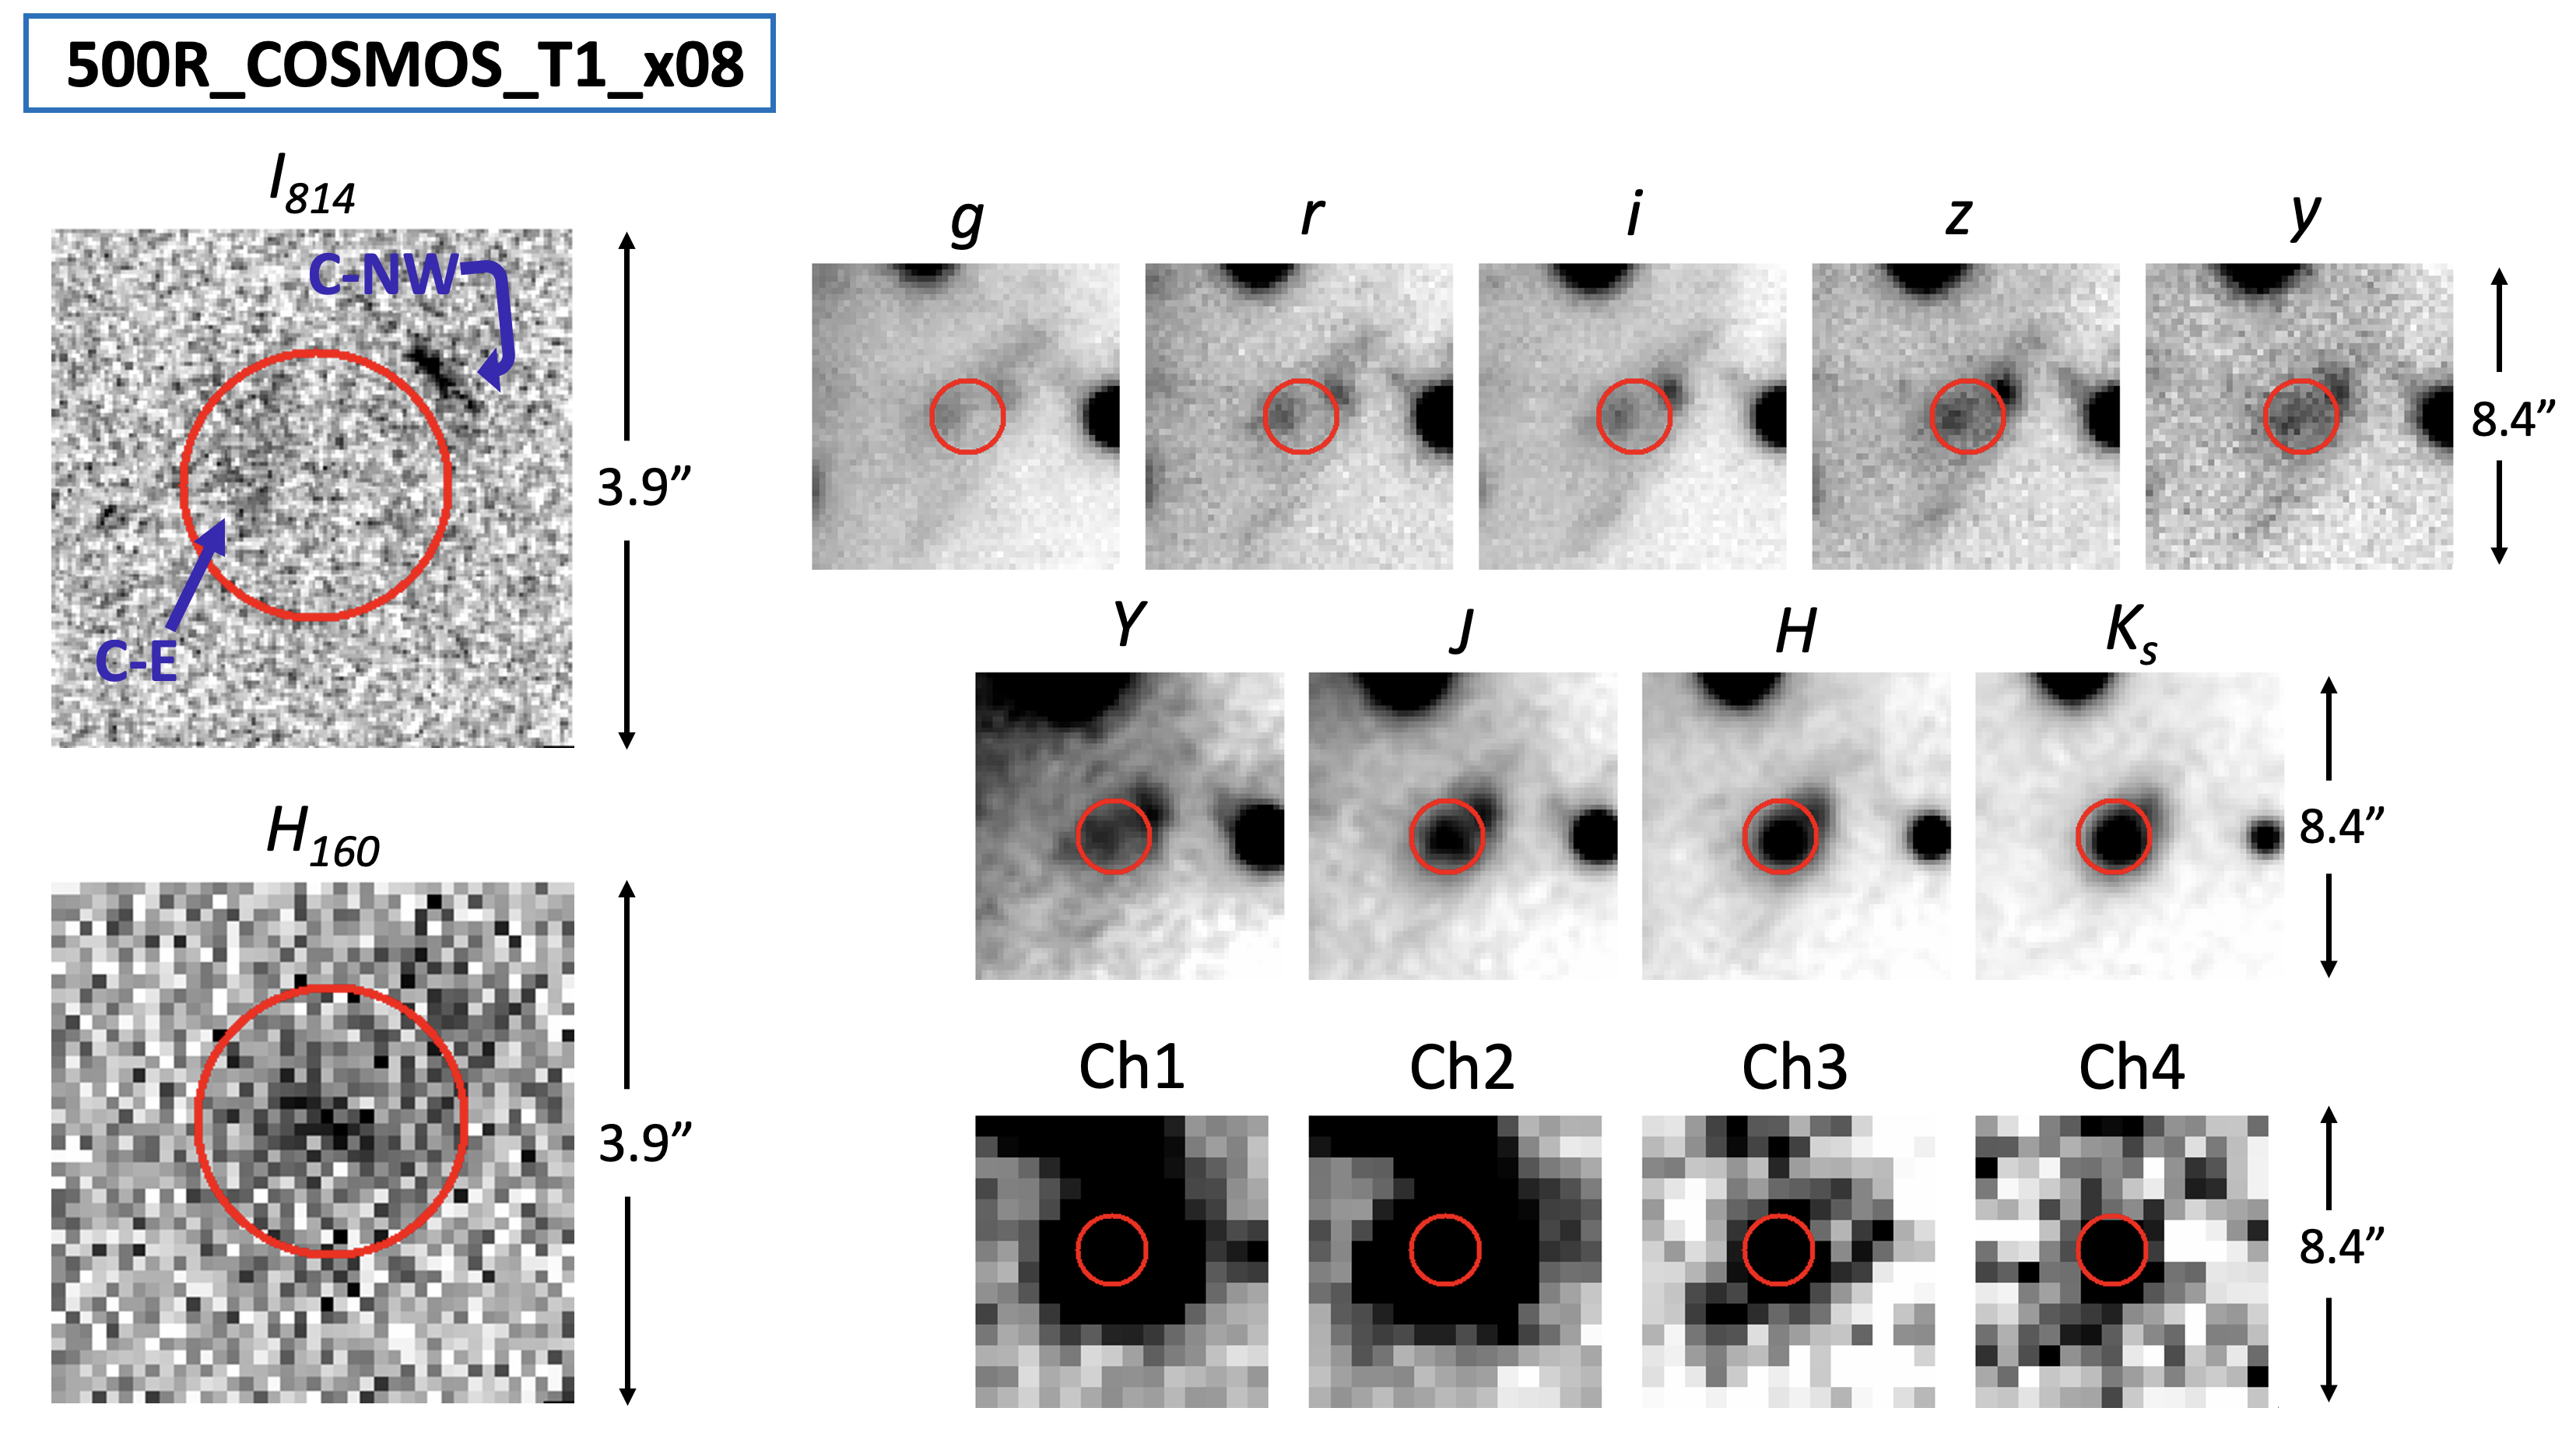
3.2.1 500R_COSMOS_T1_x08
As mentioned earlier, its ALMA detection has only S/N . This is largely because the source is at the very edge of the field. However the separation of ALMA and radio position is only 0″.58, and this lends strong support to the identification and the localization of the source. We adopt the VLA position as its final position, as the ALMA position has much larger uncertainty of 0″.85 (as compared to the uncertainty of 0″.08 of the VLA position). The optical-to-NIR images of this source and its vicinity are shown in Figure 2. At this position, there is no visible source in , and only a diffuse source in of mag by our photometry. This source has two very close companions at 1″, both of which could confuse the identification and contaminate its photometry. We designate the one to its north-west as “C-NW” and the one to its east as “C-E”, respectively. In , C-NW is clearly an edge-on disk galaxy ( mag), while C-E is very diffuse and is extracted as three components ( mag after combing the three). In , C-E is not visible and C-NW is barely detected ( mag).
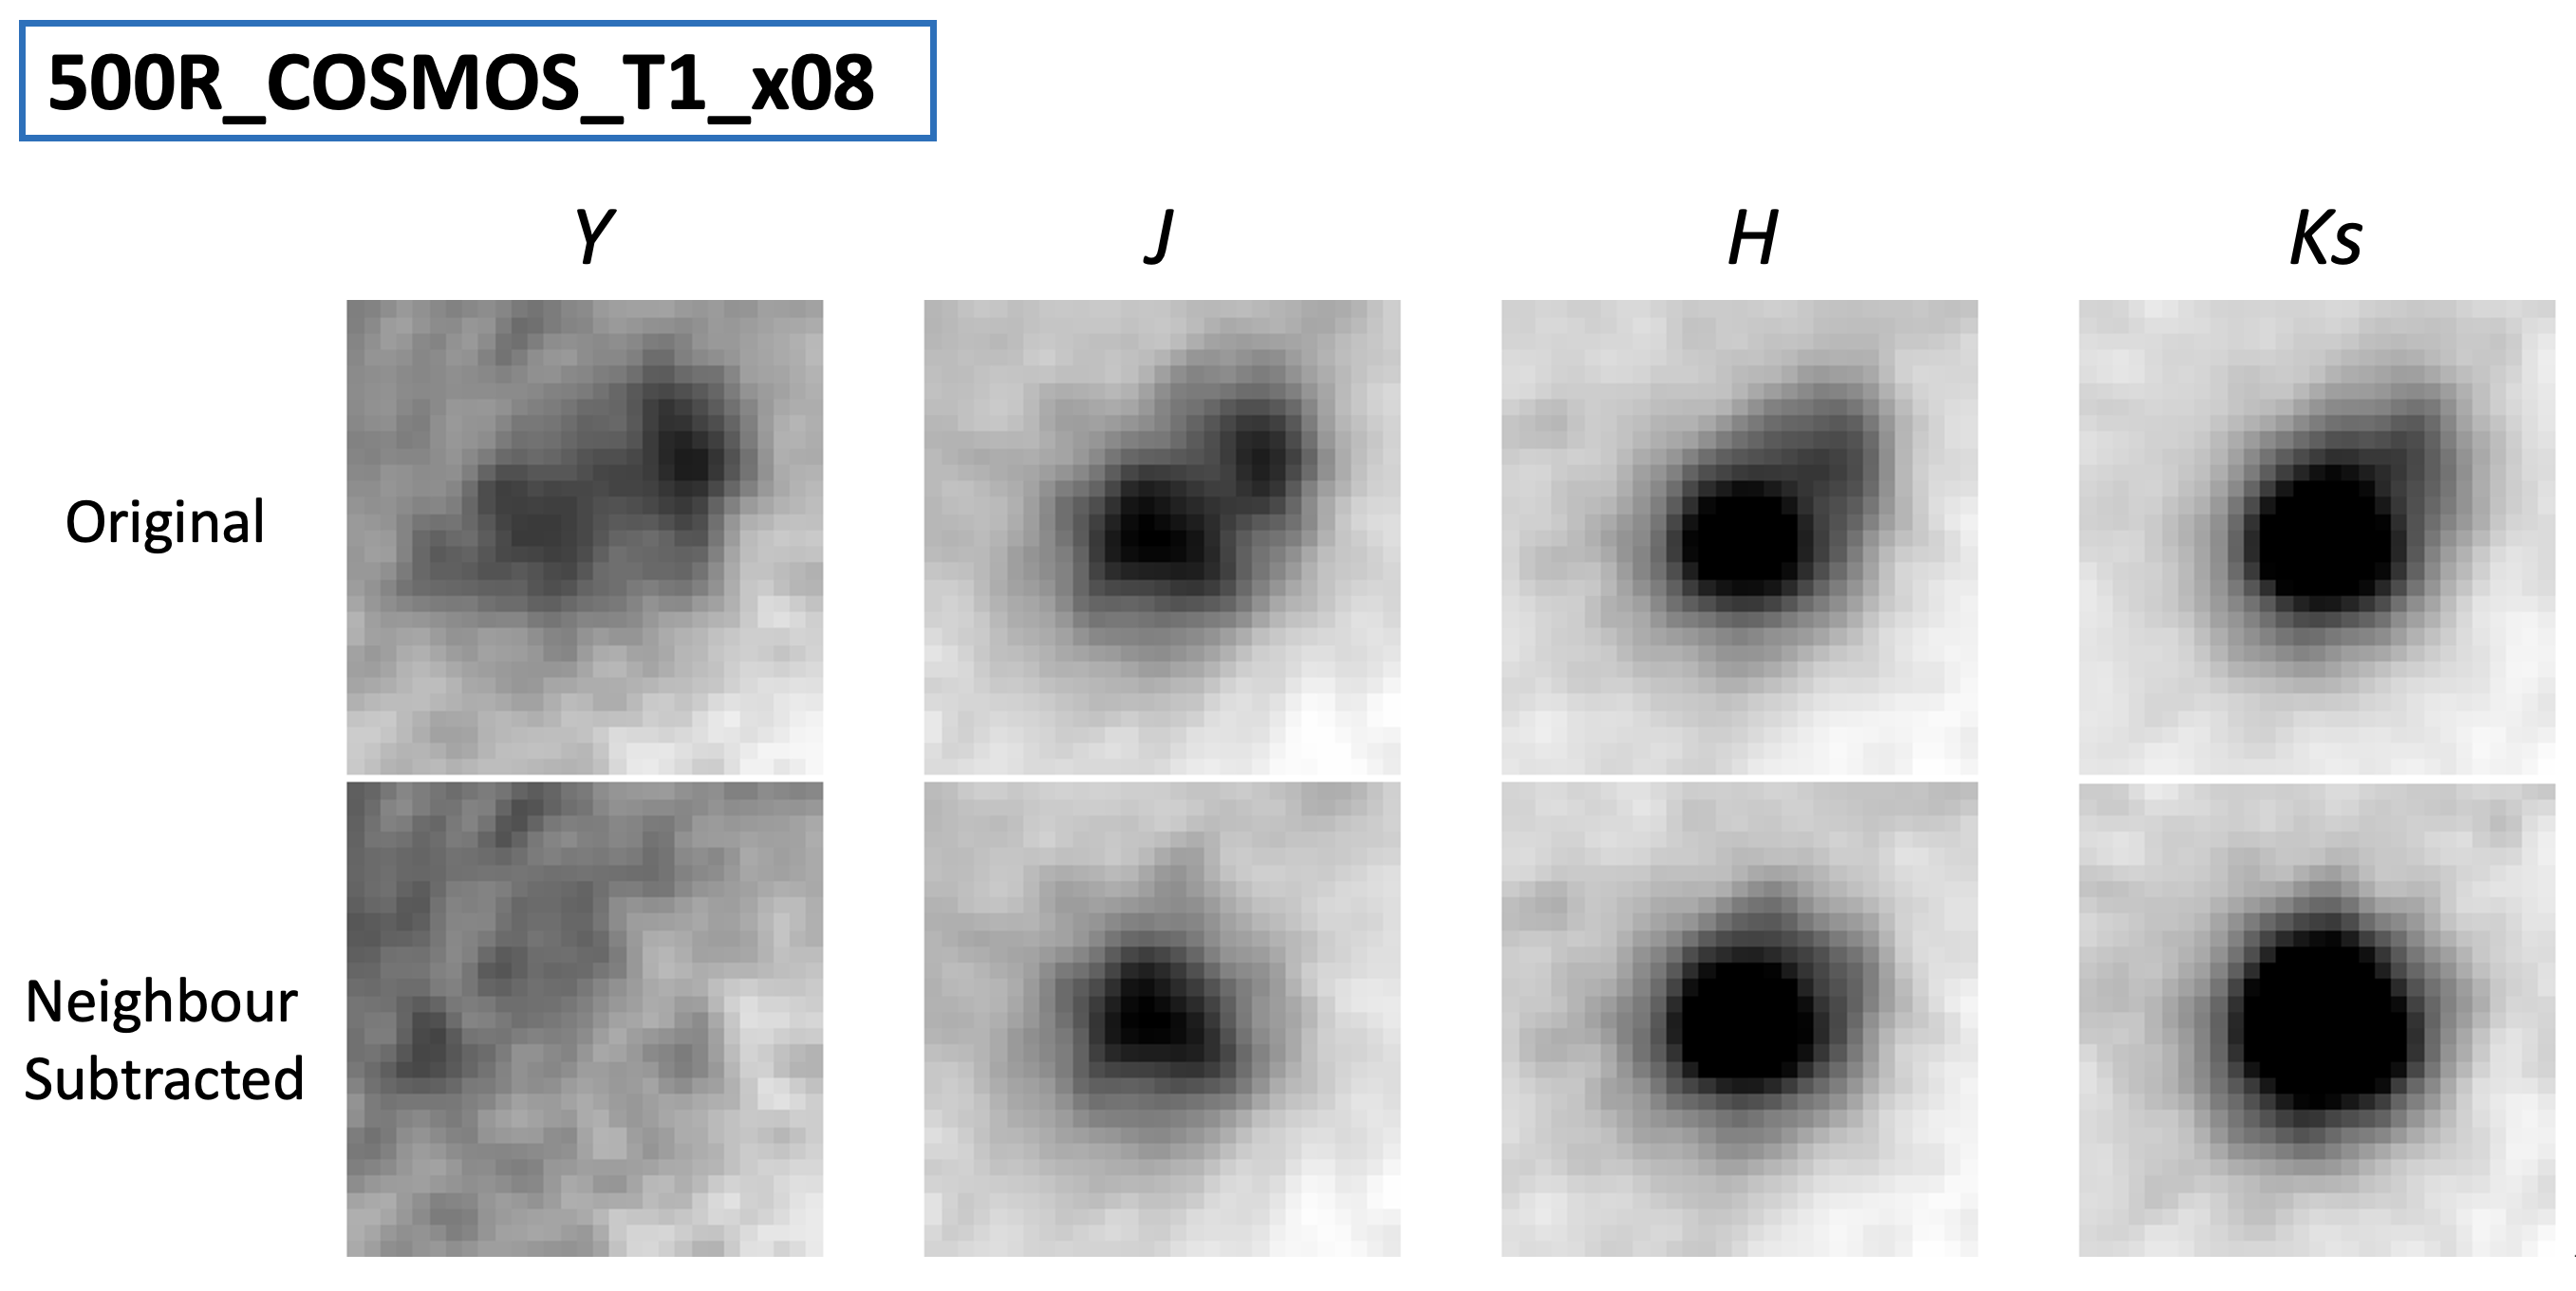
This source is invisible in the HSC images. There is a hint that it is detected in , however, it is severely blended with the companion C-E, which becomes fainter in the redder bands but is still visible in . This is evident from our own extraction of C-E in , whose centroid has an offset of 0″.3 with respect to that extracted in band. The offset is towards the position of 500R_x08, which suggests that it is caused by the blending of the weak detection of this 500 m riser in . The photometry in is further complicated by the contamination from the edge of the bright halo of the saturated star in its vicinity. The UltraVISTA images provide more clues, although 500R_x08 and the nearby objects are not included in the released catalog (presumably due to the contamination of the saturated star). The blending with C-E is more clearly seen in the UltraVISTA -band. The 500 m riser becomes distinctly visible in the UltraVISTA -band, and is brighter in and . C-E seems to disappear in . C-NW, on the other hand, persists from through . Nevertheless, our extraction can still separate C-NW from the 500 m riser in . Therefore, we used GALFIT (Peng et al., 2002, 2010) to fit C-NW and to subtract its best-fit Sérsic profile from the images for better photometry. For the -band image, we further subtracted C-E using the same procedure and found that the 500 m riser was not visible in this residual image. The comparison of the original and the neighbour-subtracted images are shown in Figure 3. The final photometry of the 500 m riser counterpart was done on these “cleaned” images using SExtractor in the dual-image mode, where the image was chosen as the detection image to define the ‘‘MAG_AUTO’’ apreture. The results are listed in Table 2. Unfortunately, C-NW cannot be separated from the 500 m riser in the IRAC images, and we refrain from obtaining photometry of the 500 m riser on these images.
3.2.2 500R_COSMOS_T1_x24
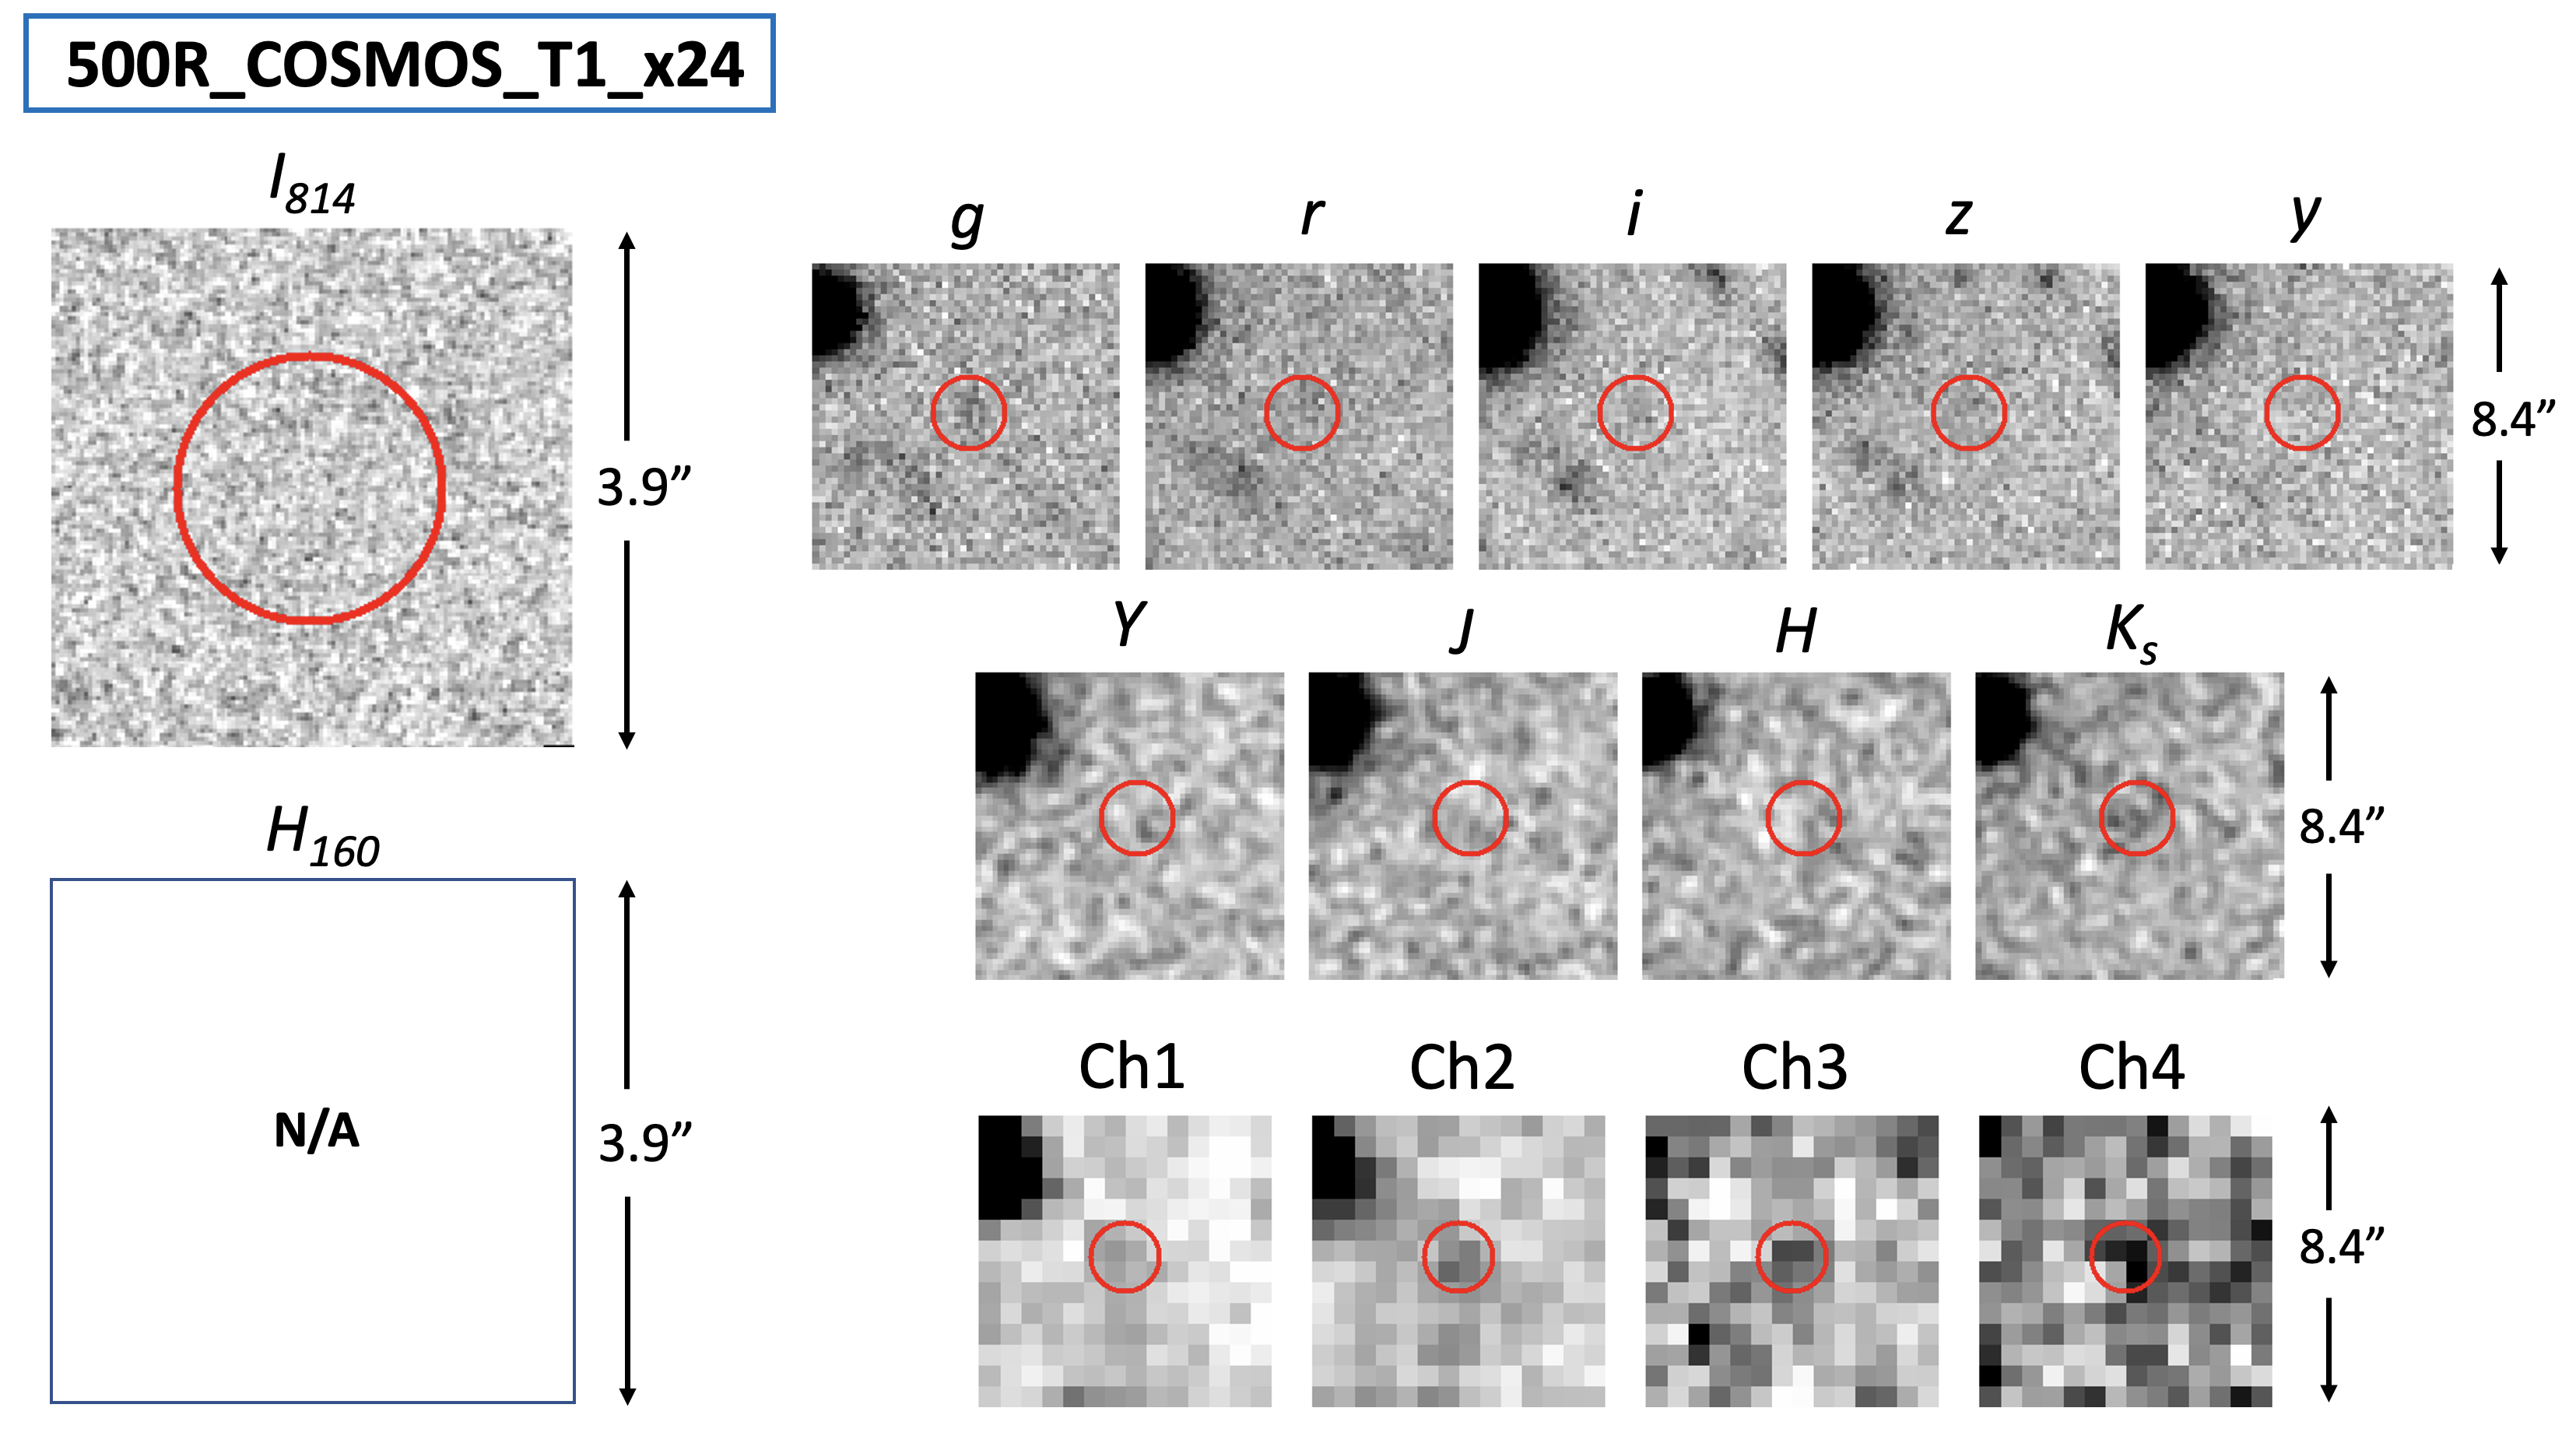
While the A3COSMOS image for this source is not yet available, the A3COSMOS position coincides with that of the VLA position (0″.16 separation). Figure 4 shows the optical-to-NIR images around this location. There is no visible source at the ALMA position. Unfortunately, it has no image because it is out of the COSMOS-DASH coverage.
This source is invisible in the HSC images. On the other hand, there seems to be a weak detection in . In our extraction, it has 28.70.4 mag at the exact location. However, due to its low S/N, it is highly likely that this “detection” is a false positive. The source is also invisible in the UltraVISTA images and the S-COSMOS IRAC images. We cannot rule out the possibility that it is at high-.
3.2.3 500R_COSMOS_T1_x26
This object in fact is the galaxy reported by Pavesi et al. (2018). Nicknamed “CRLE”, it was serendipitously discovered during ALMA observations of a normal galaxy in its vicinity, and its redshift was determined through the identification of atomic fine-structure lines ([C II] 158 m and [N II] 205 m) in the ALMA data as well as the CO(2-1) 1.301 mm transition line in the follow-up VLA observations. Had there not been such spectroscopic identifications, it would be impossible to reveal the nature of this source because it is completely blocked by a foreground, edge-on disk galaxy at from UV to mid-IR; its FIR-to-mm emissions, on the other hand, are transmissible through this foreground galaxy (Pavesi et al., 2018). Its redshift, however, is still below . We refer the reader to Pavesi et al. (2018) for the optical-to-NIR images around this position, and will not discuss this source further because the optical-to-NIR images would provide information only on the foreground object.
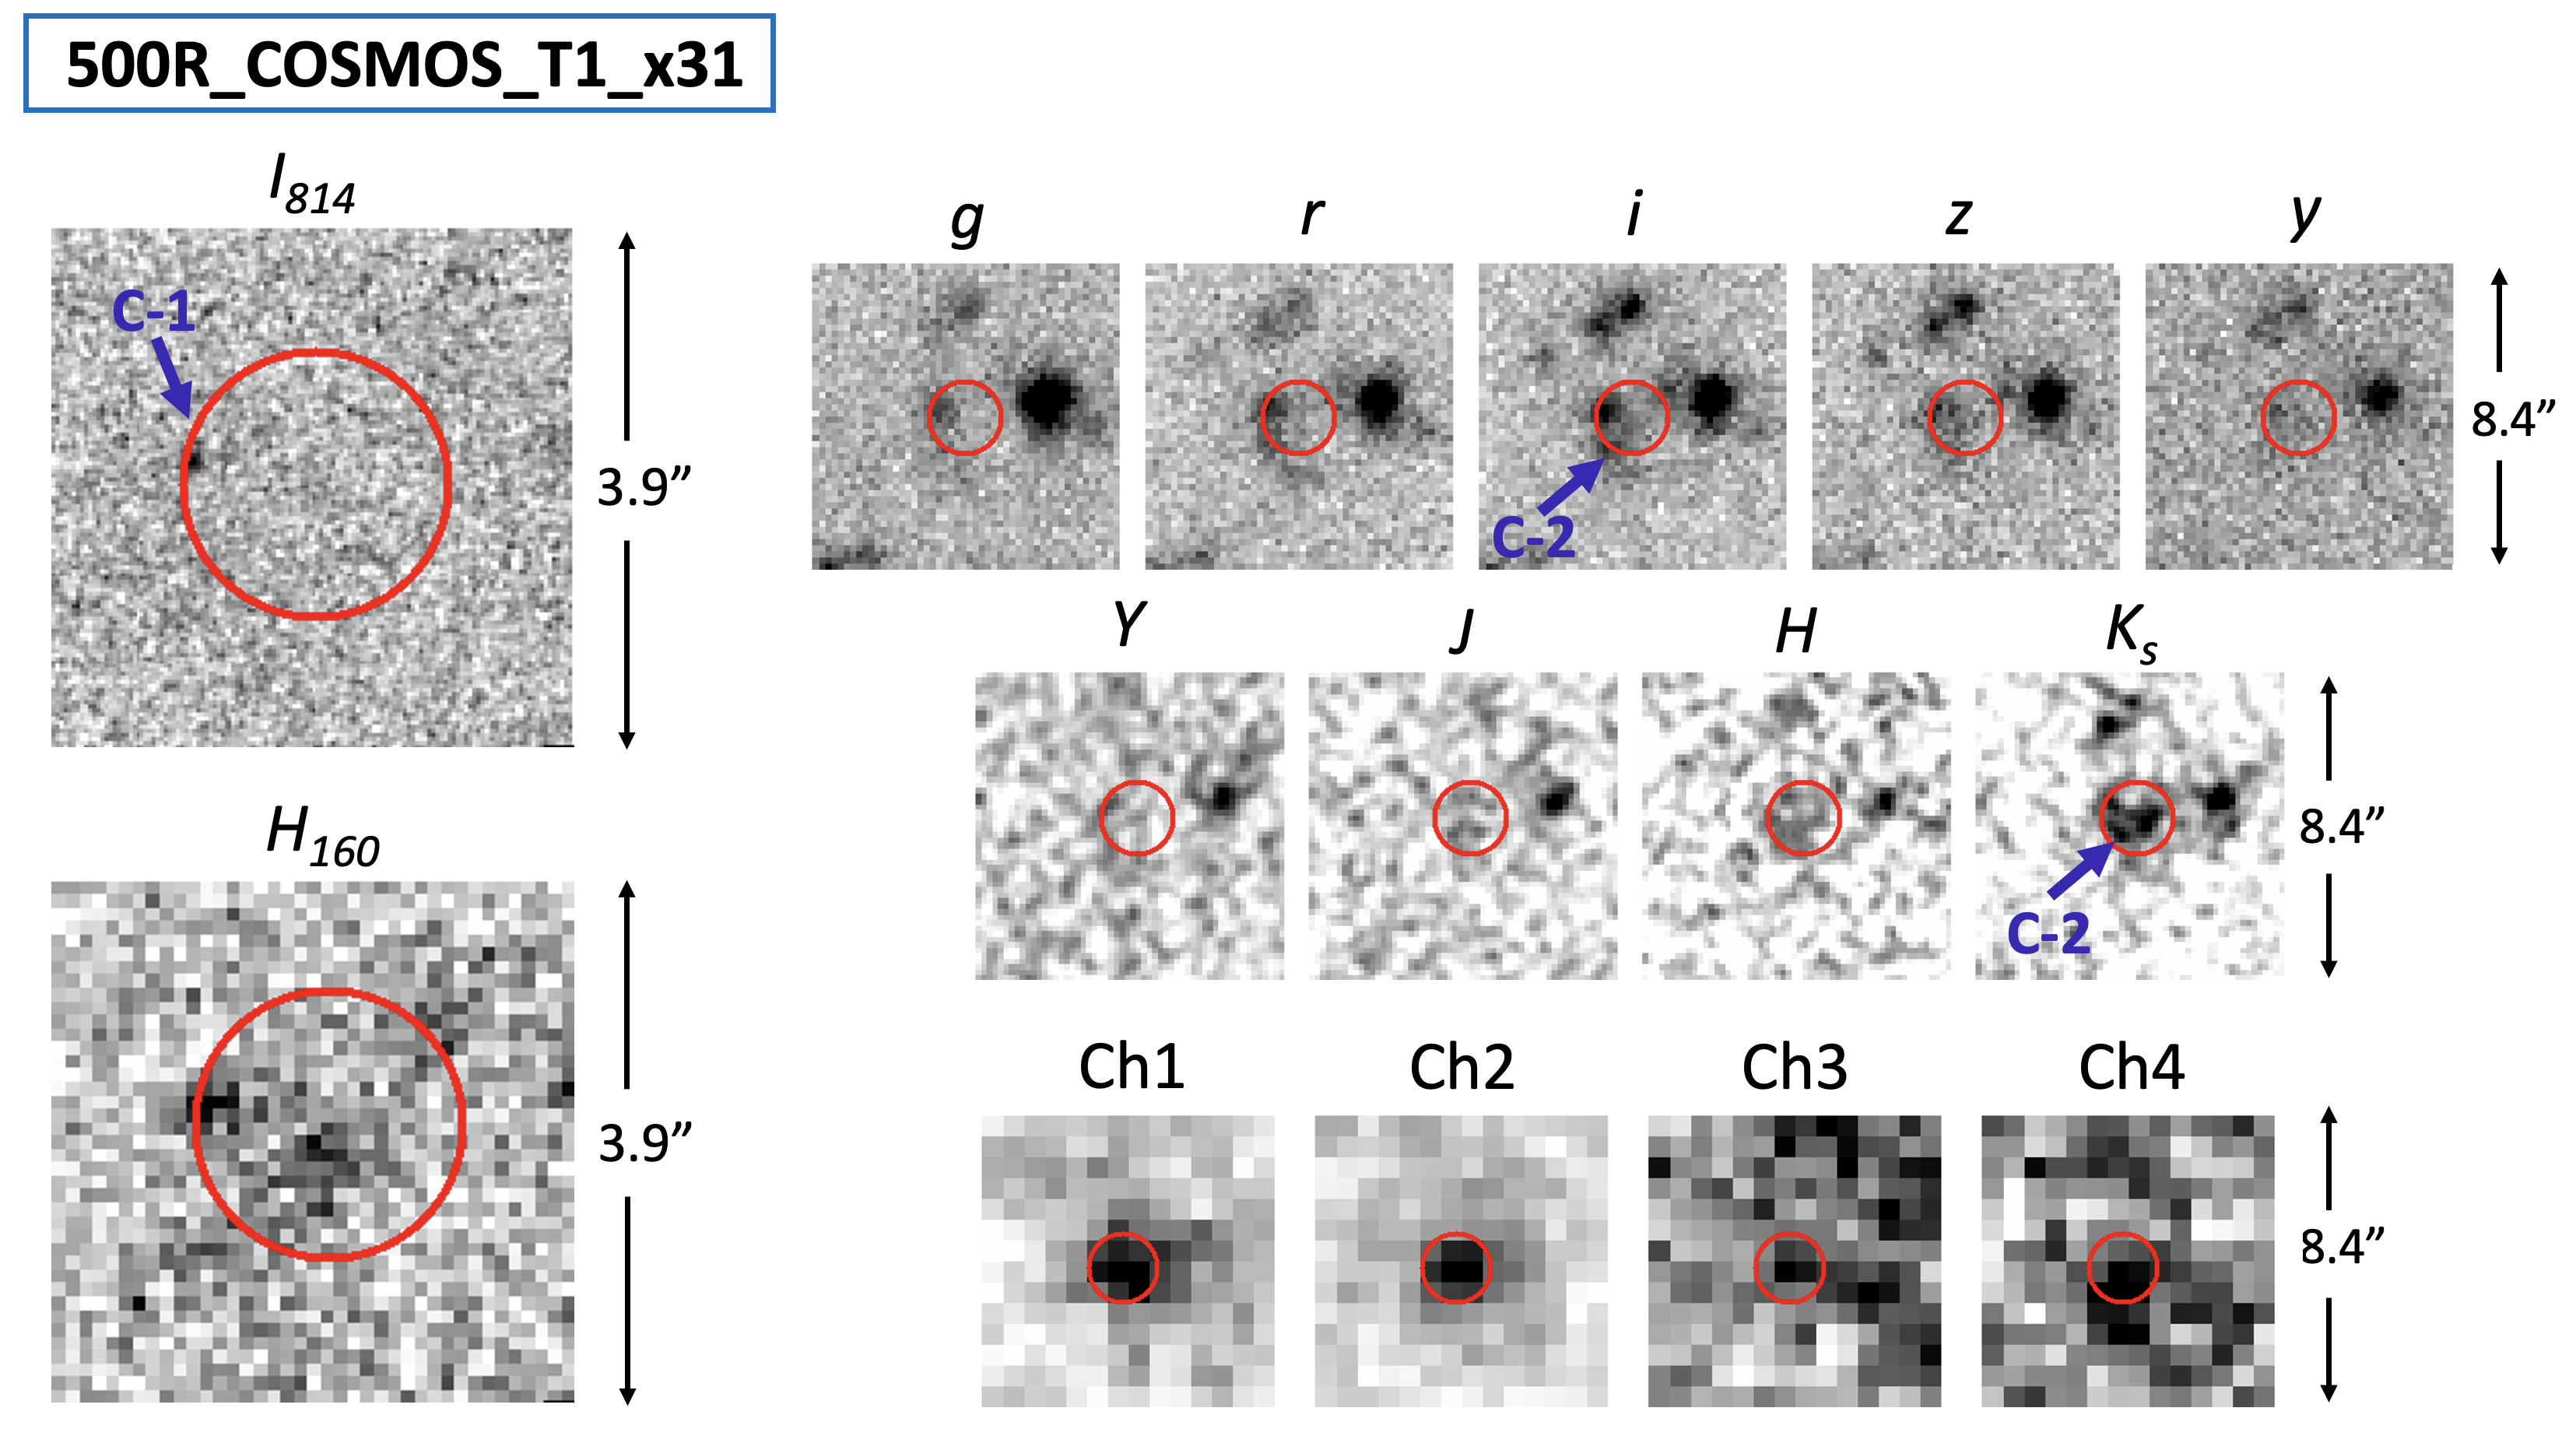
3.2.4 500R_COSMOS_T1_x31
The optical-to-NIR images of this source are shown in Figure 5. At the exact ALMA location, there is a faint blob in , which should be the counterpart. By our own photometry, it has 24.610.25 mag. It is invisible in . There is a close companion 0.″77 away (R.A. 10:01:26.08, Decl. 1:57:51.43), which is detected in both bands. We designate this source as “C-1”. In the COSMOS catalog, this companion has and mag, respectively.
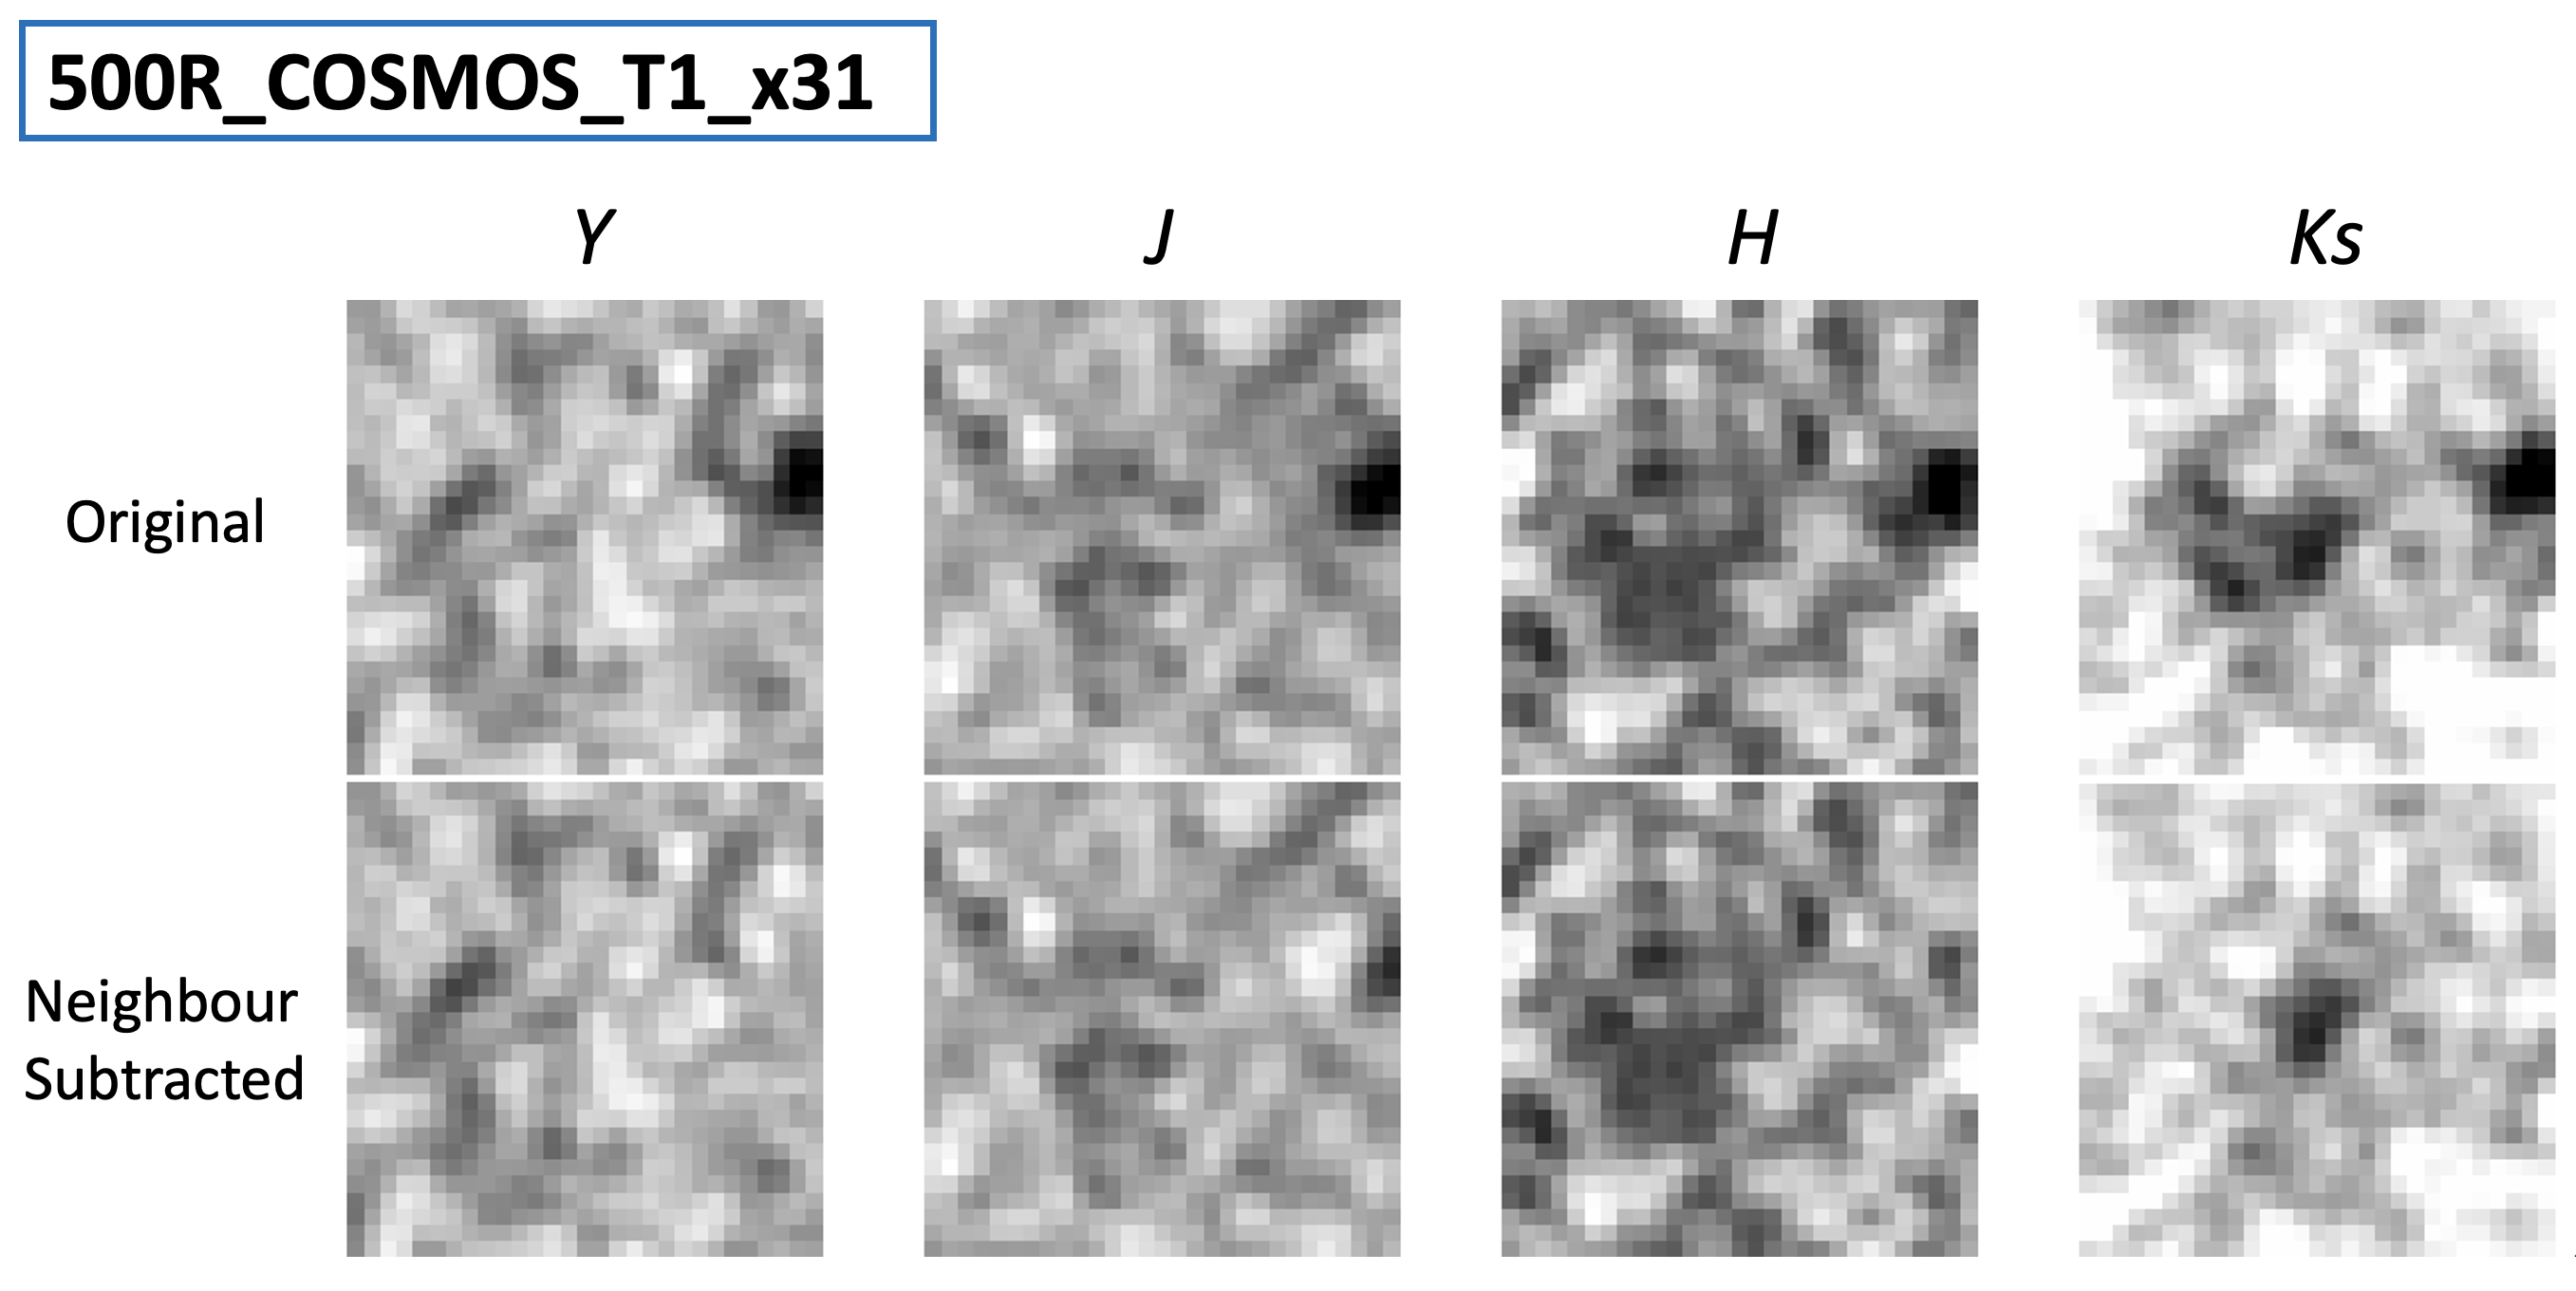
C-1 is clearly visible in all the HSC images. A second close neighbour, C-2, is also revealed by the HSC images in and , which is 1″.04 away from the ALMA centroid. Using the -band image for detection, our run of SExtractor in dual-image mode gives photometry for C-1 and C-2 in as 26.930.21, 25.810.12, 25.520.08, 25.600.17, 25.780.40 mag and 27.420.31, 26.060.14, 25.820.12, 25.800.20, 25.880.44 mag, respectively. The true counterpart is revealed in the UltraVISTA images, especially in . The UltraVISTA DR4 catalog, however, only extracts this counterpart together with C-1 and C-2 as a single, blended object. We were able to separate the three in . Following the same procedure as in the case of 500R_COSMOS_T1_x08, we subtracted C-1 and C-2 from the UltraVISTA images for the photometry of the 500 m riser counterpart. The comparison of the original and the neighbour-subtracted images is shown in Figure 6. The subtraction in does not create any notable effect, as C-1 and C-2 are almost invisible in these bands. The MAG_AUTO photometry, done using the neighbour-subtracted image as the detection image to define the aperture, are listed in Table 2.
In the S-COSMOS catalog, there is an IRAC source at this location, and the results are listed in Table 2. From the IRAC images, one could argue that C-1 and C-2 might not be visible and that the fluxes are all contributed by the 500 m riser counterpart. However, this is admittedly uncertain, and we will consider two scenarios, with and without the IRAC photometry, respectively, in the follow-up SED analysis.
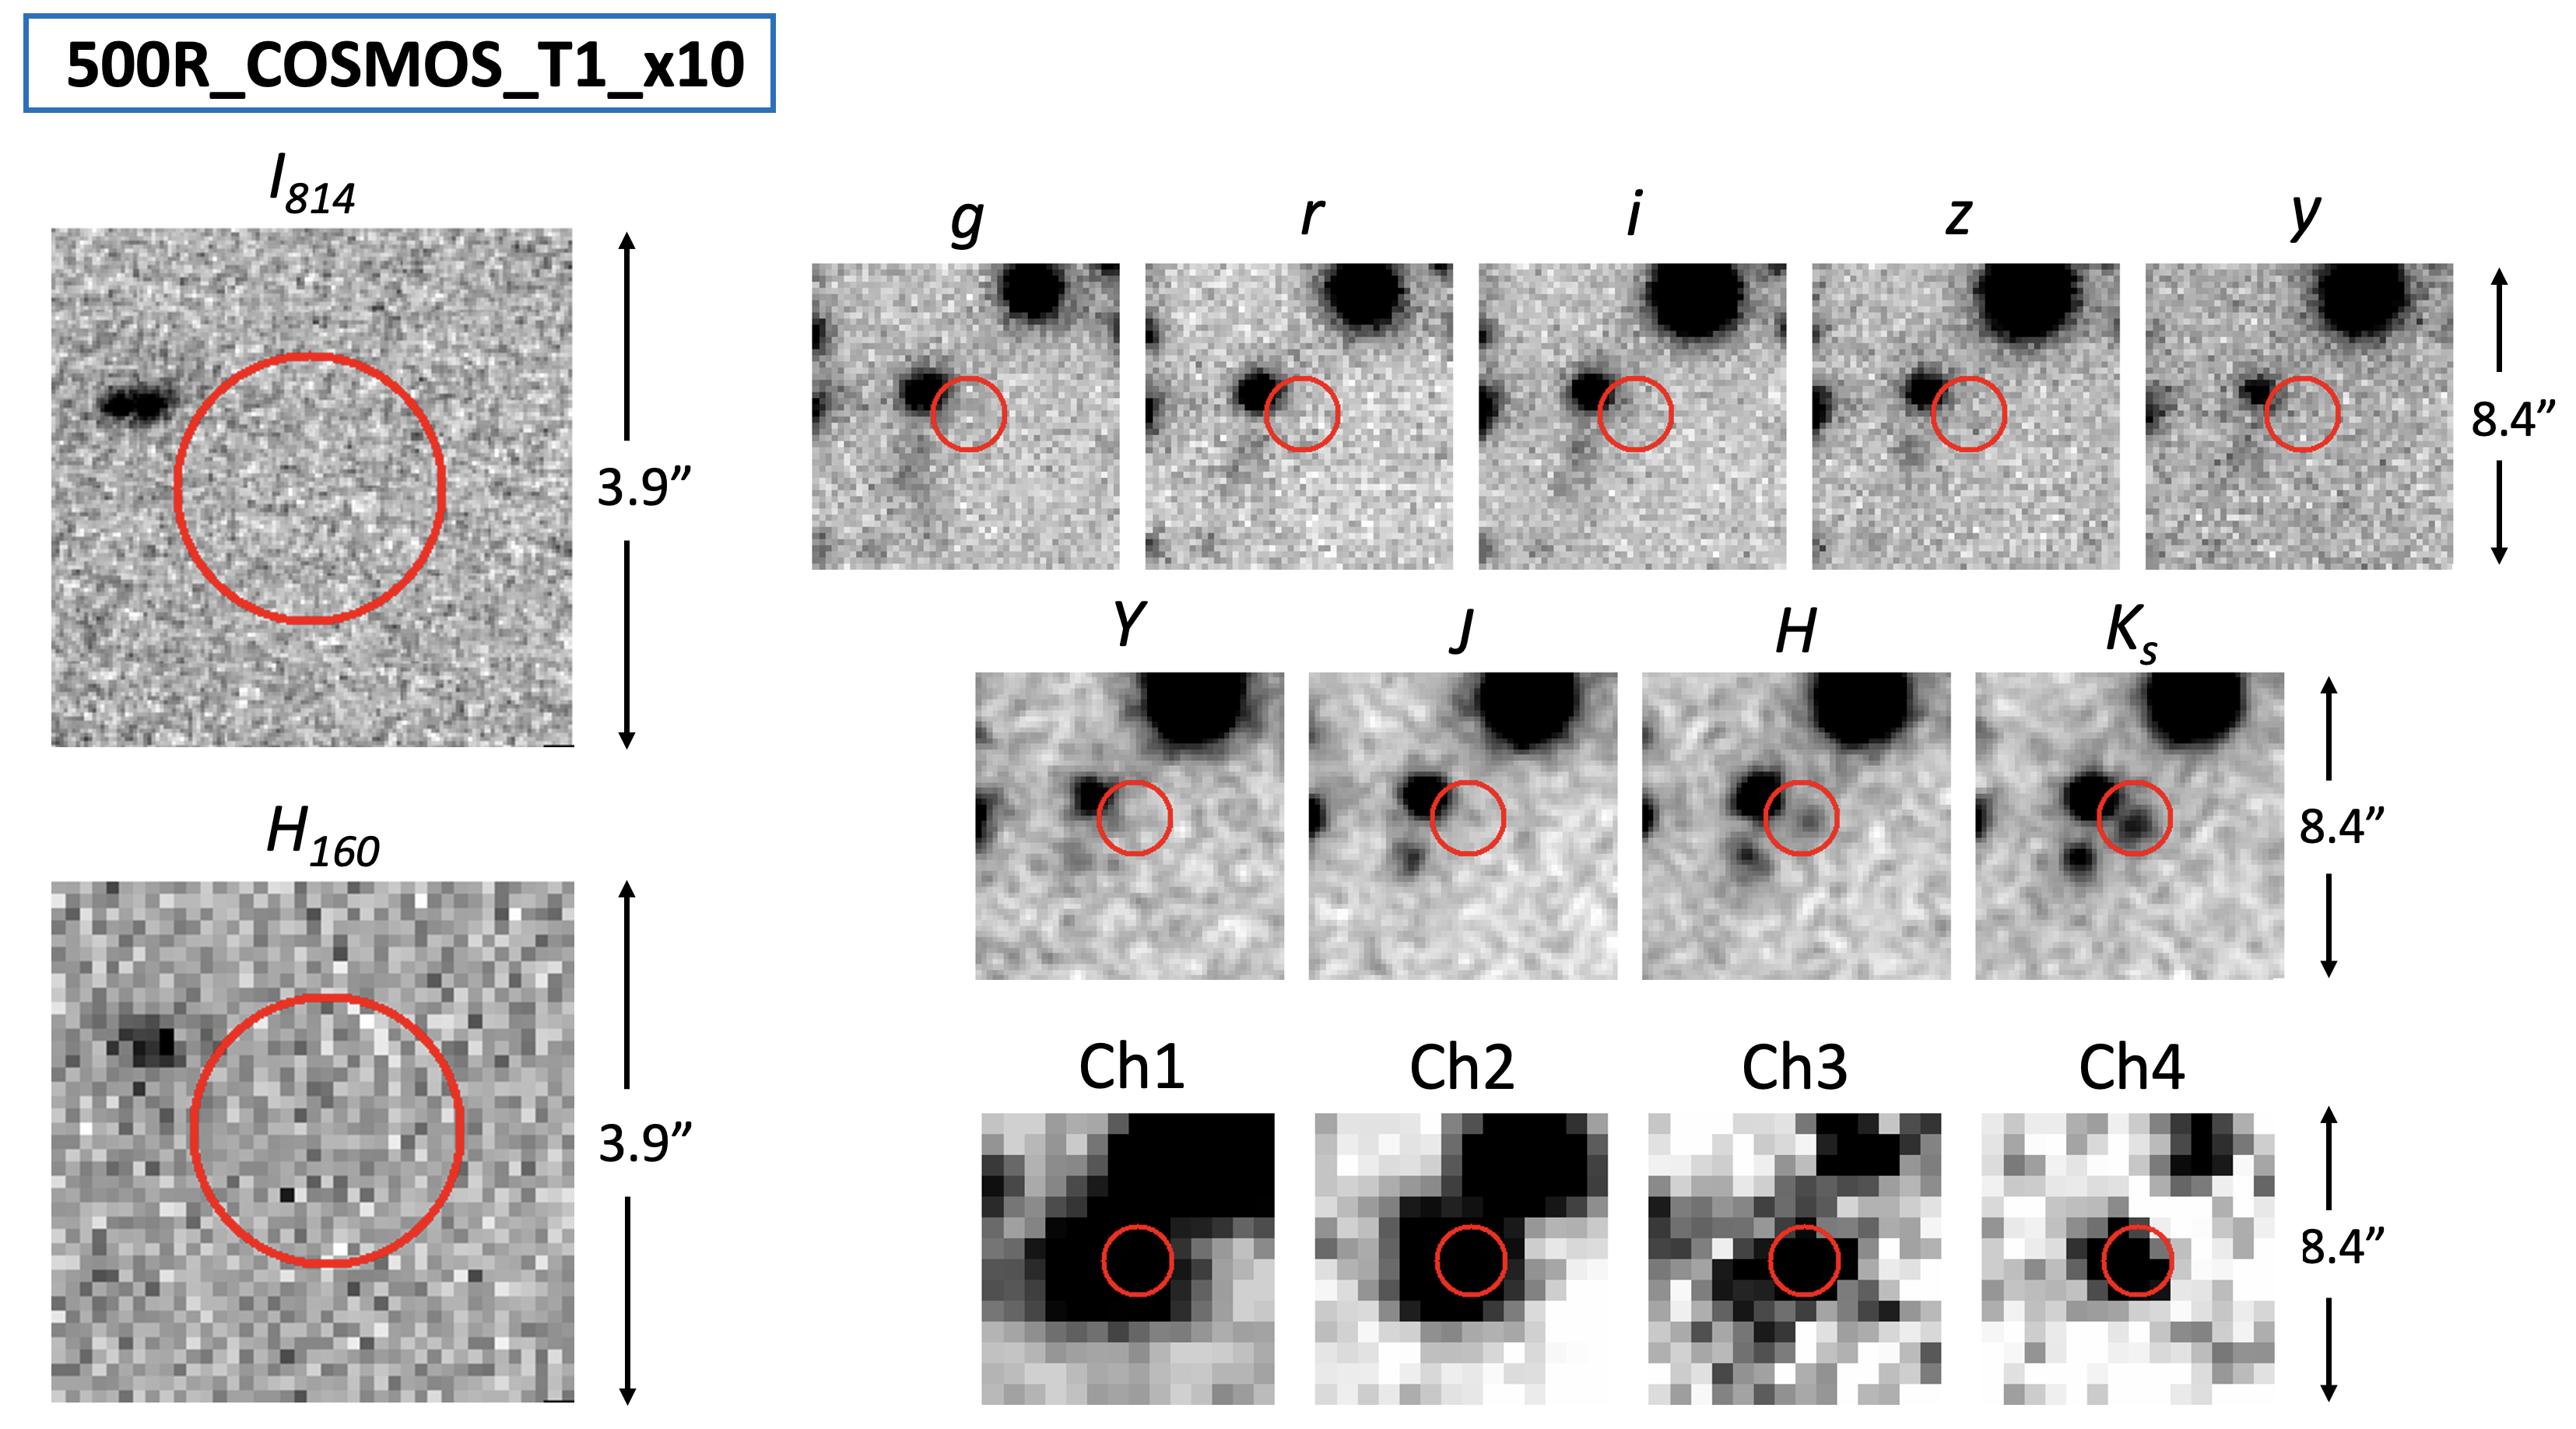
3.2.5 500R_COSMOS_T1_x10
This is one of the sources whose HiIdx have been revised because of the new ALMA identifications, and yet still survives the criterion of HiIdx(500) . The optical-to-NIR images are shown in Figure 7. At the exact ALMA location, there is no detection in either or .
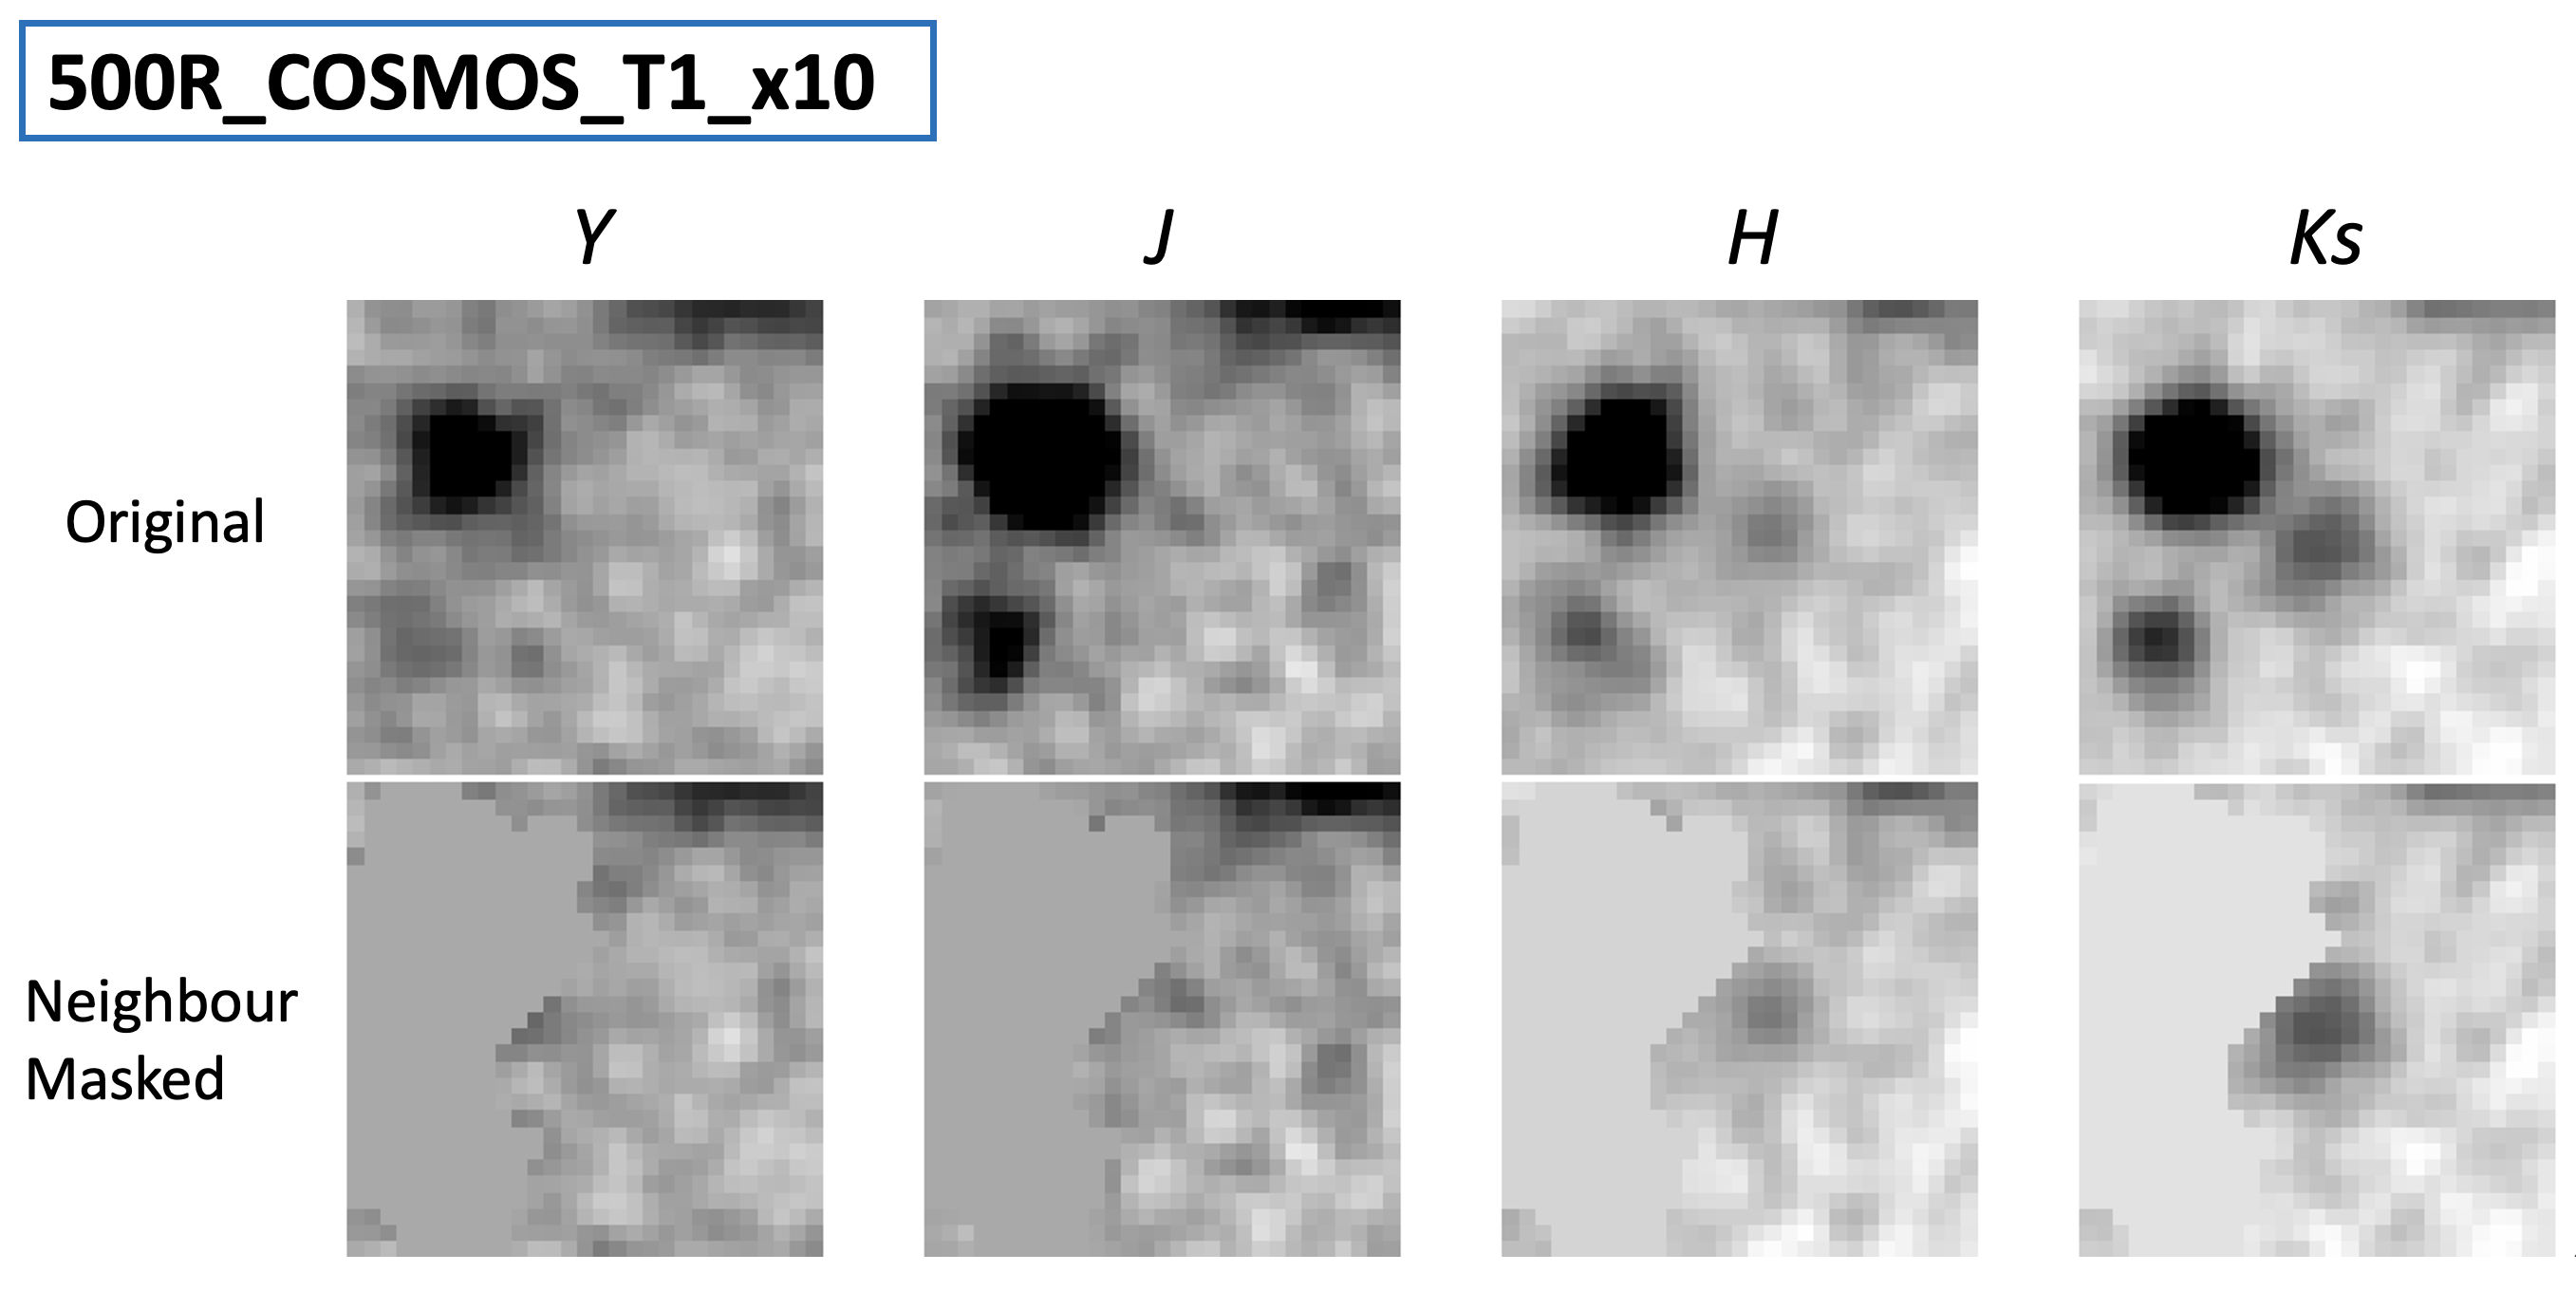
The 500 m riser counterpart is invisible in all the HSC images. It is visible in the UltraVISTA images, especially in and . However, it is not included in the UltraVISTA DR4 catalog. We were able to extract this source, together with its two neighbours. While these neighbours are not as close to the target as in the cases of 500R_x08 and x31, subtracting them would still benefit the photometry. However, the same GALFIT procedure used previously was not successful here: the northeastern neighbour is much brighter than the target, and its subtraction would corrupt the image at the target location. Therefore, we opted to mask the main bodies of these two neighbours and carried out the photometry in the masked images. Similar to the photometry for 500R_x08 and x31, we ran SExtractor in the dual-image mode using the neighbour-masked image as the detection image. The results are listed in Table 2. Figure 8 shows the comparison of the original and the masked images. Interestingly, only part of the counterpart is visible in and . This could be explained by the uneven distribution of dust. This source is also prominent in the IRAC images, however it is severely blended with at least one of its close neighbours. We therefore do not attempt to obtain its IRAC photometry.
3.3 Counterparts of the contaminators
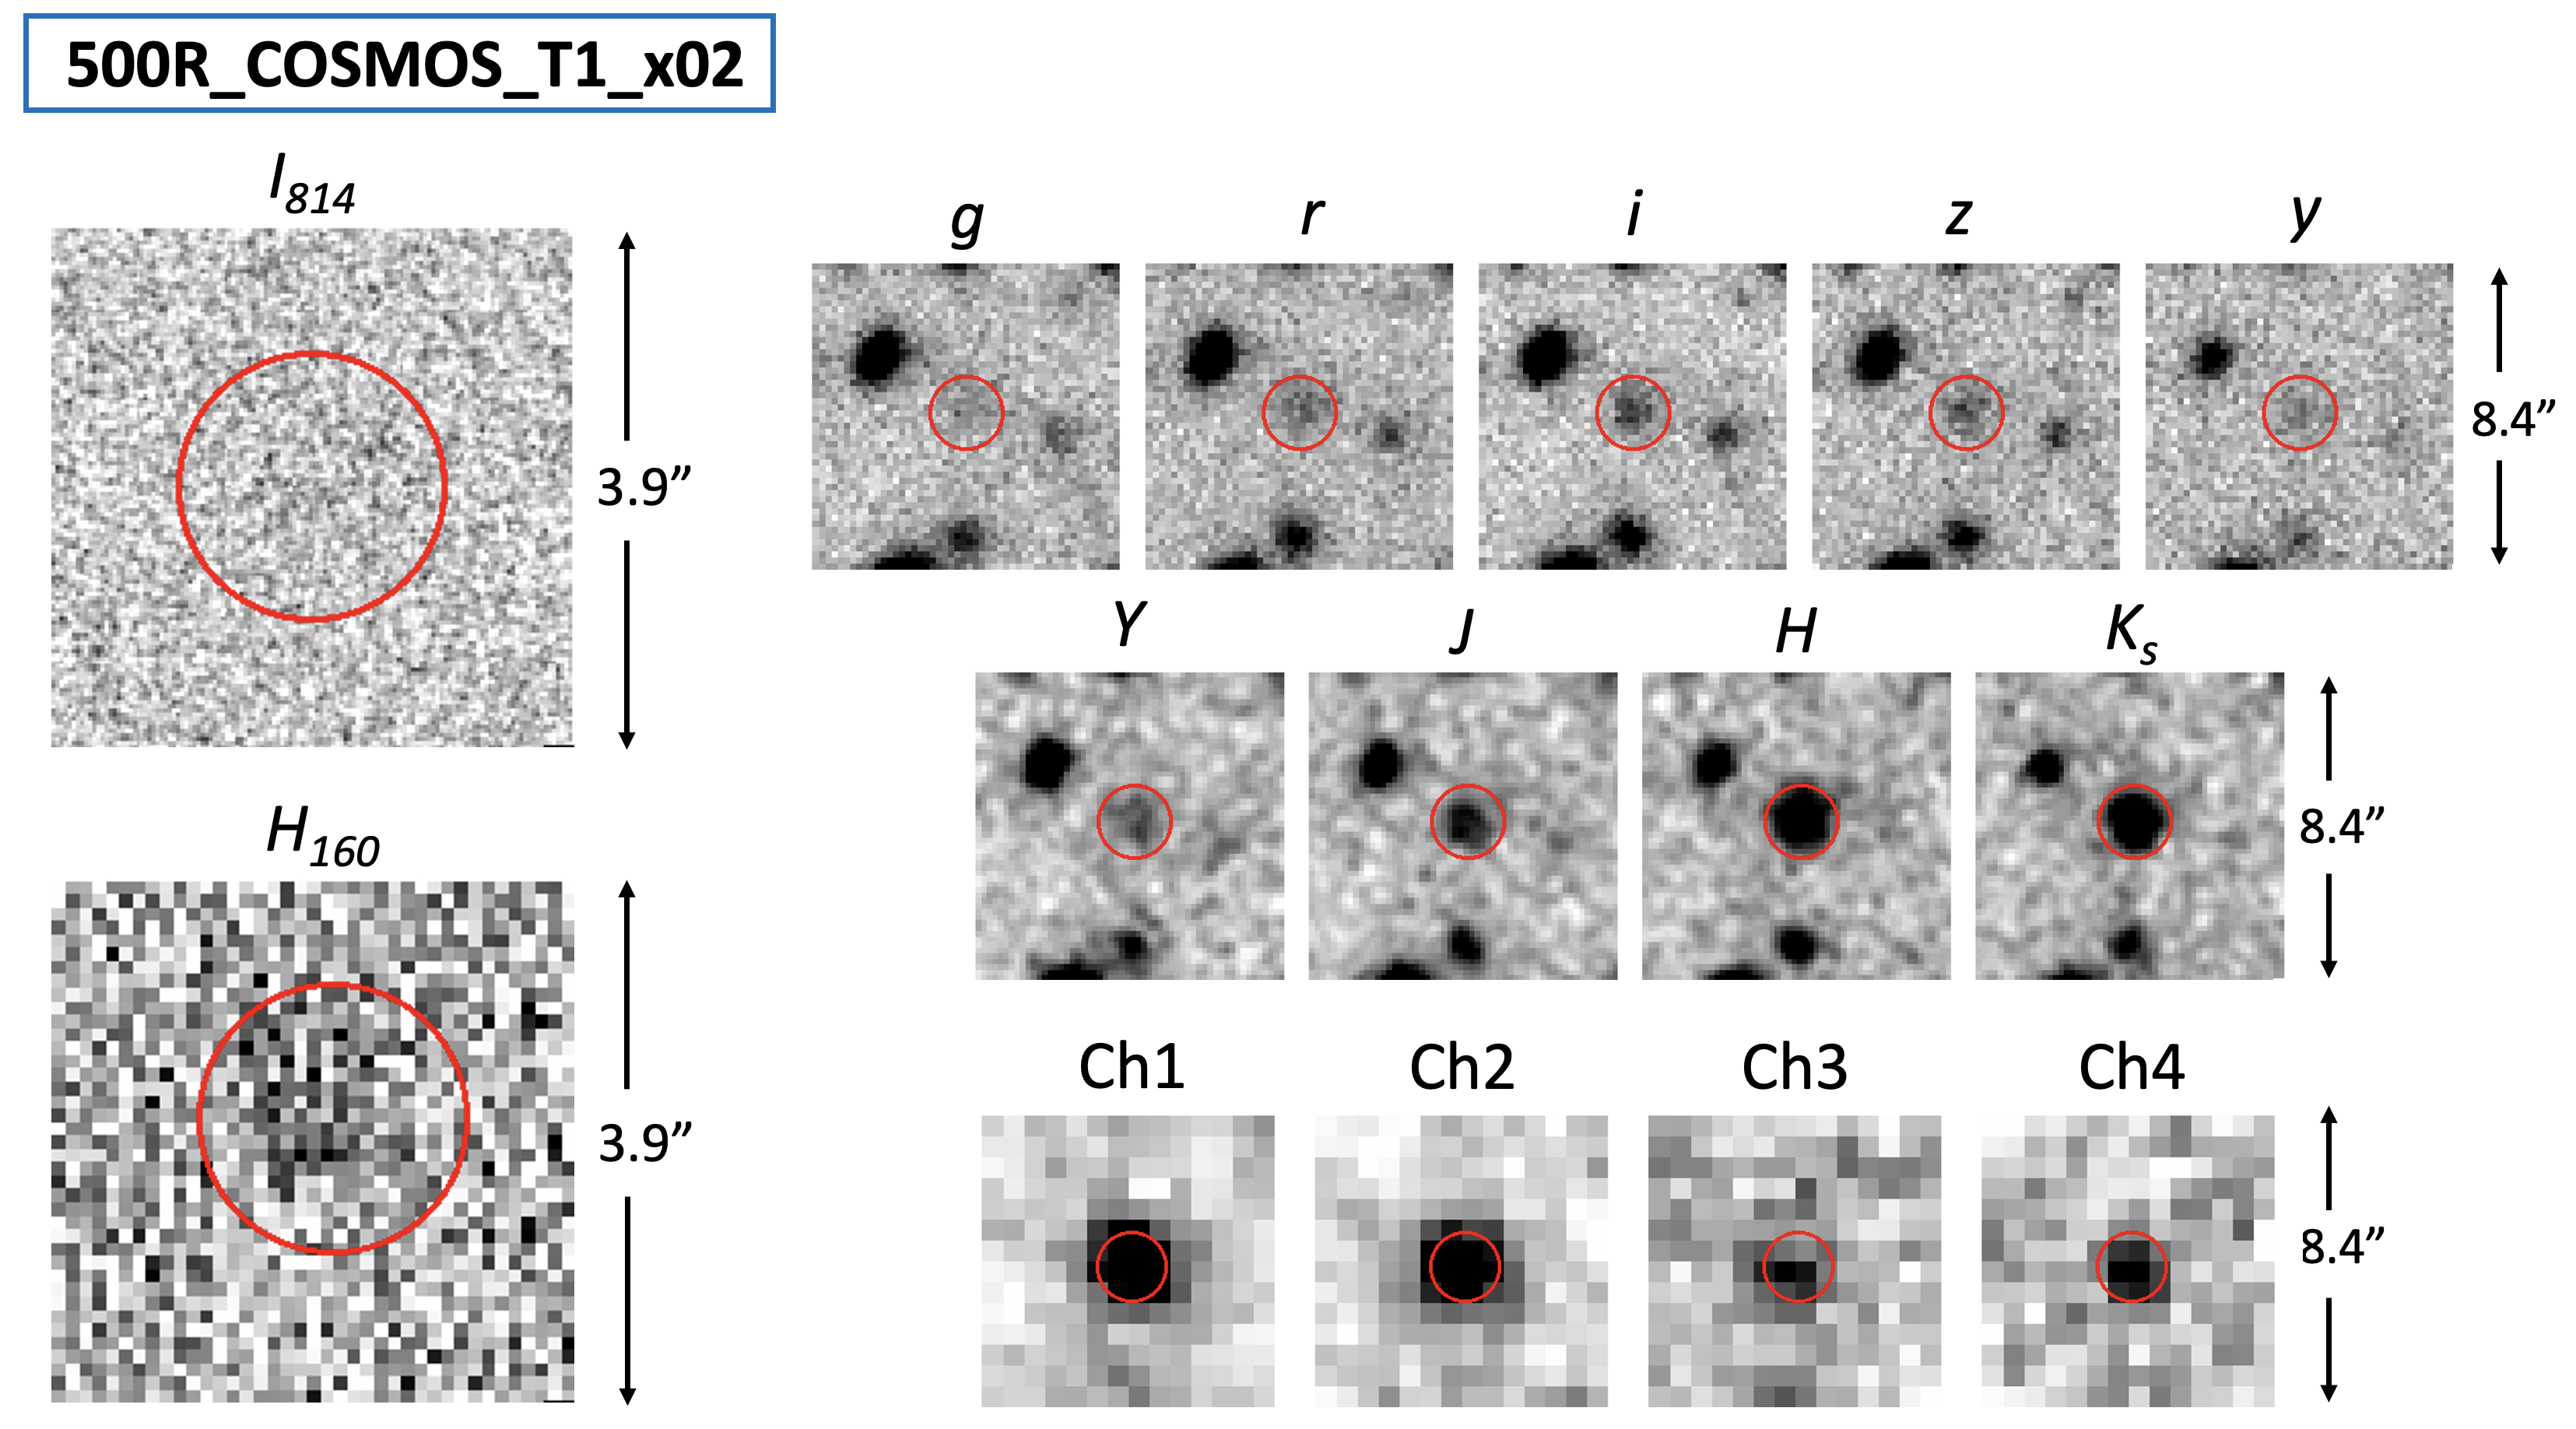
3.3.1 500R_COSMOS_T1_x02
The counterpart identified by the ALMA data corresponds to a bright VLA source at exactly the same location, which is 6″.13 away from the HerMES centroid. The VLA source was noted in YMHF20, but it was not taken as the right counterpart due to the large positional separation. With the new identification, its HiIdx(500) is revised to 0.13 and no longer satisfies HiIdx(500) . Its optical-to-NIR images are shown in Figure 9.
At the ALMA location, the source is invisible in and is very weak in ( mag). However, it is clearly detected in the HSC and bands, which means that it must be at . It is prominent in the other HSC images as well as in the UltraVISTA images. Its photometry, which is from the team catalogs, is listed in Table 2. The image is significantly more extended than the PSF, and is elongated in the N-S direction. This suggests that it might have two components. Moreover, it is detected in IRAC. In MIPS, its has 16716 Jy.
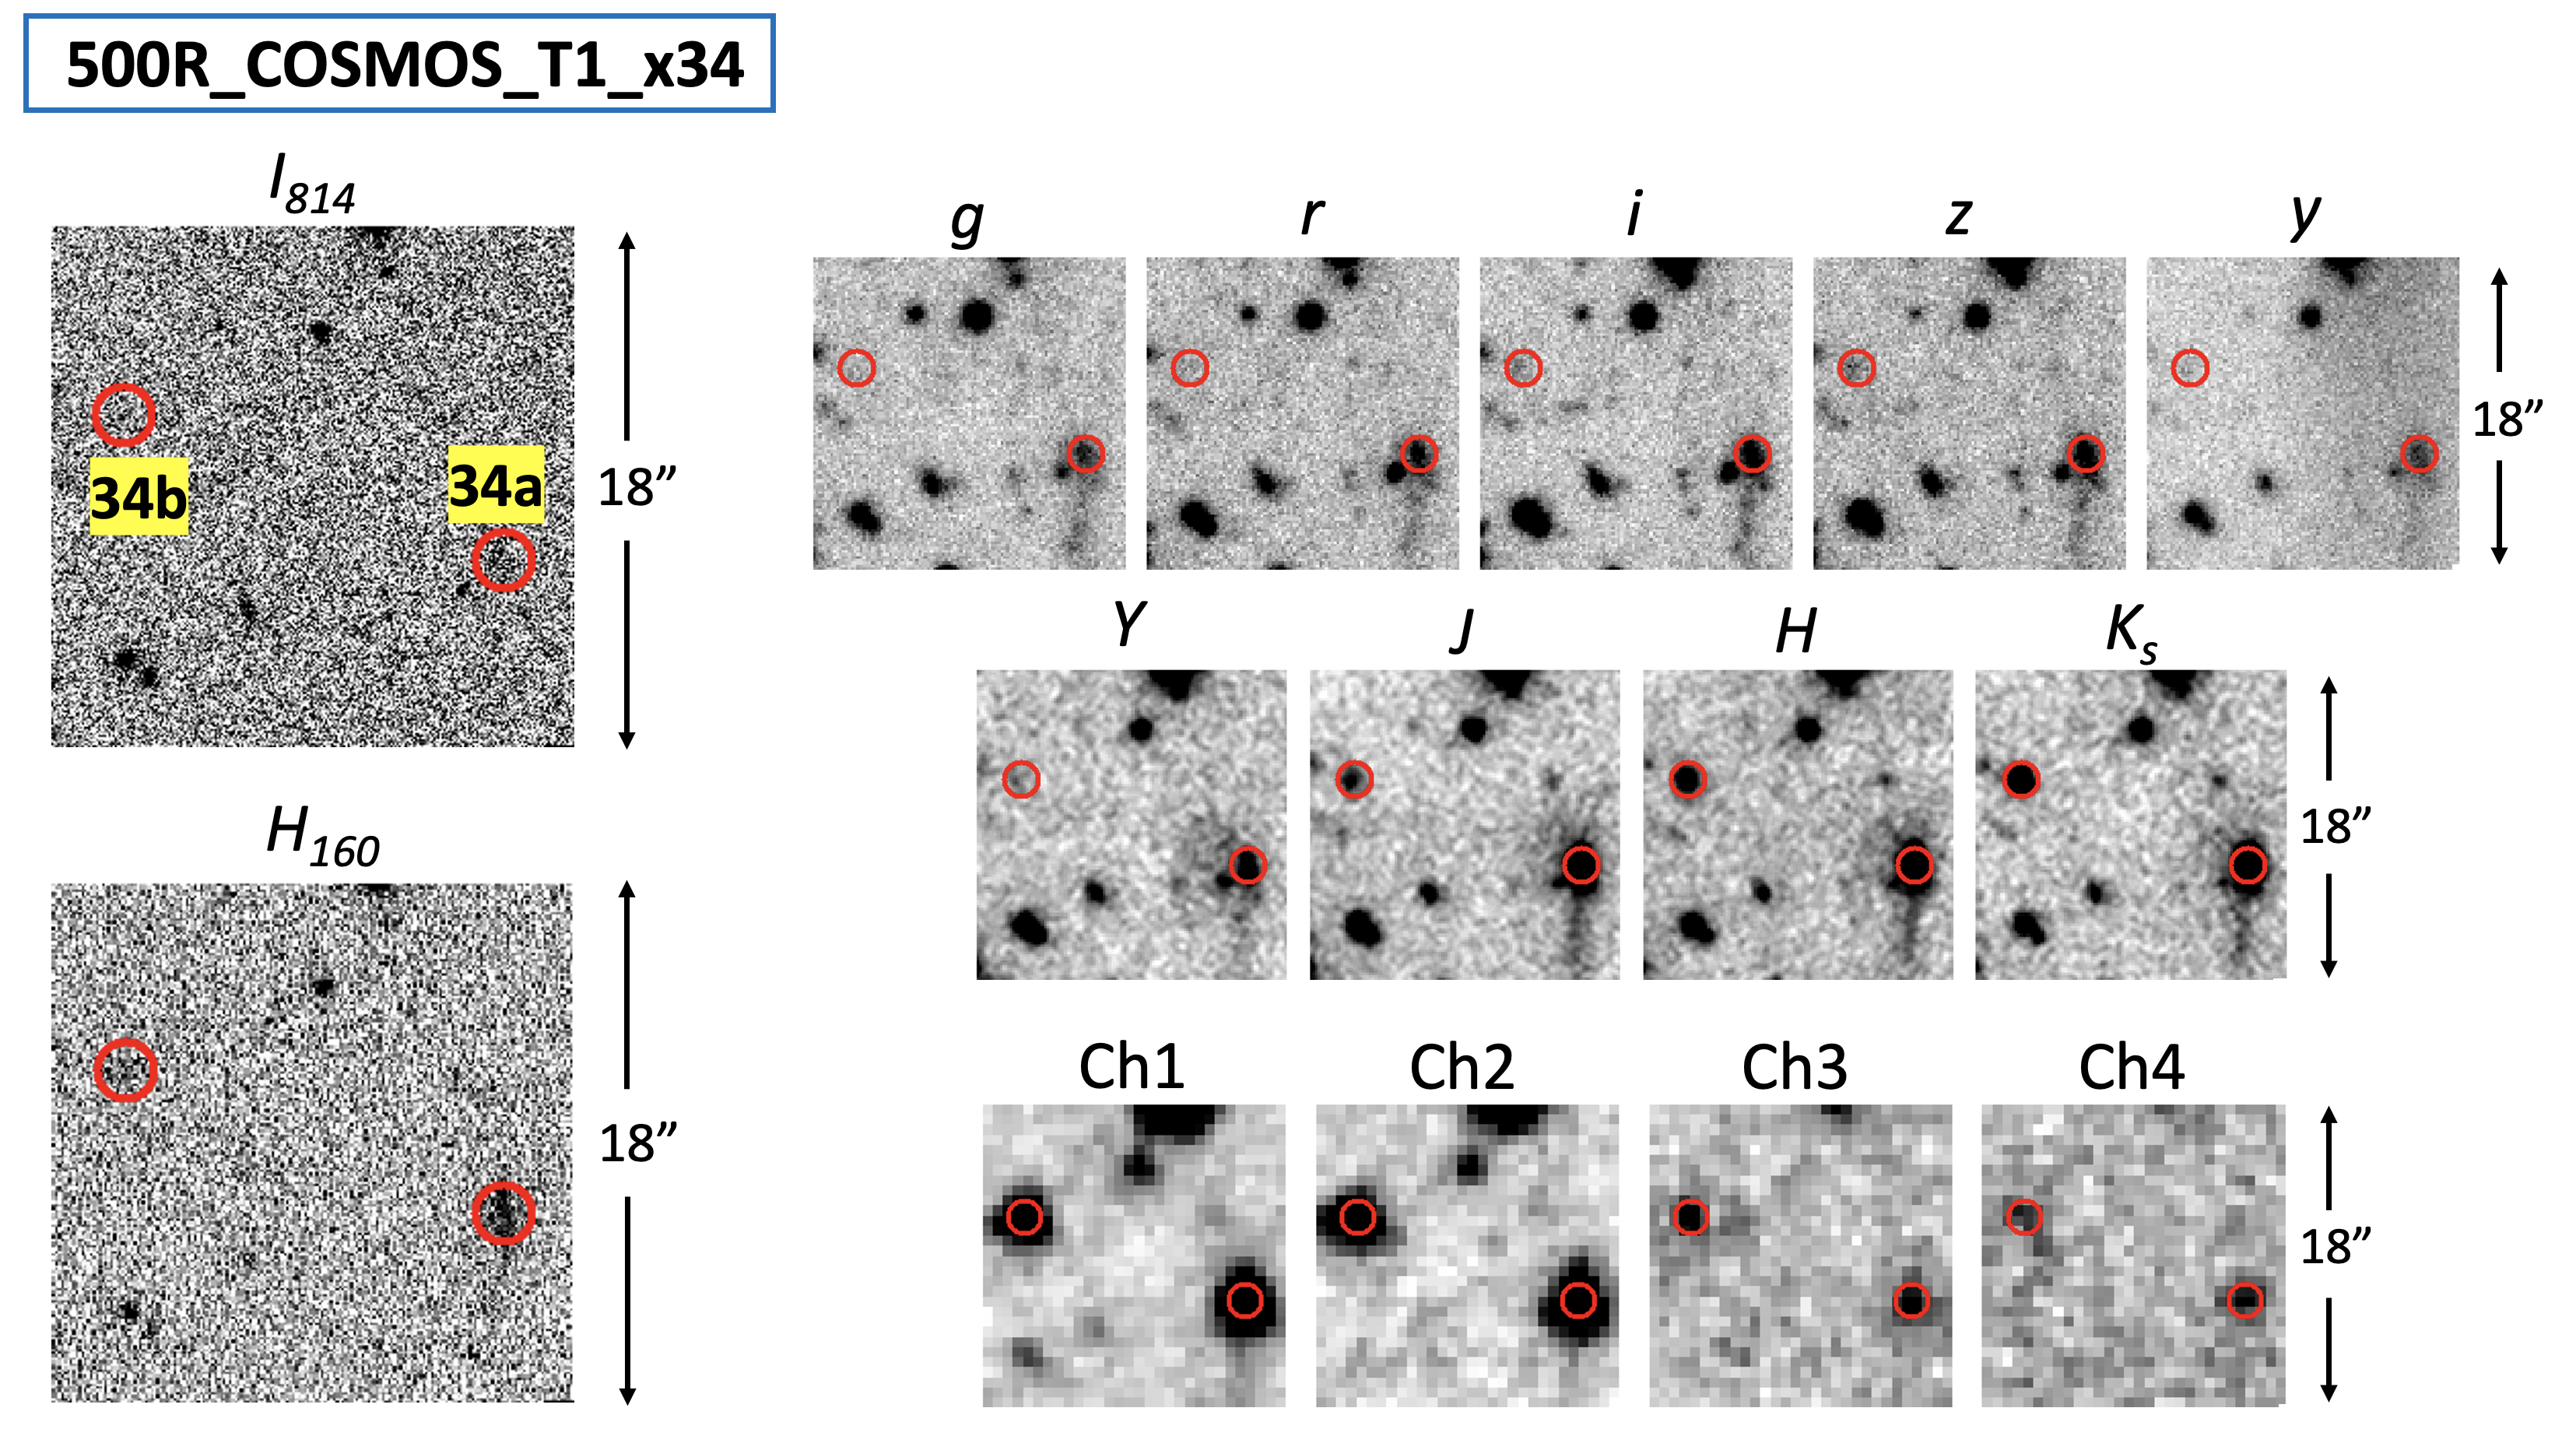
3.3.2 500R_COSMOS_T1_x34
As revealed by the ALMA data, this source has two counterparts that are separated by 14″.0, both of which have VLA counterparts included in the 3 GHz catalog. We designate the one to the South-West as the “34a” component and the one to the North-East as the “34b” component, respectively. The HerMES centroid fall in between these two components, and the separation between this centroid to either is larger than the criterion adopted in YMHF20. As the result, YMHF20 treated it as with no counterpart in 3 GHz, although component 34a was noted in YMHF20 as being a close neighbour at 6″.0 from the HerMES centroid. With the new identification, we combine the radio flux densities of both 34a and 34b and revise the HiIdx value of this source to 0.12.
The optical-to-NIR images of this source is shown in Figure 10. Component 34a is visible in both and , and our photometry gives 26.670.22 and 21.600.09 mag, respectively. Component 34b is only visible in , which we obtained 23.350.33 mag. Both components are clearly detected in the HSC, the UltraVISTA and the S-COSMOS images. The quoted photometry in Table 2 are from the respective catalogs in the data releases.
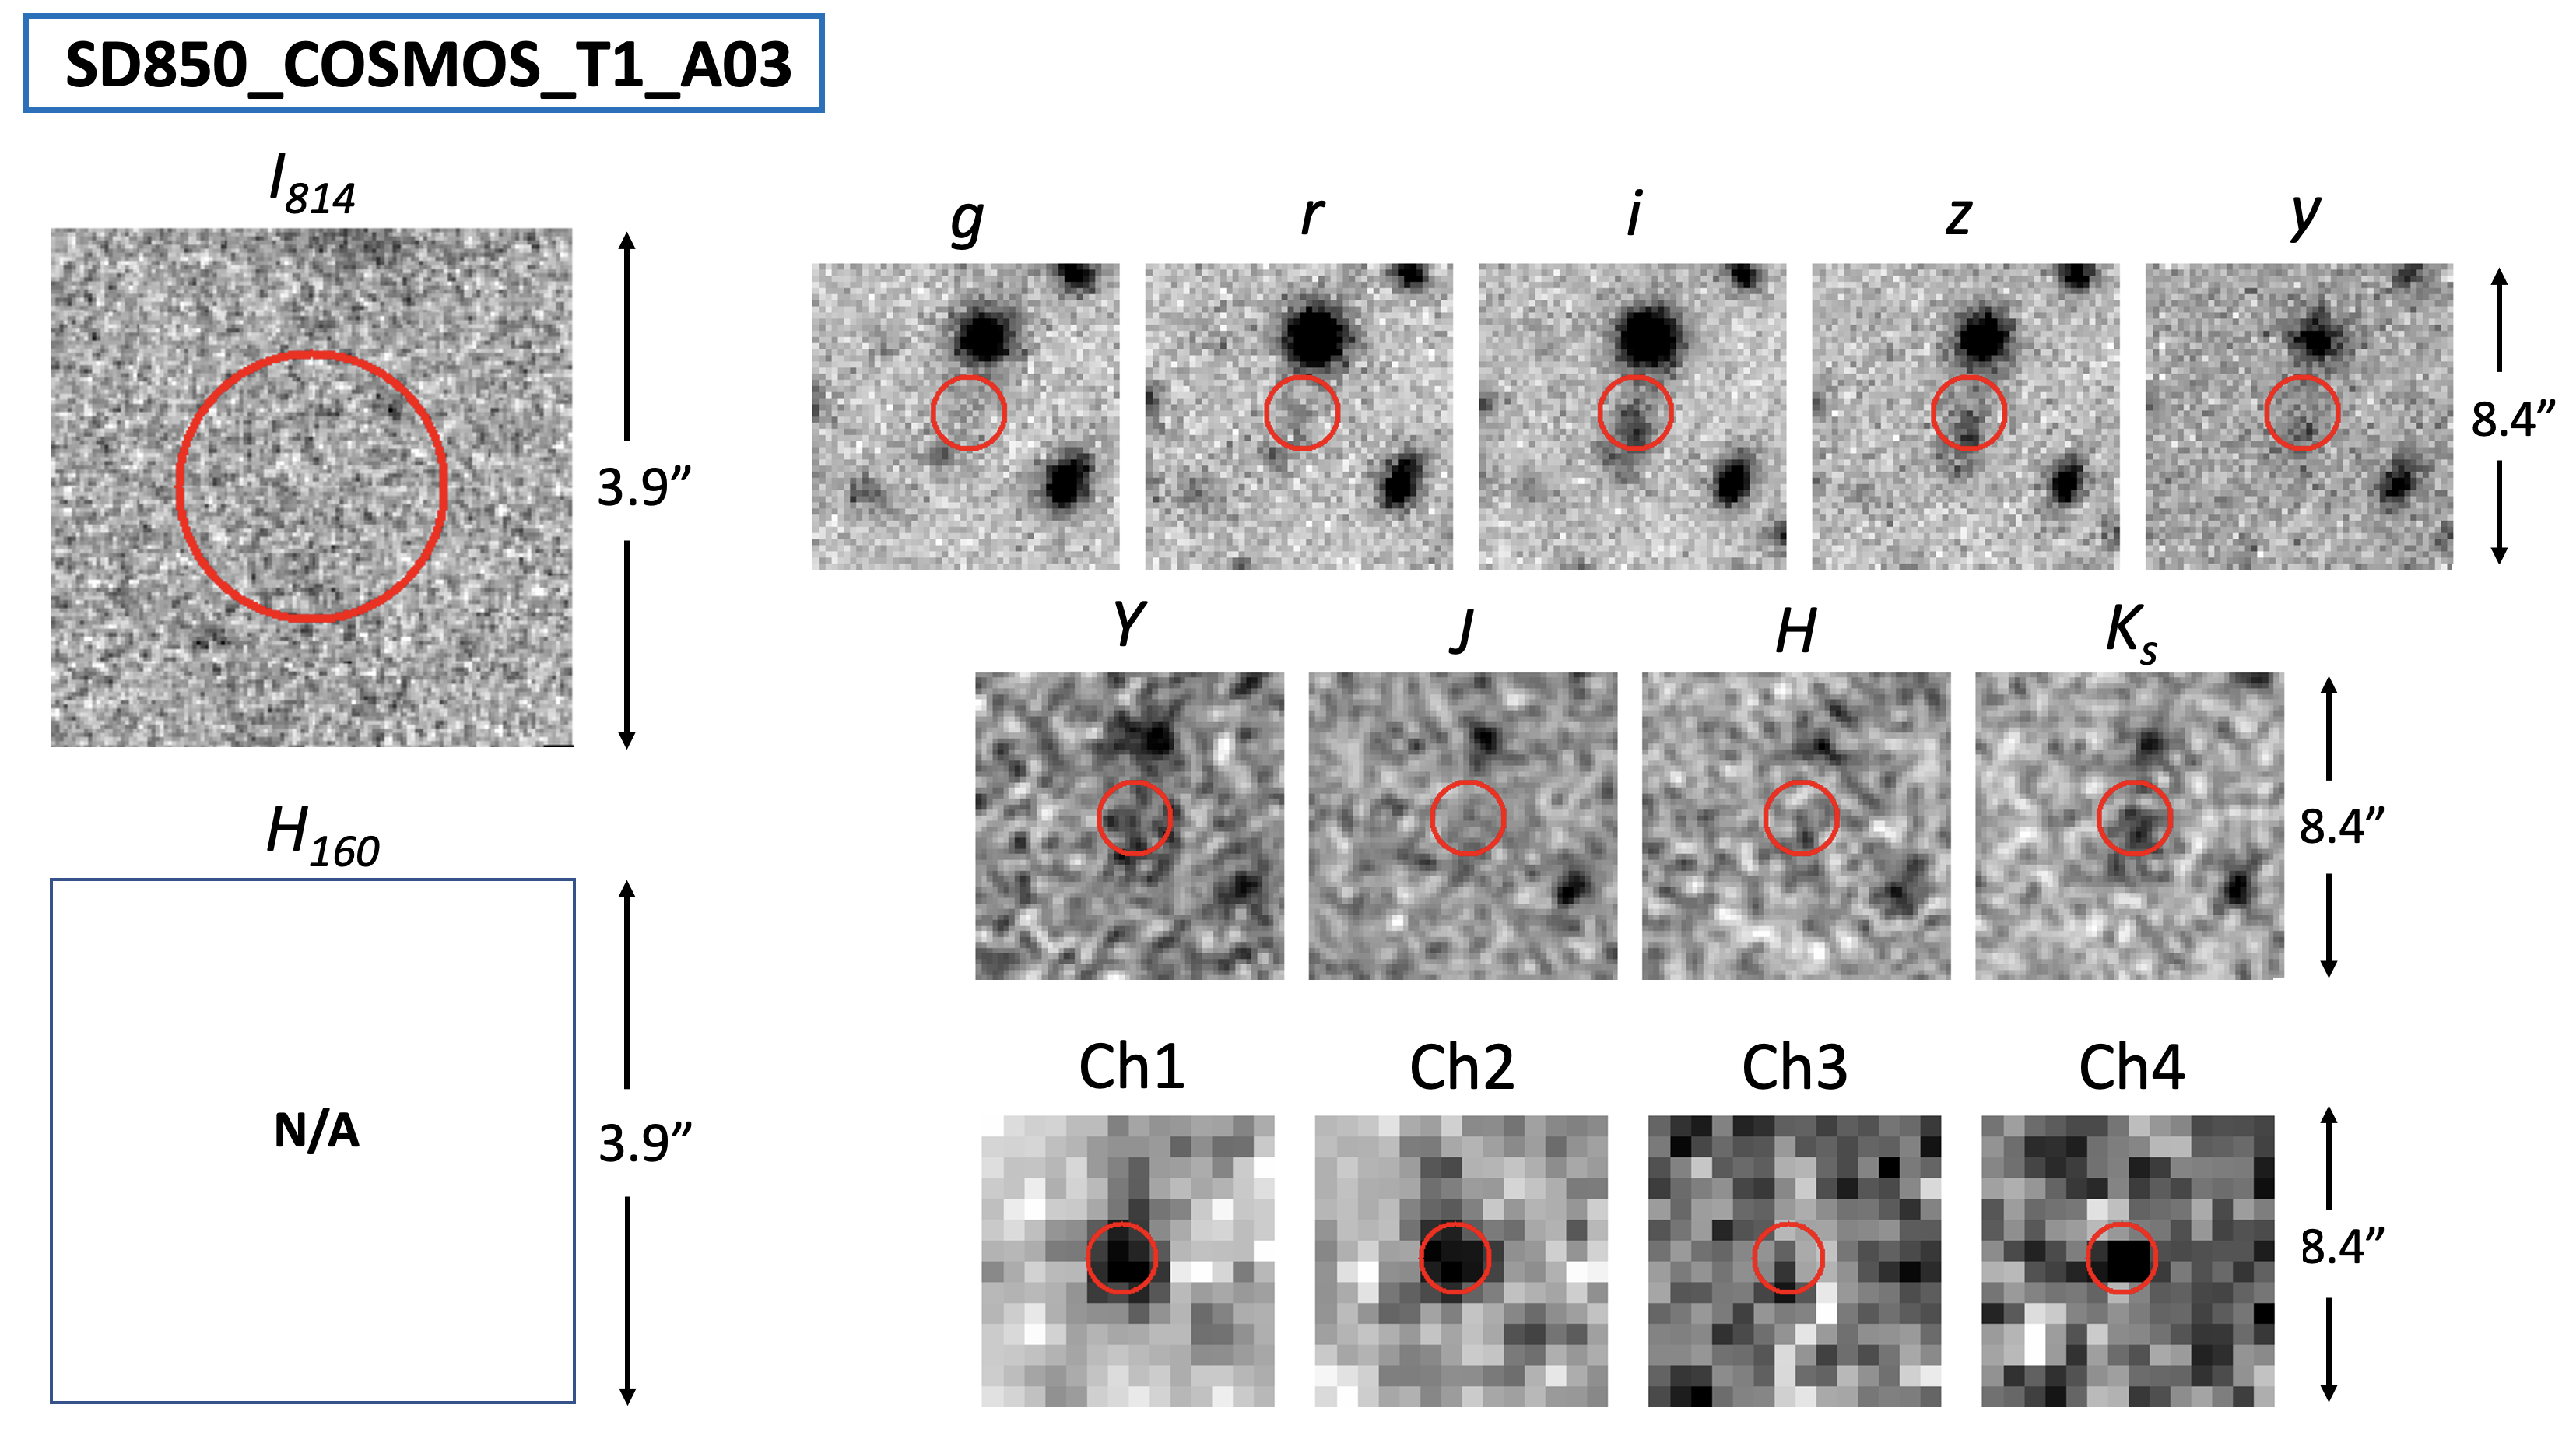
3.3.3 SD850_COSMOS_T1_A03
At 20″ away from this SCUBA2 source, there is a prominent HerMES source in all three SPIRE bands. This HerMES source is different from this SPIRE dropout, and in fact has a different 3 GHz counterpart. For this SPIRE dropout, the ALMA data has identified its counterpart at 3″.0 from the SCUBA2 centroid. There is a prominent 3 GHz source at this location, which was noted in YMHF20 but was discarded because the separation is larger than the adopted criterion. With the new identification, this 3 GHz source is in fact the radio counterpart; the revised HiIdx is reduced to 0.22 and no longer satisfies the high- criterion of HiIdx(850) .
Its optical-to-NIR images are shown in Figure 11. The source is invisible in . Unfortunately, it does not have coverage. In the HSC images, the source seems to have two very close components that cannot be separated for photometry. However, one can still tell that the ALMA position is closer to the northern component, which is also the fainter one among the two in the HSC images. Both components are visible in , and this rules out the possibility that this SPIRE dropout could be at . In the UltraVISTA images, it is only visible in , and one can also identify the two close components as suggested by the HSC images. It is impossible to separate these two objects for photometry in any of the current images, and we treat them as being physically associated. The quoted photometry in HSC images is taken from the HSC catalog, and include both components as a single clump. The UltraVISTA catalog does not include this source; by our photometry, the clump of two components has 23.770.16 mag. It is detected in the IRAC Ch1/2 but is invisible in Ch3/4, and is also invisible in MIPS 24 m.
4 Support of the High-z Interpretation
Using the multi-band photometry as described above, we constructed the optical-to-NIR SEDs for these counterparts. The photometry is listed in Table 2, but , , Ch3, and Ch4 were not used due to the concern that they might introduce large systematic errors in the SED analysis because of their very different spatial resolutions as compared to the others. The analysis included the objects in Table 1 except two of them: (1) 500R_COSMOS_T1_x26 (“CRLE” at ) was excluded because its real counterpart is completely blocked by the foreground galaxy (see §3.2.3), and (2) 500R_COSMOS_T1_x24 could not be included because it is not detected in any of these optical-to-NIR bands. For 500R_COSMOS_T1_x31, we considered two scenarios, one with the IRAC photometry and the other without. We took this approach because it is uncertain whether the IRAC detections are significantly contaminated by the two neighbours visible in the UltraVISTA images, a reason detailed in §3.2.4.
We fit these SEDs to the population synthesis models of Bruzual & Charlot (2003, “BC03”). This resulted in their photometric redshifts () together with some other critical parameters that describe the underlying stellar populations, such as their stellar masses (), their ages (), etc. All this enables us to further examine whether the 500 m riser hosts could indeed be at high- based on their HiIdx values.
4.1 Host galaxy SED fitting process
We used Le Phare (Arnouts et al., 1999; Ilbert et al., 2006) to fit the SEDs. The system response curves in various bands were taken from the public websites of the corresponding instruments. We adopted a series of BC03 composite stellar population models constructed using simple stellar populations of solar metalliticity and the initial mass function (IMF) of Chabrier (2003). These composite models follow exponentially declining star formation histories, with the characteristic time scale varying from 10 Myr to 13 Gyr. We further assumed the dust extinction law of Calzetti et al. (1994) and allowed to vary from 0 to 1.5. The range of redshift was from to . Le Phare uses the formalism of Madau (1995) to account for the absorption due to intervening neutral hydrogen (H I) clouds, and also limits the age of the fit model to be smaller than the age of the universe at the fitted redshift. The step-size in redshift was set to . Le Phare also allows adjustments of photometric errors to account for the possible systematic errors across different instruments. For this purpose, we added in quadrature 0.1 mag to the photometric errors of the IRAC bands and 0.05 mag to the others. To guard against obviously inappropriate fits, we also applied a loose prior that the absolute magnitude in must be within and mag.
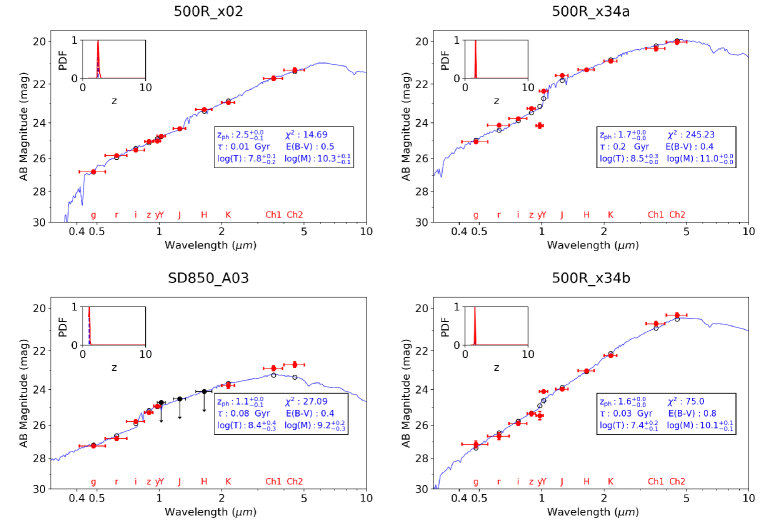
Le Phare takes the minimum approach in doing fitting, and produces a probability distribution function over the allowed redshift range (PDF; ). The redshift at which the PDF has its peak (i.e., the lowest ) is deemed as the best-fit , and its errors are computed using the redshifts where are from the lowest value. The model that results in the lowest at this redshift is what Le Phare calls as the best-fit model, and its associated parameters (such as , , etc.) are the best-fit values of these parameters. The common practice, however, is to adopt the median values instead of the best-fit values for these other parameters, because Le Phare generates errors associated with the median but not the best-fit values. We also adopted this common practice. A slight complication would occur when the PDF has more than one peak. In this case, we ran the software for the second time, which was to fix the redshift to the secondary peak to derive other parameters around this secondary solution.
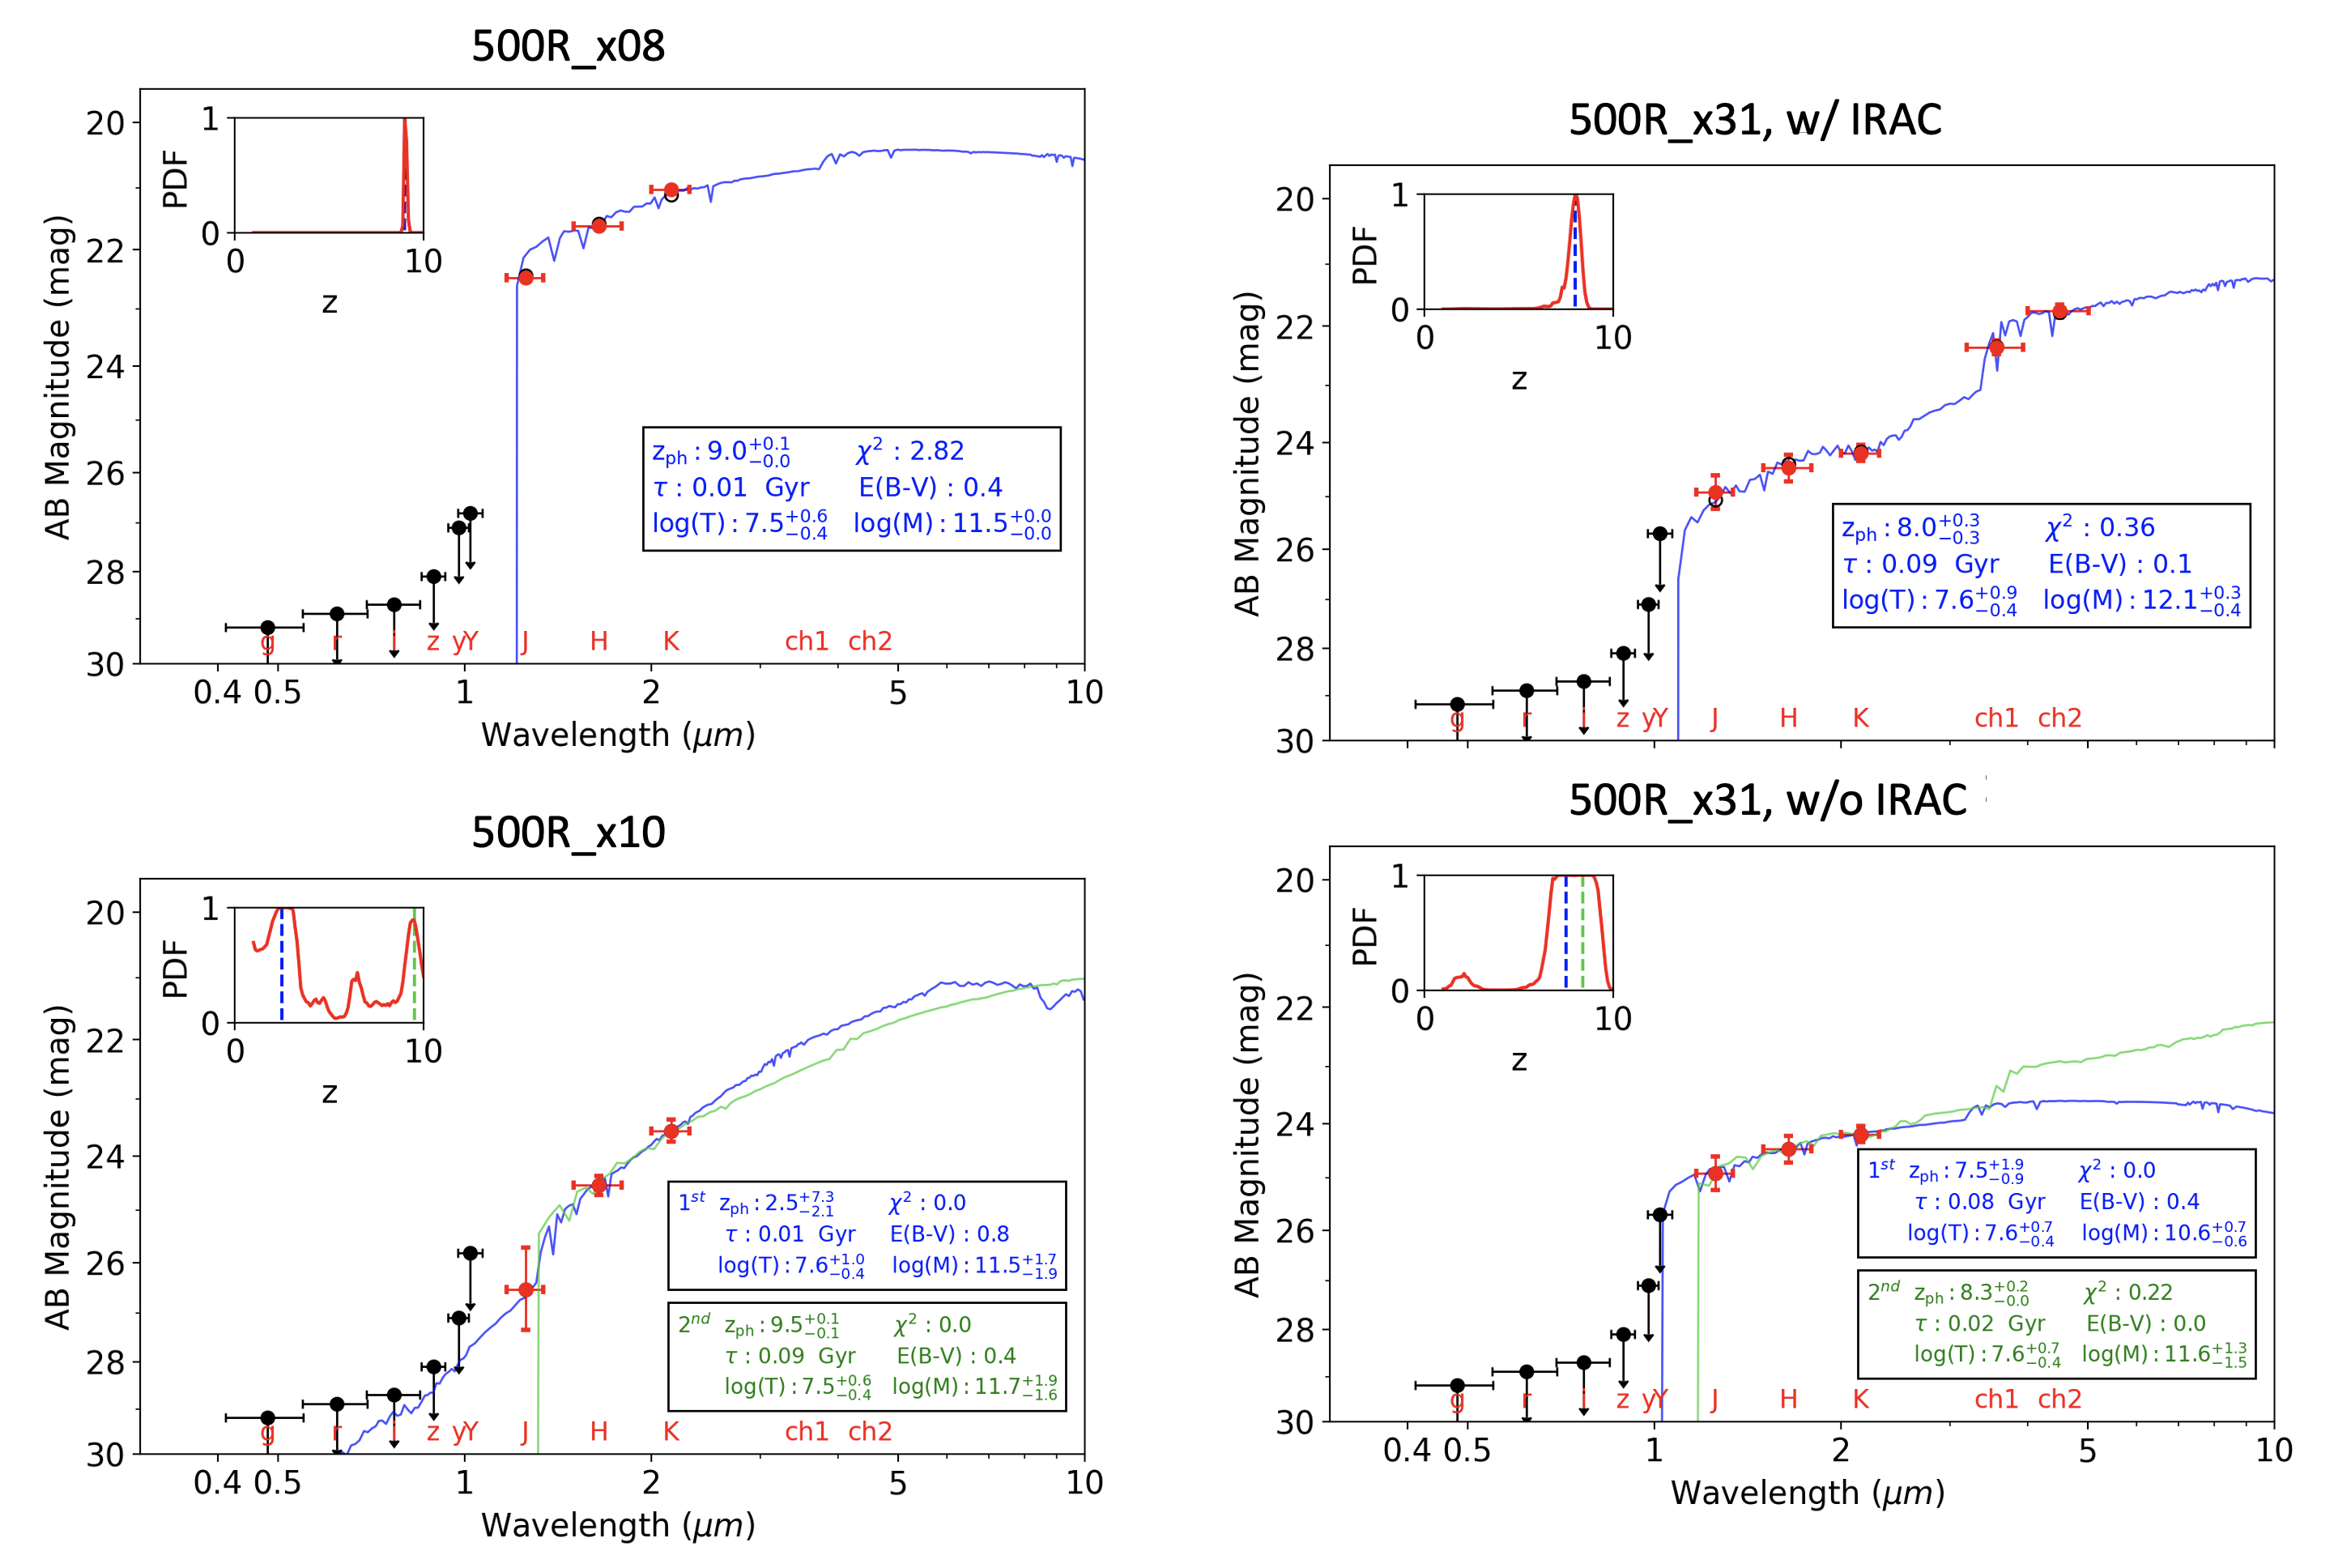
The results are summarized in Figure 12 and 13 for the high- candidates (500R_COSMOS_T1_x08, x31 and x10) and the contaminators (500R_COSMOS_T1_x02, x34 and SD850_COSMOS_T1_A03), respectively. Obviously, the analysis for the high- sample suffers from the limitted number of passbands that have positive detections. However, the non-detection bands are deep enough that they play a critcal role in narrowing down the possible solutions. While the estimates cannot be taken as the confirmations, they do lend support that the HiIdx(500) criterion works: 500R_COSMOS_T1_x08 has ; x31 has and 7.5 in the scenarios with and without the IRAC photometry, respectively; x10 has a rather chaotic PDF whose first peak is at , but it still has the second peak at . In other words, the objects in the high- sample all have acceptable solutions at .
In contrast, the contaminators all have best-fit at –3 where the bulk of FIR/sub-mm sources lie. For 500R_COSMOS_T1_x34, its two components (“a” and “b”) were fitted independently and the results are also shown as such; it is very likely that they are at the same redshift and therefore physically associated, however the conclusion is not yet definite.
4.2 Total IR luminosity and instantaneous SFR
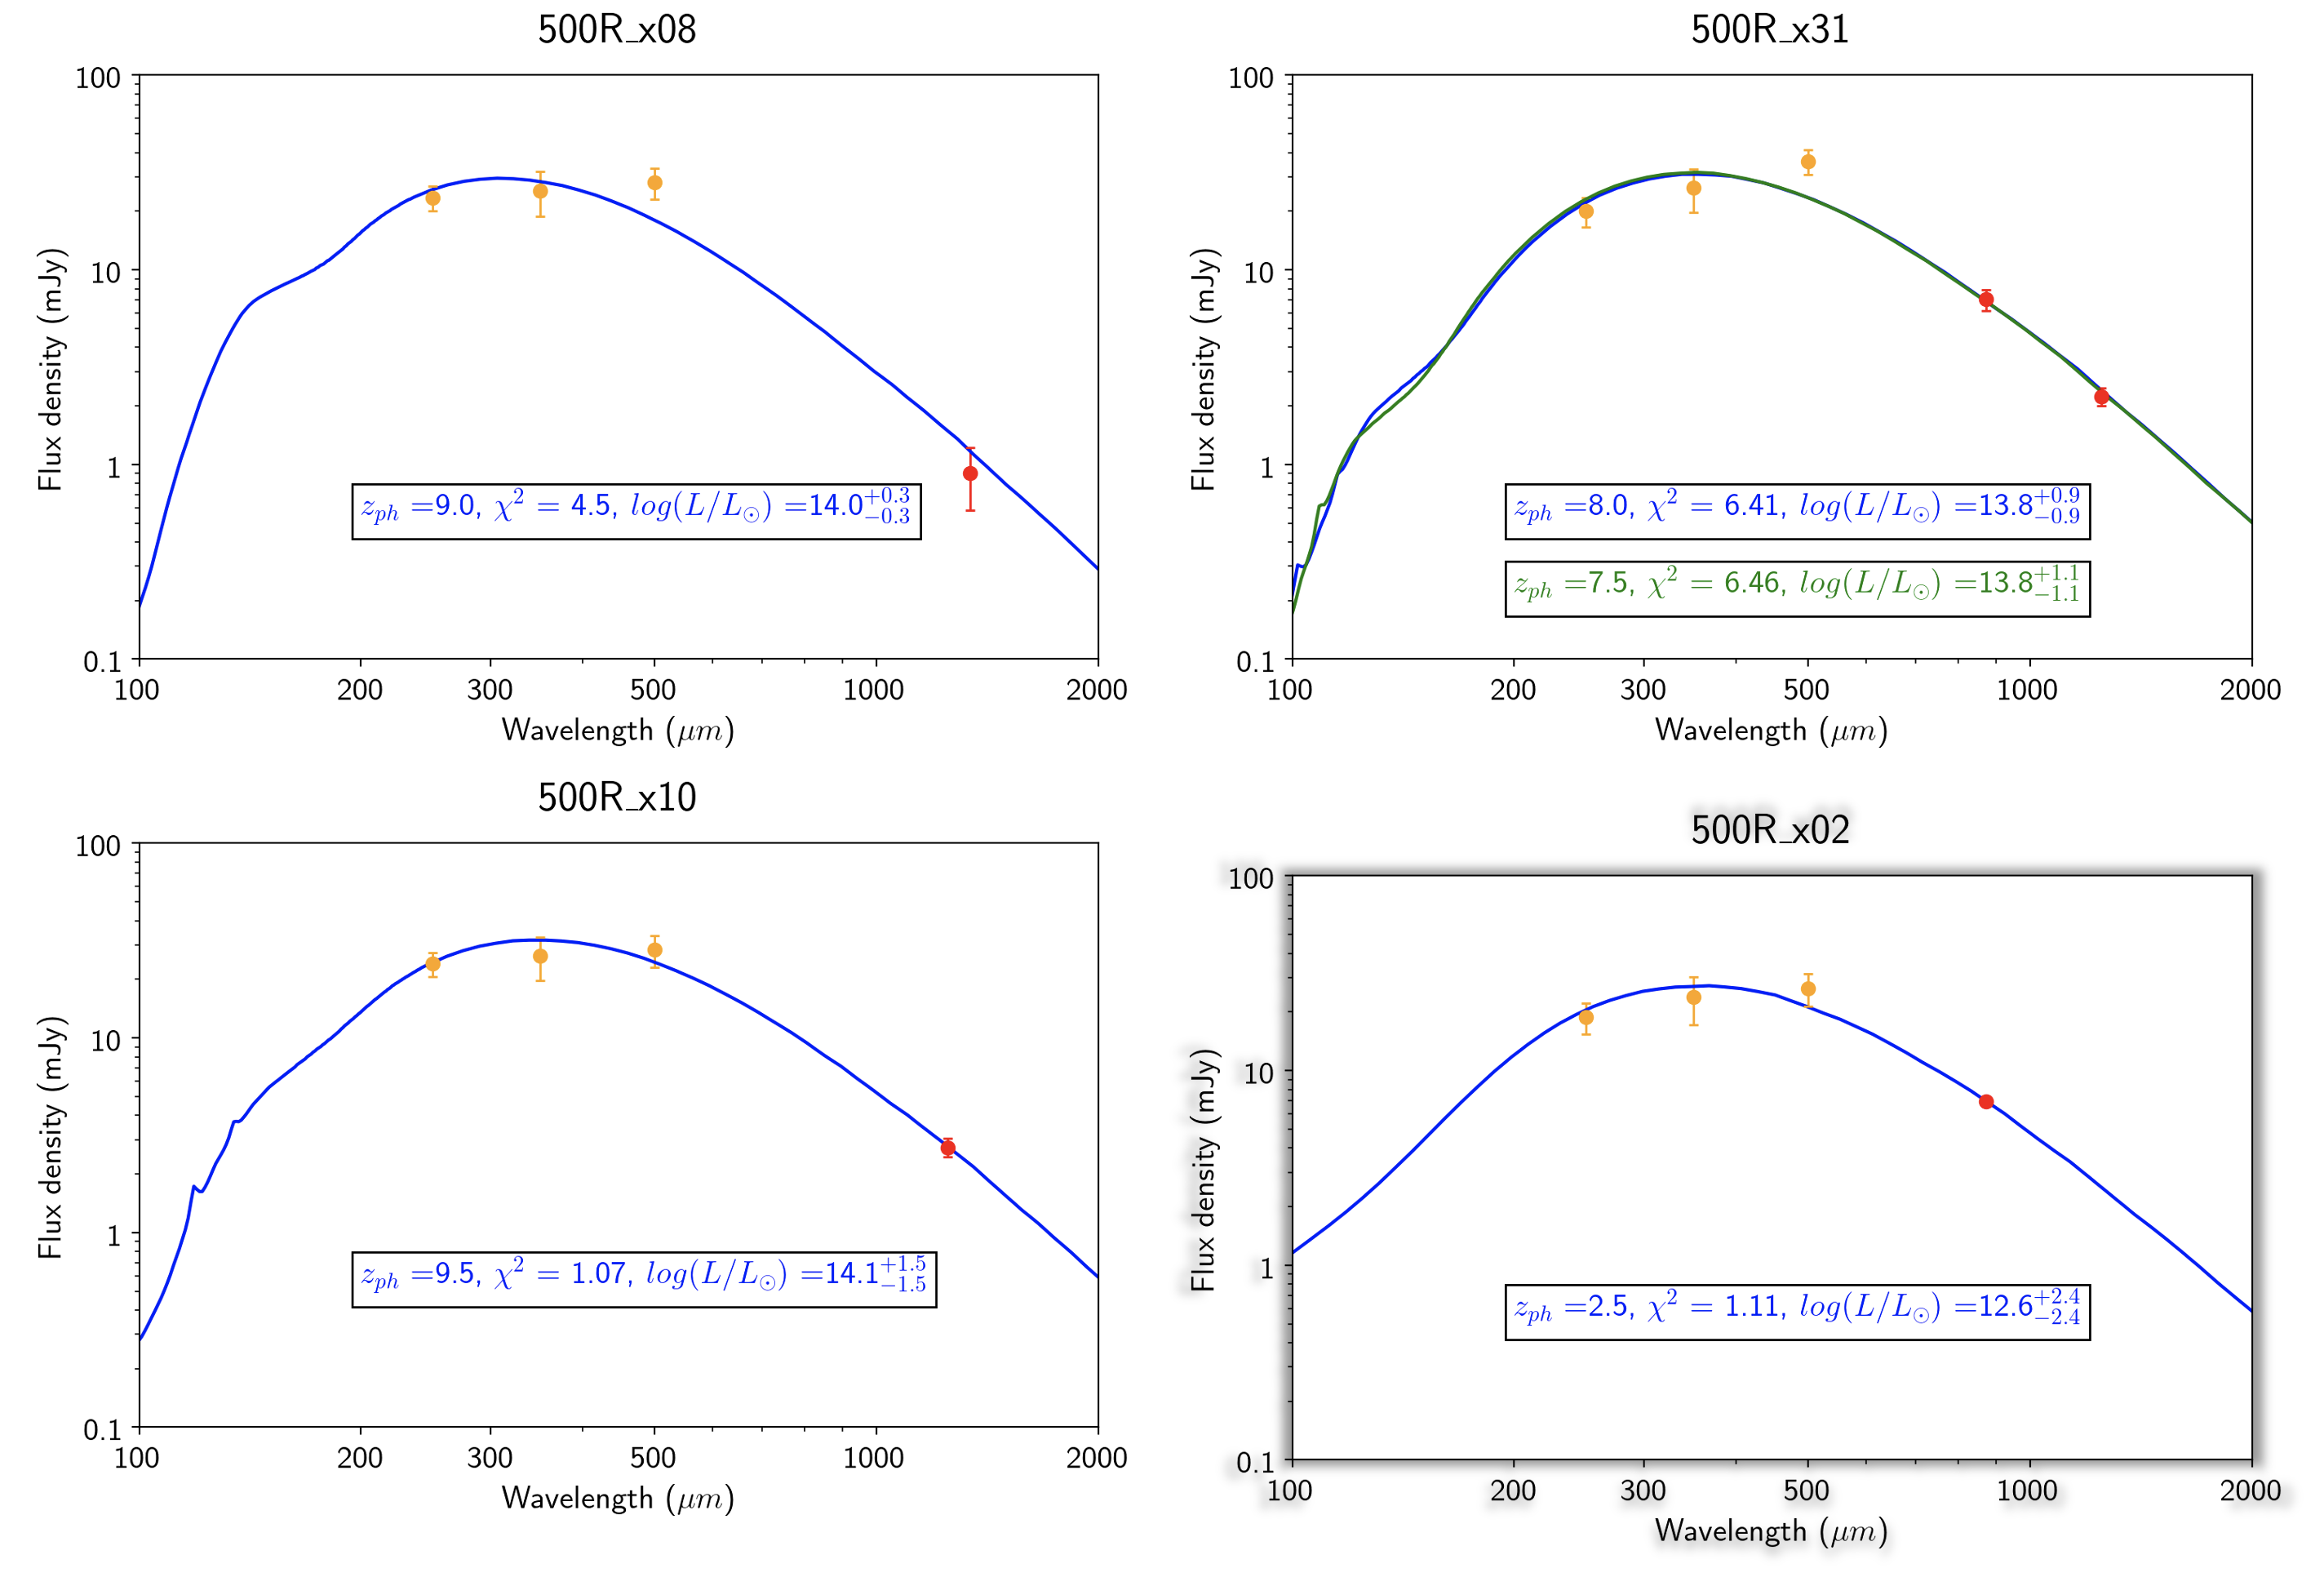
Using the derived , we fit the FIR-to-mm SEDs of our objects to the starburst models of Siebenmorgen & Krügel (2007) to obtain their total IR luminosity (; integrated over rest-frame 8–1000 m), following Ma & Yan (2015). The SPIRE photometry is taken from YMHF20. The ALMA photometry (see Table 1) are incorporated. This analysis includes three objects in the high- sample: 500R_COSMOS_T1_x08, x31 (both of its peak solutions are used) and x10 (its secondary peak solution is used). It also include one object (500R_COSMOS_T1_x02) in the contaminator sample. We do not fit the other two contaminators: 500R_COSMOS_T1_x34 is made of two components and we cannot obtain their fluxes separately in their SPIRE bands, and SD850_COSMOS_T1_A03 only has photometry at the Rayleigh-Jeans tail.
Figure 14 shows the fitting results. For 500R_COSMOS_T1_x31, its peak solutions in both scenarios are used. For 500R_COSMOS_T1_x10, its secondary peak solution is used. Without exception, all the three high- candidates have : 500R_COSMOS_T1_x08, x31 and x10 have , 6.3 and , respectively. Applying the standard conversion given by Kennicutt (1998), which is after adjusting for a Chabrier IMF, the inferred instantaneous SFRs are , 6.3 and yr-1, respectively.
4.3 Stellar masses: potential problem or not
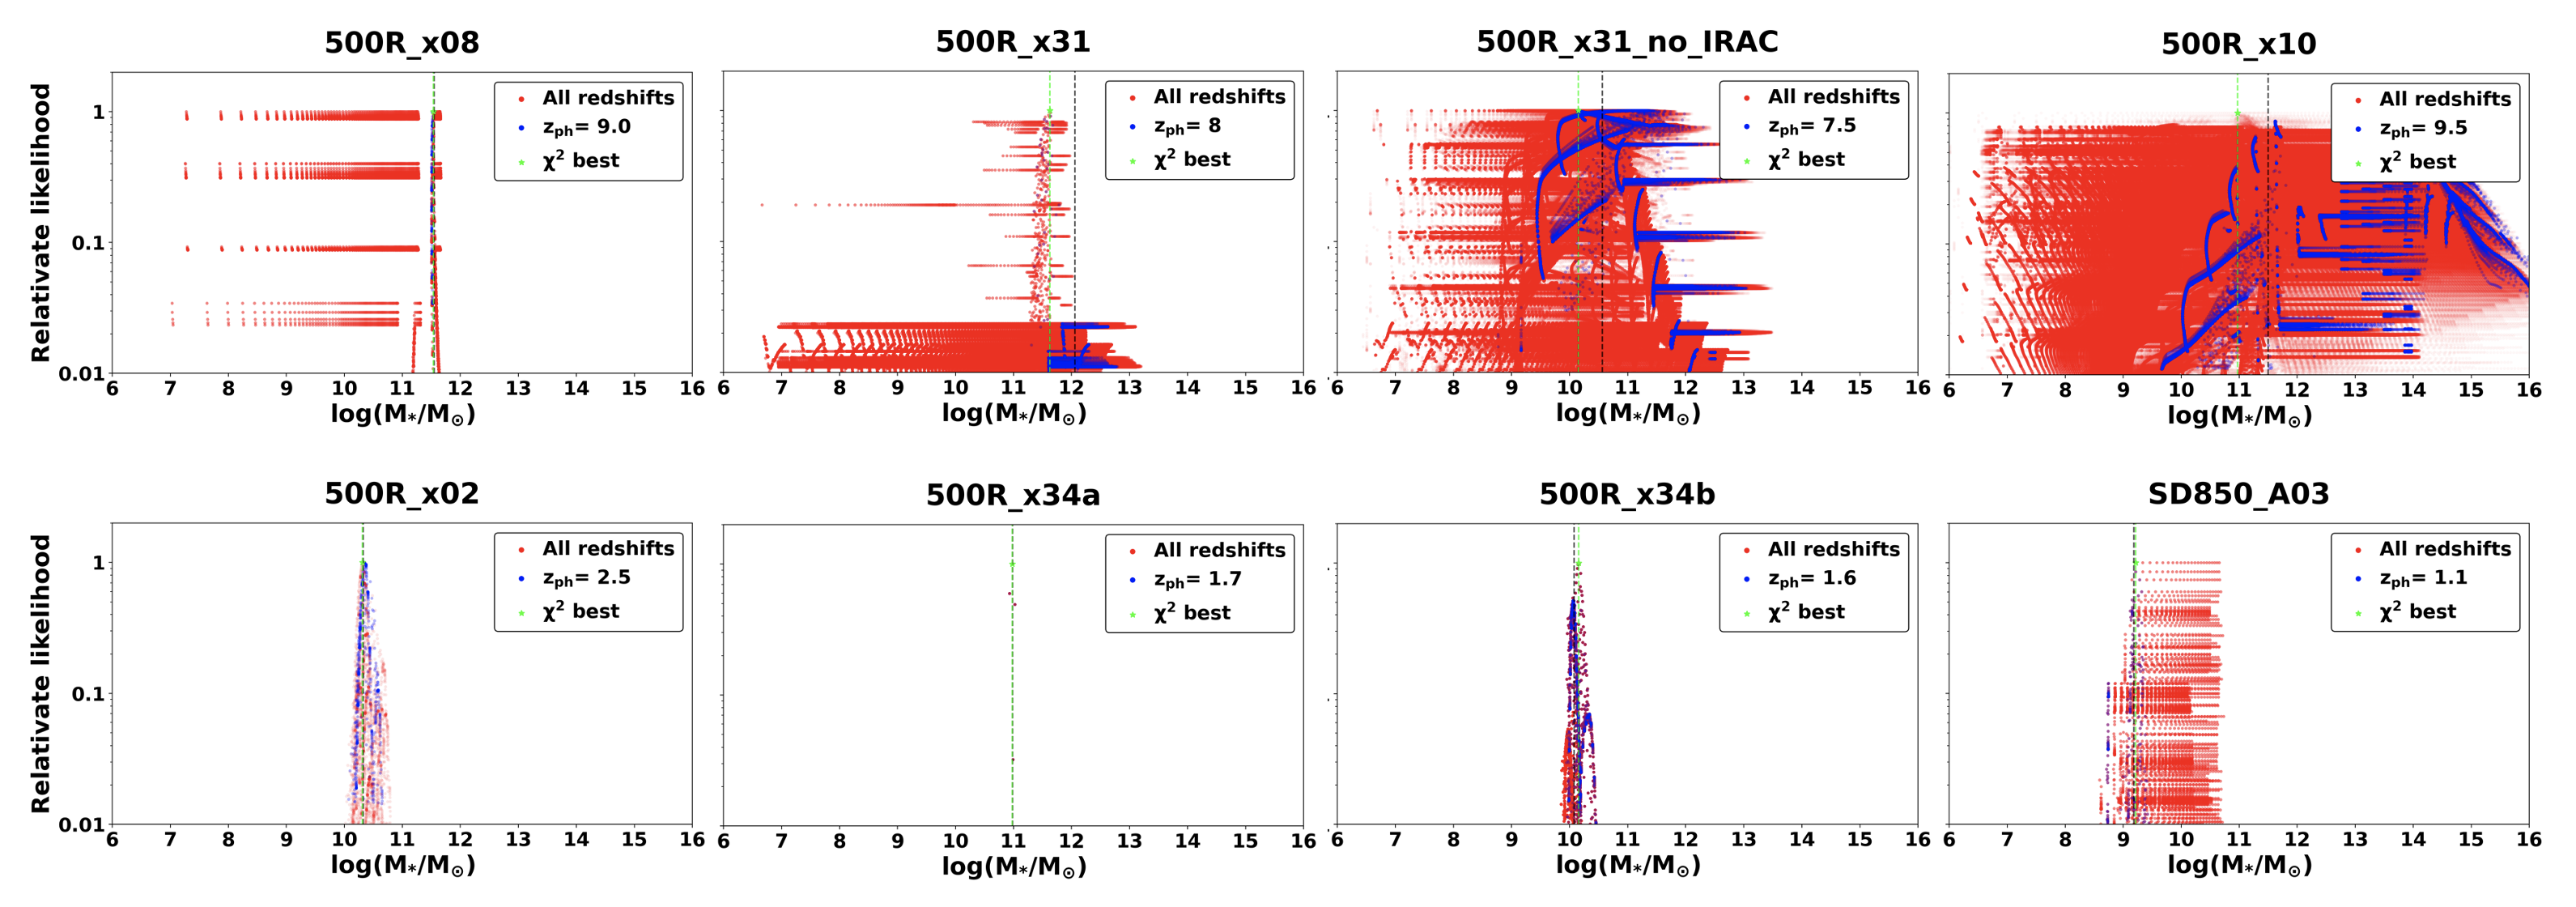
While the counterpart SED fitting gives for the high- candidates, there could be a potential problem with the inferred stellar populations. The high- solutions of 500R_COSMOS_T1_x08, x31 and x10 report stellar masses of , () and at , 8.0 (7.5) and 9.5, respectively. These are extremely high values, previously unseen in such early epochs (and in fact very rare in any epochs). At these redshifts, the age of the universe was only 555, 651 (709) and 516 Myr, respectively. If the epoch of first stars was at (Bowman et al., 2018), i.e., 225 Myr after the Big Bang, there would only be 330, 426 (484) and 291 Myr at most, respectively, for them to assemble such huge stellar masses, and therefore their average SFRs over these periods would have to be 958, 2,955 (82) and 1,722 yr-1, respectively. To make the situation worse, the best-fit models all have very small values of 10–90 Myr, which means that almost all their stars are formed instantaneously at the observed redshifts, a scenario that is to the opposite of the hierarchical formation picture of high-mass objects.
However, we should point out that these inferred parameters need to be treated with caution. As explained in §4.1, the reported (and other parameters such as as well) value is the median value of all the fits weighted by the relative likelihood (). This would work if the relative likelihood function behaves reasonably well. Unfortunately, it is not the case for these high- objects. Figure 15 shows the relative likelihood distributions of for both the high- objects and the contaminators. It is obvious that the distributions for the contaminators are approximately log-normal while those for the high- objects are completely chaotic. The major cause of the difference is that the contaminators all have at least eight bands of detections while the high- objects only have three to five bands. This has made the fits of the high- objects not well constrained. In these cases, the “median” values lose the physical meaning.
Nevertheless, it is also worth pointing out that the best-fit models still give rather high stellar masses for the high- objects. This is not unexpected from their optical-to-near-IR photometry, because the bright observed magnitudes in the near-IR indeed would imply such high stellar masses under any reasonable assumption of the mass-to-light ratio. In other words, if we accept the high for these objects, we will have to accept that the aforementioned tension still exists (albeit to a lesser degree) between the huge stellar mass and the limited time to assemble stars.
One might argue that these sources could have significant AGN contribution and therefore fitting the SEDs to stellar population synthesis models is not appropriate. However, there is no indication that these sources host AGN. The COSMOS field has deep X-ray observations from the Chandra Cosmos Legacy Survey (Civano et al., 2016), and none of our sources are detected in these data.
There is an alternative that would make the situation less problematic. If these objects are gravitationally lensed by a large factor (e.g., ), the intrinsic stellar masses would then be smaller by the same factor and therefore the tension will be reduced (although still not eliminated). All the three high- objects have very close foreground companions (see Figure 2, 5 and 7), making gravitational lensing an attractive explanation. However, we will not be able to have a definite answer until spectroscopic redshifts are obtained for the counterparts and the companions.
5 Discussion
Despite the difficulty with as mentioned above, the derived for the high- objects should have better reliability because these largely depend on the locations of the Lyman-break signature, which is determined by the intervening H I absorption but not the intrinsic properties of the galaxies. Trusting their high- solutions in §4.1, we can estimate the surface density of ULIRGs at . In YMHF20, there are a total of 17 Tier 1 500 m risers in the COSMOS field that fall within the coverage (2 deg2) of the VLA 3 GHz data. Based on the revised matching criterion as described in §3.1, nine of them have HiIdx(500) . We are able to study five of these nine in this work, thanks to the A3COSMOS positions. Among these five, only one (500R_COSMOS_T1_x26; “CRLE” at ) is definitely at , three (500R_COSMOS_T1_x08, x10 and x31) have optical-to-NIR counterparts consistent with being at , and one (500R_COSMOS_T1_x24) is inconclusive due to the lack of optical-to-NIR counterpart. Therefore, the success rate of HiIdx(500) selection among 500 m risers is 60–80% (three or four out of five, depending on whether 500R_COSMOS_T1_x24 is counted as a legitimate high- candidate). The overall success rate of YMHF20’s 500 m risers in selecting objects is 32–42% (nine out of seventeen and multiplied by 60% or 80%). The surface density of dusty starbursts selected as 500 m risers is therefore 2.7–3.6 deg-2. On the other hand, the SPIRE dropouts so far do not seem to be able to select any objects at , as no such object satisfies HiIdx(850) (SD850_COSMOS_T1_A03 has the revised HiIdx(850) ).
As already discussed, accepting the three objects shown in Figure 12 being at also means that we probably need to accept the high stellar masses of their host galaxies, which are at if they are not gravitationally lensed. The possible formation scenarios have two extremes: they kept forming stars at an average rate of hundreds or even a few thousand yr-1, or they formed all their stars instantaneously through enormous bursts. While such very high-mass, high-SFR objects at high-redshifts are at odd with the currently accepted picture of the early star formation, there are now theoretical arguments that their existence is needed to explain the supermassive black holes in the early universe (Kroupa et al., 2020). Regardless of their detailed formation histories, the progenitors of such objects must once be very luminous in the rest-frame UV, i.e., before they were heavily enriched by metal and formed large amount of dust. For example, using the conversion between and SFR as formulated in Madau et al. (1998), SFR yr-1 would translate to mag. Such a progenitor, if observed at , would show up as a bright -band dropout with mag. 333We note that the same argument was presented in Yan et al. (2006) for the progenitors of high stellar mass galaxies observed at , although the implication there was less extreme because those galaxies have stellar masses on the order of several .. If we accept the surface density derived above, we should expect a similar surface density of their progenitors that manifest themselves as bright -band objects.
6 Summary
In this work, we study a subsample of the high- ULIRG candidates selected by YMHF20 as 500 m risers and SPIRE dropouts. Our objects are in the COSMOS field, where the archival ALMA data from the A3COSMOS program offer the opportunity to pinpoint their exactly locations. We aim at the candidates at , which are those so weak in radio that they meet the HiIdx criteria for . In total, our sample includes seven 500 m risers and one SPIRE dropout. Based on the ALMA positions, we have found that the matching criteria adopted by YMHF20 between the FIR/sub-mm and the radio positions are too stringent and need to be relaxed slightly. Based on the subsequent revision of their HiIdx values, the eight objects form the true high- subsample at consisting of five objects and the contaminator subsample consisting of three objects (including the SPIRE dropout). We searched for their counterparts in the deep optical-to-NIR images available in the field, and carried out SED analysis of the host galaxies using population synthesis model. The objects in the contaminator sample all have optical-to-NIR SEDs consistent with being interloppers at –3. In the high- subsample, one object turns out to be a known galaxy at , one has no visible counterpart in any of the optical-to-NIR images, and the other three have solutions with . If we trust this assessment, the overall success rate of YMHF20’s 500 m riser in selecting dusty starbursts at is 32–42%, and the success rate increases to 60–80% after the purification by applying the HiIdx criterion. The surface density of 500 m risers is 2.7–3.6 deg-2. The very existence of dusty starburst at implies that the universe must have been actively forming stars very early in time so that dust could be present at the redshifts where these ULIRGs are observed. The inferred stellar masses of their host galaxies also suggest that their progenitors could have been in starburst state since formation. Spectroscopic confirmation of such objects, both in the millimeter regime and in the near-IR regime, will be critical in understanding the star formation processes in the very early universe.
Acknowledgements
HY and CL acknowledge the support of the University of Missouri Research Council Grant URC-21-005. We thank all the teams that collected extensive data in the COSMOS field and put the data to the public domain. The accurate positioning is made possible by the A3COSMOS program. We utilize the UltraVISTA data, which are based on observations made with ESO Telescopes at the La Silla or Paranal Observatories under program ID(s) 179.A-2005(A), 179.A-2005(B), 179.A-2005(C), 179.A-2005(D), 179.A-2005(E), 179.A-2005(F), 179.A-2005(G), 179.A-2005(H), 179.A-2005(I), 179.A-2005(J), 179.A-2005(K). We also make use of data collected at the Subaru Telescope and retrieved from the HSC data archive system, which is operated by the Subaru Telescope and Astronomy Data Center (ADC) at NAOJ.
Data Availability
The data underlying this article are available in the article.
References
- Aihara et al. (2018a) Aihara H., et al., 2018a, PASJ, 70, S4
- Aihara et al. (2018b) Aihara H., et al., 2018b, PASJ, 70, S8
- Arnouts et al. (1999) Arnouts S., Cristiani S., Moscardini L., Matarrese S., Lucchin F., Fontana A., Giallongo E., 1999, MNRAS, 310, 540
- Asboth et al. (2016) Asboth V., et al., 2016, MNRAS, 462, 1989
- Bertin & Arnouts (1996) Bertin E., Arnouts S., 1996, A&AS, 117, 393
- Bowman et al. (2018) Bowman J. D., Rogers A. E. E., Monsalve R. A., Mozdzen T. J., Mahesh N., 2018, Nature, 555, 67
- Bruzual & Charlot (2003) Bruzual G., Charlot S., 2003, MNRAS, 344, 1000
- Calzetti et al. (1994) Calzetti D., Kinney A. L., Storchi-Bergmann T., 1994, ApJ, 429, 582
- Chabrier (2003) Chabrier G., 2003, PASP, 115, 763
- Civano et al. (2016) Civano F., et al., 2016, ApJ, 819, 62
- Donevski et al. (2018) Donevski D., et al., 2018, A&A, 614, A33
- Dowell et al. (2014) Dowell C. D., et al., 2014, ApJ, 780, 75
- Griffin et al. (2010) Griffin M. J., et al., 2010, A&A, 518, L3
- Ilbert et al. (2006) Ilbert O., et al., 2006, A&A, 457, 841
- Ivison et al. (2016) Ivison R. J., et al., 2016, ApJ, 832, 78
- Kennicutt (1998) Kennicutt Jr. R. C., 1998, ARA&A, 36, 189
- Koekemoer et al. (2007) Koekemoer A. M., et al., 2007, ApJS, 172, 196
- Kroupa et al. (2020) Kroupa P., Subr L., Jerabkova T., Wang L., 2020, MNRAS, 498, 5652
- Liu et al. (2019) Liu D., et al., 2019, ApJS, 244, 40
- Ma & Yan (2015) Ma Z., Yan H., 2015, ApJ, 811, 58
- Madau (1995) Madau P., 1995, ApJ, 441, 18
- Madau et al. (1998) Madau P., Pozzetti L., Dickinson M., 1998, ApJ, 498, 106
- McCracken et al. (2012) McCracken H. J., et al., 2012, A&A, 544, A156
- Mowla et al. (2019) Mowla L. A., et al., 2019, ApJ, 880, 57
- Pavesi et al. (2018) Pavesi R., et al., 2018, ApJ, 861, 43
- Peng et al. (2002) Peng C. Y., Ho L. C., Impey C. D., Rix H.-W., 2002, AJ, 124, 266
- Peng et al. (2010) Peng C. Y., Ho L. C., Impey C. D., Rix H.-W., 2010, AJ, 139, 2097
- Pilbratt et al. (2010) Pilbratt G. L., et al., 2010, A&A, 518, L1
- Pope & Chary (2010) Pope A., Chary R.-R., 2010, ApJ, 715, L171
- Riechers et al. (2013) Riechers D. A., et al., 2013, Nature, 496, 329
- Riechers et al. (2017) Riechers D. A., et al., 2017, ApJ, 850, 1
- Roseboom et al. (2012) Roseboom I. G., et al., 2012, MNRAS, 419, 2758
- Sanders et al. (2007) Sanders D. B., et al., 2007, ApJS, 172, 86
- Siebenmorgen & Krügel (2007) Siebenmorgen R., Krügel E., 2007, A&A, 461, 445
- Strandet et al. (2017) Strandet M. L., et al., 2017, ApJ, 842, L15
- Yan et al. (2006) Yan H., Dickinson M., Giavalisco M., Stern D., Eisenhardt P. R. M., Ferguson H. C., 2006, ApJ, 651, 24
- Yan et al. (2020) Yan H., Ma Z., Huang J.-S., Fan L., 2020, ApJS, 249, 1