11email: lfm@iaa.es 22institutetext: Institut de Ciències de l’Espai (ICE, CSIC), Can Magrans s/n, E-08193 Cerdanyola del Vallès, Barcelona, Spain 33institutetext: Institut d’Estudis Espacials de Catalunya (IEEC), Barcelona, Spain 44institutetext: Departamento de Astrofísica, Centro de Astrobiología (INTA-CSIC), ESAC Campus, Camino Bajo del Castillo s/n, 28692, Villanueva de la Cañada, Madrid, Spain
44email: jlillo@cab.inta-csic.es
An episodically variable stellar wind in the planetary nebula IC 4997††thanks: Based on observations collected at the Centro Astronómico Hispano-Alemán (CAHA) at Calar Alto, operated jointly by Junta de Andalucía and Consejo Superior de Investigaciones Científicas (IAA-CSIC).
IC 4997 is a planetary nebula well known by its variability. We present high-resolution spectra of IC 4997 obtained in 1993, 2019, and 2020 that reveal changes in the H and [N ii] emission line profiles, which had never been reported for this object. The H P Cygni emission profile observed in 1993 changed to a single-peaked profile in 2019–2020, implying that the stellar wind has largely weakened. The very broad H emission wings narrowed by a factor of 2 between 1993 and 2019–2020, indicating that the efficiency of the Rayleigh–Raman scattering has noticeably decreased. A high-velocity [N ii] nebular component detected in 1993 is missing in 2019 and 2020, probably due to a decrease in its electron density. A correlation exists between the strength of the stellar wind and the episodic (50–60 yr) variation in the [O iii]4363/H line intensity ratio, suggesting that an episodic, smoothly variable stellar wind is the main cause of the variability of IC 4997. Monitoring of that intensity ratio and of the H emission line profile in the coming years and new multiwavelength observations are key to unveiling the ongoing processes in IC 4997 and constraining the origin of the wind variability.
Key Words.:
planetary nebulae: individual: IC 4997 – circumstellar matter – stars: winds and outflows – ISM: jets and outflows1 Introduction
After leaving the asymptotic giant branch (AGB), a star evolves toward higher effective temperatures (eff). When eff reaches 25000 K, the radiation of the central star (CS) photoionizes the envelope expelled during the AGB, forming a planetary nebula (PN). The natural variation in eff and the expansion of the ionized envelope result in changes of the nebular parameters and emission line intensities. Thus, all PNe are expected to be variable at a rate dictated by the evolutionary timescales of the CS and of the nebular expansion. This secular variability has been observed in several PNe (Hajduk et al. 2015). On the other hand, some PNe present a variability that differs from the secular one. These PNe are particularly interesting because they reveal the existence of processes in the PN phase that deviate from the normal evolution of CSs (e.g., Feibelman et al. 1992; Hyung et al. 1994; Reindl et al. 2017).
Among variable PNe, IC 4997 has been considered a paradigmatic case since Liller & Aller (1957) and Aller & Liller (1966) discovered variability in its [O iii]4363/H line intensity ratio. Since then, multiple observations have shown that this ratio could vary with a period of 50–60 yr and that the V magnitude of the nebula, additional nebular emission lines and emission line ratios, the electron temperature (e) and electron density (e), and the radio continuum flux density of the nebula and of particular nebular regions are also variable (Miranda & Torrelles 1998, hereafter MT98; Kostyakova & Arkhipova 2009; Burlak & Esipov 2010; Hajduk et al. 2018; Arkhipova et al. 2020, hereafter A+20). The origin of the variability has not been unraveled: an outburst, wind variability, nebular expansion, changes in eff, e, and/or e have all been suggested, among other possibilities (MT98; A+20 and references therein).
IC 4997 also has other interesting characteristics. It is a very young PN, with a kinematical age of 670 yr (if located at 2.5 kpc), that consists of an outer bipolar and an inner, very compact elliptical shell, as first revealed by radio continuum observations at 3.6 and 2 cm wavelengths (Miranda et al. 1996, hereafter MTE96; MT98). Evidence for a dense equatorial ring-like structure has been found at the 2 cm radio continuum and in the 3.6–2 cm spectral index map (MT98). The H emission line presents very broad wings (5400 km s-1; MTE96) that are explained by Rayleigh-Raman scattering in the H I neutral envelope around the object (Altschuler et al. 1986; Lee & Hyung 2000, hereafter LH00). The dust content of the nebula is very high (Pottasch et al. 1984), and several molecules have been detected in it (Rao et al. 2020 and references therein). The CS is classified as a wels or [WC10] type, and its eff is 55000 (see Weidmann et al. 2020 and references therein).
In 2019 we obtained high-resolution échelle spectra of IC 4997, which, when compared with the high-resolution coudé spectra obtained in 1993, revealed strong changes in the H and [N ii] emission line profiles that had never before been reported for IC 4997. To follow these changes, we also obtained high-resolution échelle spectra in 2020. In this paper we present the spectra in the three epochs and analyze and discuss the observed changes.
2 Observations
High-resolution spectra of IC 4997 were obtained on 1993 July 16, 2019 July 31, and 2020 September 21 with the 2.2 m telescope at Calar Alto Observatory (Almería, Spain). In 1993 we used the f/12 camera of the coudé spectrograph and a GEC 22.5 m CCD as detector to observe the 6540–6586 Å spectral range. The long slit, 1 in width, was centered on the object and oriented at position angles (PAs) 9∘, 54∘, 86∘, 279∘, and 324∘. Exposure time was 900 s for each spectrum. Seeing was 1. In 2019 and 2020 we used the échelle spectrograph CAFE (Aceituno et al. 2013; Lillo-Box et al. 2020) equipped with an IKON-L DZ936 detector. The 24 circular aperture of CAFE was centered on the object. Spectra were obtained with exposure times of 60, 120, 300, and 900 s in 2019, and 60 and 1200 s in 2020. The H emission line is saturated in the 2019 900 s spectrum but, due to cloudy conditions, not in the 2020 1200 s spectrum. Seeing was 14 in 2019 and 2020. The spectral range covered by CAFE is 4070–9245 Å, although in this paper we concentrate on the region around the H and [N ii]6548,6583 emission lines for comparison with the 1993 coudé spectra, and on the H emission line in 2019 and 2020 for comparison with the H spectrum in these two epochs. A Th-Ar lamp was used for wavelength calibration in the three epochs, and the spectra were not flux calibrated.
The f/12 coudé spectra were reduced using standard procedures for long-slit spectroscopy in the iraf package. The achieved spectral resolution is 12 km s-1, as indicated by the full width at half maximum (FWHM) of the Th-Ar lines in the comparison lamp spectra, and the accuracy in radial velocity is 1 km s-1. From each long-slit coudé spectrum we extracted a region of 24 in size centered on the CS, and then we combined the five extracted regions into a single spectrum for comparison with the CAFE ones. The CAFE spectra we reduced with the publicly available instrument pipeline cafextractor (Lillo-Box et al. 2020). The spectral resolution (FWHM) at H is 5 km s-1, and the accuracy in radial velocity is 10 m s-1.
Throughout this paper we adopt rest wavelengths of 4861.33, 6562.82, 6548.05, and 6583.45 Å for the H, H, [N ii]6548, and [N ii]6583 emission lines, respectively, taken from the Atomic Spectra Database NIST111https://www.nist.gov/pml/atomic-spectra-database, and all radial velocities are quoted in the local standard of rest reference frame.
3 Results
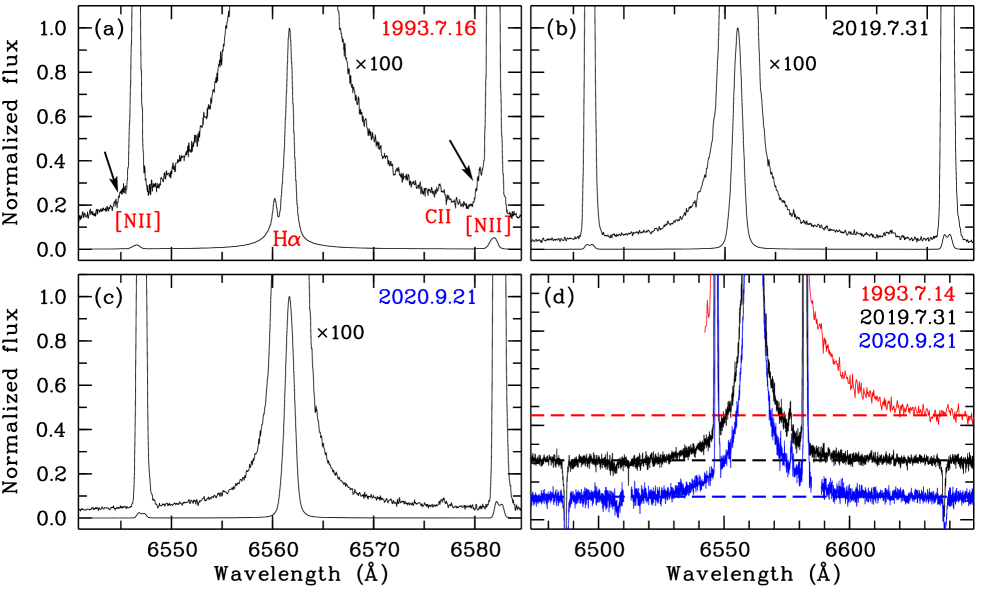
Figures 1a–1c present the spectra in the three epochs around the H and [N ii] emission lines, and Fig. 1d presents the same spectra but in a wider spectral range to show all the H wings. The 1993 spectrum in Fig. 1d has been adapted from MTE96 because the f/12 coudé spectra do not cover the total extent of the H wings (see MTE96 for details). Figure 2 shows the H emission line as observed in 2019, and we note that its profile is identical to that observed in 2020 (not shown here). Figure 3 shows details of the [N ii] emission lines in the three epochs around the high-velocity component (HVC) previously detected by MTE96. Figures 1 and 3 reveal noticeable changes in the H and [N ii] emission line profiles in the last 27 yr, which are described below.
The 1993 H emission line presents a P Cygni profile with emission peaks at 95.11.1 and 29.21.0 km s-1, the red one stronger than the blue one, separated by an absorption reversal at 79.51.3 km s-1 (Fig. 1a). The profile is similar to those observed in 1990, 1991, and 1992 (Feibelman et al. 1992; Hyung et al. 1994). In 2019 and 2020, however, a single-peaked profile is observed with the intensity peak at 53.11.1 km s-1 and a FWHM of 49.41.5 km s-1 (Figs. 1b and 1c), as averaged from the 2019 and 2020 spectra.
Figure 1 also shows that the very broad wings of the H line experienced a dramatic narrowing between 1993 and 2019–2020. This is not only recognizable at the continuum level (Fig. 1c) but also at higher intensity levels (Figs. 1a–1c). Moreover, the “local continuum” at the positions of the [N ii] lines (which is traced by the H wings) clearly presents a steeper slope in 1993 than in 2019–2020 (Fig. 3). These results show that the Rayleigh–Raman scattering was much less efficient in 2019-2020 than in 1993.
To quantify the narrowing of the wings, we measured the full velocity width of the H line at several intensity levels from the peak intensity and at several sigma levels from the continuum in each spectrum, hereby also obtaining the centroid velocity of the H line. Table 1 presents some values of the full velocity width in the three epochs. The errors were obtained from the noise in the profiles at each intensity level. For the full width at zero intensity (FWZI) and full width at the 5 level (FW5) in 1993 we used the spectrum presented by MTE96, assuming that the wings are symmetric with respect to the centroid velocity of the H line, for which we obtain a value of 533 km s-1 in the three epochs; this agrees with the velocity of the emission peak. The FWZI and FW5 decreased by a factor of 1.8 and 2.2 between 1993 and 2019, respectively, while the FW0.002 and FW0.0035 (see their definition in Table 1) decreased by a factor of 6 and 3.6, respectively. It should be noted that the reduction in the line wings may be apparent and due to a weakening of the Rayleigh-scattered component. In particular, taking into account that the Raman wing profile follows ()-2, a decrease by a factor of 2 in the line width corresponds to a reduction by a factor of 4 in the amplitude of the wings. The velocity widths present very similar values in 2019 and 2020 (Table 1), although the errors are relatively large and we cannot conclude whether the narrowing continues between 2019 and 2020. New high-resolution spectra are necessary to study the evolution of the H line.
| Full widtha𝑎aa𝑎aFWZI=full width at the continuum level; FW5=full width at 5 level from the continuum; FW0.002/0.0035/0.005=full width at the 0.002/0.0035/0.005 level from the peak intensity. | 1993.7.16 | 2019.7.31 | 2020.9.21 |
|---|---|---|---|
| FWZI | 7000300b𝑏bb𝑏bFrom the f/3 coudé spectrum assuming symmetry of the wings with respect to the radial velocity centroid of the H emission line (see text). | 3900350 | 3850200 |
| FW5 | 4270160b𝑏bb𝑏bFrom the f/3 coudé spectrum assuming symmetry of the wings with respect to the radial velocity centroid of the H emission line (see text). | 1900170 | 1890100 |
| FW0.002 | 2400100 | 40430 | 40020 |
| FW0.0035 | 102040 | 29017 | 28212 |
| FW0.005 | 34023 | 23512 | 23110 |
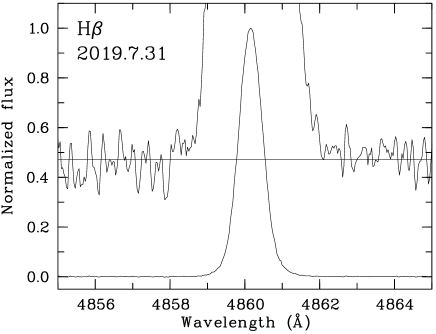
The H line (Fig. 2) shows a single-peaked profile with the intensity peak at 54.81.1 km s-1, a FWHM of 45.51.5 km s-1, and a FWZI of 24525 km s-1, as averaged from the 2019 and 2020 spectra. The radial velocity and FWHM are very similar to those obtained from the H line, but the FWZI is very much smaller. Although the H emission is weaker and, hence, noisier than the H one, there is no hint that it could show a large FWZI. This result is consistent with Rayleigh-Raman scattering that produces wings in the H line very much narrower than those in the H one (e.g., Chang et al. 2018).
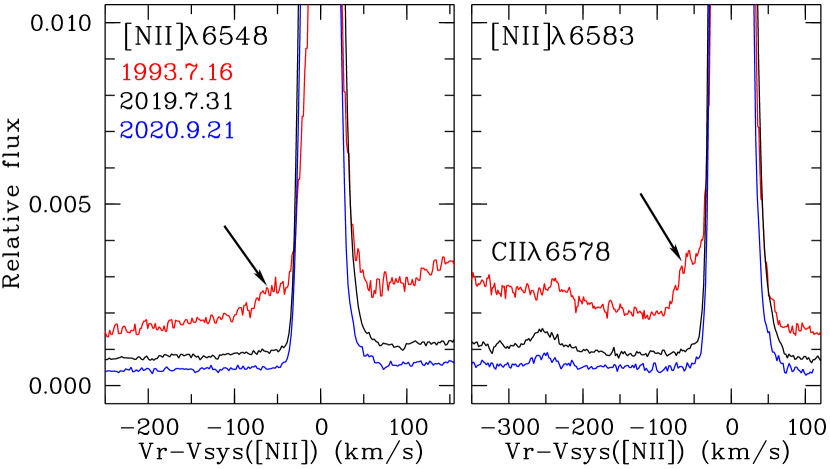
The [N ii] lines in the 1993 spectrum (Figs. 1 and 3) show the HVC that is observed at the stellar position in the five 2D f/12 spectra (not shown here). From a three-component Gaussian line fit to the [N ii] profiles in 1993 (see below), we obtain for the HVC a radial velocity for its intensity peak of 1051 km s-1, a FWHM of 416 km s-1, and an intensity ratio (6583)/(6548)2.97 that agrees with the theoretical value of 2.95. Surprisingly, the HVC is missing in 2019 and 2020. This cannot be due to the different spectral resolution of the coudé and CAFE spectra: the intensity of the HVC in the [N ii]6583 (6548) emission line is stronger than (similar to) the intensity of the C ii6578 emission line in 1993, which is detected in the three epochs. If the HVC were present in 2019–2020, it would have been detected. Most probably, the disappearance of the HVC is due to changes in its physical conditions. An increase in the excitation between 1993 and 2019 can be ruled out because high-excitation emission lines (e.g., [O iii] and [Ar iii]) in the 2019 and 2020 spectra do not show any HVC. A more plausible explanation is that the e in the HVC has decreased, thereby decreasing the number of collisional excitations until forbidden emission lines are undetectable.
The [N ii] lines present two velocity components in 2019 and 2020 (Fig. 1). The relative intensity of the blue peak to the red peak is higher in 2020 (1.2) than in 2019 (1), perhaps due to variability. These two components contrast with the slightly asymmetric, single-peaked profile observed in 1993 (apart from the HVC). Most probably this difference is not real but due to the different spectral resolution of the coudé and CAFE spectra. In fact, a two-component Gaussian line fit (three components to the 1993 spectrum; see above) to both [N ii] lines provides identical results for the centroid (systemic) velocity, 48.51.1 km s-1 (hereafter sys([N ii]), and velocity splitting, 23.5 km s-1, in the three epochs. These results agree with those obtained by MTE96. Interestingly, the intensity peak of the H and H lines in 2019 and 2020 is blueshifted by 5–6 km s-1 with respect to sys([N ii]), and the difference is larger than the errors. If it were due to the adopted rest wavelengths, a correction of 0.1 Å would be required for those of the [N ii] lines. On the other hand, the difference could be real and due to different velocities of the regions where the Balmer and [N ii] lines mainly arise.
4 Discussion
The H P Cygni profile is indicative of a strong and dense CS wind that produces self-absorption333MTE96 suggested that the H profile consisted of two components: a blue emission peak that was associated with the HVC components observed in [N ii] because of the similar radial velocities and a red emission peak that was attributed to the inner shell. This suggestion was based on a spectrum at lower spectral resolution than the one presented here, in which the absorption reversal was not clearly observed. However, if the H blue emission peak was related to the HVC, the H line should have displayed a single peak at 29 km s-1 in 2019 and 2020, which is not the case.. This wind was active at least from 1990 to 1993 (see Feibelman et al. 1992; Hyung et al. 1994) and also during 1996, as indicated by the changes observed in the 3.6 cm radio continuum emission (MT98). Moreover, the CS wind, or a part of it, was highly collimated, at least in 1996 (MT98). The change of a P Cygni profile to a single-peaked profile indicates that the wind has dramatically weakened and is unable to produce self-absorption. Nevertheless, a detailed interpretation of the H profile is difficult because at least three components may be contributing: the outer and inner shell and the stellar wind. Spatially resolved, high-resolution spectra could disentangle the different contributions to the H emission profile (see, e.g., Solf 2000).
The strength of the CS wind is related to the value of the [O iii]4363/H ratio (A+20, their Fig. 4): strong wind is observed around 1990–1996 when that ratio reached its highest values, while weak wind is observed in 2019–2020 when that ratio reached its minimum values. This result strongly favors the variability of IC 4997 being mainly due to a variable CS wind and the corresponding induced changes in e and e (see also A+20). Noticeably, the C iv 1550 Å emission line did not show a P Cygni profile in 1978–1981, when the [O iii]/H ratio was close to its minimum (Feibelman 1982, A+20), indicating that no strong CS wind was present in those years. Nor did the C iv line show a P Cygni profile in 1987, when the [O iii]/H ratio was close to maximum, though the N v1238 Å emission line may have shown a P Cyg profile in 1981, when no strong wind should have been expected (Marcolino et al. 2007). These results may indicate that the strength of the CS wind presents small fluctuations, as suggested by the small changes in the H emission profile (Hyung et al. 1994). These small wind fluctuations may contribute to the small fluctuations in the [O iii]4363/H ratio observed within a year, together with other phenomena, such as nebular expansion, some changes in eff, and/or interaction between the shells (Ferland 1979; MTE96, MT98; A+20 and references therein).
According to LH00, the broad H wings observed in 1991 require a column density of 21020 cm-2 in the H i envelope around IC 4997 and an incident Ly flux 1035 erg cm-2 s-1 that should be generated in a high electron density (109 cm-3), compact ionized region located very close (0.1 AU) to the CS. Changes in the H i column density and/or Ly flux would then be responsible for the narrowing of the H wings. The column density would be reduced with time due to the expansion of the H i envelope and to the photoionization of its innermost region by the advance of the ionization front. The H i envelope expands at 14 km s-1 with respect to sys([N ii]) (Altschuler et al. 1986), and in 26 yr the increase in radius would be 3.710-4 pc. If we assume a mean nebular radius of 12 (1.510-2 pc at a distance of 2.5 kpc) as the minimum size of the H i, and that the column density varies as 1/R2, the decrease in the column density in 26 yr would be 1.05. In addition, if the ionization front expands with the same velocity as the outer shell (12 km s-1 from the [N ii] lines; MTE96), the increase in the nebular radius would be 3.210-4 pc, which would imply a reduction in the column density by a factor of 1.04 in 26 yr. By combining the two processes, we can estimate that the column density would have decreased by a factor of 1.1 over the last 26 yr. Although this number is an approximation, values of this order cannot account for the observed decrease in the line wings, which requires a much larger factor (see LH00, their Fig. 1). Therefore, the electron density in the very compact and dense region around the CS should have decreased by, for example, the expansion of that region, reducing the Ly flux and hence the efficiency of the Rayleigh–Raman scattering.
An interesting question regards the origin of a variable CS wind in IC 4997. The variation in the [O iii]4363/H ratio suggests that, in addition to its maximum value around 1995, another maximum may have existed around 1938–1940 when that ratio reached values very similar to those in 1995 (Feibelman et al. 1979; A+20, their Fig. 4). The same can be said for the minimum values of the ratio, around 1965 and 2020, although more points in the coming years are necessary to confirm periodicity. As of now, the observed variability of that ratio may be better considered as episodic. Moreover, despite the presence of small fluctuations, the [O iii]4363/H ratio has shown a general continuous and relatively smooth variation between its extreme values. The same is observed in the [O iii]4363/H, [O iii]4959/H, and [O iii]4363/[O iii]4959 line intensity ratios, as well as in the intensity of the [O iii]4363,4959 and H emission lines. These variations are less compatible with a sudden outburst but indicate that the CS wind should vary in an episodic and smooth manner too. The variability in the emission lines and emission line ratios points to a binary CS with a period of 50–60 yr. The idea of a binary (or triple) CS in IC 4997 has been suggested before (MT98; Bear & Soker 2017; A+20 and references therein). The results presented in this paper may help to refine the binary scenario, if we assume a companion in an eccentric orbit with a period of 50–60 yr. Around 1940 and 1995 the stars were at their minimum separation; the CS wind may have been activated by the close presence of the companion, and, in addition, mass transfer from the companion could have formed (or fed) a kind of very dense, ionized accretion disk-like structure around the CS, which generated enough Ly photons to produce the large H wings. This dense region could, at least partially, collimate the CS wind, and we note that, in this scenario, the collimating agent would be related to the CS and not to the companion. Ejection of high-velocity knots from the dense disk-like structure may account for the HVC observed in 1993. MT98 and Gómez et al. (2002) suggested that the HVC could be associated with a faint nebular clump observed in the radio continuum maps at 7 mm and 2 cm, with a low electron density of 700 cm-3 (MTE96). If the size of this clump increases with time, its e will decrease until emission lines are no longer detected after a certain time. As the distance between the stars increases, the influence of the companion on the CS and the mass transfer would decrease until reaching a minimum around 1965 and 2020, at the maximum binary separation. As a consequence, the CS wind would be weak, and the very dense ring-like structure around the CS would no longer be fed and may expand, hence decreasing its electron density and the Ly flux and resulting in a low efficiency of the Rayleigh–Raman scattering.
If the scenario described above is correct, and the physical conditions approximately repeat themselves every 50–60 yr, an increase in the [O iii]4363/H ratio will be detectable in 5 yr, and the expected strengthening CS wind might manifest itself as asymmetries in the H line profile and broader wings. Monitoring of the [O iii]4363/H ratio (and more emission lines) and of the H line profile in the coming years is crucial to confirming this scenario. Furthermore, many multiwavelength observations of IC 4997 exist around 1995 when the CS wind was strong. Similar multiwavelength observations carried out now, when the CS wind is weak, will provide key information about the ongoing processes in IC 4997 and their possible relationship to a long period binary CS.
5 Conclusions
High-resolution spectra of the variable PN IC 4997 obtained in 1993, 2019, and 2020 have revealed that between 1993 and 2019–2020: (1) the H P Cygni emission line profile observed in 1993 changed to a single-peaked emission line profile, indicating that the stellar wind has dramatically weakened in the last 26 yr; (2) the broad wings of the H emission lines narrowed by a factor of 2, showing that the Rayleigh–Raman scattering process was much less efficient in 2019–2020 than in 1993, most probably due to a decrease in the Ly flux necessary to produce large line wings; and (3) a high-velocity nebular component detected in 1993 in the [N ii] emission lines is missing in 2019–2020, which may be attributed to a large decrease in its electron density. We found a relationship between the strength of the CS wind and the extreme values of the episodically variable [O iii]4363/H ratio, other line intensity ratios, and emission line intensities, which strongly suggests that an episodic, smoothly variable wind is the main cause of the variability of IC 4997. A companion in an eccentric orbit would account for many of the observed characteristics of IC 4997, at least qualitatively. Monitoring of the [O iii]4363/H ratio and the H emission profile in the coming years is crucial to confirming this scenario. Moreover, important information about the ongoing processes in IC 4997 will be reached by comparing multiwavelength observations carried out now, when the CS wind is weak, with similar observations obtained 25–30 yr ago, when the CS wind was strong.
Acknowledgements.
We are very grateful to our referee, William Henney, for his prompt answer and useful comments that have improved the paper. We thank Calar Alto Observatory for allocation of director’s discretionary time to this programme. LFM is partially supported by MCIU grant AYA2017-84390-C2-1-R (co-funded by FEDER) and PID2020-114461GB-I00 of AEI (10.13039/501100011033), and acknowledges financial support from the State Agency for Research of the Spanish MCIU through the ”Center of Excellence Severo Ochoa” award for the Instituto de Astrofísica de Andalucía (SEV-2017-0709). JMT acknowledges partial support from the PID2020-117710GB-I00 grant funded by MCIN/ AEI /10.13039/501100011033. J.L-B. acknowledges financial support received from ”la Caixa” Foundation (ID 100010434) and from the European Unions Horizon 2020 research and innovation programme under the Marie Slodowska-Curie grant agreement No 847648, with fellowship code LCF/BQ/PI20/11760023. This research has also been partly funded by the Spanish State Research Agency (AEI) Projects No.ESP2017-87676-C5-1-R and No. MDM-2017-0737 Unidad de Excelencia ”María de Maeztu”- Centro de Astrobiología (INTA-CSIC).References
- Aceituno (2013) Aceituno, J., Sánchez, S. F., Grupp, F., et al., 2013, A&A, 552, A31
- Aller (1966) Aller, L. H., & Liller, W., 1966, MNRAS, 132, 337
- Altschuler (1986) Altschuler, D. R., Schneider, S. E., Giovanardi, C., & Silvergate, P. R., 1986, ApJ, 305, L85
- Arkhipova (2020) Arkhipova, V.P., Burlak, M.A., Ikonnikova, N.P., et al., 2020, Astron. Letters, 46, 100 (A+20)
- Bear (2017) Bear, E., Soker, N., 2017, ApJ, 837, L10
- Burlak (2010) Burlak, M. A., & Esipov, V. F., 2010, Astron. Letters, 36, 752
- Chang (2018) Chang, S.-J-, Lee, H.-W., Lee, H.-G., et al., 2018, ApJ, 866:129
- Feibelman (1992) Feibelman, W. A., 1982, ApJ, 258, 562
- Feibelman (1992) Feibelman, W. A., Aller, L. H., & Hyung, S., 1992, PASP, 104, 339
- Feibelman (1979) Feibelman, W. A., Hobbs, R. W., McCracken, C. W., & Brown, L. W., 1979, ApJ, 231, 111
- Gómez (2002) Gómez, Y., Miranda, L. F., Torrelles, J. M., Rodríguez, L. F., & López, J. A., 2002, MNRAS, 336, 1139
- Hajduk (2015) Hajduk, M., van Hoof, P. A. M., Śniadkowska K., et al., 2018, MNRAS, 479, 5657
- Hajduk (2015) Hajduk, M., van Hoof, P. A. M., & Zijlstra, A. A., 2015, A&A, 573, A65
- Henney (2021) Henney, W. J., 2021, MNRAS, 502, 4597
- Hyung (1994) Hyung, S., Aller, L. H., & Feibelman, W. A., 1994, ApJSS, 93, 465
- Kostyakova (2009) Kostyakova, E. B., & Arkhipova, V. P., 2009, Astron. Reports, 53, 1155
- Liller (1957) Liller, W., & Aller, L. H., 1957, Sky & Telescope, 16, 212
- Lillo-Box (2020) Lillo-Box, J., Aceituno, J., Pedraz, S., et al., 2020, MNRAS, 491, 4496
- Lee (2000) Lee H.-W., & Hyung S., 2000, ApJ, 530, L49 (LH00)
- Marcolino (2007) Marcolino, W. L. F., de Araújo, F. X., Junior, H. B. M., & Duarte, E. S., 2007, AJ, 134, 1380
- Miranda (1998) Miranda, L. F., & Torrelles, J. M., 1998, ApJ, 496, 474 (MT98)
- Miranda (1996) Miranda, L. F., Torrelles, J. M., & Eiroa, C., 1996, ApJ, 461, L111 (MTE96)
- Pottasch (1984) Pottasch, S. R., Baud, B., Beintema, D., et al., 1984, A&A, 138, 10
- Rao (2020) Rao, N. K., Lambert, D. L., Reddy, A. B. S., et al., 2020, PASP, 132, 074201
- Reindl (2017) Reindl, N., Rauch, T., Miller Bertolami, M. M., Todt, H., & Werner, K., 2017, MNRAS, 464, L51
- Solf (2000) Solf, J., 2000, A&A, 354, 674
- Weidmann (2020) Weidmann, W. A., Mari, M. B., Schmidt, E. O., et al., 2020, A&A, 640, A10