Multi-modal Attention Network for Stock Movements Prediction
Abstract
Stock prices move as piece-wise trending fluctuation rather than a purely random walk. Traditionally, the prediction of future stock movements is based on the historical trading record. Nowadays, with the development of social media, many active participants in the market choose to publicize their strategies, which provides a window to glimpse over the whole market’s attitude towards future movements by extracting the semantics behind social media. However, social media contains conflicting information and cannot replace historical records completely. In this work, we propose a multi-modality attention network to reduce conflicts and integrate semantic and numeric features to predict future stock movements comprehensively. Specifically, we first extract semantic information from social media and estimate their credibility based on posters’ identity and public reputation. Then we incorporate the semantic from online posts and numeric features from historical records to make the trading strategy. Experimental results show that our approach outperforms previous methods by a significant margin in both prediction accuracy (61.20%) and trading profits (9.13%). It demonstrates that our method improves the performance of stock movements prediction and informs future research on multi-modality fusion towards stock prediction.
Introduction
Stock price movements are related to information (Fama et al. 1969). Traditionally, information affects the movements as news by exposing certain expectations on future trends for the participants in the stock market. Early studies utilized time series of historical trending features to predict price trends (Marcek 2000). However, stochastic stock prices always hinder predictions. Nowadays, the propensity of social media extremely speeds up the spreading of news and provides an opportunity of estimating the perspective of public attitude towards a certain type of financial asset. For example, the recent dramatic movements of GameStop and Dogecoin suggest that social media may act as a complementary source to the historical trending in the stock price prediction.
Traditional works mainly take the information like news and exploit the feature engineering to infer its impact on the future price (Schumaker and Chen 2009). With the prevalence of deep neural networks, stock prediction is studied as an application of NLP downstream tasks, like topic extraction (Si et al. 2013a) and sentiment analysis (Nguyen and Shirai 2015). In recent work, researchers applied new learning policies and model structures. (Xu and Cohen 2018) uses neural variational inference to treat stochasticity in the market better. (Feng et al. 2019) enhance the accuracy of prediction through adversarial training policy. (Liu et al. 2019, 2020) resort to attention mechanism and capsule network to mine deeper level of a semantic sequence from social texts.
On the one hand, the social media contexts bring new sources besides the historical data into the prediction model. On the other hand, there also arise some specific challenges, due to the heterogeneity of the social media context. For example, social media texts often contain conflicting and unreliable information (Shu et al. 2017) while analyzing a stock trend requires professional knowledge. Another issue is that conflicting attitudes negatively affect not only consumers’ purchasing decisions (Vali, Xu, and Yildirim 2015) but also models’ judgments. Thus, we should resort to multiple resources of data on the text source to evaluate the reliability of provided information (Lin and Chen 2018). The reliability of a social post depends on its poster’s reputation on the social media platform and the reader’s feedback. Thus we extract social impact features of the two aspects and utilize them to decode posts based on the attention mechanism, which guarantees both semantics and reliability.
Considering the well-established classical financial theories assuming that the instructional information is represented in the price (Somani, Talele, and Sawant 2014), we also resort to the historical trending features reflected in the daily price record. We hypothesize that the historical trending data and social media copra potentially contain complementary information that can only be captured by its modality thus the multi-modal prediction model can improve the predictive model performance. In this article, we propose a novel predictive model of future stock movements by integrating the textual information collected on a financial forum and the historical trending data through the Inter-Intra attention mechanism (Peng et al. 2019), which mimics the combined action of texts and prices. In this way, we use the comprehensive information to infer the whole market perspectives on the related financial asset. We evaluate our model on a stock movements prediction task on our home-collected data and show that our model achieves the SOTA performance. We contribute to build a comprehensive dataset involving time series and texts and propose a novel framework to utilize reliability estimation and the multi-modality mechanism to predict stock movements.
Related Work
Stock trend prediction has already been researched for decades (De Bondt and Thaler 1985), due to its great value in seeking to maximize stock investment profit. Original approaches are mainly based on time series analysis of historical stock prices. However, because of the excess volatility of stock prices (Timmermann 1996), prediction accuracy is limited. With the development of the Internet and machine learning, financial websites provide large amounts of available textual resources, NLP methods have become the mainstream in this track. (Wu et al. 2018) and (Xu and Cohen 2018) built corpora from Twitter. (Si et al. 2013b). (Nguyen and Shirai 2015) built topic-based models to predict stock price movements using sentiments on social media by capturing topics and sentiments. (Liu et al. 2019) utilize both transformer and capsule network to deeply mine the textual semantics and infer the movements based on semantics. But these works are hindered by conflicting semantics in the social media and incomplete features of a single modality.
In recent work, some researchers adopted new features and learning policies to overcome the stochastic in the market. (Xu and Cohen 2018) utilizes both historical trending and social messages to reduce stochastic factors. (Feng et al. 2019) proposes an adversarial training policy to add perturbations to simulate the stochasticity of price variable. (Liu et al. 2020) designed a hierarchical network to fuse both financial news and twitters to enrich the information and achieve higher accuracy. Although making a profound process, these methods lack explicit measures to reduce the chaos in social media and fully utilize multi-modality information.
We resort to social impact features and historical trending features to overcome the simplicity of a single modality. Utilizing the attention mechanism, we estimate the credibility of social media posts and incorporate their semantics with objective historical trending features. It improves the results of the stock movements prediction task significantly.
Problem Formulation
We aim at predicting the movements of stocks based on the market information at a reference time . The movements lie in a target time window from to . The market information we use consists of three parts: social media corpora extracted from financial websites, historical trending data based on daily price, and social impact features that includes the poster features and readers’ feedback. The market information lies in a fixed size period , and is the size. Therefore, we formulate the task as follows:
| (1) |
where is our model, is the prediction output. We denote the movements into binary labels where represents the rise, represents the fall, which is as followed:
| (2) |
where denotes the mean adjusted closing price from to , where is 5 days in our experiment and denotes the adjusted closing price in reference time . We observed that there are some targets with exceptionally minor movements ratios due to the uncertainty of the market. In previous stock movements prediction tasks, a common practice is to set upper and lower thresholds on the stock price change and remove samples between them. Similarly, we set two thresholds at and .
Data Collection & Preprocessing
Dataset Description. Our dataset 111https://github.com/HeathCiff/Multi-modal-Attention-Network-for-Stock-Movements-Prediction consists of three parts: the social media corpora, the social impact description, and the historical trending data. The social media corpora are extracted from Xueqiu 222https://xueqiu.com/, a popular financial communication platform. Considering the timeliness, we gather the texts released at to and limit the maximum number of texts to 96. Since high-trade-volume stocks tend to be discussed more in this forum, we select the top 150 stocks based on their popularity, ensuring relatively sufficient corpora. The historical trending data includes the daily open price, close price, high price, low price, and volume. Inspired by (Feng et al. 2019), we compute and utilize the dispersion between daily high price and low price, between daily open price and close price. In accord with the poster , the -th text in released at , is the price trend from to . Social impact features , including the description of posters themselves and readers’ feedback, play a role as the supplement of our corpora. The numbers of the poster’s fans, followers, and posted texts describe the basic information of posters, while his concerned stocks reflect his correlation with the talked stocks. The poster’s transaction performance, such as the profit of invested stocks, reflects his posts’ credibility. Readers reply to, like, and retweet the posts, and we record these actions as numeric features by times. We integrate all the social impact features into a vector. Details of the three kinds of features and relevant calculations are shown in Table 1.
| Features | Description | Calculation |
| Social Corpora | texts in financial website | |
| Historical Trending | historical daily price | chronological arrangement |
| Social Impact Features | fans, followers, posted texts, stocks | C oncatenation |
| like, retweets and replies | ||
| stocks of interested | ||
| the profit in stocks exchange |
Preprocessing. For the social media context, we observed that many new words are undetectable by the tokenizer. So we apply left-side and right-side information entropy and mutual information (Paninski 2003) to extract new words. In some languages, like Chinese, new words generally consist of successive known words. Therefore, we first combine adjacent words and compute the left-side and right-side entropy by summing up the entropy of the word on the left or right side of them:
| (3) |
| (4) |
where and denote left-side and right-side information entropy, and denotes the probability of occurrence in a sentence. is a potential new word, and is the word in the left (or right) of . Comparing with a threshold, we keep words that have higher information entropy values. Then we compute the mutual information of internal parts in kept words:
| (5) |
where and are the two parts of a word. We select top-k words based on mutual information values and add them to our dictionary.
The lengths of texts are usually uneven. Long texts exceed our maximum length restriction, while short ones may be meaningless. Therefore, we remove short texts and put the remains into key sentences extraction processing (Robertson and Zaragoza 2009a) to drop off meaningless sentences and make their lengths fit for our model. In extraction processing, we first filter out the stop words and then apply a BM25 algorithm (Robertson and Zaragoza 2009b) to estimate the similarity between the whole text and every single sentence within it and remain sentences with the high BM25 values.
Our Model
Model Overview
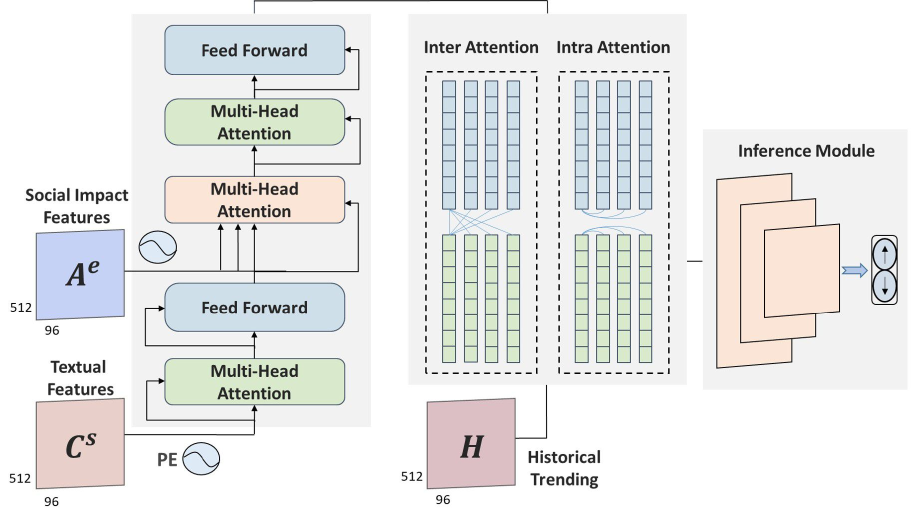
The architecture of our framework is illustrated in Figure 1, which consists of four sequential modules:
-
1.
Embedding Module embeds textual features, historical trending features, and social impact features into vectors.
-
2.
Encoder Module encodes textual features to acquire high-level semantics.
-
3.
Fusion Module complements social impact features to textual features and mix up the fused features with historical trending features into an intact feature map.
-
4.
Inference Module predicts the stock movements based on the intact feature map.
Embedding Module
Embedding Module embeds three modalities. As to each social media post , there is a relevant historical trending feature and a social impact feature . Therefore, we define the temporal input as follows:
| (6) |
To represent the semantics of a text, we feed into a deep averaging network (Iyyer et al. 2015) to acquire text-level vectors , where denotes the length of a sequence, denotes the fixed text length in words, denotes the latent dimension of every word vector. In our experiment, we find the sum-up operation may lead to an information loss. So we replace it with a flatten operation to maintain affluent information. As for the social impact features, we project it into high-dimension features , which maintains adequate information and is compatible with the fusion with textual features.
| (7) |
| (8) |
where denotes the deep averaging network, Linear denotes fully connected layers. Each historical trending feature is denoted as a three-dimensional feature map , where 64 is the length of the historical price range in days, and is equal to the number of daily price features like open price. We resort to 3D-CNNpred (Hoseinzade and Haratizadeh 2019) to fully extract the spatial information :
| (9) |
Encoder Module
Transformer encoder has been used widely in exploring textual semantics, and we adopt it in this module. Inspired by the multi-head attention mechanism (Vaswani et al. 2017), we utilize it to represent the mutual connection of each part of the time-based textual sequence and positional-wise feed it forwards to the next layer. In this way, we capture social attitudes at the textual level:
| (10) |
where denotes the encoder in the transformer, denotes the encoded textual features. , , identifies the queries, keys, values of , respectively.
In recent works, the time feature was important because of the timeliness of social posts. To fully utilize this feature, we design a time-based positional encoding method to maintain temporal information. Like positional encoding in the transformer (Qin et al. 2017), we replace the relative position with the relative dispersion between posts’ release time and the reference time:
| (11) |
| (12) |
where denotes the positional encoding, denotes the relative time dispersion, denotes the -th position in the vector. is a free parameter, and we set it as , which is the same with (Vaswani et al. 2017). is the vectors’ latent dimension.
Fusion Module
Text and Social Impact Features. Exploring the textual semantics is not enough, for the reliability varies. On the one hand, posters having many fans and followers tend to perform well in this forum. It is related to the high reliability of their attitudes on stock movements. On the other hand, in common sense, well-received texts are valid and truthful.
In the previous work, (Liu et al. 2019) utilized the transformer encoder, which distinguishes the task-related importance through measuring the similarity of each part. However, resting on texts themselves is limited, so we resort to social impact features to replenish and apply an attention mechanism-based decoder to redistribute the importance of the textual sequence:
| (13) |
where denotes the decoder in the transformer, denotes the decoded textual features, and denotes the values of . , identifies queries and keys of , respectively.
The decoder architecture is consistent with the decoder in the transformer (Vaswani et al. 2017). In encoder-decoder multi-head attention, we project Encoder Module output into values, project social impact features into keys and queries. We perform the attention function on each combination that consists of queries, keys, and values in parallel, yielding output values. In this way, we treat textual features with different social impact features separately so that the fused outputs maintain semantics and reliability.
Historical Trending and Fused Text. Generally, before investing, investors usually refer to historical trending and social media to get a comprehensive guide, which means they are not equal totally but complementary. Therefore, we hypothesize that historical trending data supplement the social media texts and vice versa. Instead of concatenating them simply, we describe this supplement effect as an information flow and update the two modalities through the inter-attention mechanism. Because of the Markov property in historical price (Somani, Talele, and Sawant 2014) and frequent interaction on the Internet, each feature is not independent of others within the same modality, so there also exists an internal information flow. Therefore, we adopt an intra-mechanism to represent the information flow within the updated modalities.
The inter attention block computes the bidirectional supplement between historical trending and textual information. Like Encoder Module, we first transform each historical trending feature and textual feature into queries, keys, and values. Then we compute the transfer values between the two modalities:
| (14) |
| (15) |
where we denote the transformational historical trending features as and transformational textual feature as . and denote the transfer values in inter-attention block. denotes the transpose operation. denotes the matrix multiplication, denotes the dimension of a feature vector. We update two modalities by projecting the concatenation of original values and transfer values into -dimensional values:
| (16) |
| (17) |
where and are the updated values of the two modalities in this block, respectively. We also project and into queries, keys, and values. To summarize the conditioning information from the other modality, we average-pool the two modalities along the sequence-index dimension and project them to match the dimension of the queries and keys. Then we feed them to a sigmoid non-linearity function to generate channel-wise conditioning gates for the other modality. We utilize the conditioning gates to update original queries and keys:
| (18) |
| (19) |
| (20) |
| (21) |
where denotes sigmoid function, denotes element-wise multiplication, denotes the output of sigmoid door gating, and denotes the updated queries and keys of historical trending modality, and denotes the updated queries and keys of textual modality.
The intra-attention block captures the comprehensive understanding of each updated modality, considering the internal influence. We utilize an attention mechanism to update the values based on updated keys and queries like the inter-attention block. Then we feed the summation of updated values ( and ) and original values ( and ) into a fully connected layer:
| (22) |
| (23) |
| (24) |
| (25) |
where and are the output of the intra-attention block, for we maintain the multi-head form. Then we average pool the element-wise product of and along the sequence-index dimension into the comprehensive feature map :
| (26) |
Inference Module
With all three modalities fused, we obtain a sequence of comprehensive feature map in chronological order, where denotes the number of heads and denotes the length of each head. We design 1D convolution layers to make the final inference, down-sampling the feature map by several kernels and pooling it to generate the prediction arise from the comprehensive information:
| (27) |
where denotes the output and denotes the convolution layers. We choose the marginal loss function (Sabour, Frosst, and Hinton 2017) on the prediction and the target label, and the loss is propagated back from the convolution layers’ outputs across the entire model.
| (28) |
where denotes the loss of the -th category, is , is and is . is the probability of the -th category of the prediction while is -th element of the label.
Inspired by (Sabour, Frosst, and Hinton 2017), we take reconstruction as a regularization method. The prediction in this part is fed into fully connected layers to reconstruct the input of the Inference Module. By minimizing the sum of squared differences between them, the Inference Module can be robust.
| (29) |
where the first term is the margin loss, and the second is the reconstruction loss, is the reconstruction function acting on the output . is the scale factor, which is in our experiment. We scale down the reconstruction loss so that it does not dominate the margin loss during training.
Experiment
Training Setup
We restrict 14 days for a textual sample and set the duration of the historical trending description as 64-day. The prediction interval is five days, and there are shuffled samples in a batch. The maximal length of the text is in words. And the maximal length of a textual sequence is restricted to , with excess clipped. To improve the expression of word vectors, we set the latent dimension as . All weight matrices in the model are initialized with the fan-in trick, while we set biases as zero in the beginning. We train the model as an Adam optimizer with an initial learning rate of and follow a linear decay strategy. We use the input dropout rate of and the weight decay rate of to regularize.
Evaluation Metrics
Following previous work for stock prediction (Xie et al. 2013)(Xu and Cohen 2018), we adopt the standard measure of accuracy and Matthews Correlation Coefficient (MCC) as evaluation metrics. With the confusion matrix which contains the number of samples classified as true-positive , false-positive , true-negative and false-negative , MCC is calculated as follows:
| (30) |
We list the accuracy and MCC performance of baselines and our models in Table 2.
Baselines
To evaluate the effectiveness of our proposed deep learning framework, we compare our model MMAN(Multi-Modality Attention Network) with the performance of the following methods:
-
Random Forest: (Pagolu et al. 2016) proposes a discriminative Random Forest classifier using word2vec text representations.
-
HAN: (Hu et al. 2018) proposes a state-of-the-art discriminative deep neural network with hierarchical attention.
-
Adv-LSTM: (Feng et al. 2019) proposes the attentive LSTM model and train it in adversarial training strategy.
-
StockNet: (Xu and Cohen 2018) proposes a deep generative model which jointly exploiting text and price signals.
-
MHACN: (Liu et al. 2020) first split corpus into news and tweets and then jointly exploit their combined effect. To keep consistent with our dataset, we take textual features and historical trending features as inputs.
-
CapTE: (Liu et al. 2019) proposes a CapTE model to consider the rich semantics and relation for a certain stock.
-
MMAN-oC: We only take textual features as the input to compare the modality fusion mechanism.
-
MMAN-oH: We only take historical trending features as the input.
-
MMAN-nA: To verify the effectiveness of the social impact features, we conduct experiments by utilizing our model without this modality.
-
MMAN-nH: To verify the effectiveness of the historical trending features, we conduct experiments by utilizing our model without this modality.
Experimental Results
In this section, we detail our experimental setup and results. We test our model from two aspects. One is to predict the rise and fall based on our dataset. The other is virtual trading which mimics real-world transactions. In the end, we analyze the effects of multi-modality.
Classification Task. From table 2, we can see that CapTE gets the highest score in the baselines. However, on the same dataset, our model obtains higher accuracy than CapTE, more than , which shows our model outperforms baselines by a significant margin in both accuracy and MCC. We have provided a detailed discussion of the necessity of access the reliability of texts and our approach to supplement semantics with reliability. The score of MMAN is higher than MMAN-nA, and MMAN-nH is higher than MMAN-oC. It indicates the supplementary effect from social impact features to textual features, which reduces the conflict of a single text modality. As introduced above, we hypothesize that historical trending features and textual features are complementary. In the ablation study, we compare their combined action with an individual effect. We found that our model MMAN outperforms MMAN-nH and MMAN-nA outperforms both MMAN-oC and MMAN-oH, which indicates the two modalities supplement each other and the fused features are more predictive. Compared with each partial model mentioned above, intact model MMAN performs much better, which means our hypothesis is solid and the effectiveness of multi-modality.
| Model | Acc. | MCC |
| RF | ||
| HAN | ||
| StockNet | ||
| Adv-LSTM | ||
| MHACN | ||
| CapTE | ||
| Ours-MMAN-oH | ||
| Ours-MMAN-oC | ||
| Ours-MMAN-nA | ||
| Ours-MMAN-nH | ||
| Ours-MMAN |
Virtual Trading. In addition to comparing the accuracy and MCC, we apply our model and CapTE to virtual trading and compare their performance. We simulated real-world stock trading from January 2021 to March 2021 by following the strategy proposed by (Lavrenko et al. 2000), which mimics the behavior of a trader who uses our model. On the one hand, if the model indicates that an individual stock price will increase, the fictitious trader will invest in $10,000 worth at the opening price. Then the trader will hold the stock during the prediction internal. During this time, if the stock has a profit of 2% or more, the trader sells immediately. Otherwise, the trader sells the stock at the closing price on the last day. On the other hand, if the model predicts that a stock price will fall, when the trader can buy the stock at a price 1% lower than shorted, he/she will buy it to cover. Otherwise, the trader buys the stock at the closing price of the last day.
| Industry | Market | CapTE | MMAN |
| Medicine | $ 102.6 | $ 959.2 | $ 866.6 |
| Commerce | $ 956.2 | $ 1051.9 | $ 1240.8 |
| Catering | $ 527.0 | $ 654.7 | $ 778.8 |
| Electronic | $ 1003.5 | $ 752.2 | $ 913.2 |
| Chemical | $ 689.9 | $ 833.0 | $ 958.3 |
| Transportation | $ 576.5 | $ 702.6 | $ 723.1 |
We split the stocks into categories based on their industries and show the virtual trading performance of six selected popular industries in table 3. We found that the profits of CapTE and our model MMAN are much higher than the price change during the test period. Compared to CapTE, our model performs much better overall, and the maximum return of stocks in the commerce industry is over 12%. The results demonstrate consistently better performance, which indicates the robustness of our model.
Effects of Multi-Modality
We utilize the class activation map (Zhou et al. 2015) to visualize the feature maps of outputs of the Encoder Module and Fusion Module, which is illustrated in Figure 2.
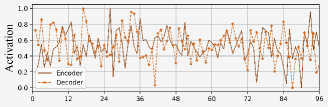
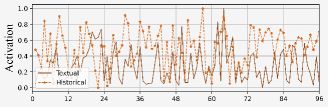
In the feature maps, we paint every feature vector with gray values based on its activation intensity, where the mean gray value of a one-dimensional feature vector represents the whole vector. Comparing and , we observed that high-intensity parts shifted, which means the fused textual features do not rest on semantics itself but take in the social impact features. We also compare the textual features and historical trending passed through the inter-intra attention mechanism. We found that and focus on different areas, which is consistent with our hypothesis that historical trending is not equal but supplement to the social attitude in this task.
Conclusion
To promote prediction accuracy is to make full use of stock market information. We demonstrate a method to predict the stock price movements based on enriched market information through the extraction and fusion of multi modalities. As is shown in the results, our Multi-Modality Attention Network improves the performance in both the classification task and virtual trading significantly, which introduces a new direction to increase the performance: adopt multi-modality. Since the market is complex, digging for sufficient modalities can better represent the real-world situation. Our work also highlights a question on how to perform an effective fusion among modalities to improve performance. In the future, we will further explore relevant features and high-efficient modality fusion approaches.
References
- De Bondt and Thaler (1985) De Bondt, W. F. M.; and Thaler, R. 1985. Does the Stock Market Overreact? Journal of Finance, 40(3): 793–805.
- Fama et al. (1969) Fama, E. F.; Fisher, L.; Jensen, M. C.; and Roll, R. 1969. The Adjustment of Stock Prices to New Information. International Economic Review, 10(1): 1–21.
- Feng et al. (2019) Feng, F.; Chen, H.; He, X.; Ding, J.; Sun, M.; and Chua, T.-S. 2019. Enhancing Stock Movement Prediction with Adversarial Training. arXiv:1810.09936.
- Hoseinzade and Haratizadeh (2019) Hoseinzade, E.; and Haratizadeh, S. 2019. CNNpred: CNN-based stock market prediction using a diverse set of variables. Expert Systems with Applications, 129: 273–285.
- Hu et al. (2018) Hu, Z.; Liu, W.; Bian, J.; Liu, X.; and Liu, T.-Y. 2018. Listening to Chaotic Whispers. In Proceedings of the Eleventh ACM International Conference on Web Search and Data Mining. ACM.
- Iyyer et al. (2015) Iyyer, M.; Manjunatha, V.; Boyd-Graber, J.; and Daumé III, H. 2015. Deep Unordered Composition Rivals Syntactic Methods for Text Classification. In Proceedings of the 53rd Annual Meeting of the Association for Computational Linguistics and the 7th International Joint Conference on Natural Language Processing (Volume 1: Long Papers), 1681–1691. Beijing, China: Association for Computational Linguistics.
- Lavrenko et al. (2000) Lavrenko, V.; Schmill, M.; Lawrie, D.; Ogilvie, P.; Jensen, D.; and Allan, J. 2000. Mining of Concurrent Text and Time Series. In IN PROCEEDINGS OF THE 6 TH ACM SIGKDD INT’L CONFERENCE ON KNOWLEDGE DISCOVERY AND DATA MINING WORKSHOP ON TEXT MINING, 37–44.
- Lin and Chen (2018) Lin, X.; and Chen, L. 2018. Domain-Aware Multi-Truth Discovery from Conflicting Sources. Proc. VLDB Endow., 11(5): 635–647.
- Liu et al. (2019) Liu, J.; Lin, H.; Liu, X.; Xu, B.; Ren, Y.; Diao, Y.; and Yang, L. 2019. Transformer-Based Capsule Network For Stock Movement Prediction. In Proceedings of the First Workshop on Financial Technology and Natural Language Processing, 66–73. Macao, China.
- Liu et al. (2020) Liu, J.; Lin, H.; Yang, L.; Xu, B.; and Wen, D. 2020. Multi-Element Hierarchical Attention Capsule Network for Stock Prediction. IEEE Access, 8: 143114–143123.
- Marcek (2000) Marcek, D. 2000. Stock price forecasting: autoregressive modelling and fuzzy neural network. Mathware & soft computing. 2000 Vol. 7 Núm. 2 [-3].
- Nguyen and Shirai (2015) Nguyen, T. H.; and Shirai, K. 2015. Topic Modeling based Sentiment Analysis on Social Media for Stock Market Prediction. In Proceedings of the 53rd Annual Meeting of the Association for Computational Linguistics and the 7th International Joint Conference on Natural Language Processing (Volume 1: Long Papers), 1354–1364. Beijing, China: Association for Computational Linguistics.
- Pagolu et al. (2016) Pagolu, V. S.; Challa, K. N. R.; Panda, G.; and Majhi, B. 2016. Sentiment Analysis of Twitter Data for Predicting Stock Market Movements. arXiv:1610.09225.
- Paninski (2003) Paninski, L. 2003. Estimation of Entropy and Mutual Information. Neural Comput., 15(6): 1191–1253.
- Peng et al. (2019) Peng, G.; Jiang, Z.; You, H.; Lu, P.; Hoi, S.; Wang, X.; and Li, H. 2019. Dynamic Fusion with Intra- and Inter- Modality Attention Flow for Visual Question Answering. arXiv:1812.05252.
- Qin et al. (2017) Qin, Y.; Song, D.; Chen, H.; Cheng, W.; Jiang, G.; and Cottrell, G. W. 2017. A Dual-Stage Attention-Based Recurrent Neural Network for Time Series Prediction. CoRR, abs/1704.02971.
- Robertson and Zaragoza (2009a) Robertson, S.; and Zaragoza, H. 2009a. The Probabilistic Relevance Framework: BM25 and Beyond. Foundations and Trends® in Information Retrieval, 3(4): 333–389.
- Robertson and Zaragoza (2009b) Robertson, S.; and Zaragoza, H. 2009b. The Probabilistic Relevance Framework: BM25 and Beyond. Found. Trends Inf. Retr., 3(4): 333–389.
- Sabour, Frosst, and Hinton (2017) Sabour, S.; Frosst, N.; and Hinton, G. E. 2017. Dynamic Routing Between Capsules. arXiv:1710.09829.
- Schumaker and Chen (2009) Schumaker, R. P.; and Chen, H. 2009. Textual Analysis of Stock Market Prediction Using Breaking Financial News: The AZFin Text System. ACM Trans. Inf. Syst., 27(2).
- Shu et al. (2017) Shu, K.; Sliva, A.; Wang, S.; Tang, J.; and Liu, H. 2017. Fake News Detection on Social Media: A Data Mining Perspective. SIGKDD Explor. Newsl., 19(1): 22–36.
- Si et al. (2013a) Si, J.; Mukherjee, A.; Liu, B.; Li, Q.; Li, H.; and Deng, X. 2013a. Exploiting Topic based Twitter Sentiment for Stock Prediction. In Proceedings of the 51st Annual Meeting of the Association for Computational Linguistics (Volume 2: Short Papers), 24–29. Sofia, Bulgaria: Association for Computational Linguistics.
- Si et al. (2013b) Si, J.; Mukherjee, A.; Liu, B.; Li, Q.; Li, H.; and Deng, X. 2013b. Exploiting topic based twitter sentiment for stock prediction. In Proceedings of the 51st Annual Meeting of the Association for Computational Linguistics (Volume 2: Short Papers), 24–29.
- Somani, Talele, and Sawant (2014) Somani, P.; Talele, S.; and Sawant, S. 2014. Stock market prediction using Hidden Markov Model. In 2014 IEEE 7th Joint International Information Technology and Artificial Intelligence Conference, 89–92.
- Timmermann (1996) Timmermann, A. 1996. Excess Volatility and Predictability of Stock Prices in Autoregressive Dividend Models with Learning. The Review of Economic Studies, 63: 523–557.
- Vali, Xu, and Yildirim (2015) Vali, H.; Xu, D.; and Yildirim, M. 2015. The Effect of Conflicting Consumer Reviews on the Accuracy of a Purchase Decisions. In AMCIS.
- Vaswani et al. (2017) Vaswani, A.; Shazeer, N.; Parmar, N.; Uszkoreit, J.; Jones, L.; Gomez, A. N.; Kaiser, L.; and Polosukhin, I. 2017. Attention Is All You Need. arXiv:1706.03762.
- Wu et al. (2018) Wu, H.; Zhang, W.; Shen, W.; and Wang, J. 2018. Hybrid Deep Sequential Modeling for Social Text-Driven Stock Prediction. In Proceedings of the 27th ACM International Conference on Information and Knowledge Management, CIKM ’18, 1627–1630. New York, NY, USA: Association for Computing Machinery. ISBN 9781450360142.
- Xie et al. (2013) Xie, B.; Passonneau, R. J.; Wu, L.; and Creamer, G. G. 2013. Semantic Frames to Predict Stock Price Movement. In Proceedings of the 51st Annual Meeting of the Association for Computational Linguistics (Volume 1: Long Papers), 873–883. Sofia, Bulgaria: Association for Computational Linguistics.
- Xu and Cohen (2018) Xu, Y.; and Cohen, S. B. 2018. Stock Movement Prediction from Tweets and Historical Prices. In Proceedings of the 56th Annual Meeting of the Association for Computational Linguistics (Volume 1: Long Papers), 1970–1979. Melbourne, Australia: Association for Computational Linguistics.
- Zhou et al. (2015) Zhou, B.; Khosla, A.; Lapedriza, A.; Oliva, A.; and Torralba, A. 2015. Learning Deep Features for Discriminative Localization. arXiv:1512.04150.