Community detection and portfolio optimization
Abstract
Community detection methods can be used to explore the structure of complex systems. The well-known modular configurations in complex financial systems indicate the existence of community structures. Here we analyze the community properties of correlation-based networks in worldwide stock markets and use community information to construct portfolios. Portfolios constructed using community detection methods perform well. Our results can be used as new portfolio optimization and risk management tools.
keywords:
stock market , correlation-based network , community detection , portfolio optimization1 Introduction
Community detection is an an effective tool for exploring the modular structures in complex networks [1], because community properties indicate how complex systems are organized. Since Newman [2] proposed the first formal definition of the modular structure of complex networks, the community detection task has become a major focus in network theory, and numerous community detection algorithms have been proposed [3, 4, 5]. Among the many real-world modularized complex systems, financial markets have become a particularly attractive subject, but the coexistence of noisy and structured patterns make financial systems difficult to deal with. To reduce the influence of noise, many correlation-based methods have been proposed to extract structured information from the complex correlations among financial assets, including the threshold method, the minimum spanning tree (MST) [6], the planar maximumly filtered graph (PMFG) [7], among others [8, 9, 10, 11, 12, 13, 14].
These correlation-based networks use complex cross-correlation matrices to determine the noise-free structure of complex financial markets. Because correlation-based network methods differ from the eigenvector-based methods that use variance contributions from only a few dimensions, they can transform dense correlation matrices into sparse representations, i.e., complex networks. These correlation-based network methods are popular because the noise-free information they produce can be used to analyze interactions among financial assets [15].
Much recent research has used the structured information provided by correlation-based network to optimize portfolio selection procedure [16, 17, 18, 19]. In particular, some compound centrality measures using centrality ranking have been proposed to quantify the importance of financial assets. From a complex network perspective, the modular structures in financial networks link correlation-based networks and community structures, and we thus can assume that the community structures in correlation-based networks can also provide useful information about risk diversification.
We here use a community detection algorithm to analyze the correlation-based networks in stock markets. We construct a strand of PMFG networks for the US, UK, and Chinese stock markets [7], the community structures of which are readily available. We then use this community information to construct portfolios of stocks from different communities. The good performance of these portfolios, indicates the usefulness of the community structures.
2 Data and methodology
2.1 Data
Our data sets are of the daily adjusted returns of the constitute stocks of three major indexes: the S&P 500 (US), the FTSE 350 (UK), and the SSE 380 (China). To accurately estimate cross-correlations among stocks, we discard the stocks where the sample size is small. This leaves us with 401, 264, and 295 stocks for the three markets, respectively. Each stock in the S&P 500 index has 4025 daily returns from 4 January 1999 to 31 December 2014. Each in the FTSE 350 index has 3000 daily returns from 10 October 2005 to 26 April 2017. Each in SSE 380 index has 2700 daily returns from 21 May 2004 to 19 November 2014.
2.2 Community detection of the correlation-based networks
Before we introduce the community detection algorithm, we need to construct correlation-based networks from the return time series. We define logarithm return to be
| (1) |
Here is the closure price of stock at time . We then use the past return records inside a moving window of length to calculate the Pearson cross-correlation coefficients between any pair of return time series at time . We obtain an matrix at time with an estimation window of days, and is the number of stocks. We select the moving window widths to ensure the non-singularity of the cross-correlation matrix () with days for the S&P 500 and days for both the FTSE 350 and the SSE 380. We then shift the moving window with 25-day step and obtain a strand of correlation matrices for the three markets. We now have 142, 109, and 97 correlation matrices for the S&P 500, FTSE 350, and SSE 380 indices, respectively.
We then employ the planar maximally filtered graph (PMFG) method to remove redundant information induced by the dense cross-correlation matrices [7], and we construct sparse networks from the cross-correlation matrices . A planar graph is formed with edges in a system with stocks. Reference [7] indicates that the PMFG keeps the hierarchical organization of the MST and also induces cliques. The PMFG network can discriminate between important information and noise. Previous studies have analyzed the modular structure of the PMFG network for both indices and stocks [20, 21, 19], and we here use the infomap algorithm [22] to detect the community structures in the PMFG networks for the three markets. A comparative analysis indicates that the infomap algorithm is the best-performing community detection algorithm[23]. The community structure given by the infomap algorithm provides a comprehensive description of the macrostructure of financial markets. Thus a natural generalization is to use community information when optimizing portfolio design.
3 Results and applications
3.1 Community structure
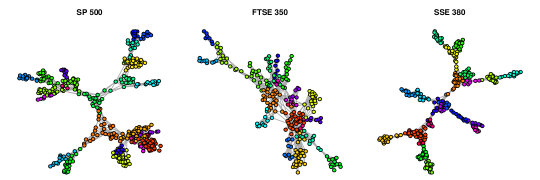
Figure 1 shows three PMFG networks for the three stock markets. We use the infomap algorithm to obtain the community structures, which are shown in different colors. The PMFG networks each have a distinctive community structure, and the appearance of hub stocks indicates that stock market structures are heterogeneous.
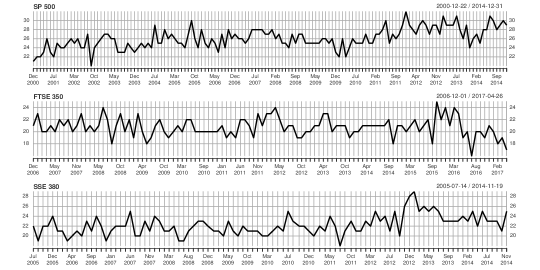
Figure 2 shows the number of communities detected in the three markets. The mean number of communities is 26 for the S&P 500 index, 21 for the FTSE 350 index, and 22 for the SSE 380 index. The community numbers usually fluctuate around its mean value. Note that the average number of communities can indicate an approaching crisis period, such as the sub-prime crisis beginning in September 2008 and the European debt crisis at the end of 2009. Because fluctuations in the number of communities makes drawing useful conclusions about market states difficult, however, we can analyze the modularity of the PMFG for the three markets, which is defined
| (2) |
where is the entry of the adjacency matrix of the PMFG, the degree of node , the number of total edges of PMFG, and the community membership of node . The modularity quantifies with a value between 0 to 1 the level of modular structure in the correlation-based network. In every PMFG at any given time, one community partition will give a modularity value that indicates the degree of the modular structure of the market.
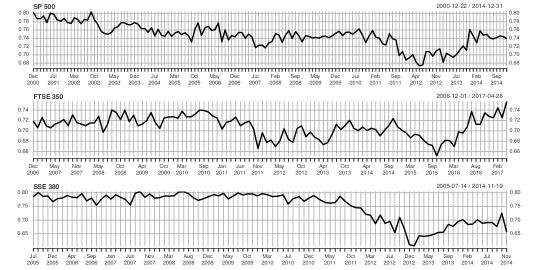
Figure 3 shows the evolution of the modularity for the three markets, which decreased rapidly during the European debt crisis. Note that the modularity prior to 2011 in the Chinese market is very high, indicating that the Chinese market is highly structured.
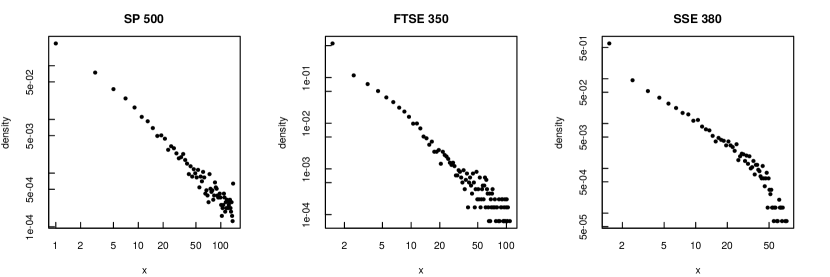
We also use these time-evolving PMFGs to analyze the stability of the connections in the three markets. We checked the co-occurrence time of stock pairs within the same community during the whole observation period. We use the co-occurrence time to evaluate the stability of the community structure. An extremely stable community structure produces a double peak distribution with co-occurrence time and . When the two stocks never stay in the same community. When the two stocks are always in the same community. Figure 4 shows extremely heterogeneous distributions, indicating that the community structures of the three markets are extremely unstable over time. Note that the distributions of the co-occurrence times are power laws in the three markets. Although a few stocks belong to the same community for a long period of time, market fluctuations cause the stay of most stocks in the same community to be very short.
Thus these community structures produce information about the structure evolution in the three markets. We will now use this structured community information to optimize the portfolio construction procedure.
3.2 Portfolio optimization
3.2.1 Mean-variance portfolio optimization
We first employ the community structure to improve the performance of portfolio optimization under the Markowitz portfolio optimization framework[24]. Much research has focused on establishing connections between correlation-based networks and portfolio optimization problems [25, 26, 16, 17, 18, 19]. We now give an brief introduction about the Markowitz portfolio theory. Using Markowitz portfolio theory we examine a portfolio of stocks with return . The return of the portfolio is
| (3) |
where is the investment weight of stock , and is normalized such that . We quantify portfolio risk using the variance of portfolio return
| (4) |
where is the Pearson cross-correlation between and , and and are the standard deviations of the return time series and , respectively. The optimal portfolio weights are determined by maximizing the portfolio return under the constraint that the risk of the portfolio equals some fixed value . We formulate maximizing subject to these constraints as a quadratic optimization problem
| (5) |
Here is the covariance matrix of the return time series for stocks. The parameter is the risk tolerance parameter with . A large indicates investors have a strong tolerance to risk and expect a large return. A small means investors are extremely risk-adverse. Optimal portfolios at different risk and return levels can be displayed as an efficient frontier, which is a plot of the return as a function of risk .
When determining the constitute stocks for a specific portfolio, nodes inside a community indicate that connections within the community are stronger than connections with nodes in other communities. Recent research on the community detection of cross-correlation matrices found that using the optimization procedure of modified modularity reveals that residual cross-correlations among stocks from different communities are negative [27]. This qualitatively proves the effectiveness of a community-based portfolio.
Here we use the community partitions of correlation-based networks for different stock markets to construct our portfolio. In particular we use stocks from different communities. When the community detection algorithm shows that a PMFG network has communities, we randomly choose one stock from each community. These stocks must only connect with stocks within their own community, and this produces a portfolio that consists of stocks that are weakly or even negatively correlated. For the sake of comparison, we also construct a portfolio made up of stocks residing in the same community. The stocks within the same community are strongly correlated. Thus the risk diversification of the portfolio with stocks from one community is relatively weak.
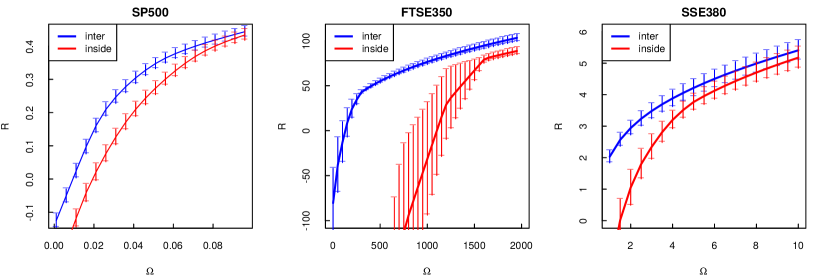
Figure 5 shows the efficient frontiers of portfolios with stocks from different communities—inter-portfolio (blue lines)—and of portfolios with stocks from the same community—intra-portfolio (red lines). Note that the inter-community portfolios have lower risk and higher return in the three markets. Thus the risk diversification of the inter-community portfolios are much stronger than that of intra-community portfolios.
3.2.2 Expected shortfall approach
The mean-variance portfolio framework assumes that normality of the return time series which is rarely valid in the real-world. Thus accurately measuring portfolio risk is quite important. Except the variance as a risk measure, the expected shortfall (ES) is a more modern coherent risk measure [28, 29, 30]. We designate to be the profit loss of a portfolio in the time range , and to be a specified probability level. Then the expected shortfall of a portfolio is
| (6) |
Here ES is the expected loss incurred in the worst cases of the portfolio and is a coherent risk measure. For a portfolio of size stocks, when the return time series is , we minimize the ESα of the portfolio under the constraint of . We then set the probability level for the expected shortfall ESα of the portfolio and prohibit short selling.
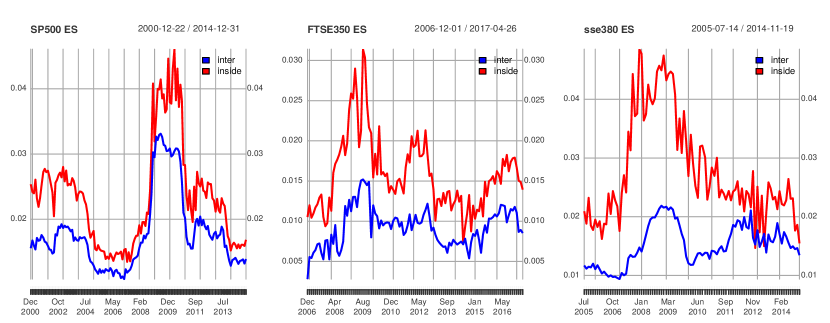
Figure6 shows the time evolution of the expected shortfalls for the three stock markets. The blue (red) lines represent the expected shortfalls for inter- (intra-) portfolios. Note that the expected shortfalls for the inter-community portfolios are much smaller than for the intra-community portfolios. The monthly time series of expected shortfalls for the three stock markets consistently quantifies the market risk. We use the optimization procedure under the normalization constraint to obtain the expected shortfall value. This means the optimized risk in intra-community portfolios is much larger than that in inter-community portfolios. Reference [27] proposes that the correlation matrix is a weighted fully-connected network. There is a negative correlation between the indices from different communities. The lower expected shortfalls of inter-community portfolios have verified this argument. Note that the ES value increases during crisis periods in all three markets. The ES increases rapidly during market turbulence such as the subprime crisis beginning in September 2008 and the European debit crisis in the following year.
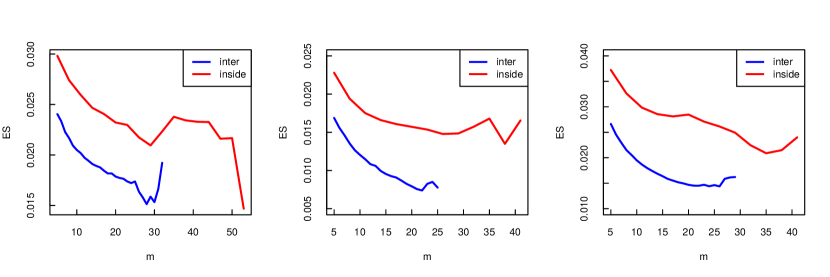
Figure 7 shows the dependency of ES on portfolio size . Note that the ES of inter-community portfolios are lower than those of intra-community portfolios for different portfolio sizes . The largest inter-community portfolio size is smaller than the largest intra-community portfolio. This is because the number of communities yielded by the community detection algorithm is smaller than the size of the largest community.
4 Conclusion
We have analyzed the community structures of the correlation-based networks of three stock markets. The community structures of the correlation-based networks reveal clear modular stock market structures. Using community structure information, we construct risk diversified portfolios with higher return and lower risk. Using both mean-variance and expected-shortfall frameworks, we construct portfolios and find that the portfolios with inter-community stocks outperform these with intra-community stocks. This is the first study that uses a community detection algorithm to analyze the time evolution of correlation-based networks. We apply community partition information to portfolio selection and find that the community structure of the correlation-based networks of stock markets is important.
5 Acknowledgments
This work is supported by Scientific and technological activities support funding for returned overseas students of Shaanxi province No. 27 and National Natural Science Foundation of China 71901171 and 72071006, Startup funding of NWPU G2021KY05101 and the interdisciplinary research fund for liberal arts of NWPU 21GH031109.
References
- [1] Santo Fortunato and Darko Hric. Community detection in networks: A user guide. Physics Reports, 659:1–44, 2016.
- [2] M. E J Newman and M. Girvan. Finding and evaluating community structure in networks. Physical Review E - Statistical, Nonlinear, and Soft Matter Physics, 69(2 2):1–15, 2004.
- [3] Santo Fortunato. Community detection in graphs. In Physics Reports, volume 486, pages 75–174, feb 2010.
- [4] Jihui Han, Wei Li, Zhu Su, Longfeng Zhao, and Weibing Deng. Community detection by label propagation with compression of flow. The European Physical Journal B, 89(12):272, dec 2016.
- [5] Jihui Han, Wei Li, Longfeng Zhao, Zhu Su, Yijiang Zou, and Weibing Deng. Community detection in dynamic networks via adaptive label propagation. PLoS ONE, 12(11):e0188655, nov 2017.
- [6] RN N R.N. Mantegna. Hierarchical structure in financial markets. European Physical Journal B, 197(1):193–197, 1999.
- [7] M. Tumminello, T. Aste, T. Di Matteo, and R. N. Mantegna. A tool for filtering information in complex systems. Proceedings of the National Academy of Sciences of the United States of America, 102(30):10421–10426, jul 2005.
- [8] Dror Y Kenett, Michele Tumminello, Asaf Madi, Gitit Gur-Gershgoren, Rosario N Mantegna, and Eshel Ben-Jacob. Dominating clasp of the financial sector revealed by partial correlation analysis of the stock market. PloS one, 5(12):e15032, jan 2010.
- [9] Shi-Min Cai, Yan-Bo Zhou, Tao Zhou, and Pei-Ling Zhou. Hierarchical Organization and Disassortative Mixing of Correlation-Based Weighted Financial Networks. International Journal of Modern Physics C, 21(03):433–441, 2010.
- [10] Ya-Chun Gao, Yong Zeng, and Shi-Min Cai. Influence network in Chinese stock market. Journal Of Statistical Mechanics-Theory And Experiment, 2015(3):1–14, 2015.
- [11] Siew Lee Gan and Maman Abdurachman Djauhari. New York Stock Exchange performance: evidence from the forest of multidimensional minimum spanning trees. Journal of Statistical Mechanics: Theory and Experiment, 12005:P12005, 2015.
- [12] Gang-Jin Wang, Chi Xie, Kaijian He, and H Eugene Stanley. Extreme risk spillover network: application to financial institutions. Quantitative Finance, 17(9):1417–1433, 2017.
- [13] Gang-Jin Wang, Chi Xie, and Shou Chen. Multiscale correlation networks analysis of the US stock market: a wavelet analysis. Journal of Economic Interaction and Coordination, 12(3):561–594, oct 2017.
- [14] Gang-Jin Wang and Chi Xie. Tail dependence structure of the foreign exchange market: A network view. Expert Systems with Applications, 46(Supplement C):164–179, 2016.
- [15] Gautier Marti, Frank Nielsen, Mikołaj Bińkowski, and Philippe Donnat. A review of two decades of correlations, hierarchies, networks and clustering in financial markets. arXiv, pages 1–25, 2017.
- [16] F. Pozzi, T. Di Matteo, and T. Aste. Spread of risk across financial markets: better to invest in the peripheries. Scientific Reports, 3(1):1665, 2013.
- [17] Gustavo Peralta and Abalfazl Zareei. A network approach to portfolio selection. Journal of Empirical Finance, 38:157–180, 2016.
- [18] Longfeng Zhao, Gang-Jin Wang, Mingang Wang, Weiqi Bao, Wei Li, and H. Eugene Stanley. Stock market as temporal network. Physica A, 506:1104–1112, sep 2018.
- [19] Longfeng Zhao, Wei Li, Andrea Fenu, Boris Podobnik, Yougui Wang, and H Eugene Stanley. The q -dependent detrended cross-correlation analysis of stock market. Journal of Statistical Mechanics: Theory and Experiment, 2018(2):23402, 2018.
- [20] Dong-Ming Song, Michele Tumminello, Wei-Xing Zhou, and Rosario N. Mantegna. Evolution of worldwide stock markets, correlation structure, and correlation-based graphs. Physical Review E, 84(2):026108, aug 2011.
- [21] Longfeng Zhao, Wei Li, and Xu Cai. Structure and dynamics of stock market in times of crisis. Physics Letters A, 380(5-6):654–666, 2016.
- [22] Martin Rosvall and Carl T Bergstrom. Maps of random walks on complex networks reveal community structure. Proceedings of the National Academy of Sciences of the United States of America, 105(4):1118–23, jan 2008.
- [23] Andrea Lancichinetti and Santo Fortunato. Community detection algorithms: A comparative analysis. Physical Review E, 80(5):056117, nov 2009.
- [24] Harry Markowitz. Portfolio Selection. The Journal of Finance, 7(1):77, mar 1952.
- [25] J.-P. P. Onnela, A. Chakraborti, K. Kaski, J. Kertesz, A. Kanto, and J. Kertész. Dynamics of market correlations: Taxonomy and portfolio analysis. Physical Review E, 68(5):056110, nov 2003.
- [26] Vincenzo Tola, Fabrizio Lillo, Mauro Gallegati, and Rosario N Mantegna. Cluster analysis for portfolio optimization. Journal of Economic Dynamics and Control, 32(1):235–258, 2008.
- [27] Mel MacMahon and Diego Garlaschelli. Community detection for correlation matrices. Physical Review X, 5(2):1–22, 2015.
- [28] Carlo Acerbi and Dirk Tasche. Expected Shortfall: A Natural Coherent Alternative to Value at Risk. Economic Notes, 31(2):379–388, 2002.
- [29] Fabio Caccioli, Susanne Still, Matteo Marsili, and Imre Kondor. Optimal liquidation strategies regularize portfolio selection. European Journal of Finance, 19(6):554–571, 2013.
- [30] FABIO CACCIOLI, IMRE KONDOR, MATTEO MARSILI, and SUSANNE STILL. Liquidity Risk and Instabilities in Portfolio Optimization. International Journal of Theoretical and Applied Finance, 19(05):1650035, 2016.