Analyzing Scientific Publications using Domain-Specific Word Embedding and Topic Modelling
Abstract
The scientific world is changing at a rapid pace, with new technology being developed and new trends being set at an increasing frequency. This paper presents a framework for conducting scientific analyses of academic publications, which is crucial to monitor research trends and identify potential innovations. This framework adopts and combines various techniques of Natural Language Processing, such as word embedding and topic modelling. Word embedding is used to capture semantic meanings of domain-specific words. We propose two novel scientific publication embedding, i.e., PUB-G and PUB-W, which are capable of learning semantic meanings of general as well as domain-specific words in various research fields. Thereafter, topic modelling is used to identify clusters of research topics within these larger research fields. We curated a publication dataset consisting of two conferences and two journals from 1995 to 2020 from two research domains. Experimental results show that our PUB-G and PUB-W embeddings are superior in comparison to other baseline embeddings by a margin of 0.18-1.03 based on topic coherence.
Index Terms:
Natural language processing, topic modeling, clustering, feature selectionI Introduction
The scientific and technological worlds are changing at an unprecedented rate, thus increasing the importance of monitoring research trends to identify innovation potential. Trend research and identification can be done using a variety of sources, with scientific literature books, articles, and publications receiving substantial attention from researchers worldwide [1, 2, 3]. The analysis of publications has proved useful in identifying emerging topics and tracking their growth or decline over the years using linguistic features. The use of Natural language Processing (NLP) techniques to support this analysis makes it easier to discover patterns and allow for answering more specific research questions.
Word Embedding is an important and widely used NLP technique to identify the semantic meanings of a text corpus. These semantic meanings are useful for identifying and quantifying the word-word similarities and global contextual meaning of text corpora. An increasing number of word embeddings can be found in the literature, such as count vectorizers [4] and TF-IDF [5], which are more classical word representation techniques. These classical approaches are linear language modeling approaches and often fail to model the true contextual meaning of text corpora. In contrast, Word2Vec [6], GloVe [7], and ELMO [8] are some of the more modern techniques of contextualizing meanings of text corpora, which incorporate neural networks for non-linear language modelling. However, these models are often trained on datasets derived from Twitter, Wikipedia, or general pieces of text and are therefore not entirely suitable for the analysis of scientific publications due to the existence of domain-specific words in these corpora. With this motivation, we present two domain-specific word embeddings termed PUB-G and PUB-W. We use these embeddings to cluster scientific publications based on their abstract to identify various areas of research in the respective domain. We then use topic modeling to identify more detailed research topics in these areas.
The paper makes the following contributions:
-
1.
We curate a publication dataset for two conference series and two journals of two different disciplines with a total of 10.4k publications for the period 1995 to 2020.
-
2.
We propose novel domain-specific embeddings based on GloVe and, alternatively, explore an embedding based on Word2Vec for publication data termed as PUB-G and PUB-W respectively. We further used these embeddings to cluster publications based on their abstracts.
-
3.
We develop a baseline classical approach for publication clustering and compare this approach with other competitive baseline embeddings.
-
4.
We show that the research topics identified by PUB-G embedding show a better coherence score.
The remainder of this paper is organized as follows. Section II discusses the related works. Section III shows the workflow of our proposed framework and provides a detailed explanation of each component, and Section IV describes our dataset. Section V discusses the experimental results and main findings. The conclusions can be found in Section VI.
II Related Work
NLP has widespread use and is being applied in a myriad of tasks ranging from language translation [9, 10, 11], sentiment analysis of text [12, 13, 14], document analysis [15, 16], and social media analytics [17, 18, 19]. In the following sections, we discuss some related works in several relevant sub-fields of NLP.
II-A Classical Document Analysis
Digital document analysis has been a research field for several years. [20] provides a detailed discussion of the traditional approaches that were used to analyze the structure of electronic documents. On the other hand, there are various tools available in the market today to perform information extraction from scientific literature [21, 22, 23, 24]. Many researchers used traditional approaches like Support Vector Machines (SVM), Latent Dirichlet Allocation (LDA), Singular Value Decomposition (SVD) and Hidden Markov Model (HMM) to implement various text analysis techniques. [25] used an extended HMM to extract the bibliographic attributes from the references, [26] used SVM classifier for two-stage metadata extraction from headers of research publications, and [27] applied an ensemble ML approach to automatically extract users from patents.
II-B Deep Learning-based Document Analysis
The application of neural networks (NN) to digital documents helped enormously in extracting and analyzing the documents and gain valuable insights. On this account, [28] extracted text information by identifying various sections of scientific publications in the form of PDF documents using deep learning-based NN, U-Net. Some researchers worked beyond the textual information such as [29], who used end-to-end multimodal fully convolutional neural networks to perform pixel-wise page segmentation to extract semantic features of the document. Other researchers [30, 31] extracted figures in research papers at NIPS, ICML and AAAI.
II-C Trend Analysis using Publications
Trend analysis has been a significant research topic in several fields. Recently, Ordun et. al. [32] did a thorough analysis of COVID-19 tweets using topic modeling and pattern matching to identify high-level trends, events with sudden spikes, distinctive topics, speed of tweeting and re-tweeting, and network behaviors. On a similar topic, Kwan and Lim [33, 34] used sentiment analysis, topic modeling and temporal analysis techniques on tweets to study trends and discussions about COVID-19 in various countries. Schoch et. al. [35] explored literary genre using topic modeling. Chiarello et. al.[36] using state-of-the-art text mining techniques to analyze research papers published in the Engineering Design field to identify the evolution of various research themes. Pek and Lim used academic publications to identify key business trends, particularly the various popular topics and the frequency of these topics over the years [37]. Similarly, research publications were used in HCI: Yang et. al. [38] visualized the use of ML to improve user experience (UX), Carter et. al. [39] analyzed the understanding of games and play research within four research paradigms in the field of HCI, and [40] studied the emerging trends and changes in HCI over a decade.
II-D Textual Word Embeddings
Textual word embeddings are often used in NLP research for language modeling [41, 42]. These embeddings transform textual words into an n-dimensional vector space, which are useful to 1) quantify word-word similarity and 2) model global contextual meanings of text corpora. There are various techniques for developing such a language model. Some of the classical methods in the literature are count vectorization and TF-IDF vectorization. These methods are based on word frequencies. Word2Vec presents a shallow neural network-based approach that optimizes to predict a masked word given the words before and after the masked word [6]. GloVe presents a regression-based model to predict the conditional probability of a word appearing given another word. Context-aware word embeddings, such as such as Embeddings from Language Model (ELMo) [8] and Bidirectional Encoder Representations from Transformers (BERT) [43], were more recently proposed to generate word representations that better consider the context of the sentence. However, all these embeddings are usually trained on common text corpora [7]. Thus, these existing embeddings are not suitable for analyzing scientific publications which often are abundant with domain-specific words.
III Proposed Framework
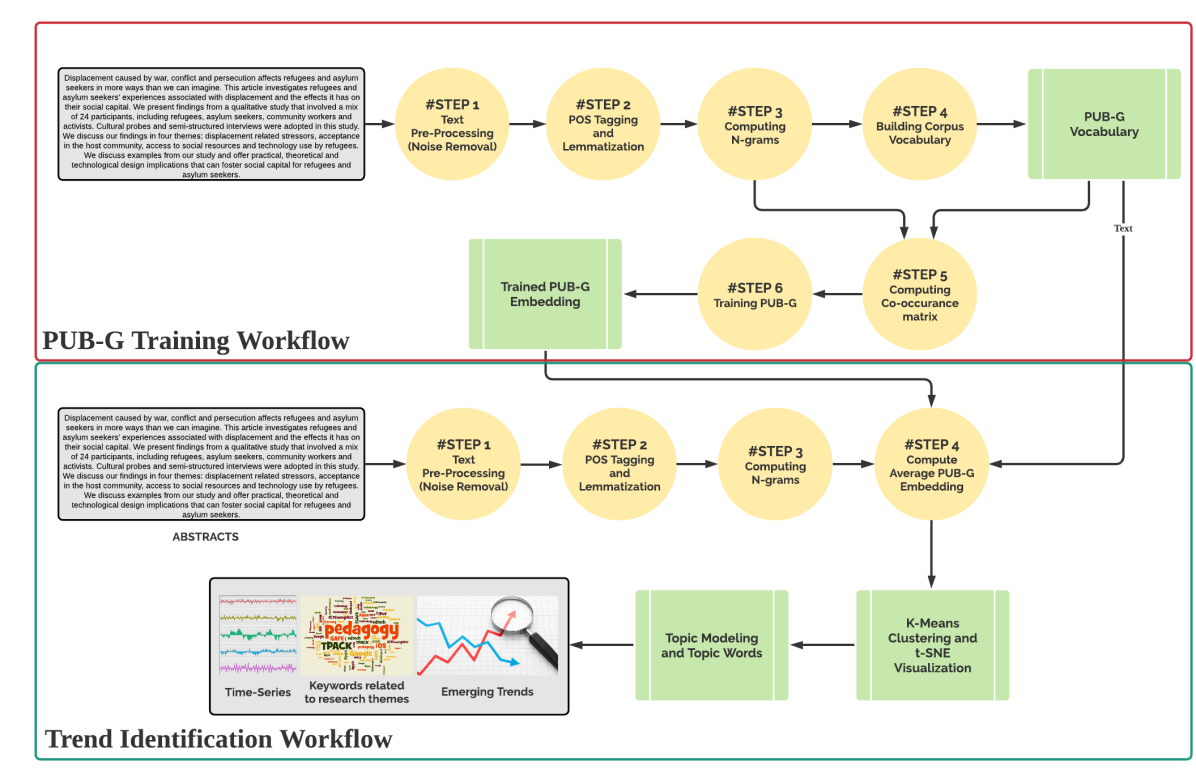
Our analysis is based on the abstracts of publications from two conferences and two journals in the Human-Computer Interaction (HCI) and Engineering Design research fields (more details later). We use a classical and neural network-based hybrid linguistic analysis approach to uncover trends in these conferences and journals. Figure 1 shows our analysis methodology which will be explained in detail in this section.
III-A Topic Clustering with Abstracts
III-A1 Text Pre-Processing
The abstracts are pre-processed by reducing noise to facilitate the subsequent analyses. The pre-processing consists of the following steps:
Hyperlinks. The first step performed to clean the dataset is the removal of hyperlinks. Regex patterns are implemented for the same. These consist of a small sequence of characters defining a specified syntax that is used to match all the possible sets of strings in a given text. These regular expressions are supported and accessed by the Python module ’re’.
Punctuations. Next, all the punctuation symbols including ‘[’, ‘,’, ‘\’, ‘.’, ‘!’, ‘?’, ‘]’ are replaced by an empty string using regular expressions (regex).
Numeric Values. Numerical values such as dates, amounts, etc. do not contribute much information for our purpose and hence, we removed numbers from the documents, again using Regex.
Lowercase. To prevent the model from being case-sensitive, we converted the text in lowercase using string method, lower().
Whitespaces. It is essential to remove unnecessary whitespaces from the data to reduce noise. This is done by using the string method, strip() that removes leading and trailing whitespaces.
III-A2 Tokenization
The tokenization process assigns a unique identifier to each unique word in the publication corpus. This is usually done as a preliminary step in many of the natural language processing pipelines for obtaining language features. We used Gensim library to perform tokenization on the corpus.
III-A3 Part-Of-Speech Tagging and Lemmatization
Part-Of-Speech (POS) tagging is used to allocate each token a POS tag, such as noun, adjective, verb, and adverb based on its contextual interpretation. Following which, lemmatization transforms all tokens from their grammatical modulation to root form.
III-A4 N-grams
In computational linguistics, an n-gram is identified as a continuous pattern of n words in a text corpus. An n-gram of size 1 is referred to as unigram, size 2 is referred to as bi-gram, and size 3 as trigram. Identifying such patterns in texts are often necessary to effectively uncover contextual meanings of language . Some of the most common bigrams and trigrams identified in our datasets are ‘augmented_reality’, ‘privacy_concern’, ‘computer_mediated_communication’, etc. It is evident that if these words are extracted as unigrams, their linguistic meaning is lost.
III-B Text Embeddings
III-B1 Baseline Textual Embedding
Text embedding is an dimensional vector for each unique word in the corpus. In other words, it stipulates words into dimensional vector space, from which, e.g. the semantic similarity among different words can be derived. We use Term Frequency-Inverse Document Frequency (TF-IDF) [44] as our baseline textual embedding which essentially is a 1-dimensional text embedding. TF-IDF score for the word in document from the document set D is obtained as follows:
| (1) |
Let us assume that there are unique words, bigrams or trigrams in the publication corpus. Let be the th unique word. Our textual embedding is dimensional where is the th value of the dimensional vector. for the abstract is calculated as follows:
| (2) |
is used as a baseline for textual embedding. Our publication corpus has unique TF-IDF features for ICED, for CHI, for TOCHI, and for RIED.
III-B2 PUB-W Embedding
We explored another textual embedding, Continuous Bag-of-Words (CBOW), Word2Vec [6]. The model contains a two-layer neural network for training that includes an input, a hidden, and an output layer. The input is given in a vector form developed by converting words into vectors using one-hot encoding. The hidden layer is a dense (fully-connected) layer with word embeddings as the weights and the output layer uses a softmax classifier to generate the probabilities for the target words.
| (3) |
Assuming the input text has words. For each , optimization function first computes the log of conditional probability of predicting th word given the previous number of words and number of words after the th word. Then, it computes the sum of the log of conditional probabilities for each word in the text. Finally, the objective is to minimize the negative of this summation which is represented in equation 3.
We present a trained 100-dimensional Word2Vec embedding on our publication dataset. For further analysis, we compute the average PUB-W embedding over all words.
III-B3 PUB-G Embedding
We believe that the TFIDF may not capture the actual semantic similarity among words in the vector space. There has been numerous work on different types of embeddings proposed over the years, which capture better semantic meaning of textual information. With this motivation, we propose to use GloVe [7] embedding trained on our publication corpus. In contrast to Word2Vec [6] or TFIDF, GloVe does not only rely on the local context of the words. It captures global statistics by the means of the word-word co-occurrence matrix. Let us define the co-occurrence matrix as where is the number of unique words in the dataset. is defined as the number of times the word has co-occurred with the word . Let be the number of times any word appears in the context of word . Furthermore, they define the as follows:
| (4) |
Let be the dimensional GloVe word embedding for the word . They define a regression model to learn . Here, learning the word embeddings depends on three words , and , where they define word to be the context word. Regression model is parameterized as follows:
| (5) |
Here, for the context word , separate embedding layer is used. In our analysis, we use 100 as the dimensionality of the GloVe word embedding.
For the abstract texts, we first compute the PUB-G embedding for each word in the abstract and then compute the average embedding over all the words.
III-C Clustering
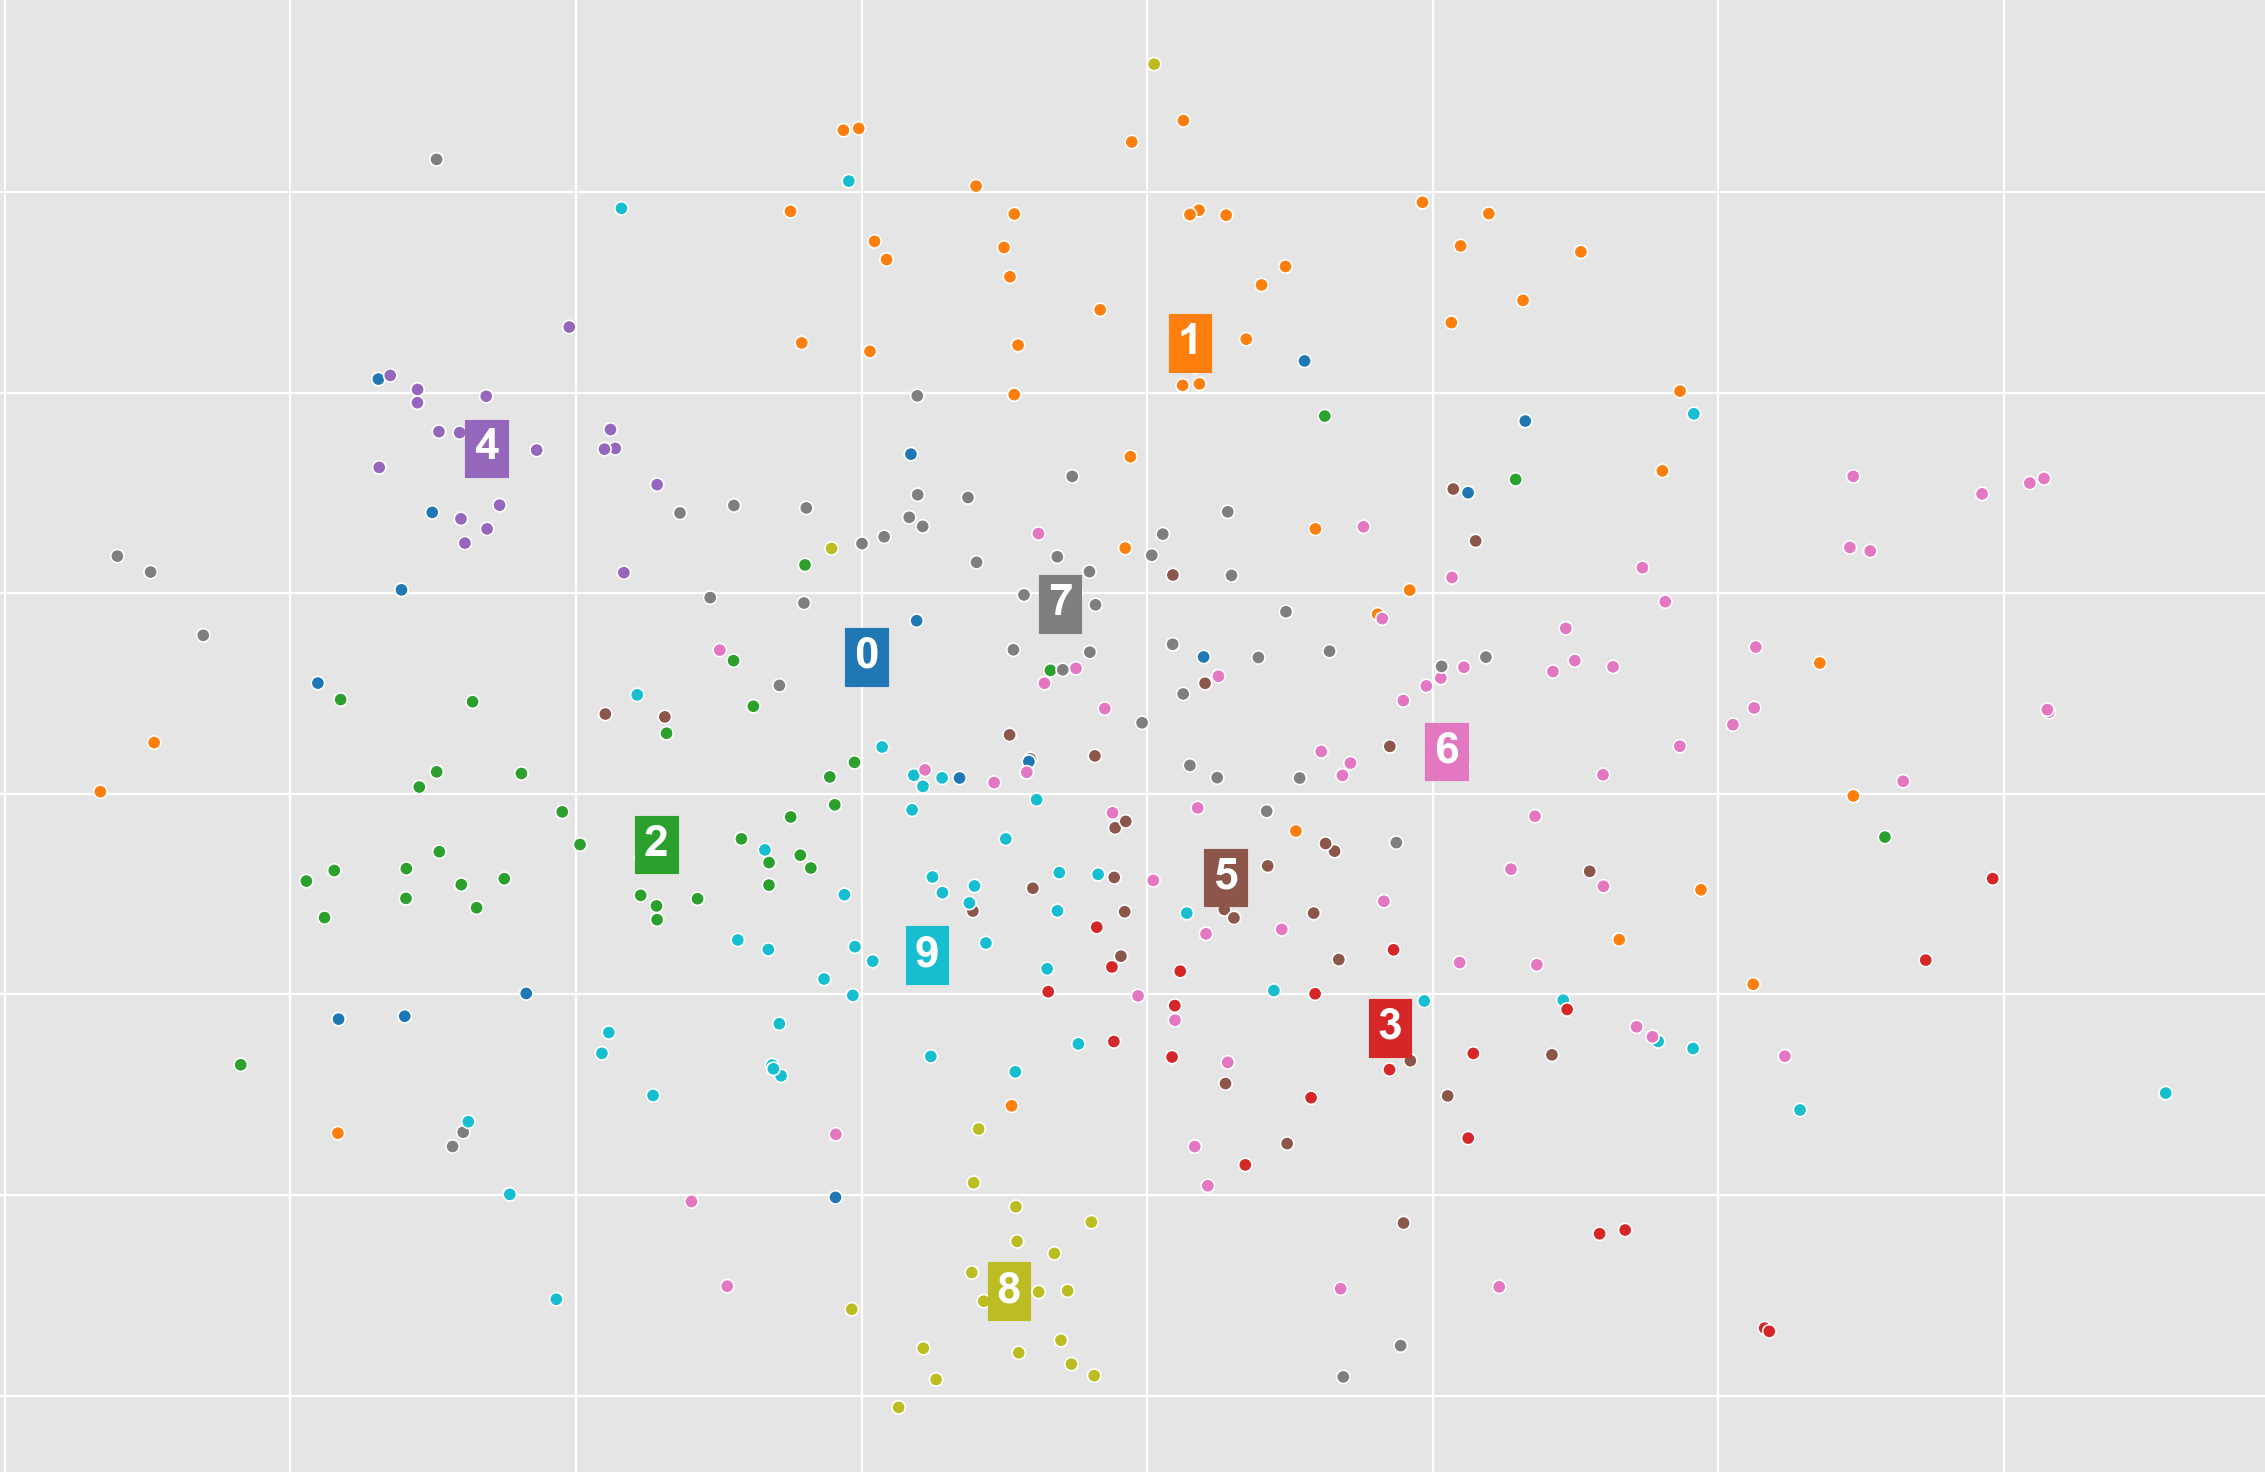
The resulting vectorized matrix obtained from feature vector space is then used to cluster each document of all four corpora, using K-Means Clustering [45]. To visualize these clusters in 2-dimensional space, we used t-distributed stochastic neighbor embedding (t-SNE) [46] visualization. Both of the approaches are discussed in detail further.
III-C1 K-means
[45] came up with one of the most straightforward unsupervised machine learning (ML) algorithms which are nowadays widely used for various real-world applications in order to recognize hidden patterns. It uses a simple approach of classifying the datapoints in a fixed number of clusters defined by , each having a particular centroid, representing the center of the cluster. At first, the K-Means clustering algorithm initializes the random centroids followed by the recursive computations of the distance between each cluster point and its corresponding cluster’s centroid until the centers of clusters get stabilized or the given number of iterations has been reached. The main idea is to minimize an error function known as a squared error which can be represented by the objective function 6 and the recalculation step of new centroid can be represented by 7.
| (6) |
| (7) |
Here, is the set of datapoints whereas is the set of centroids of clusters. In our case, datapoint is a -dimensional textual embedding for th abstract. The absolute difference between and shows the euclidean distance between the th abstract and th cluster, represents the number of datapoints in cluster, and depicts the total number of clusters used. A datapoint is assigned to a particular cluster based on the following function.
| (8) |
Here is the assigned cluster ID of th document.
We decided to use K=10 clusters across different publication datasets. For our dataset, we used Elbow Method [47] to first find the optimal number of clusters, leading to the earlier mentioned choice.
III-C2 t-SNE
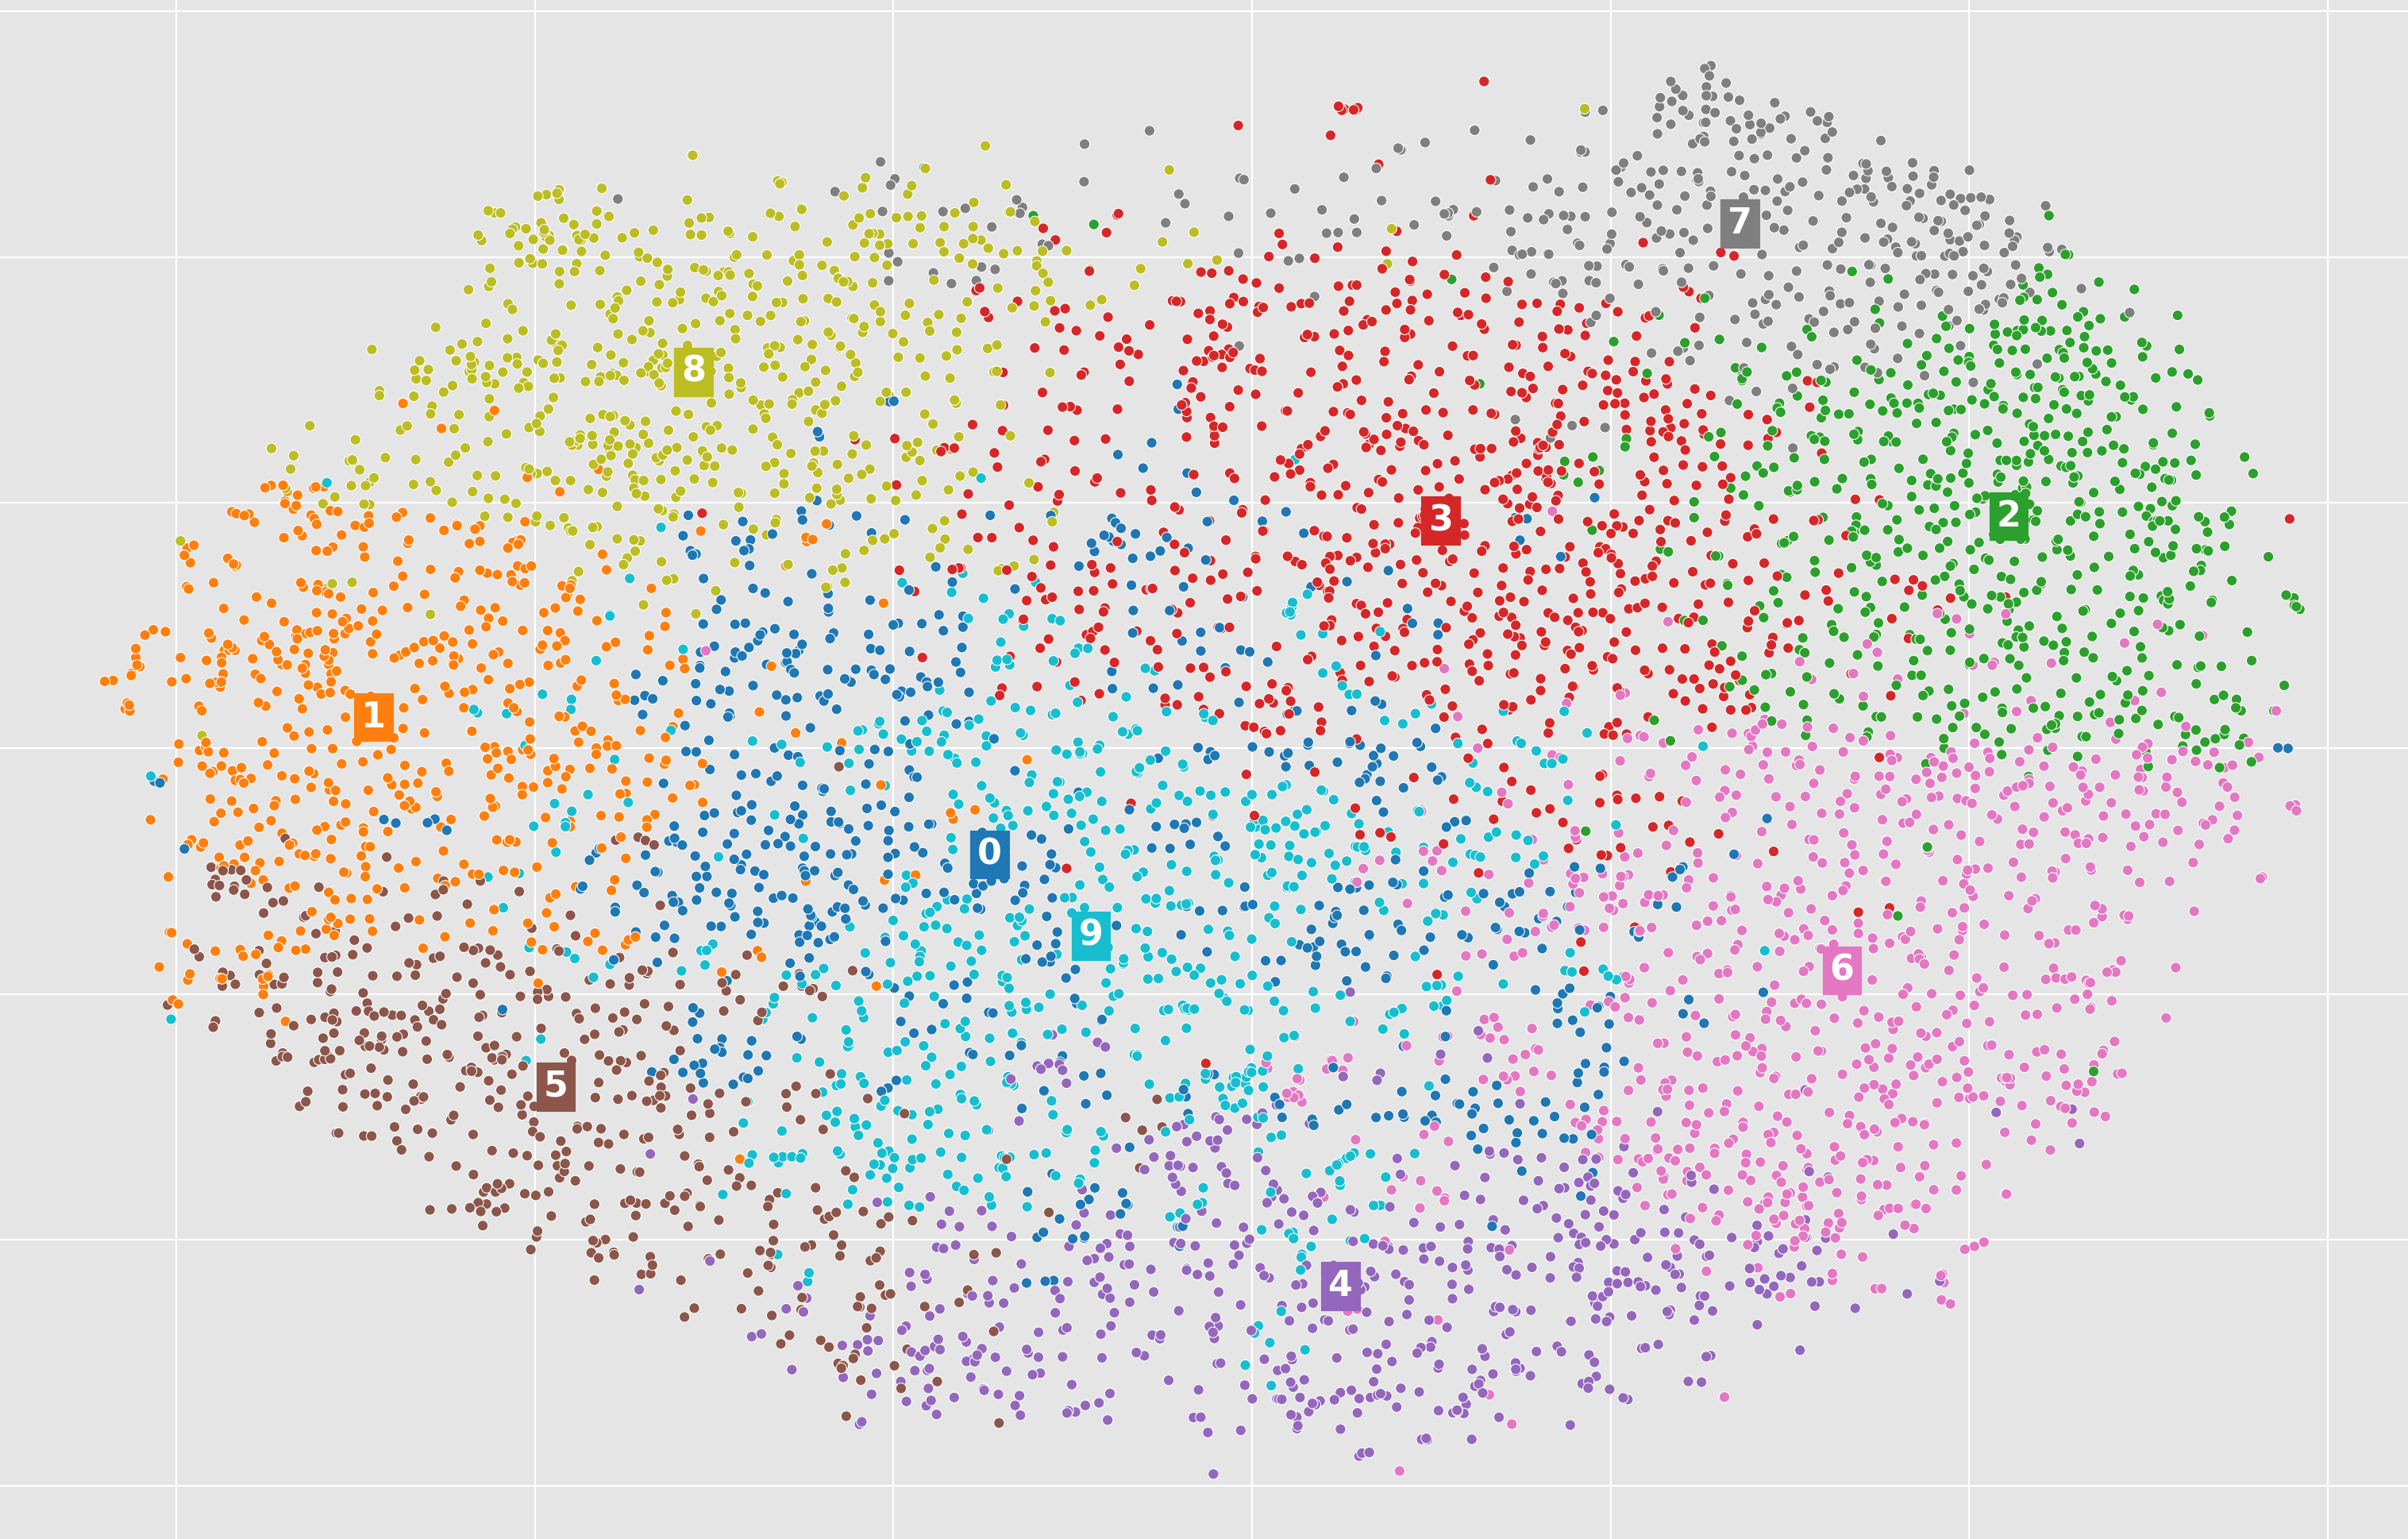
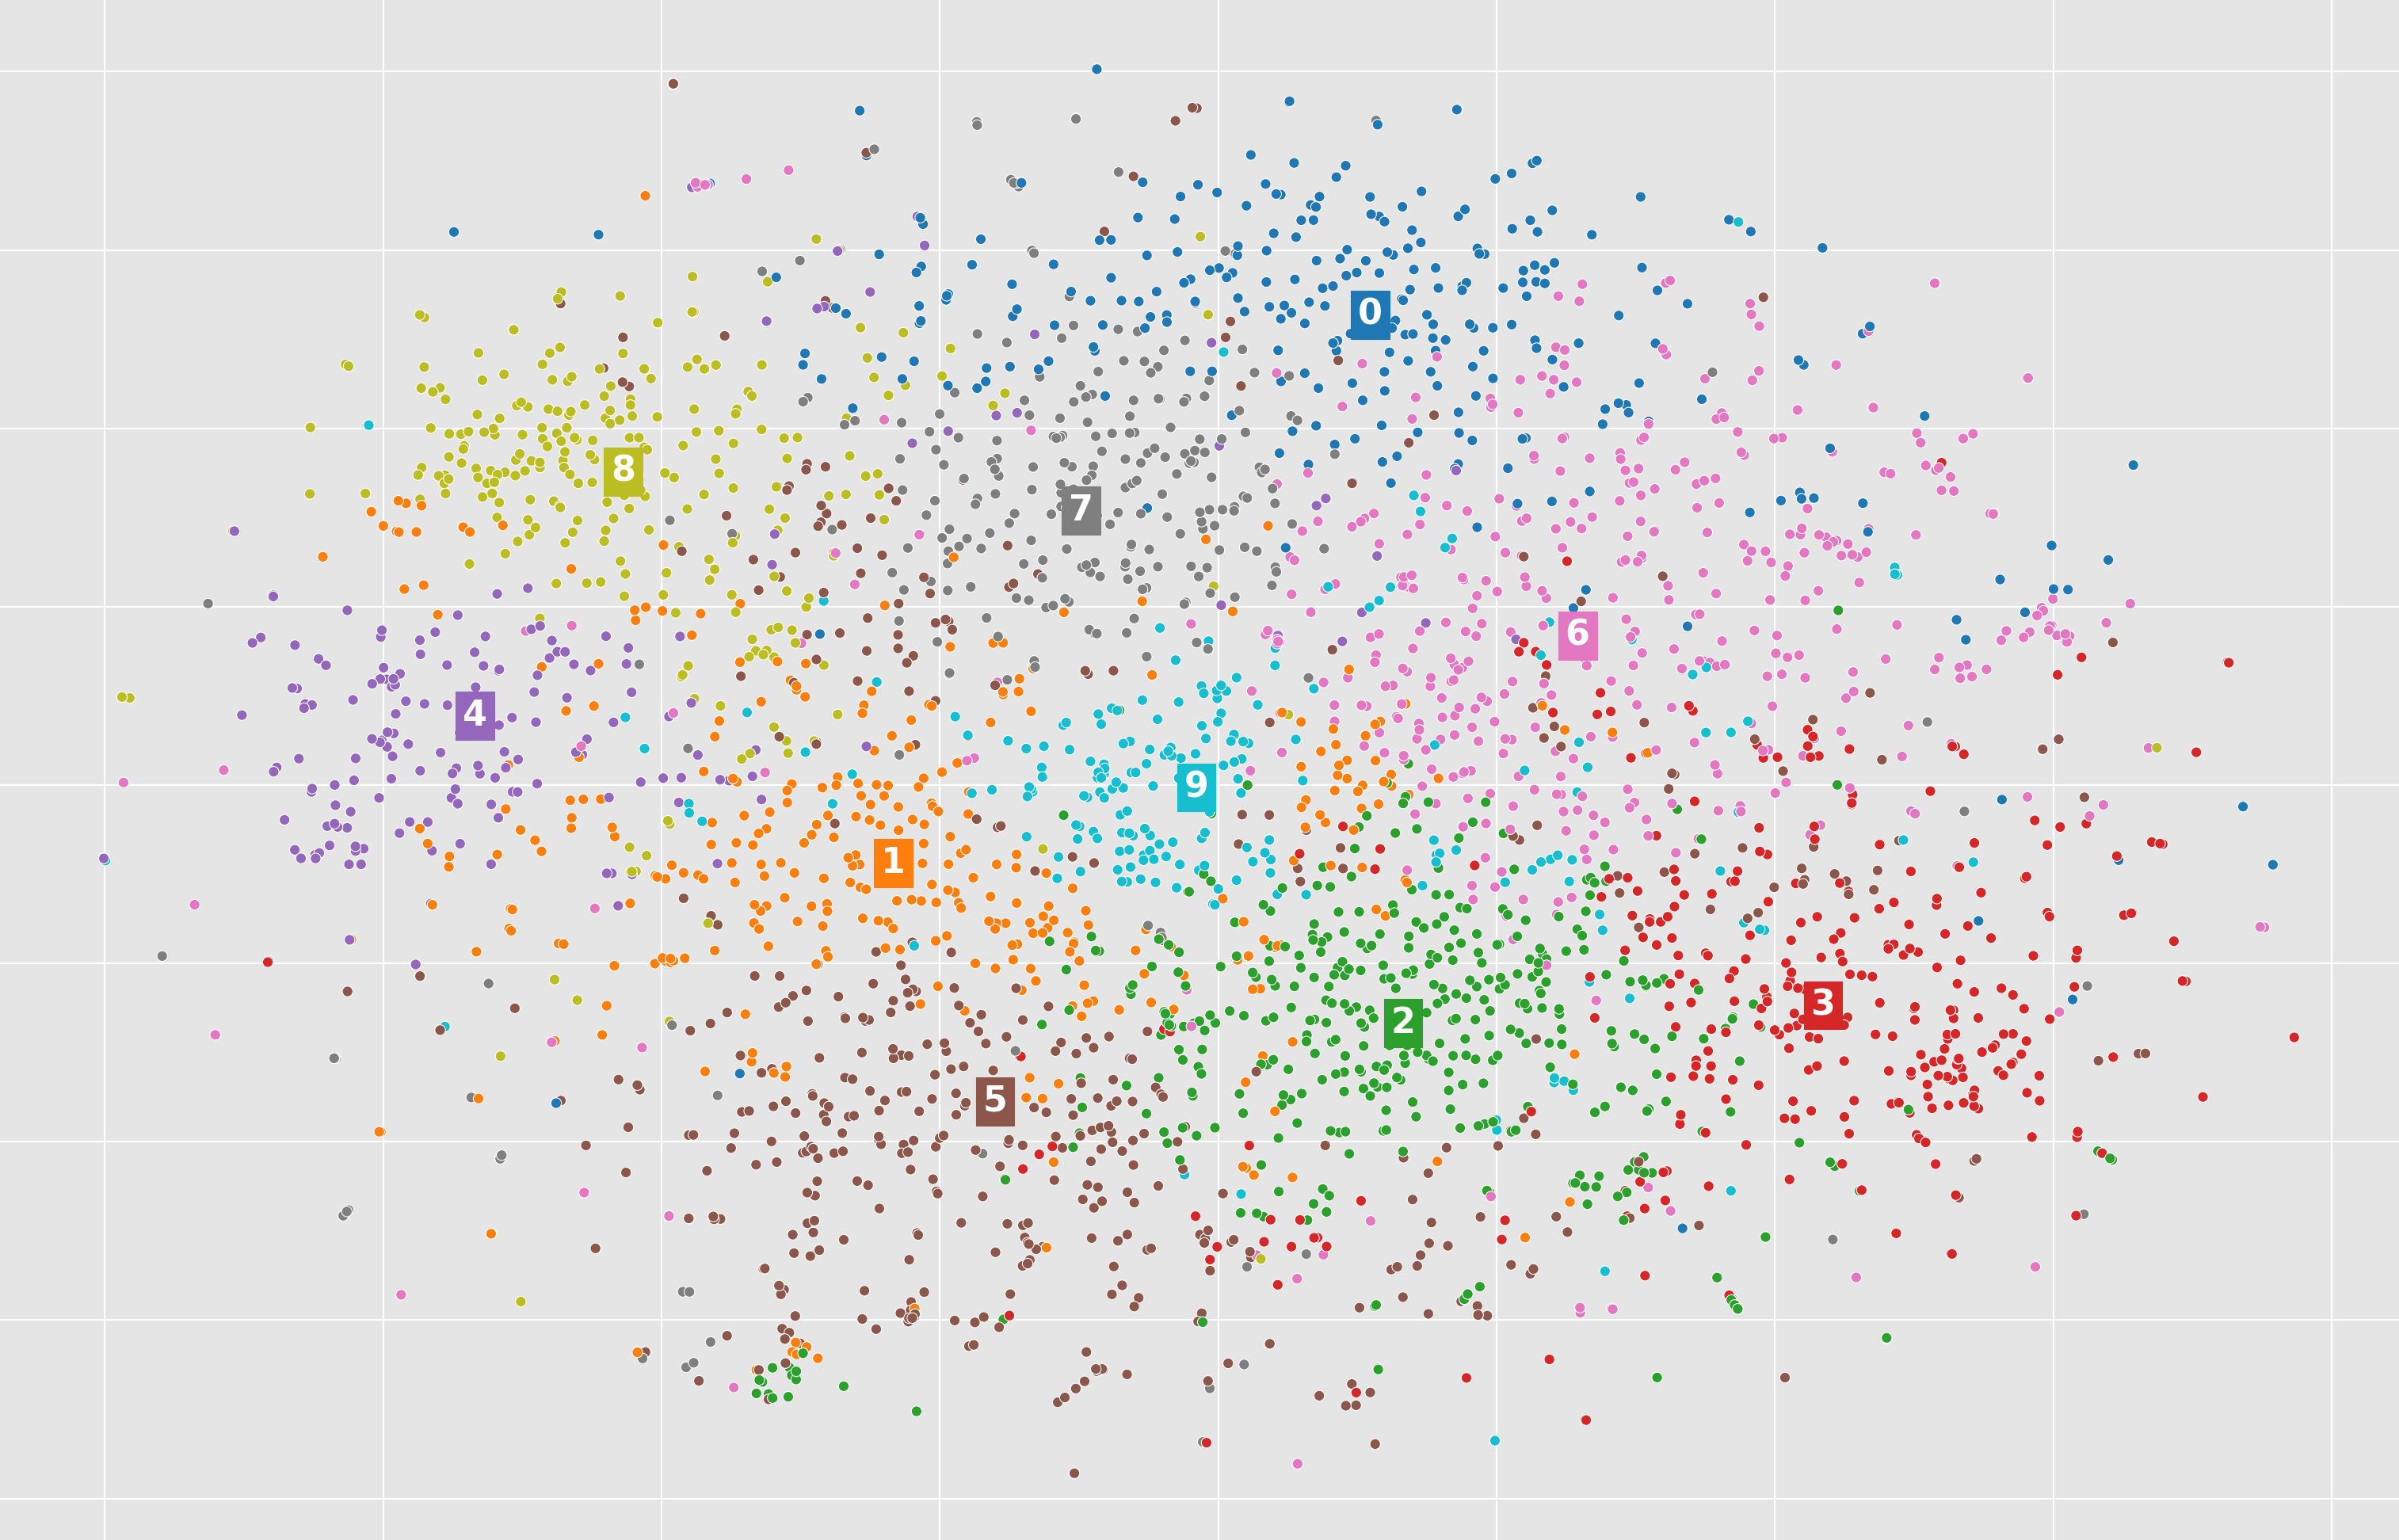
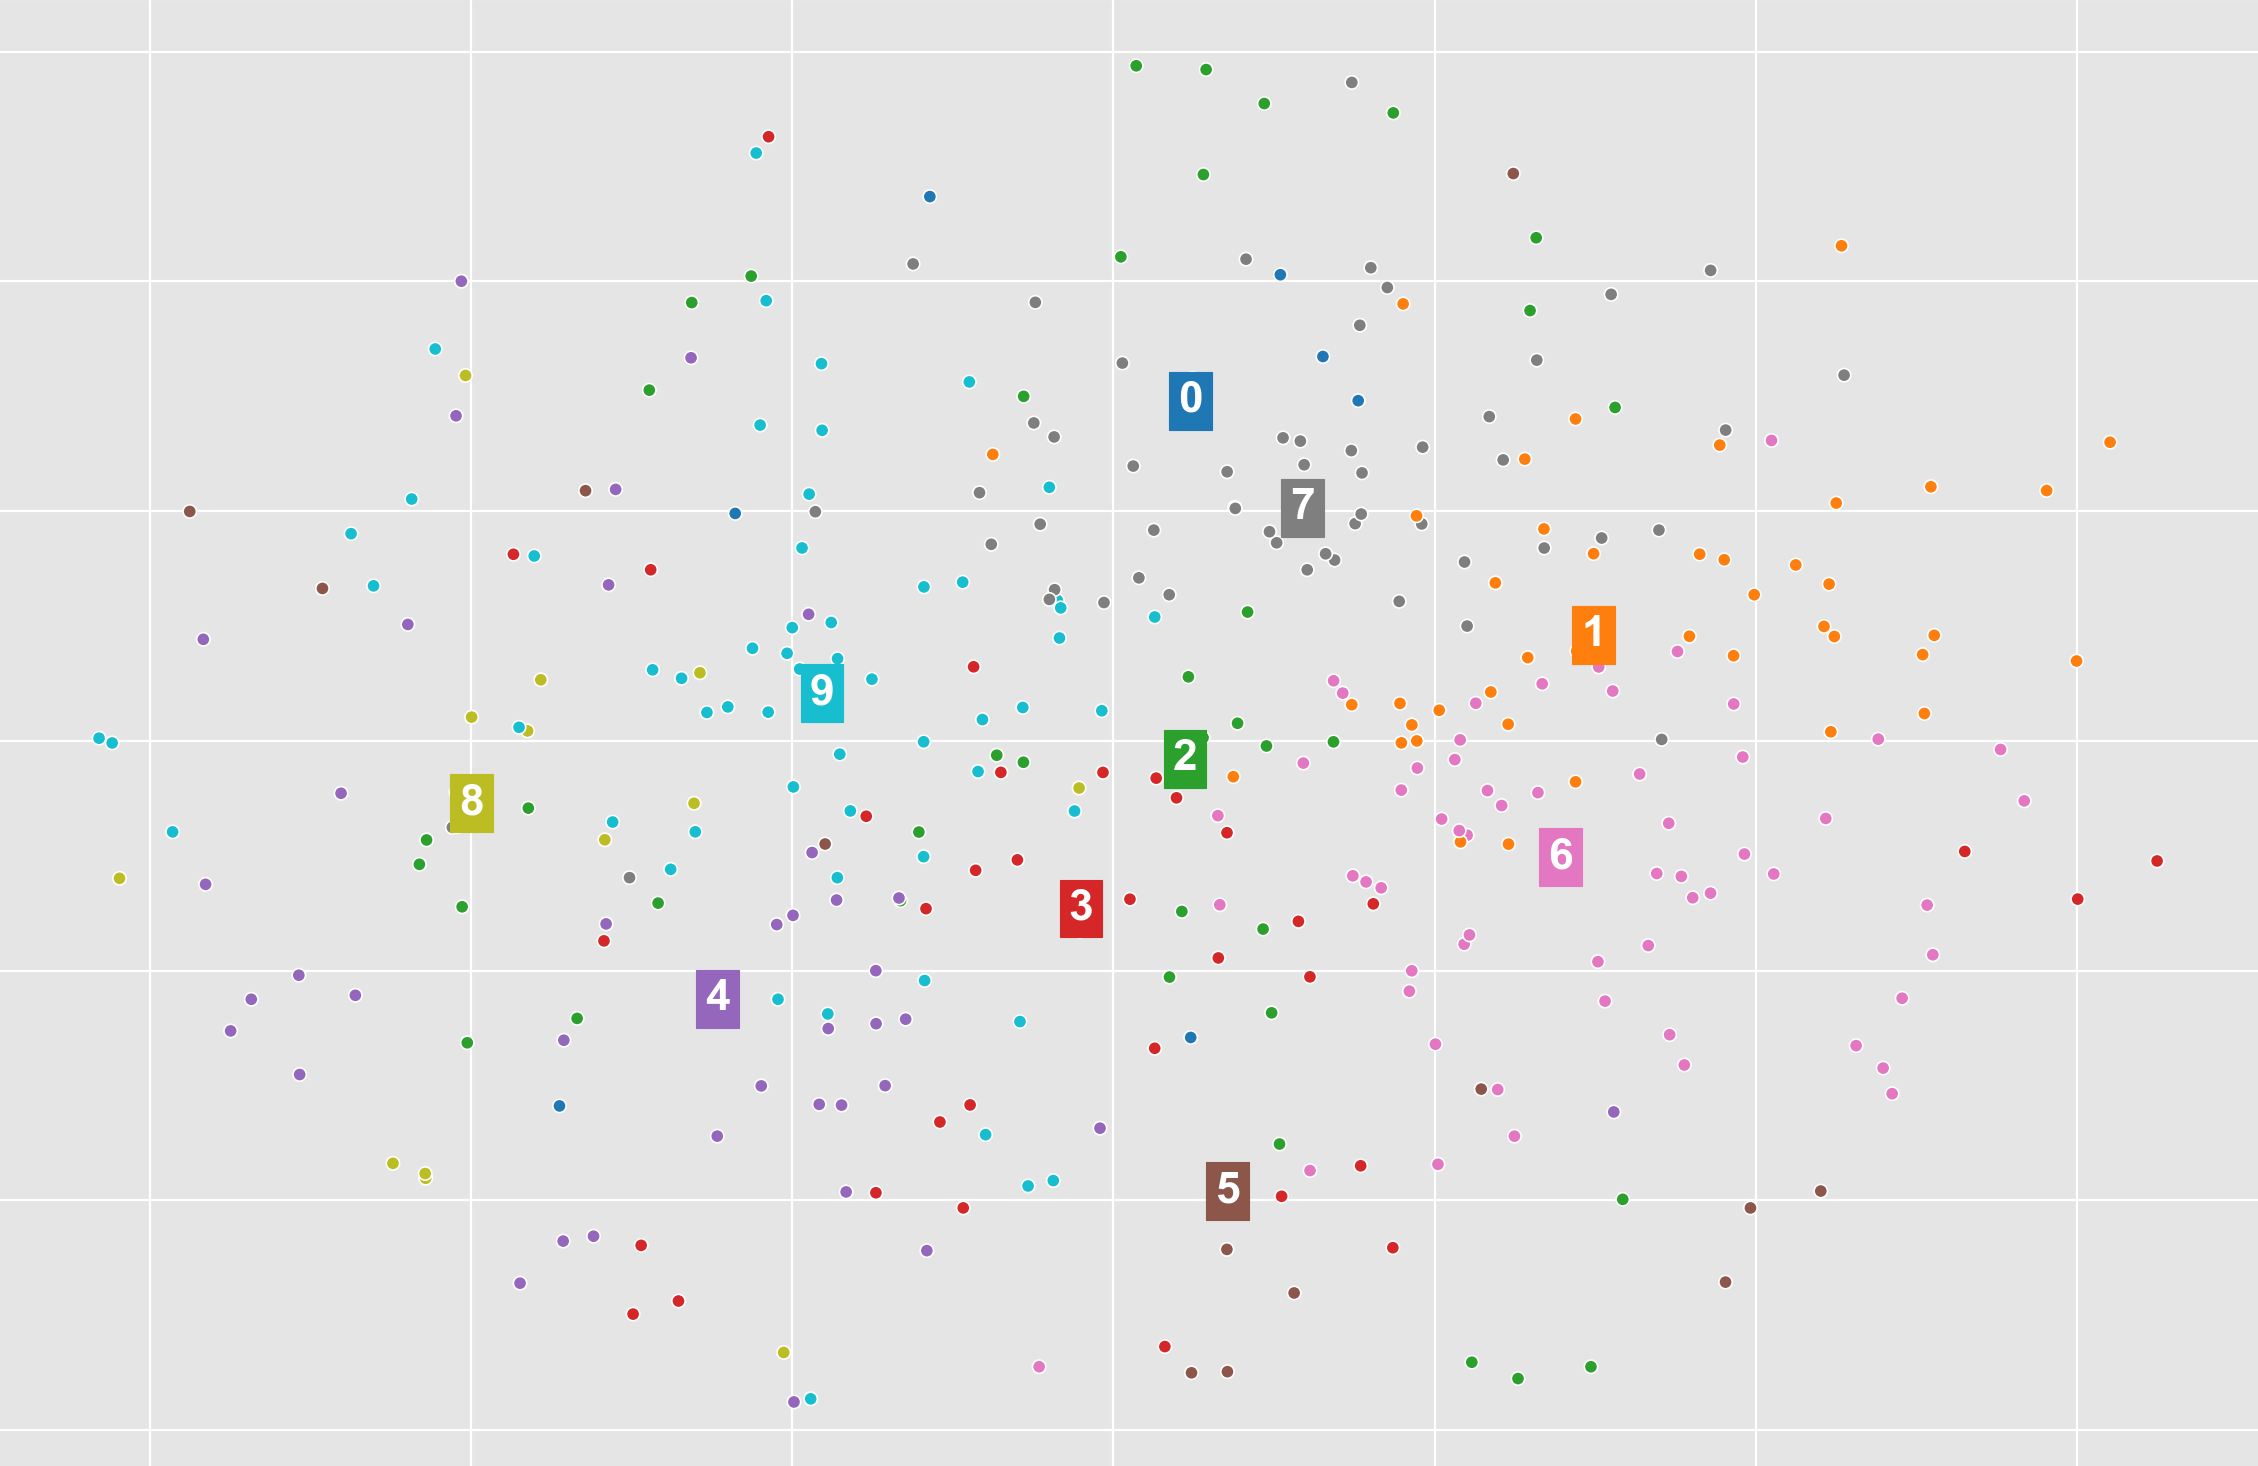
Based on [48], [46] developed t-distributed stochastic neighbor embedding (t-SNE) that is extremely useful to visualize high-dimensional data in lower dimensions, specifically the two-dimensional plane. Hence, it is an unsupervised non-linear machine learning technique that is also used as a dimensionality reduction method. The t-SNE creates probability distribution by finding pairwise similarity between the neighboring datapoints. This pairwise similarity is decided based on the conditional probability density between two nearby points as it will be high for the nearby points rather than the far-distanced points. It contains two important parameters: perplexity and early exaggeration. Perplexity is the total number of nearest neighbors of the center point impacting the variance of Gaussian distribution whereas early exaggeration controls the space between the clusters. For our experiments, we kept the perplexity as 100 and early exaggeration as the default value i.e. 12. Figure 2 shows the clusters visualizations graphs developed using t-SNE.
III-D Topic Modeling
After clustering documents in groups, we discovered the topics to understand what each cluster is representing. We found out 10 topics for each cluster using the technique, LDA (Latent Dirichlet Allocation) [49]. LDA is one of the widely used topic modeling approaches where it assumes that each document is a mixture of k different topic and each th topic has its inherent word probability distribution. Hence the objective of the LDA algorithm is to find these k topics and their word probability distribution. More concretely, let us assume that there are abstracts, words, topics, and words an abstract. The goal of LDA is to calculate the joint posterior probability as stated in the following equation:
| (9) |
Here is a distribution of topics, one for each document. is a distribution of topics, one for each word. is a distribution of words, one for each topic. is the parameter vector for each document, is the parameter vector for each topic and is the abstracts dataset.
IV Dataset
IV-A Publication Venues
We curate a dataset that represents the leading conferences and journals for the fields of Human-Computer Interaction and of Engineering Design, which are:
-
•
CHI. The ACM Conference on Human Factors in Computing (CHI) is one of the premier conferences for HCI research community. The conference deals with various topics like ubiquitous computing, visualization, usability, and user experience design in multiple tracks including long and short research papers, posters, workshops, and case studies.
-
•
TOCHI. The ACM Transactions on Computer-Human Interaction (TOCHI) is a scientific journal covers a wide variety of topics dealing with software and hardware aspects of HCI field. This incorporates architectures, evaluation techniques, interactive interfaces, and user design processes.
-
•
ICED. The International Conference on Engineering Design (ICED) is one of the main conferences for the engineering design research community. A wide range of topics are covered, creativity, AI and design, user-centered design, sustainable design, design-for-X, design theory, design methods and methodologies, human-behaviour in design, Industry 4.0, etc.
-
•
RIED. Research in Engineering Design (RIED) publishes papers on design theory and methodology in all fields of engineering, focusing on mechanical, civil, architectural, and manufacturing engineering. Topics covered include functional representation, feature-based design, shape grammars, process design, redesign, product data base models, and empirical studies.
The selection of a journal and a conference series from two different fields, allows us to compare the usefulness of our methodology between fields, and between publication type. Table I shows a summary description of our dataset, which we elaborate more on later.
| No. of | ||
| Venue | Year | Publications |
| CHI | 2007–2020 | 6,365 |
| TOCHI | 2007–2019 | 370 |
| RIED | 1995–2020 | 366 |
| ICED | 2003–2019 | 3,308 |
IV-B Dataset Collection Procedure
The Web of Science platform is used to fetch the data for CHI conference, TOCHI, and RIED journals. For CHI, publications from 2007 to 2020 were extracted, resulting in 6,365 data points. Similarly, the TOCHI dataset includes 370 data points, covering 2007 to 2019, while the RIED dataset contains 366 datapoints from 1995 to 2020 excluding 1996. The datasets include abstracts, titles, authors’ names, and keywords.
To get the ICED Conference dataset, we extracted the publication information and papers from the ICED Design Society website111https://iced.designsociety.org/group/7/Proceedings+of+ICED for the period 2003 to 2019. The total number of instances extracted is 3308. Due to the unavailability of some attributes on the website, the missing datapoints are manually extracted from the publications’ PDFs. The dataset comprises (i) Title, (ii) Year, (iii) Editor, (iv) Author, (v) Series, (vi) Institution, (vii) Section, (viii) DOI number/ISBN, (ix) ISSN, (x) Abstract, and (xi) Keywords. The data is assembled as a delimited text file using a comma to separate values.
V Experimental Results and Discussion
V-A Evaluation Metrics
V-A1 Topic Coherence
A set of statements or facts are said to be coherent if they support each other. As an example consider the statement ‘GloVe is a word embedding used for language modeling’. This statement is said to be coherent since the facts support each other. In literature, various topic coherence scores are used to quantify this semantic similarity. As explained in the section III-D, we apply LDA topic modeling to each cluster to identify research topics. For a single topic, a coherence score measures the degree of similarity between high-scoring words in the topic. There exist two types of coherence metrics, 1) Intrinsic and 2) Extrinsic methods. Intrinsic methods do not use any external task for measuring semantic similarity. In comparison to that, extrinsic methods apply the discovered topics in an external task such as information retrieval. However, we believe is that applying the topics generated for a corpus abundant with domain-specific words into an external task is not well suited. Therefore, we use the intrinsic UMass coherence score [50] for our evaluations. The following equation depicts the pairwise score function used to calculate the coherence score.
| (10) |
Let us assume that, represents the top-n words for each topic. Here, depicts the number of times the word appeared in the corpus and depicts the number of times and appeared together in the corpus. Here, the is selected to be more common word than .
Then the following score is averaged over all the topics and subsequently over all the clusters we generated.
V-A2 Mutual Information Scores
We applied 3 different types of word embeddings, which generated distinct clusters. The mutual information (MI) measures the similarity between two labels of the same data as follows:
| (11) |
Here and are two different clusters, and are the number of cluster labels in cluster and respectively. is the number of samples in the cluster and is the number of samples in the cluster
Furthermore, we also calculate two other MI related metrics called, 1) Normalized mutual information score (NMI) and 2) Adjusted mutual information score (AMI). NMI score scales the MI score to be between 0 and 1. AMI is another adjustment of MI score for chance. It is calculated as following:
| (12) | |||
| (13) | |||
| (14) |
| Publication Dataset | TF-IDF | GloVe | PUB-G | PUB-W |
|---|---|---|---|---|
| CHI | -1.7120 | -1.5677 | -1.5759 | -1.5200 |
| ICED | -1.8409 | -1.5300 | -1.6537 | -1.5453 |
| TOCHI | -6.2586 | -6.6287 | -5.5893 | -5.8207 |
| RIED | -4.1561 | -4.0050 | -3.6394 | -3.7642 |
V-B Comparing the Coherence score against various embeddings
As explained in the subsection III-D, we applied LDA topic modeling to identify 10 topics in each cluster separately. Then the average u_mass coherence score over the clusters for various text embeddings was computed. Table II summarizes these values representing TF-IDF as the baseline, GloVe as the pre-trained, and PUB-G and PUB-W as the proposed embeddings. Based on these, we make the following key observations:
| Dataset | M.I. Score | Adjusted M.I. Score | Normalized M.I. Score |
|---|---|---|---|
| CHI | 0.4608 | 0.2207 | 0.2231 |
| ICED | 0.5670 | 0.2648 | 0.2692 |
| TOCHI | 0.4450 | 0.1654 | 0.2117 |
| RIED | 0.6882 | 0.2852 | 0.3246 |
| Dataset | M.I. Score | Adjusted M.I. Score | Normalized M.I. Score |
|---|---|---|---|
| CHI | 0.6274 | 0.2734 | 0.2754 |
| ICED | 0.9640 | 0.4222 | 0.4254 |
| TOCHI | 0.8318 | 0.3520 | 0.3872 |
| RIED | 0.8371 | 0.3527 | 0.3877 |
| Dataset | M.I. Score | Adjusted M.I. Score | Normalized M.I. Score |
|---|---|---|---|
| CHI | 0.6622 | 0.3185 | 0.3206 |
| ICED | 0.5084 | 0.2368 | 0.2414 |
| TOCHI | 0.4735 | 0.1697 | 0.2160 |
| RIED | 0.7293 | 0.2948 | 0.3348 |
-
1.
Our proposed PUB-G and PUB-W embeddings generates the best coherence score for all the publication datasets in comparison to all other embeddings. For CHI and ICED, PUB-W works the best whereas for TOCHI and RIED, PUB-G works well. PUB-G seems to generalize better in the cases of limited data points in comparison to PUB-W.
-
2.
Across all the datasets, TF-IDF performance is lower than both of the proposed, PUB-G and PUB-W embeddings. We believe that TF-IDF is not able to model the semantic meaning of the text.
-
3.
GloVe performs marginally better than PUB-G for ICED and CHI. However, GloVe’s performance is still lower than our proposed embedding, PUB-W.
Based on the key observations, we can notice that the already existing pre-trained textual embeddings are incapable of capturing the semantic meaning of textual data in a scientific domain.
V-C Comparing the MI scores between TFIDF, PUB-G, and PUB-W
Different embeddings generated different clusters based on the inherent semantic similarity among words. In order to analyze the degree of similarity among these clusters, we compute the MI scores among these three embeddings. Tables III, IV, and V shows the MI score between 1) TF-IDF and PUB-G, 2) PUB-G and PUB-W, and 3) PUB-W and TF-IDF. Based on these findings, we find that MI scores between PUB-W and PUB-G is higher in comparison to PUB-G and TF-IDF. This indicates that TF-IDF generates different clusters in comparison to the other two.
V-D Qualitative Analysis of clusters
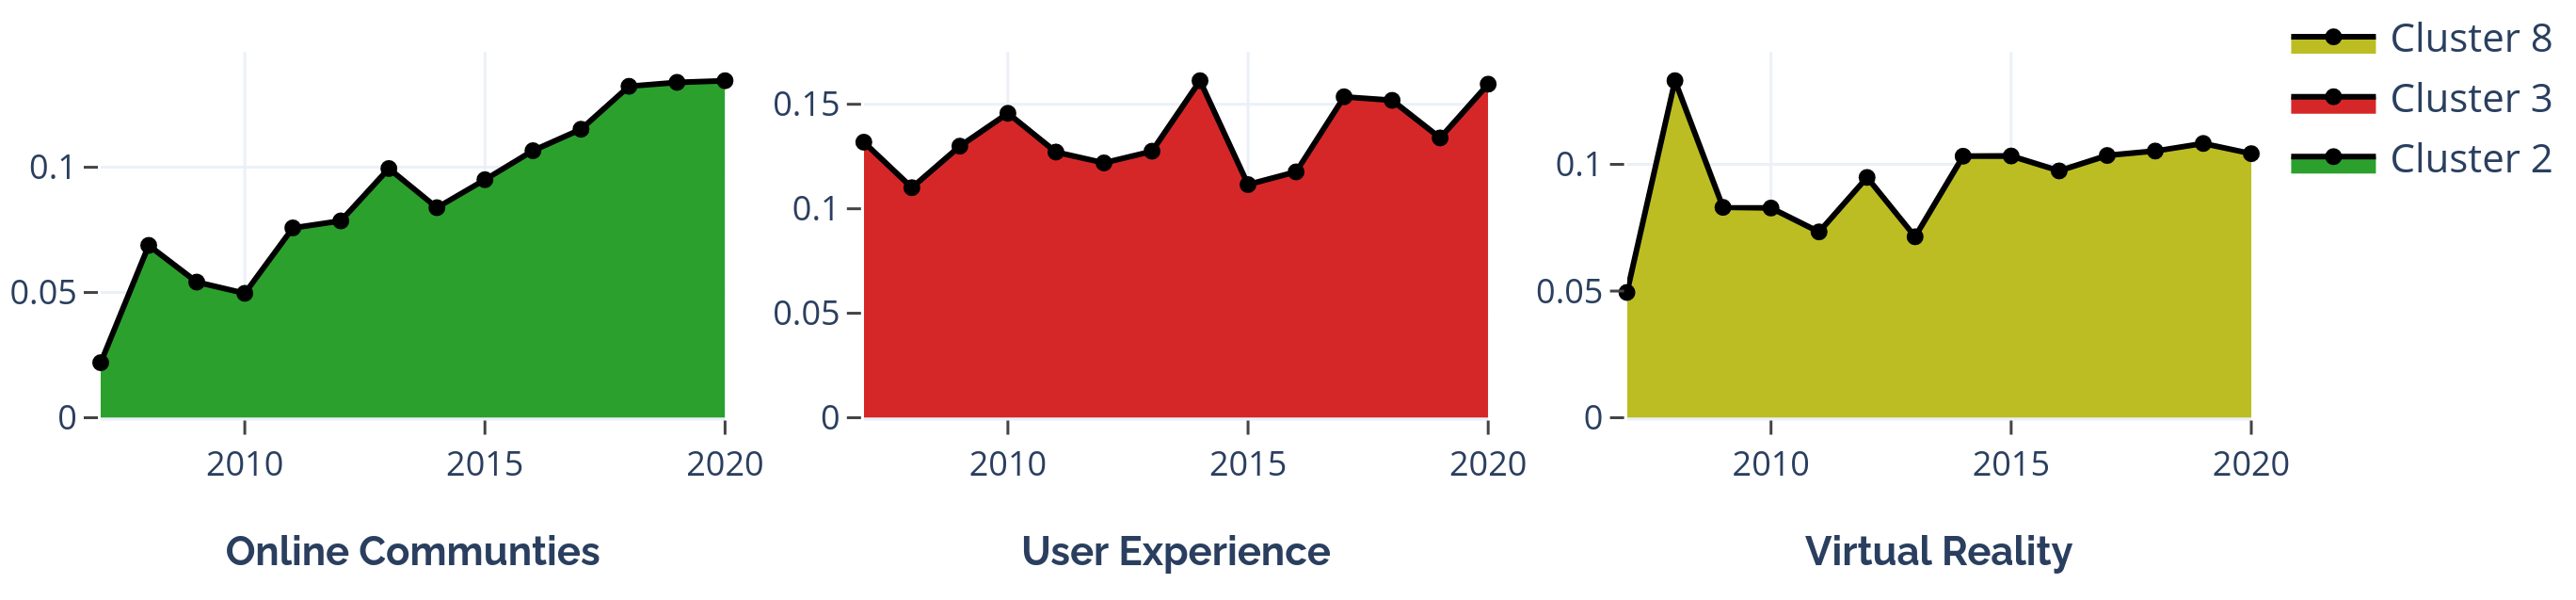
We demonstrate the qualitative analysis of the clusters detected by discussing a case study for the CHI publications. Upon applying the k-means clustering to all the documents and further applying topic modeling on the 10 clusters, we found 3 clusters out of 10 have shown some spikes, decrements, and steadiness from the year 2007 to 2020.
From the time-series graph in Figure 3, it can be noticed that cluster 8 has shown a decrease which somewhat validates the fact as to when the first VR technologies came into existence, it had a sudden spike in interest in the research community but gradually decreased over the years and might decrease further due to COVID-19. On similar grounds, cluster 2 has shown a spike which can also be validated as data analysis of online communities, groups, forums have increased especially in terms of behavioral analysis, opinion mining, sentiment analysis, etc. Cluster 3, which mostly includes research on User Experience, appears to be having a steady but higher interest in the CHI community over the years. This may also be validated given that the theme of CHI research is focused on developing human-computer interactive technologies.
VI Conclusion
In this paper, we present a framework to facilitate the scientific analyses of academic publications, which is important for monitoring the growth of a particular research field and identifying potential innovations. Our framework adopts and combines data collection, word embedding, topic modelling and temporal trend analysis. Many word embedding are trained on general text articles which may not be able to capture the features relevant to domain-specific texts found in scientific publications. To solve this problem, we curated a publication dataset consisting of two conferences and two journals from 1995 to 2020 in two research disciplines. Using this dataset, we propose two scientific publication embedding, i.e., PUB-G and PUB-W, which are capable of learning semantic meanings of general as well as domain-specific words in various research fields. Experimental results show that our PUB-G and PUB-W embeddings out-perform other baseline embeddings based on topic coherence.
VII Acknowledgements
This research is funded in part by the Singapore University of Technology and Design under grant SRG-ISTD-2018-140. The authors thank the anonymous reviewers for their useful comments.
References
- [1] L. Guenther and M. Joubert, “Science communication as a field of research: identifying trends, challenges and gaps by analysing research papers,” Journal of Science Communication, vol. 16, no. 2, p. A02, 2017.
- [2] R. Preiser, “Identifying general trends and patterns in complex systems research: An overview of theoretical and practical implications,” Systems Research and Behavioral Science, vol. 36, no. 5, pp. 706–714, 2019.
- [3] E. Mohammadi and A. Karami, “Exploring research trends in big data across disciplines: A text mining analysis,” Journal of Information Science, p. 0165551520932855, 2020.
- [4] Scikit-learn.org, “sklearn.feature_extraction.text.countvectorizer — scikit-learn 0.24.1 documentation.” [Online]. Available: https://scikit-learn.org/stable/modules/generated/sklearn.feature_extraction.text.CountVectorizer.html
- [5] Scikit-learn.org, “sklearn.feature_extraction.text.tfidfvectorizer — scikit-learn 0.24.1 documentation.” [Online]. Available: https://scikit-learn.org/stable/modules/generated/sklearn.feature_extraction.text.TfidfVectorizer.html
- [6] T. Mikolov, K. Chen, G. Corrado, and J. Dean, “Efficient estimation of word representations in vector space,” arXiv preprint arXiv:1301.3781, 2013.
- [7] J. Pennington, R. Socher, and C. D. Manning, “Glove: Global vectors for word representation,” in Proceedings of the 2014 conference on empirical methods in natural language processing (EMNLP), 2014, pp. 1532–1543.
- [8] M. E. Peters, M. Neumann, M. Iyyer, M. Gardner, C. Clark, K. Lee, and L. Zettlemoyer, “Deep contextualized word representations,” arXiv preprint arXiv:1802.05365, 2018.
- [9] D. Bahdanau, K. Cho, and Y. Bengio, “Neural machine translation by jointly learning to align and translate,” arXiv preprint arXiv:1409.0473, 2014.
- [10] K. Takahashi, K. Sudoh, and S. Nakamura, “Automatic machine translation evaluation using source language inputs and cross-lingual language model,” in Proceedings of the 58th Annual Meeting of the Association for Computational Linguistics, 2020, pp. 3553–3558.
- [11] N. Arivazhagan, C. Cherry, W. Macherey, and G. Foster, “Re-translation versus streaming for simultaneous translation,” in Proceedings of the 17th International Conference on Spoken Language Translation, 2020, pp. 220–227.
- [12] R. K. Bakshi, N. Kaur, R. Kaur, and G. Kaur, “Opinion mining and sentiment analysis,” in 2016 3rd International Conference on Computing for Sustainable Global Development (INDIACom). IEEE, 2016, pp. 452–455.
- [13] P. Ke, H. Ji, S. Liu, X. Zhu, and M. Huang, “Sentilare: Linguistic knowledge enhanced language representation for sentiment analysis,” in Proceedings of the 2020 Conference on Empirical Methods in Natural Language Processing (EMNLP), 2020, pp. 6975–6988.
- [14] M. E. Basiri, S. Nemati, M. Abdar, E. Cambria, and U. R. Acharya, “Abcdm: An attention-based bidirectional cnn-rnn deep model for sentiment analysis,” Future Generation Computer Systems, vol. 115, pp. 279–294, 2021.
- [15] G. A. Bowen et al., “Document analysis as a qualitative research method,” Qualitative research journal, vol. 9, no. 2, p. 27, 2009.
- [16] O. Mendsaikhan, H. Hasegawa, Y. Yamaguchi, and H. Shimada, “Identification of cybersecurity specific content using the doc2vec language model,” in 2019 IEEE 43rd annual computer software and applications conference (COMPSAC), vol. 1. IEEE, 2019, pp. 396–401.
- [17] J. Liu, T. Singhal, L. T. Blessing, K. L. Wood, and K. H. Lim, “EPIC30M: An Epidemics Corpus of Over 30 Million Relevant Tweets,” in Proceedings of the 2020 IEEE International Conference on Big Data (BigData’20), 2020, pp. 1206–1215.
- [18] J. Liu, T. Singhal, L. T. Blessing, K. L. Wood, and K. H. Lim, “CrisisBERT: A Robust Transformer for Crisis Classification and Contextual Crisis Embedding,” in Proceedings of the 32nd ACM Conference on Hypertext and Social Media (HT’21), 2021, pp. 133–141.
- [19] Y. George, S. Karunasekera, A. Harwood, and K. H. Lim, “Real-time Spatio-temporal Event Detection on Geotagged Social Media,” Journal of Big Data, vol. 8, no. 91, pp. 1–28, Jun 2021.
- [20] S. Mao, A. Rosenfeld, and T. Kanungo, “Document structure analysis algorithms: a literature survey,” in Document Recognition and Retrieval X, vol. 5010. International Society for Optics and Photonics, 2003, pp. 197–207.
- [21] I. G. Councill, C. L. Giles, and M.-Y. Kan, “Parscit: an open-source crf reference string parsing package.” in LREC, vol. 8, 2008, pp. 661–667.
- [22] P. Lopez, “Grobid: Combining automatic bibliographic data recognition and term extraction for scholarship publications,” in International conference on theory and practice of digital libraries. Springer, 2009, pp. 473–474.
- [23] D. Tkaczyk, P. Szostek, P. J. Dendek, M. Fedoryszak, and L. Bolikowski, “Cermine–automatic extraction of metadata and references from scientific literature,” in 2014 11th IAPR International Workshop on Document Analysis Systems. IEEE, 2014, pp. 217–221.
- [24] M. Singh, B. Barua, P. Palod, M. Garg, S. Satapathy, S. Bushi, K. Ayush, K. S. Rohith, T. Gamidi, P. Goyal et al., “Ocr++: a robust framework for information extraction from scholarly articles,” arXiv preprint arXiv:1609.06423, 2016.
- [25] A. Takasu, “Bibliographic attribute extraction from erroneous references based on a statistical model,” in 2003 Joint Conference on Digital Libraries, 2003. Proceedings. IEEE, 2003, pp. 49–60.
- [26] H. Han, C. L. Giles, E. Manavoglu, H. Zha, Z. Zhang, and E. A. Fox, “Automatic document metadata extraction using support vector machines,” in 2003 Joint Conference on Digital Libraries, 2003. Proceedings. IEEE, 2003, pp. 37–48.
- [27] F. Chiarello, A. Cimino, G. Fantoni, and F. Dell’Orletta, “Automatic users extraction from patents,” World Patent Information, vol. 54, pp. 28–38, 2018.
- [28] C. G. Stahl, S. R. Young, D. Herrmannova, R. M. Patton, and J. C. Wells, “Deeppdf: A deep learning approach to extracting text from pdfs,” Oak Ridge National Lab.(ORNL), Oak Ridge, TN (United States), Tech. Rep., 2018.
- [29] X. Yang, E. Yumer, P. Asente, M. Kraley, D. Kifer, and C. Lee Giles, “Learning to extract semantic structure from documents using multimodal fully convolutional neural networks,” in Proceedings of the IEEE Conference on Computer Vision and Pattern Recognition, 2017, pp. 5315–5324.
- [30] C. A. Clark and S. Divvala, “Looking beyond text: Extracting figures, tables and captions from computer science papers,” in Workshops at the Twenty-Ninth AAAI Conference on Artificial Intelligence, 2015.
- [31] C. Clark and S. Divvala, “Pdffigures 2.0: Mining figures from research papers,” in 2016 IEEE/ACM Joint Conference on Digital Libraries (JCDL). IEEE, 2016, pp. 143–152.
- [32] C. Ordun, S. Purushotham, and E. Raff, “Exploratory analysis of covid-19 tweets using topic modeling, umap, and digraphs,” arXiv preprint arXiv:2005.03082, 2020.
- [33] J. S.-L. Kwan and K. H. Lim, “TweetCOVID: A System for Analyzing Public Sentiments and Discussions about COVID-19 via Twitter Activities,” in Proceedings of the 26th International Conference on Intelligent User Interfaces Companion (IUI’21), Apr 2021, pp. 58–60.
- [34] J. S.-L. Kwan and K. H. Lim, “Understanding Public Sentiments, Opinions and Topics about COVID-19 using Twitter,” in Proceedings of the 2020 IEEE/ACM International Conference on Advances in Social Networks Analysis and Mining (ASONAM’20), Dec 2020, pp. 623–626.
- [35] C. Schöch, “Topic modeling genre: An exploration of french classical and enlightenment drama.” DHQ: Digital Humanities Quarterly, vol. 11, no. 2, 2017.
- [36] F. Chiarello, N. Melluso, A. Bonaccorsi, and G. Fantoni, “A text mining based map of engineering design: Topics and their trajectories over time,” in Proceedings of the Design Society: International Conference on Engineering Design, vol. 1, no. 1. Cambridge University Press, 2019, pp. 2765–2774.
- [37] Y. N. Pek and K. H. Lim, “Identifying and Understanding Business Trends using Topic Models with Word Embedding,” in Proceedings of the 2019 IEEE International Conference on Big Data (BigData’19), Dec 2019, pp. 6177–6179.
- [38] Q. Yang, N. Banovic, and J. Zimmerman, “Mapping machine learning advances from hci research to reveal starting places for design innovation,” in Proceedings of the 2018 CHI Conference on Human Factors in Computing Systems, 2018, pp. 1–11.
- [39] M. Carter, J. Downs, B. Nansen, M. Harrop, and M. Gibbs, “Paradigms of games research in hci: a review of 10 years of research at chi,” in Proceedings of the first ACM SIGCHI annual symposium on Computer-human interaction in play, 2014, pp. 27–36.
- [40] A. C. Valdez and M. Ziefle, “Trends and changes in the field of hci the last decade from the perspective of hcii conference,” in International Conference on Human-Computer Interaction. Springer, 2019, pp. 31–45.
- [41] Y. Li and T. Yang, “Word embedding for understanding natural language: a survey,” in Guide to big data applications. Springer, 2018, pp. 83–104.
- [42] F. Almeida and G. Xexéo, “Word embeddings: A survey,” arXiv preprint arXiv:1901.09069, 2019.
- [43] J. Devlin, M.-W. Chang, K. Lee, and K. Toutanova, “Bert: Pre-training of deep bidirectional transformers for language understanding,” arXiv preprint arXiv:1810.04805, 2018.
- [44] G. Salton and C. Buckley, “Term-weighting approaches in automatic text retrieval,” Information processing & management, vol. 24, no. 5, pp. 513–523, 1988.
- [45] J. MacQueen et al., “Some methods for classification and analysis of multivariate observations,” in Proceedings of the fifth Berkeley symposium on mathematical statistics and probability, vol. 1, no. 14. Oakland, CA, USA, 1967, pp. 281–297.
- [46] L. v. d. Maaten and G. Hinton, “Visualizing data using t-sne,” Journal of machine learning research, vol. 9, no. Nov, pp. 2579–2605, 2008.
- [47] C. Yuan and H. Yang, “Research on k-value selection method of k-means clustering algorithm,” J—Multidisciplinary Scientific Journal, vol. 2, no. 2, pp. 226–235, 2019.
- [48] G. E. Hinton and S. Roweis, “Stochastic neighbor embedding,” Advances in neural information processing systems, vol. 15, pp. 857–864, 2002.
- [49] D. M. Blei, A. Y. Ng, and M. I. Jordan, “Latent dirichlet allocation,” Journal of machine Learning research, vol. 3, no. Jan, pp. 993–1022, 2003.
- [50] D. Mimno, H. Wallach, E. Talley, M. Leenders, and A. McCallum, “Optimizing semantic coherence in topic models,” in Proceedings of the 2011 conference on empirical methods in natural language processing, 2011, pp. 262–272.